Embed Size (px)
Citation preview

1
THE CHANGING NATURE OF U.S. CARD PAYMENT FRAUD: ISSUES FOR INDUSTRY AND PUBLIC POLICY
Richard J. Sullivan
Federal Reserve Bank of Kansas City*
May 21, 2010
For presentation at the 2010
Workshop on the Economics of Information Security Harvard University
Abstract: The rapid transition to card payments has sparked a search for effective countermeasures to those who exploit card payment security vulnerabilities to commit payment fraud. A review of these vulnerabilities finds that they are tied together by an information-intensive payment approval system. Especially damaging are large data breaches, which are often the result of criminals gathering information useful to committing payment fraud. Criminals particularly target nonbank payment processors, retailers, and government entities. Although traditional forms of payment fraud remain important, a complex and developing chain from data breach to payment fraud is developing. Preliminary estimates of card payment fraud losses in the United States show that the fraud loss rate for the U.S. appears to be higher than that of Australia, France, Spain and the UK. Several industry initiatives may help to protect payment card information, but because lack of good data on the extent and characteristics of payments fraud makes it difficult to develop effective industry strategies and policy responses. Policymakers should monitor the card payment industry to see if it better coordinates security efforts, and if not, consider actions to help the industry overcome barriers to effective development of security. * 1 Memorial Drive, Kansas City, MO 64198. Email: [email protected] The views expressed in this paper are those of the author, and do not necessarily reflect the views of the Federal Reserve Bank of Kansas City, or the Federal Reserve System. I thank the referees of the WEIS 2010 conference for many useful comments.
1
INTRODUCTION
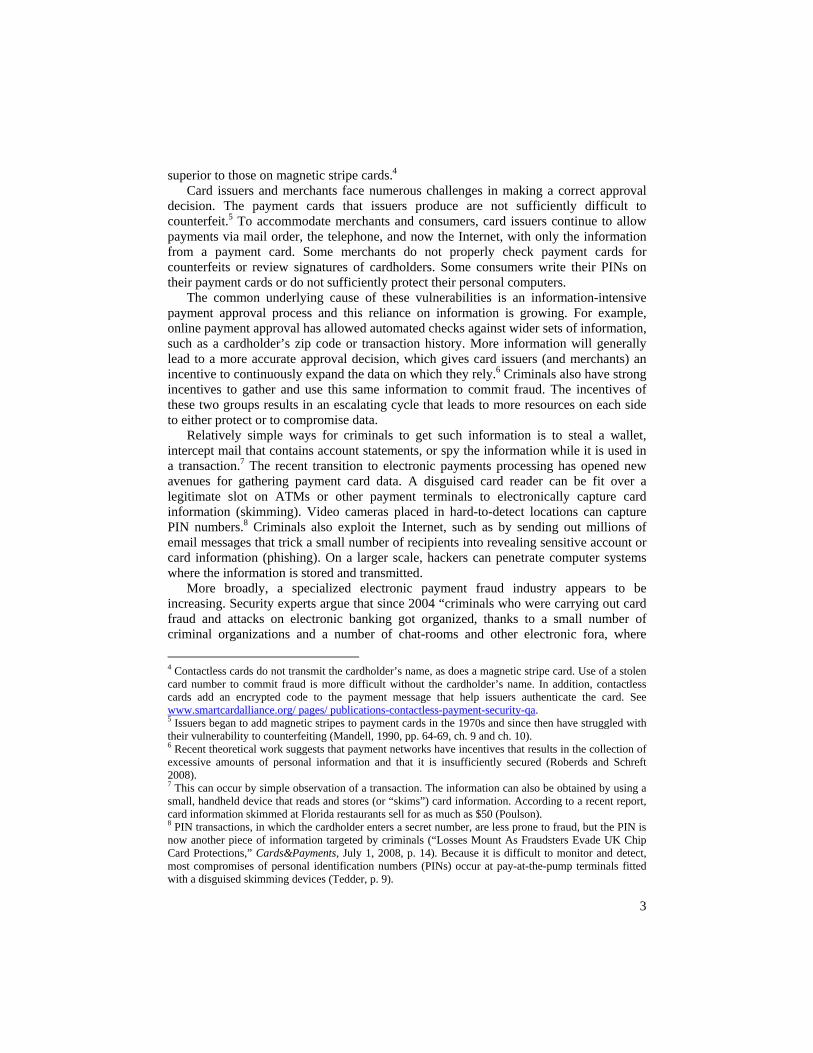
Debit and credit card payments are convenient for consumers, widely accepted by merchants, and more efficient than paper forms of payments. But as cards have become the primary payment instrument in retail transactions, awareness of identity theft and concerns over the safety of payments has increased. For example, a recent data breach at Heartland Payment Systems exposed 130 million records of payment cards―the largest in a succession of security failures that have exposed growing numbers of payment records.
Like all forms of payment, cards have security vulnerabilities. Traditional forms of card payment fraud are still an important threat, but fraud resulting from unauthorized access to payments data appears to be rising. Payment providers are exploring options to protect sensitive data, such as the recently implemented payment card industry data security standard. But the damage from payments fraud is already high compared to that in several other countries, and we are only beginning to get a sense of the dimensions of the problem.
As the central bank of the United States, the Federal Reserve has responsibility to ensure that payments are safe, efficient, and accessible. Confidence in the safety of payments is particularly important. Thus far, the role of public policy has been to encourage the card payment industry to develop its own standards and procedures that limit fraud. Whether this policy stance is sufficient depends on the effectiveness of industry efforts to limit fraud in light of the dramatic shift towards card payments.
This article provides an overview of card payment fraud in the United States. The process for approving card payments depends to a large extent on information. Thus, criminals have a strong incentive to steal that information, leading to attacks on computer systems, data breaches, and ultimately payment fraud. Such criminal efforts are increasing in organization and scale. To assess the resulting damage, this article presents a preliminary estimate of the rate of card payment fraud in the United States. According to the estimate, card fraud is higher in the United States than in several other countries for which data are already available. While the U.S. payment industry is taking steps to combat payment fraud, progress has been slowed by conflicts of interest, inadequate incentives, and lack of coordination. The principle conclusion is that policymakers should monitor the card payment industry to see if it better coordinates security efforts, and if not, consider actions to help the industry overcome barriers to effective development of security.
The first section examines the card payment approval process. The process has specific vulnerabilities but a common underlying weakness is heavy reliance on information to distinguish between legitimate and fraudulent uses of card payments. The section also explores what we know about criminal access to and use of payments information to commit fraud. The second section addresses the monetary harm that fraud inflicts on participants in the payment system. The third section reviews several important initiatives, in the United States and elsewhere, designed to combat card payment fraud. It goes on to ask whether barriers are preventing effective fraud prevention efforts. The fourth section reviews issues for industry and public policy.
I. THE EMERGING VULNERABILITY OF PAYMENT CARDS
The primary aim of card payment security is to ensure that only payments authorized by the account holder are allowed. Vulnerabilities exist in the card payment the approval

2
process, however, that enable criminals to make fraudulent card payments. Each of these vulnerabilities is related to one underlying cause of card payment fraud: an information-intensive payment approval process. Criminals have begun concerted efforts to collect and exploit this information, especially by targeting electronic records.
This section will focus on newer forms of payment fraud, which are often a result of breaches of personal information.1 Large data breaches are especially damaging, and many of these breaches expose payment-related data. Criminals are specializing in activities to gather sensitive information (such as writing malevolent software or establishing fake Internet sites), to commit fraud, and to launder associated funds. These groups are international in scope and organize themselves in underground online markets where they can buy and sell services that aid in stealing data or perpetrating payment fraud.
Card payment approval
Payment fraud occurs when someone gains financial or material advantage by using a payment instrument (or information from a payment instrument) to complete a transaction that is not authorized by the legitimate account holder.2 In this definition, the lack of an account holder’s authorization is the crucial distinguishing characteristic of payment fraud.3 To prevent fraud, several steps must occur before a transaction is approved by a card issuer. The card is authenticated (to screen for counterfeits), the cardholder is identified (to prevent unauthorized use), and risk parameters set by the card issuer or merchant are checked for compliance (such as sufficient funds in an account). If the payment satisfies these steps, the payment is approved.
Advances in the payment approval system have helped combat card payment fraud. Online approval of card payments, where transaction information is sent from the point of sale to the card issuer for immediate approval or rejection, was developed by the early 1980s and today is used in nearly every U.S. transaction (Stearns). In the 1990s, “neural network” computer systems, which use complex statistical modeling techniques, were applied to improve transaction analysis and help detect fraudulent transactions. Internet merchants are now controlling payment fraud by using their own analysis of transactions before deciding to accept an online order (CyberSource). The recent introduction of contactless cards in the United States that transmit card information on radio waves (instead of through a swipe of a magnetic stripe) adds some security features that are
1 Traditional forms of card payment fraud remain important, such as stealing payment cards, intercepting mail with cards or account information, and spying cards as they are used. For example, forty-one percent of debit card fraud is a result of lost and stolen cards (Tedder). Because mitigation of these forms of fraud is well understood, this section will examine new threats. 2 Identity theft is special case of this type of payment fraud. Identity theft occurs when a criminal takes information about a person to create a new deposit, credit card, or non-deposit (cell phone, utility, and so on) account. In some cases, a “synthetic” identity is created where the “account holder” does not have a real world presence. In each of these examples the identity of a person is misrepresented and any transaction with the account would be payment fraud. If the fraud involved a payment card then it would count as card payment fraud. 3 Misuse of payments to conduct fraud or illegal activity is not payment fraud if it involves a payment that is properly authorized by the account holder. Thus, some types of fraud to which merchant acquirers are subject as well as some types of terrorist financing or gambling may be illegal but would not be considered payments fraud (Braun and others, p.145).
3
superior to those on magnetic stripe cards.4 Card issuers and merchants face numerous challenges in making a correct approval
decision. The payment cards that issuers produce are not sufficiently difficult to counterfeit.5 To accommodate merchants and consumers, card issuers continue to allow payments via mail order, the telephone, and now the Internet, with only the information from a payment card. Some merchants do not properly check payment cards for counterfeits or review signatures of cardholders. Some consumers write their PINs on their payment cards or do not sufficiently protect their personal computers.
The common underlying cause of these vulnerabilities is an information-intensive payment approval process and this reliance on information is growing. For example, online payment approval has allowed automated checks against wider sets of information, such as a cardholder’s zip code or transaction history. More information will generally lead to a more accurate approval decision, which gives card issuers (and merchants) an incentive to continuously expand the data on which they rely.6 Criminals also have strong incentives to gather and use this same information to commit fraud. The incentives of these two groups results in an escalating cycle that leads to more resources on each side to either protect or to compromise data.
Relatively simple ways for criminals to get such information is to steal a wallet, intercept mail that contains account statements, or spy the information while it is used in a transaction.7 The recent transition to electronic payments processing has opened new avenues for gathering payment card data. A disguised card reader can be fit over a legitimate slot on ATMs or other payment terminals to electronically capture card information (skimming). Video cameras placed in hard-to-detect locations can capture PIN numbers.8 Criminals also exploit the Internet, such as by sending out millions of email messages that trick a small number of recipients into revealing sensitive account or card information (phishing). On a larger scale, hackers can penetrate computer systems where the information is stored and transmitted.
More broadly, a specialized electronic payment fraud industry appears to be increasing. Security experts argue that since 2004 “criminals who were carrying out card fraud and attacks on electronic banking got organized, thanks to a small number of criminal organizations and a number of chat-rooms and other electronic fora, where
4 Contactless cards do not transmit the cardholder’s name, as does a magnetic stripe card. Use of a stolen card number to commit fraud is more difficult without the cardholder’s name. In addition, contactless cards add an encrypted code to the payment message that help issuers authenticate the card. See www.smartcardalliance.org/ pages/ publications-contactless-payment-security-qa. 5 Issuers began to add magnetic stripes to payment cards in the 1970s and since then have struggled with their vulnerability to counterfeiting (Mandell, 1990, pp. 64-69, ch. 9 and ch. 10). 6 Recent theoretical work suggests that payment networks have incentives that results in the collection of excessive amounts of personal information and that it is insufficiently secured (Roberds and Schreft 2008). 7 This can occur by simple observation of a transaction. The information can also be obtained by using a small, handheld device that reads and stores (or “skims”) card information. According to a recent report, card information skimmed at Florida restaurants sell for as much as $50 (Poulson). 8 PIN transactions, in which the cardholder enters a secret number, are less prone to fraud, but the PIN is now another piece of information targeted by criminals (“Losses Mount As Fraudsters Evade UK Chip Card Protections,” Cards&Payments, July 1, 2008, p. 14). Because it is difficult to monitor and detect, most compromises of personal identification numbers (PINs) occur at pay-at-the-pump terminals fitted with a disguised skimming devices (Tedder, p. 9).
4
criminals can trade stolen card and bank account data, hacking tools and other services.”9 Elements of this industry specialize in activities such as writing malware, hacking databases, organizing underground electronic marketplaces, and money laundering.
Data breaches
Criminals exploit card information from any source to commit card payment fraud. But data breaches deserve special attention because electronic processing of payments provides new means of accessing data and can substantially increase the amount of data that is compromised. Organizations do not always report data breach incidents but recently the public record has become more complete as states have implemented laws that require disclosure.10
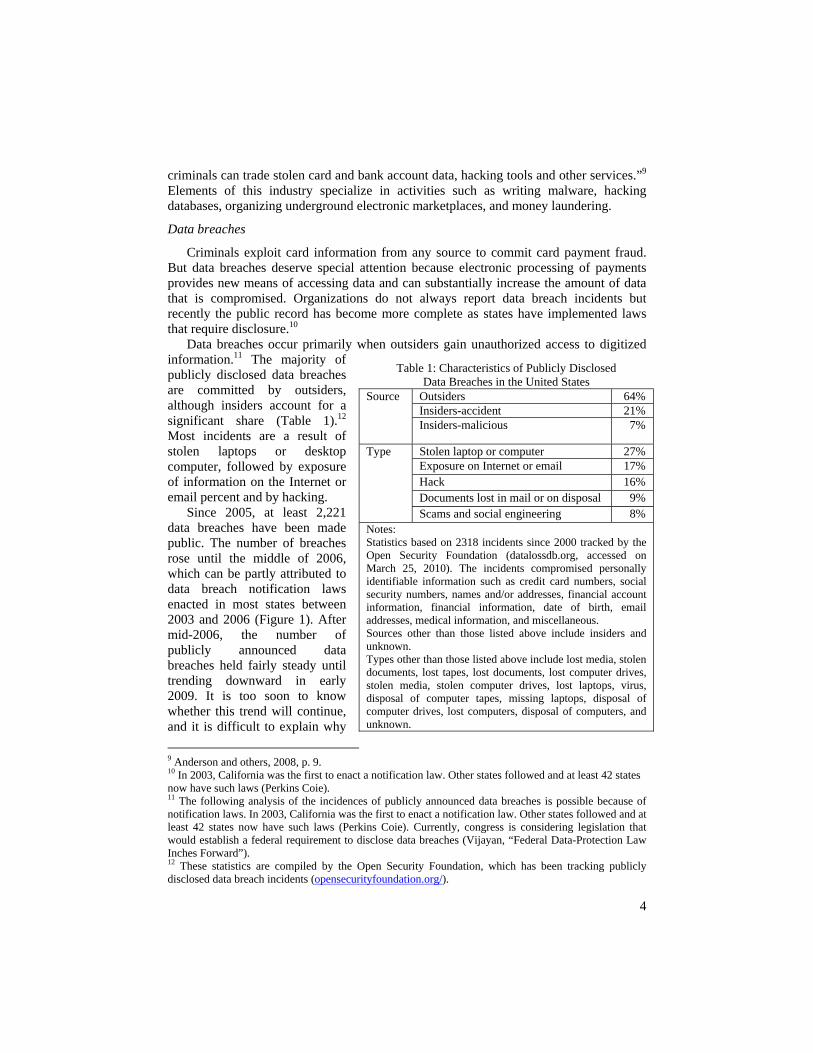
Data breaches occur primarily when outsiders gain unauthorized access to digitized information.11 The majority of publicly disclosed data breaches are committed by outsiders, although insiders account for a significant share (Table 1).12 Most incidents are a result of stolen laptops or desktop computer, followed by exposure of information on the Internet or email percent and by hacking.
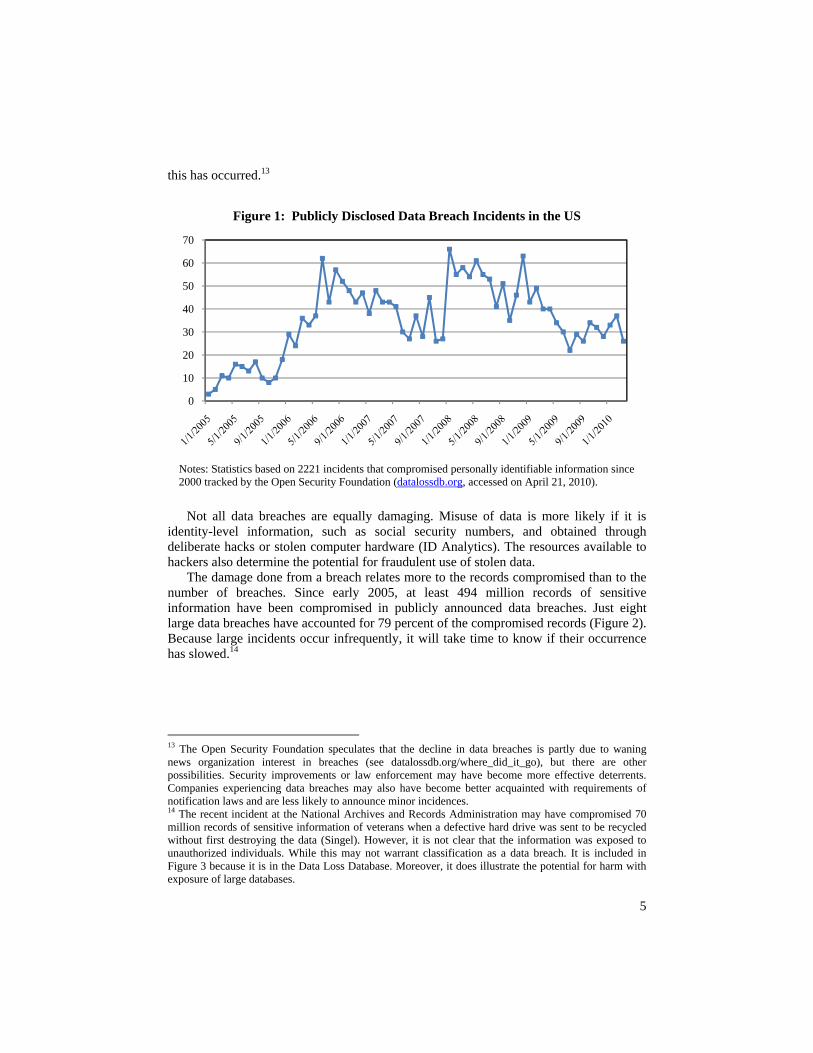
Since 2005, at least 2,221 data breaches have been made public. The number of breaches rose until the middle of 2006, which can be partly attributed to data breach notification laws enacted in most states between 2003 and 2006 (Figure 1). After mid-2006, the number of publicly announced data breaches held fairly steady until trending downward in early 2009. It is too soon to know whether this trend will continue, and it is difficult to explain why
9 Anderson and others, 2008, p. 9. 10 In 2003, California was the first to enact a notification law. Other states followed and at least 42 states now have such laws (Perkins Coie). 11 The following analysis of the incidences of publicly announced data breaches is possible because of notification laws. In 2003, California was the first to enact a notification law. Other states followed and at least 42 states now have such laws (Perkins Coie). Currently, congress is considering legislation that would establish a federal requirement to disclose data breaches (Vijayan, “Federal Data-Protection Law Inches Forward”). 12 These statistics are compiled by the Open Security Foundation, which has been tracking publicly disclosed data breach incidents (opensecurityfoundation.org/).
Table 1: Characteristics of Publicly Disclosed Data Breaches in the United States
Source Outsiders 64% Insiders-accident 21% Insiders-malicious 7%
Type Stolen laptop or computer 27% Exposure on Internet or email 17%
Hack 16%
Documents lost in mail or on disposal 9%
Scams and social engineering 8% Notes: Statistics based on 2318 incidents since 2000 tracked by the Open Security Foundation (datalossdb.org, accessed on March 25, 2010). The incidents compromised personally identifiable information such as credit card numbers, social security numbers, names and/or addresses, financial account information, financial information, date of birth, email addresses, medical information, and miscellaneous. Sources other than those listed above include insiders and unknown. Types other than those listed above include lost media, stolen documents, lost tapes, lost documents, lost computer drives, stolen media, stolen computer drives, lost laptops, virus, disposal of computer tapes, missing laptops, disposal of computer drives, lost computers, disposal of computers, and unknown.
5
this has occurred.13
Not all data breaches are equally damaging. Misuse of data is more likely if it is
identity-level information, such as social security numbers, and obtained through deliberate hacks or stolen computer hardware (ID Analytics). The resources available to hackers also determine the potential for fraudulent use of stolen data.
The damage done from a breach relates more to the records compromised than to the number of breaches. Since early 2005, at least 494 million records of sensitive information have been compromised in publicly announced data breaches. Just eight large data breaches have accounted for 79 percent of the compromised records (Figure 2). Because large incidents occur infrequently, it will take time to know if their occurrence has slowed.14
13 The Open Security Foundation speculates that the decline in data breaches is partly due to waning news organization interest in breaches (see datalossdb.org/where_did_it_go), but there are other possibilities. Security improvements or law enforcement may have become more effective deterrents. Companies experiencing data breaches may also have become better acquainted with requirements of notification laws and are less likely to announce minor incidences. 14 The recent incident at the National Archives and Records Administration may have compromised 70 million records of sensitive information of veterans when a defective hard drive was sent to be recycled without first destroying the data (Singel). However, it is not clear that the information was exposed to unauthorized individuals. While this may not warrant classification as a data breach. It is included in Figure 3 because it is in the Data Loss Database. Moreover, it does illustrate the potential for harm with exposure of large databases.
0
10
20
30
40
50
60
70
Figure 1: Publicly Disclosed Data Breach Incidents in the US
Notes: Statistics based on 2221 incidents that compromised personally identifiable information since 2000 tracked by the Open Security Foundation (datalossdb.org, accessed on April 21, 2010).

6
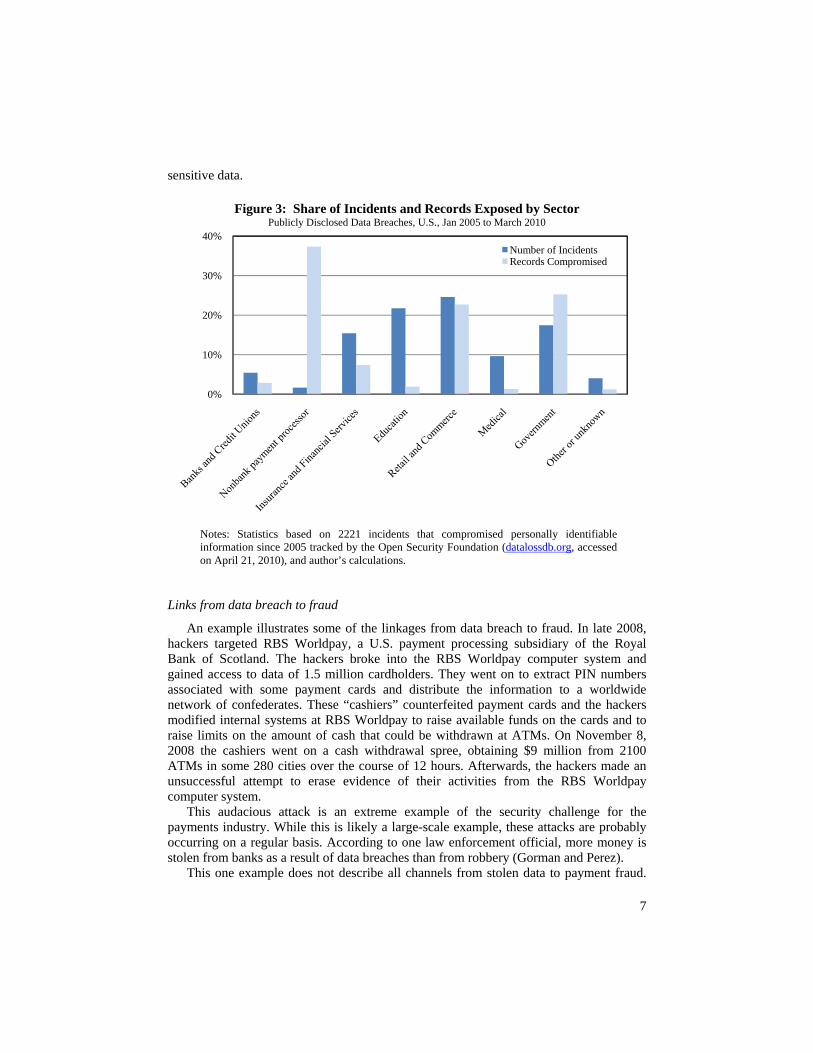
A closer look at the origin of data breaches shows that the distribution of incidents
and records compromised varies considerably across sectors of the economy. Among the sectors shown in Figure 3, nonbank payment processors account for only two percent of breaches but are responsible for the largest share of records compromised. Retail and commerce account for the largest share of incidents and the second-largest share of records compromised. The education sector stands out with 22 percent share of data breach incidents―but only two percent of records compromised. Government entities have both a significant share of incidents and of records compromised. Banks and credit unions have a good record by comparison.
Some tentative conclusions can be made from the record of publicly announced data breaches. First, much exposure results from a relatively few large breaches. Second, nonbank payment processors, retailers, and government entities are major targets. Third, nonbank payment processors have been good at avoiding a large number of potential attacks, but when their security systems are successfully penetrated, exposure can be extensive.15 Fourth, the relatively good record of banks and credit unions, despite also storing data useful for payments fraud, suggest they have done a good job protecting
15 See Sullivan (2007) for an analysis of the risk that nonbanks pose for payments and the supervisory structure over nonbanks in payments. Bradford and others (2009) describe the extent of and risks posed by nonbanks in the payments systems of the United States and Europe.
-
20
40
60
80
100
120
140
Millions
Figure 2: Records Compromised from Publicly Disclosed Data Breaches in the US
Cardsystems40 million
U.S. Dept. Vet. Affairs26.5 million
TJX94 million
Fidelity/Certegy8.5 million TD Ameritrade
6.3 million
BONY Mellon12.5 million
Heartland130 million
Nat. Arch. &Rec. Admin.75 million*
Notes: Statistics based on 2221 incidents that compromised personally identifiable information since 2000 tracked by the Open Security Foundation (datalossdb.org, accessed on April 21, 2010). *Data at the National Archives and Records Administration may have been compromised when a defective hard drive was sent to be recycled without first being destroyed. The hard drive contained 70 million records of sensitive information of veterans (Singel). It is not clear that the information reached unauthorized individuals. While some may not consider this a data breach, it is included in Figure 2 because it is in the Data Loss Database.
7
sensitive data.
Links from data breach to fraud
An example illustrates some of the linkages from data breach to fraud. In late 2008, hackers targeted RBS Worldpay, a U.S. payment processing subsidiary of the Royal Bank of Scotland. The hackers broke into the RBS Worldpay computer system and gained access to data of 1.5 million cardholders. They went on to extract PIN numbers associated with some payment cards and distribute the information to a worldwide network of confederates. These “cashiers” counterfeited payment cards and the hackers modified internal systems at RBS Worldpay to raise available funds on the cards and to raise limits on the amount of cash that could be withdrawn at ATMs. On November 8, 2008 the cashiers went on a cash withdrawal spree, obtaining $9 million from 2100 ATMs in some 280 cities over the course of 12 hours. Afterwards, the hackers made an unsuccessful attempt to erase evidence of their activities from the RBS Worldpay computer system.
This audacious attack is an extreme example of the security challenge for the payments industry. While this is likely a large-scale example, these attacks are probably occurring on a regular basis. According to one law enforcement official, more money is stolen from banks as a result of data breaches than from robbery (Gorman and Perez).
This one example does not describe all channels from stolen data to payment fraud.
0%
10%
20%
30%
40%
Figure 3: Share of Incidents and Records Exposed by SectorPublicly Disclosed Data Breaches, U.S., Jan 2005 to March 2010
Number of IncidentsRecords Compromised
Notes: Statistics based on 2221 incidents that compromised personally identifiable information since 2005 tracked by the Open Security Foundation (datalossdb.org, accessed on April 21, 2010), and author’s calculations.
8
The challenge of tracking stolen data to its misuse makes it unlikely we could get a complete accounting of these channels. Determining what information has been compromised in a data breach is difficult. In the case of large breaches, involving millions of payment records, criminals may not be able to take advantage of the data quickly and may exploit it over a period of time. As a result, consumers may not be aware that a data breach has led to fraudulent use of their payment card.16
We know that stolen data circulate among criminals in underground Internet markets. Evidence shows that stolen credit card information is most commonly available at a cost of $.85 to $30 per card number (Symantec). Bank account information is the second most common type of data available, at a cost of $15 to $850 per account number. Other information, such as full identities, online auction accounts, email accounts, and passwords are also for sale.
There are two common ways to use stolen data for card payment fraud. First, the information is used to counterfeit a payment card and use it in an ATM cash withdrawal or in a face-to-face transaction at a point-of-sale (POS). A recent study of banks found that, between 2006 and 2008, fraud losses from counterfeit cards rose on each of signature debit, PIN debit and ATM transactions (American Bankers Association 2009). Unfortunately, we do not have good statistics on sources of credit card fraud, which is twice as likely as debit card fraud (Javelin).
Second, the information is used to purchase goods from internet, mail order, or telephone merchants. These purchases are called card-not-present (CNP) transactions and are vulnerable to fraud because payment cards cannot be inspected. Costs related to online payments fraud (lost sales, direct payment fraud losses, and fraud management) rose steadily from 2000 to 2008 (Cybersource 2010). The 2009 costs declined somewhat, to $3.3 billion (1.2 percent of sales revenue), in part due to the economic slowdown.
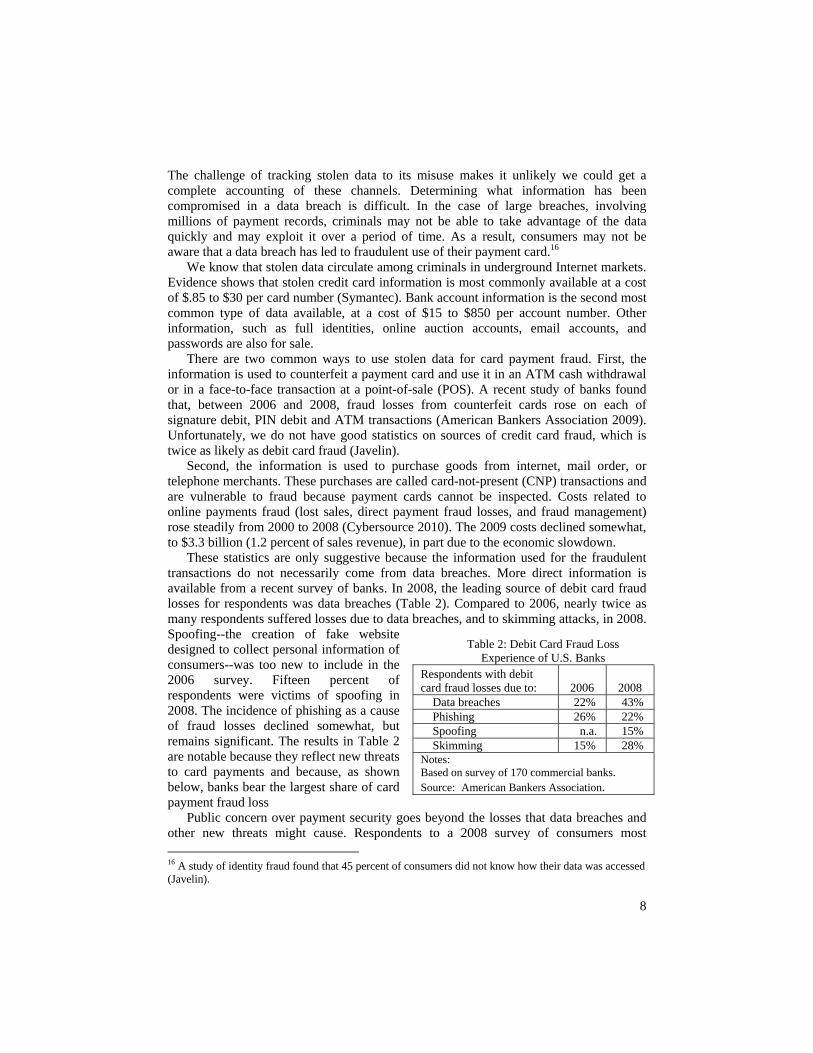
These statistics are only suggestive because the information used for the fraudulent transactions do not necessarily come from data breaches. More direct information is available from a recent survey of banks. In 2008, the leading source of debit card fraud losses for respondents was data breaches (Table 2). Compared to 2006, nearly twice as many respondents suffered losses due to data breaches, and to skimming attacks, in 2008. Spoofing--the creation of fake website designed to collect personal information of consumers--was too new to include in the 2006 survey. Fifteen percent of respondents were victims of spoofing in 2008. The incidence of phishing as a cause of fraud losses declined somewhat, but remains significant. The results in Table 2 are notable because they reflect new threats to card payments and because, as shown below, banks bear the largest share of card payment fraud loss
Public concern over payment security goes beyond the losses that data breaches and other new threats might cause. Respondents to a 2008 survey of consumers most
16 A study of identity fraud found that 45 percent of consumers did not know how their data was accessed (Javelin).
Table 2: Debit Card Fraud Loss Experience of U.S. Banks
Respondents with debit card fraud losses due to: 2006 2008
Data breaches 22% 43% Phishing 26% 22% Spoofing n.a. 15% Skimming 15% 28%
Notes: Based on survey of 170 commercial banks. Source: American Bankers Association.
9
commonly chose security as the most important characteristic of payment instruments (Foster and others, 2009, p. 37). News reports of data breaches and identity theft now seem routine. To protect themselves, consumers and businesses must use security software (firewall and anti-virus software, etc.) on their personal computers to prevent criminals from stealing personal information directly or from installing malware that allows secret control of the computer.17 These attacks on personal computers contribute to consumer anxiety and suspicion about the safety of some forms of payment.
In short, attention has turned to new threats to card payment security, such as stolen payment data obtained in data breaches and other sources. A complex and developing chain links stolen data to card payment fraud. The bottom line, however, is the loss that payments participants bear as a result of card payments fraud. The next section reviews what is known about the extent of losses in the United States due to card payment fraud.
II. THE EXTENT OF DEBIT AND CREDIT CARD FRAUD LOSSES
Turning to the direct monetary losses from payment cards, this section first describes two methods for measuring fraud losses and their comparability.18 It then presents a preliminary estimate of fraud losses in the United States. In 2006, the U.S. fraud loss rate was high relative to rates in Australia, France, Spain, and the UK. Finally, it reviews factors, such as payment security standards, business practices, and consumer payment patterns that explain these international differences. For the United States, significant factors include continued reliance on older payment card technology, the use of signature debit to identify the cardholder, and a highly developed Internet economy.
Alternative methods for measuring fraud losses on card payments
The ideal measure of card payment fraud would be the value of fraudulent payments for all participants in various card payment networks. In recent years, several countries around the world have begun to regularly publish such statistics (Sullivan 2009). The data that feeds these statistics originates in financial institutions at the time the fraudulent transactions are reported by account holders. The financial institution puts a marker in the computer record of the transaction, indicating that it was reported fraudulent. Periodic summary statistics on the number and value of fraudulent payments can then be easily be generated from computer records.19 Typically, an industry organization gathers data from card issuers and networks to calculate aggregate statistics. Often, information on the sources of payments fraud is also reported.
These statistics are unavailable for the United States, but an alternative method can provide comparable statistics. That method is based on the relation between the value of payment fraud as first reported and the disposition of actual payment fraud losses.
17 Criminals put together groups of compromised computers into “botnets” and use them, for example, to send phishing emails to large numbers of recipients. 18 These direct losses are only part of the cost of payment fraud. Others include costs of fraud prevention and costs of pursuing perpetrators. Social costs include law enforcement activities to investigate and prosecute payment fraud. 19 Most financial institutions would take these steps as part of an internal control system for payment fraud. To facilitate an understanding of the sources of fraud, it is typical for the financial institution to also classify the fraudulent transaction into categories such as from a lost or stolen payment card or from a counterfeit card. Some countries also provide information on fraud losses for non-card payments, such as on checks. For more information see Sullivan (2009).

10
The financial institution to which a fraudulent card payment is first reported will not necessarily bear all or even part of the loss. A consumer, for example, might find a $200 fraudulent debit card payment on his monthly account statement. If the consumer reports the transaction to his financial institution in a timely manner, then the consumer would be responsible for no more than $50 of the value of the transaction, and the financial institution would lose the remaining $150. The rule for what is “timely” and the $50 limit is determined in the United States by Regulation E, written by the Federal Reserve to implement a provision in the 1978 Electronic Funds Transfer Act. Laws, regulations, and industry practice determine how fraud losses as first reported are distributed to become actual losses among payment participants.
Another important example concerns a properly approved payment where the card is present at the time of purchase. In this case, the merchant receives a payment guarantee by the card issuer. Losses for fraudulent transactions on properly approved card-present merchant transactions are typically borne by card issuers.20
Merchants do not completely escape losses due to card payment fraud. For example, merchants who accept CNP payments cannot inspect the card for counterfeits or confirm that the customer has possession of the card. As a result CNP transactions do not generally get a payment guarantee. Relative to their sales, card payment fraud losses fall most heavily on Internet, mail order, and telephone merchants because they nearly all of their payments are CNP transactions. The estimate of card payment card fraud in the United States presented here is based on the sum of direct losses borne by card issuers, POS merchants, and merchants in Internet, mail order, and telephone transactions.21 This estimate should be comparable to fraud loss statistics from other countries because the value of a fraudulent payment when first reported should approximate the sum the losses of payment participants who ultimately bear the loss.
Consumer losses on fraudulent payments are excluded because legal requirements, regulation, and industry practice limit consumer losses liability for payment fraud. For example, all of the major credit card networks provide zero liability to cardholders in cases of fraudulent payments. This typically applies to signature debit transactions, but industry practice is less consumer friendly in cases of fraud on PIN debit transactions. But the resulting losses to consumers would be limited because it has been estimated that 88 percent of major banks apply zero liability to consumers in cases of fraudulent PIN debit transactions.22
20 Merchants pay for the guarantee service in their payment processing fees. Payment fraud on business accounts has a different set of rules because Regulation E applies only to consumer accounts. Surveys of corporations generally find that these businesses suffer various forms of payment fraud (mostly check fraud) but they do not bear much of the cost of fraud because they take advantage of fraud control services at financial institutions (Association for Financial Professionals). This suggests that losses for payments fraud at large businesses are typically borne by financial institutions. 21 Another major participant in the card payment network is acquirers, who process payments for merchants. Losses reported to acquirers would typically be passed on to the merchants for whom they process payments. 22 Tedder 2009, p. 7. If 12 percent of PIN debit fraud losses fall on consumers, the cost would be about $4 million dollars, or only about 0.1% of total fraud losses shown in Table 2. Consumer losses on card payments may also be due to unauthorized transactions on payments cards by family or friends, where the victim is willing to accept the loss for personal reasons.
11
Fraud losses in the United States and other countries
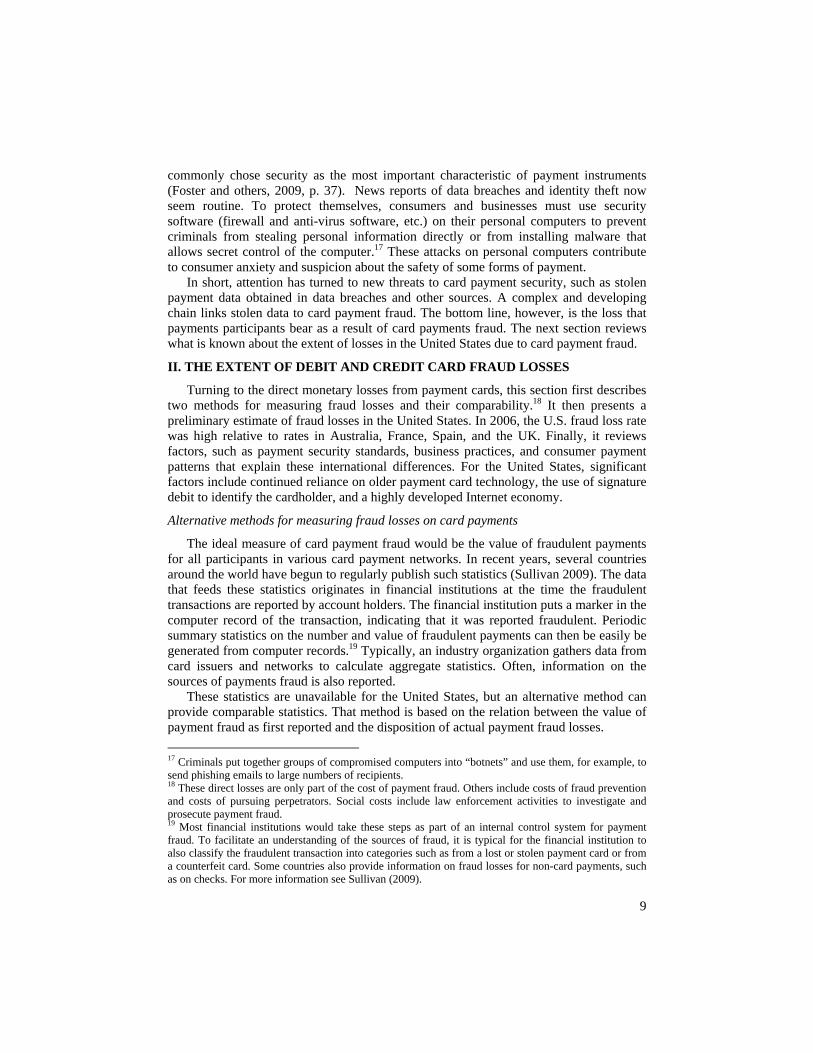
In 2006, total fraud losses are estimated at $3.718 billion (Table 3).23 Card issuers paid the largest dollar cost, followed by POS merchants and Internet, mail order, and telephone merchants. Internet and mail order merchants had the lowest cost of card payment fraud, but the annual sales of POS merchants was approximately 30 times that of Internet, mail order, and telephone merchants. Fraud as a share of sales volume was much higher for Internet, mail order, and telephone merchants than for POS merchants.
Most card payment fraud losses in 2006 were borne by card issuers. The share for card issuers was 59 percent and for merchants was 41 percent. In 2007, by contrast, 51 percent of card payment fraud losses were attributed to issuers and acquirers and 46 percent to merchants (Observatory for Payments Card Security 2007). This comparison is tentative, however, because of the preliminary nature of the estimate of U.S. fraud losses. Further research will be needed to determine if the distribution of fraud losses reported here is accurate.
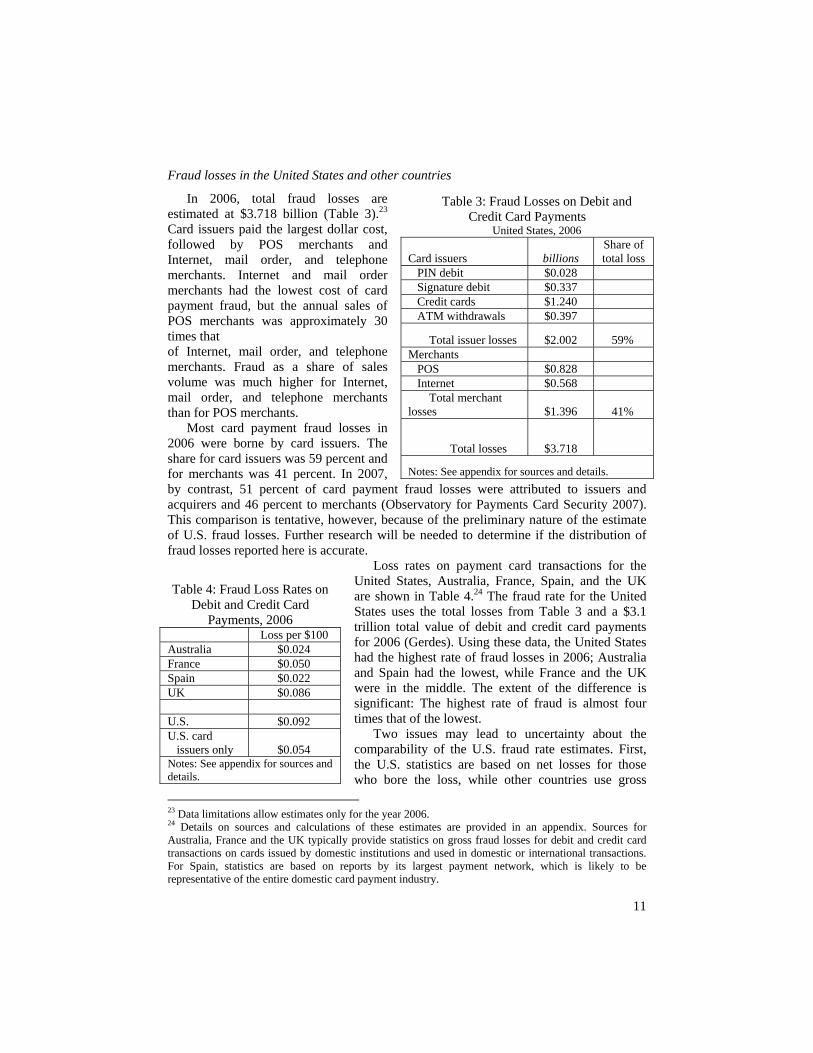
Loss rates on payment card transactions for the United States, Australia, France, Spain, and the UK are shown in Table 4.24 The fraud rate for the United States uses the total losses from Table 3 and a $3.1 trillion total value of debit and credit card payments for 2006 (Gerdes). Using these data, the United States had the highest rate of fraud losses in 2006; Australia and Spain had the lowest, while France and the UK were in the middle. The extent of the difference is significant: The highest rate of fraud is almost four times that of the lowest.
Two issues may lead to uncertainty about the comparability of the U.S. fraud rate estimates. First, the U.S. statistics are based on net losses for those who bore the loss, while other countries use gross
23 Data limitations allow estimates only for the year 2006. 24 Details on sources and calculations of these estimates are provided in an appendix. Sources for Australia, France and the UK typically provide statistics on gross fraud losses for debit and credit card transactions on cards issued by domestic institutions and used in domestic or international transactions. For Spain, statistics are based on reports by its largest payment network, which is likely to be representative of the entire domestic card payment industry.
Table 3: Fraud Losses on Debit and Credit Card Payments
United States, 2006 Card issuers
billions
Share of total loss
PIN debit $0.028 Signature debit $0.337 Credit cards $1.240 ATM withdrawals $0.397
Total issuer losses $2.002 59% Merchants POS $0.828 Internet $0.568 Total merchant losses $1.396 41%
Total losses $3.718
Notes: See appendix for sources and details.
Table 4: Fraud Loss Rates on Debit and Credit Card
Payments, 2006 Loss per $100 Australia $0.024 France $0.050 Spain $0.022 UK $0.086 U.S. $0.092 U.S. card issuers only $0.054 Notes: See appendix for sources and details.
12
losses as reported when the fraudulent transaction is reported. The difference between net and gross is the amount of funds recovered or prevented from being transferred. If the estimate for the United States were based on gross losses, then the difference would be higher than what is shown in Table 4, but how much higher is unknown. The second issue is the uncertainty of estimated losses for POS merchants for the United States. In general, conservative assumptions are used to calculate merchant losses, so a more realistic assumption would probably widen the difference in fraud loss rates between the United States and other countries. While there is some uncertainty in the calculations, the difference is sufficiently large that added accuracy would not close the gap.
Why international rates of card payment fraud differ
The cross-country differences in payment card fraud rates shown in Table 4 are due to a number of factors, evolving security standards, such as the mix of payment cards in use, transaction authorization systems, the types of payments made using cards, and support of older card technology that has relatively weak security features.
Evolving security standards that help to prevent debit and credit card fraud contributes to cross-country differences in fraud rates. For example, “chip-and-PIN” payment cards, which have an embedded computer chip and require use of a PIN to initiate a transaction, are more secure because they better protect data used to authorize a payment and they make it very difficult to counterfeit a payment card. These cards are currently being adopted in many countries around the world. Statistics have shown that chip-and-PIN has been very successful at reducing fraud on face-to-face transactions, ATM withdrawals, and on lost and stolen cards.
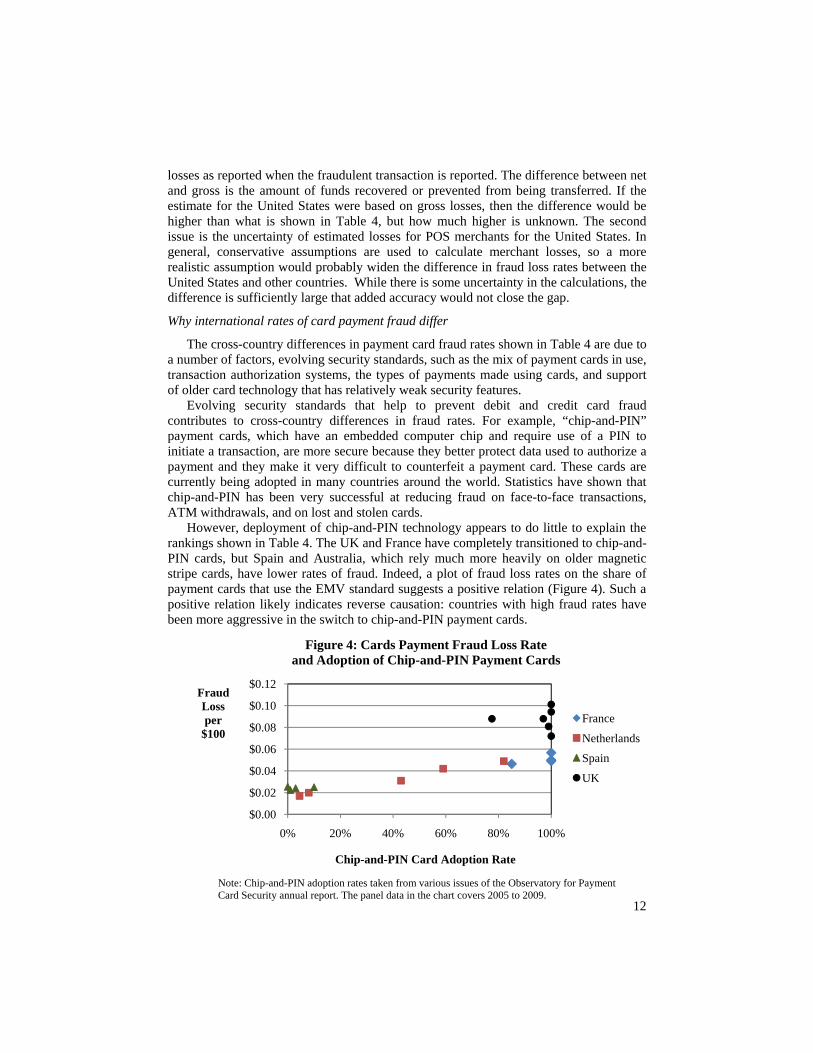
However, deployment of chip-and-PIN technology appears to do little to explain the rankings shown in Table 4. The UK and France have completely transitioned to chip-and-PIN cards, but Spain and Australia, which rely much more heavily on older magnetic stripe cards, have lower rates of fraud. Indeed, a plot of fraud loss rates on the share of payment cards that use the EMV standard suggests a positive relation (Figure 4). Such a positive relation likely indicates reverse causation: countries with high fraud rates have been more aggressive in the switch to chip-and-PIN payment cards.
$0.00
$0.02
$0.04
$0.06
$0.08
$0.10
$0.12
0% 20% 40% 60% 80% 100%
FraudLossper
$100
Chip-and-PIN Card Adoption Rate
Figure 4: Cards Payment Fraud Loss Rateand Adoption of Chip-and-PIN Payment Cards
France
Netherlands
Spain
UK
Note: Chip-and-PIN adoption rates taken from various issues of the Observatory for Payment Card Security annual report. The panel data in the chart covers 2005 to 2009.

13
Fraud rates on different payment cards are unequal. Use of a PIN code to identify a cardholder is more secure than using a signature. Countries that rely more heavily on PIN codes for card payments will have less payment fraud. In Australia, for example, approximately 90 percent of debit transactions in 2006 used PIN codes, compared to only about 40 percent in the United States. The quality of transaction authorization systems is also important. Both the Spanish and Australian payment networks have strong reputations for the use of transaction history analysis to help identify and avoid fraudulent transactions.
The difference in fraud rates stems from other factors. For example, credit card transactions tend to have higher fraud rates. First, they are often authenticated with a signature. Second, consumers may use them in riskier situations because, in contrast with debit cards, funds are not drawn immediately from their bank accounts. Figure 5 shows that countries that depend more heavily on credit cards (with the exception of Spain, where cash is heavily used) tend to have higher rates of fraud losses.
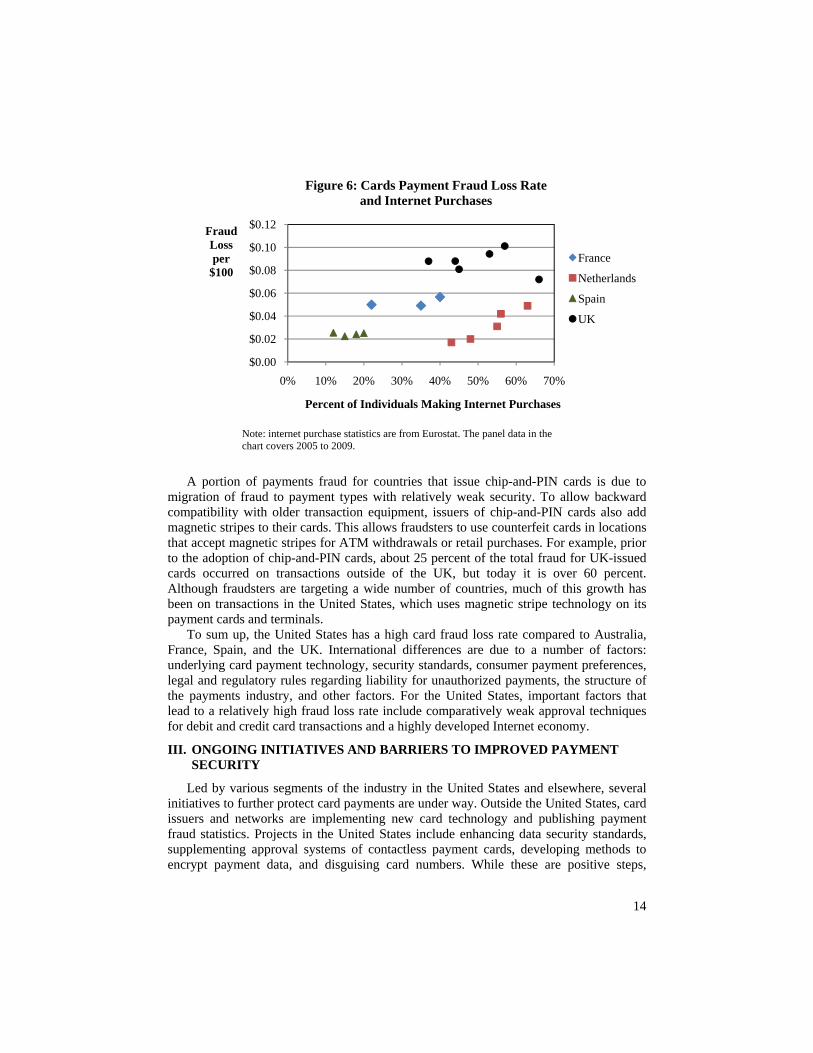
Fraud losses on CNP transactions will depend on the extent of Internet, mail order, and telephone shopping, where relatively risky CNP transactions are common. A recent European Commission study showed that only 20 percent of individuals ordered goods over the Internet in Spain, compared to 57 percent in the UK (EC Staff Working Document). A 2008 survey of consumers in the United States found that 83 percent of consumers made purchases on the Internet (Hitachi). E-commerce is more fully developed in the United States and in the UK and contributes to their relatively high rate of card fraud (Figure 6).
$0.00
$0.02
$0.04
$0.06
$0.08
$0.10
$0.12
0% 10% 20% 30% 40% 50% 60% 70%
FraudLossper
$100
Credit Cards As Percent of Total Payment Cards
Figure 5: Cards Payment Fraud Loss Rateand Credit Card Share of Total Cards
France
Netherlands
Spain
UK
Note: Credit card share of total cards are calculated from Committee on Payment and Settlement Systems, the UK Payments Council, and data from the website of the Nederlandsche Bank. The panel data in the chart covers 2005 to 2009.
14
A portion of payments fraud for countries that issue chip-and-PIN cards is due to
migration of fraud to payment types with relatively weak security. To allow backward compatibility with older transaction equipment, issuers of chip-and-PIN cards also add magnetic stripes to their cards. This allows fraudsters to use counterfeit cards in locations that accept magnetic stripes for ATM withdrawals or retail purchases. For example, prior to the adoption of chip-and-PIN cards, about 25 percent of the total fraud for UK-issued cards occurred on transactions outside of the UK, but today it is over 60 percent. Although fraudsters are targeting a wide number of countries, much of this growth has been on transactions in the United States, which uses magnetic stripe technology on its payment cards and terminals.
To sum up, the United States has a high card fraud loss rate compared to Australia, France, Spain, and the UK. International differences are due to a number of factors: underlying card payment technology, security standards, consumer payment preferences, legal and regulatory rules regarding liability for unauthorized payments, the structure of the payments industry, and other factors. For the United States, important factors that lead to a relatively high fraud loss rate include comparatively weak approval techniques for debit and credit card transactions and a highly developed Internet economy.
III. ONGOING INITIATIVES AND BARRIERS TO IMPROVED PAYMENT SECURITY
Led by various segments of the industry in the United States and elsewhere, several initiatives to further protect card payments are under way. Outside the United States, card issuers and networks are implementing new card technology and publishing payment fraud statistics. Projects in the United States include enhancing data security standards, supplementing approval systems of contactless payment cards, developing methods to encrypt payment data, and disguising card numbers. While these are positive steps,
$0.00
$0.02
$0.04
$0.06
$0.08
$0.10
$0.12
0% 10% 20% 30% 40% 50% 60% 70%
FraudLossper
$100
Percent of Individuals Making Internet Purchases
Figure 6: Cards Payment Fraud Loss Rateand Internet Purchases
France
Netherlands
Spain
UK
Note: internet purchase statistics are from Eurostat. The panel data in the chart covers 2005 to 2009.

15
barriers remain, such as conflicts of interest, inadequate incentives, poor governance, and potential redundancy.
Industry initiatives
A major initiative occurring in other countries is the implementation of the EMV standard for payment cards. EMV is an acronym for the card schemes Europay, MasterCard and Visa but the standard has also been accepted by American Express, Discover, and JCB.
The EMV standard defines technical rules and protocols for payment cards that use computer chips. The standard has some flexibility allowing card issuers to adopt various configurations for their cards that best fit their business needs. The chip-and-PIN card mentioned above is an example and is currently the most common implementation of the EMV standard. Chip-and-PIN cards are fully implemented in a few countries, but many other countries, including Canada and Mexico, are either in transition to chip-and-PIN or plan to adopt it in the near future. Chip-and-PIN payment cards have proven to be very good at preventing certain types of fraud, such as on lost or stolen cards. In countries where merchants will only accept the cards, counterfeit fraud has fallen as well.
Another initiative that other countries are pursuing is the collection and publication of payment fraud statistics. These statistics provide guidance for the card industry in its efforts to combat fraud. After implementation of Chip-and-PIN, for example, statistics revealed to UK issuers that fraud on their cards was migrating to areas of relative security weakness. Specifically, CNP fraud in the UK and counterfeit card fraud outside of the UK grew rapidly. The information helped the industry take steps to counter these sources of fraud, and it appears the efforts have had some success. Total fraud losses on UK-issued payment cards fell 28 percent in 2009 over the previous year, a decline partly attributed to sophisticated fraud detection screening and to fraud prevention tools applied to online shopping (UK Cards Association).
In the United States, the major credit card companies are leading the most significant recent initiative to improve security and control fraud in card payments. While the card companies have long maintained their own security standards, a cooperative effort in 2004 between Visa and MasterCard led to a common standard. Other card companies joined the effort, and in 2006 the group formed the Payment Card Industry (PCI) Security Standards Council to oversee the standard. Card companies themselves manage compliance validation and enforcement.
The PCI Council oversees several industry wide standards. The most important is the PCI Data Security Standard (PCI DSS), which helps merchants and payment processors protect sensitive data. This goal is accomplished by creating secure networks, strong access controls, data encryption, computers protected with firewalls and antivirus programs, and security policies designed to establish an effective internal control environment.25
Data breaches and their consequences have led elements of the U.S. payment industry to explore ways to improve card payment security. Card issuers have been deploying contactless payment cards, which has a small radio to transmit card information to a payment terminal. Because it is difficult to counterfeit these cards, they are considered 25 Two other standards concern software and hardware used to process payments (see www.pcisecuritystandards.org).
16
more secure than magnetic stripe cards. Issuers are considering an upgrade to EMV-compliant contactless cards, which will use a cryptogram (an encrypted identifying number for the transaction) to allow the card issuer to check the authenticity of the payment card and the uniqueness of the transaction.
Two initiatives are being developed in the merchant community in cooperation with payment service providers. One initiative targets a weakness in the PCC DSS, which requires encryption of sensitive card data when it is transmitted over public networks, but not when transmitted over private networks. Merchants are investigating “end-to-end encryption,” which would encrypt payment data over the entire communications channel from the point-of-sale terminal to the card issuer (Hernandez). Another initiative disguises a card account number by replacing it with a token number. This “tokenization” would occur after a card payment has been authorized so that a merchant can store the transaction information without having to store the card account number (Taylor). Merchants can retrieve the card account number for later processing, if needed. Both of these options could make merchant and processor computer networks less of a target because they would not store or transmit sensitive payment card information in forms that would be useful to hackers.
Barriers to improving card payment security
For the private market to find a socially optimal level of security, it must first overcome significant barriers (Roberds and Schreft 2009). Efforts to improve card payments security by one member of the network may benefit other members, just as one member’s security breach may harm others.26 But because one member of the network has no incentive to take account of the external benefits or costs of others, security for the network is less than optimal. Further, conflicts of interest can arise over the appropriate level of effort to enhance security. Some members will prefer relatively little effort, leaving the security of the entire network subject to its weakest links.
An answer to this dilemma is to pursue security efforts in a collective and comprehensive manner. Payment networks, for example, require membership to access network services. The threat of fines or expulsion makes members more likely to abide by rules regarding security and other operational matters (Braun and others). Conflicts of interest can also complicate the development of security standards. Technically, standards would be more effective if members of the network determined them cooperatively. For example, security engineers recommend finding the most effective control points in the network to provide adequate security (Moore and others). But if each member of the payment network “goes it alone,” and works only with its own control points, then it may be passing up effective security options that lie elsewhere in the network.
Research on standard setting has found that governance is a key to success. Success is more likely if the governance structure includes all of the various interests in the network. The standards themselves need to be effective yet flexible enough to satisfy competitive interests. If done correctly, the process will promote compliance because all participants have a stake in the outcome (Steinfeld and others). Even then, the governance structure must also address issues such as intellectual property rights and provide a way to lessen the tendency of vested interests to block progress (Greenstein and Stango). 26 Banks have had to reissue many of their debit and credit cards as a result of data breaches. See, for example, www.bankinfosecurity.com/articles.php? art_id=1200.
17
The International Organization for Standardization (ISO) uses a model of cooperation to coordinate international security standards for payments. In the United States, the affiliated American National Standards Institute’s (ANSI) X9 committee is responsible for standards in the payments industry (Sullivan 2008). The PCI DSS and EMV standards are not developed in these standard setting organizations. Instead they use a centralized model controlled by the card issuers and networks. The centralized model may allow security standards to be developed rapidly, but perhaps at the expense of adoption.27 Only half of the largest U.S. merchants met the PCI compliance deadline of September 30, 2007.28 Similarly, many European retailers have been slow to achieve PCI compliance (Leyden).
Implementing the PCI DSS has also been controversial. Merchants and processors face significant costs of compliance and question the benefits they receive (Mott).29 The standards themselves have been criticized because they do not address card network rules that require merchants to store card information to resolve disputed transactions or facilitate refunds.30 In addition, some merchants who have been certified as compliant have still been the victims of successful security breaches, raising concerns about the quality of the standard.31
IV. ISSUES FOR INDUSTRY AND PUBLIC POLICY
U.S. policymakers face mixed signals on how well the card payment industry controls payment fraud. On one hand, considerable efforts are aimed at reducing fraud. On the other, some initiatives appear redundant, new security standards are adopted slowly, and the rate of card fraud losses is relatively high.
An important question concerns how well the payment industry as a whole can meet the challenge of protecting sensitive information. Policymakers can take some comfort that a significant amount of private sector activity is trying to find a solution to data breaches and associated payment fraud. By exploring several alternatives, the market may be able to sort out the most effective and efficient ways to protect sensitive card data.
Barriers to improving card payment security, however, may be higher in the United States than in many other countries. Coordination is particularly difficult, with over 18,000 federally insured depository institutions that offer deposit services and over one
27 Chip-and-PIN rollout in the UK was coordinated by the Association for Payment Clearing Services, which consists of financial institutions and payment clearing and settlement companies. The Groupement des Cartes Bancaires , a clearing and settlement network, guided France’s switch to EMV payment cards. 28 “Key PCI Deadline Passes With Half of Big Merchants Compliant,” Digital Transactions News, October 2, 2007 (www.digitaltransactions.net/newsstory.cfm?newsID=1533). As of September 30, 2009, large merchants, who process about half of Visa transactions, were 97 percent compliant (Visa). 29 Similarly, in 2003, the British Retail Consortium expressed concern that the cost of shifting to chip-and-PIN may reach €500 million but estimated that retailers would save only €25 million in card payment fraud losses (Simpson). 30 “Merchant Trade Groups Come Together to Advocate for Changes to Data Security Standards,” Smart Card Trends, June 10, 2009 (www.smartcardstrends.com/det_atc.php?idu=9557). 31 Hackers attacked the computers of Heartland Payment Systems, Inc., in December 2007 and went undiscovered until October 2008 (Zetter). A reported 130 million records were compromised. Heartland was compliant in April 2008. Some argue that the security standards are inadequate, while others allege that Heartland’s security efforts were deficient (Wolfe). A June 2009 breach at Network Solutions occurred despite PCI compliance (McGlasson).

18
million retail establishments. In addition, the United States has a history of depending on paper checks for retail payments, which has a different security profile than electronic payments. The major shift to electronic payments is relatively recent and developing appropriate security standards is in its first stages. The PCI Council is a framework for coordination, but is too early to know whether its practices effectively balance the interests of cardholders, merchants, processors, and card issuers (box).
Regardless of the reasons, several signs suggest that lack of coordination in the payment industry has impeded security improvements. First, once fully developed, end-to-end encryption, tokenization, and payment messages augmented by cryptograms may all provide more security. But, to the extent that they each make attacks on card networks less attractive, they appear to be redundant (Smart Card Alliance). If so, they are competing technologies that are expensive to develop and implement. Another sign of redundant potentially efforts to contain fraud are online merchants and card issuers who develop separate payment screening systems The potential payoff to effective coordination of standard setting is the ability to choose what may be the best option for all members of the payment network and to accomplish common goals before considerable investment is made in unneeded technology.
Governance of the PCI Council
The PCI Council is owned by the five major credit card companies and its five-member executive committee consists of representatives from each of the companies. In addition, both the Executive Director and Chief Technology Officer of the council each have extensive experience in credit card companies.*
Its membership consists of over 500 companies and currently has a mix of financial institutions, payments associations, merchants, equipment manufacturers, software developers, and payment processors. These members can vote for representatives on a Board of Advisors. But whether this broad membership provides meaningful influence is unclear. A letter sent by several merchant groups to the PCI Council in June 2009 that recommended several changes to the PCI DSS suggests that many merchants in the United States would like to have more influence on the design of card payment security standards.**
The PCI Council is a step forward because it has standardized security across the five major card companies. Whether it can also incorporate the interests of the wider payment community is unclear. The Council is currently directing a revision to the PCI DSS (expected to be released at the end of September 2010). Participating organizations and stakeholders provided feedback on current standard from through October 31, 2009, which the Council will review over the next several months. The extent to which the PCI Council balances interest of all stakeholders in the credit card industry will go a long way towards determining the success of the revised standard.
* Visit https://www.pcisecuritystandards.org/index.shtml for more information about the PCI Council. ** “Merchant Trade Groups Come Together to Advocate for Changes to Data Security Standards,” Smart Card Trends, June 10, 2009.

19
Second, slow adoption and disputes over the design of the PCI DSS suggest that development of the standard is one sided, favoring issuers over merchants. This should concern policymakers because effective payment security has two parts: the security standard and its adoption. If members of the payment industry do not feel it is in their self-interest to adopt a new security standard, they may adopt it slowly, and thus overall protection of payments suffers.
Third, the rate of fraud on U.S. card payments is relatively high. Lower rates of card payment fraud have motivated the payment industry in other countries to take the major step of adopting payment smart cards. But a high rate of fraud has not led to U.S. adoption of payment smart cards. It may be that payment smart cards are not the best solution for U.S. fraud prevention, but an alternative, comprehensive, and coordinated solution is not being considered.
If it appears that public policy initiatives are beneficial, current authority could limit the direct role of the Federal Reserve. The Federal Reserve has some policy levers that influence retail payment security, but these do not extend very far beyond depository institutions (Sullivan 2007; Weiner 2008). Oversight responsibilities, however, does include facilitating or acting as a catalyst for change, and could be a mechanism to help coordinate fraud mitigation efforts in the wider payment industry.
The payment industry should consider the broader consequences of continuing to perpetuate the information intensive system of card payment approval. Such a path will continue to provide incentive for criminals to gather information useful to perpetrating payment fraud by all feasible means. The idea of a cryptogram used in the approval process an intriguing idea because it renders the card number alone insufficient to initiate a fraudulent payment. This same idea is embedded in the X9.59 security standard that was approved in 2006 by the American National Standards Institute. The industry may want to embrace a longer list of options in developing security standards.
Finally, reining in payment fraud in the United States is hampered by a lack of detailed, consistent, and periodic data. In a time of profound changes to the retail payment system, such information is crucial. Existing data have quality issues and inconsistent availability, making it difficult to identify what strategies the industry and policymakers should pursue. Producing better statistics would require some effort and cost, but most of the basic data already exist in the information systems of payment providers. Setup costs would be required to standardize reporting and to establish an entity to compile data and regularly report statistics.32 Other countries have not found this system to be overly burdensome.
V. SUMMARY AND CLOSING THOUGHTS
Debit and credit card transactions in the United States have an imperfect payment approval process. The main vulnerability is that fraudulent payments can be made with a few pieces of card information. The incentives of both card issuers and criminals to gather and use information result in an escalating cycle of improved defense by those who hold relevant data and improved methods of defeating the barriers to accessing data.
The fraud loss rate on card payments in the United States is higher than in Australia, France, Spain, and the UK. The high rate is caused in part by a weak payment approval 32 This is often an industry-controlled entity to ensure confidentiality. Examples are the Australian Payments Clearing Association or the UK Payments Administration.
20
process. Hackers have great incentive to gather card payment data, leading to serious problems with data breaches. The industry is moving to protect data, but lack of coordination has resulted in several initiatives that may be redundant. Coordination of security development may be more effective and efficient than the current fragmented process.
To guard against excessive fraud losses and to ensure confidence in card payments, policymakers need to monitor developments in card payment security. First, will card payment security continue to evolve without the benefit of industry wide statistics on the level and sources of fraud losses? These statistics would help to determine whether the industry continues to tolerate a relatively high rate of fraud. Second, will the card payment industry move toward more coordination of security efforts? Such coordinated efforts have been successful in the ACH system, another electronic payment system that has grown rapidly in recent years (Braun and others). If not, policymakers might consider a more active role to help the payments industry overcome barriers to effective coordination of security development.
21
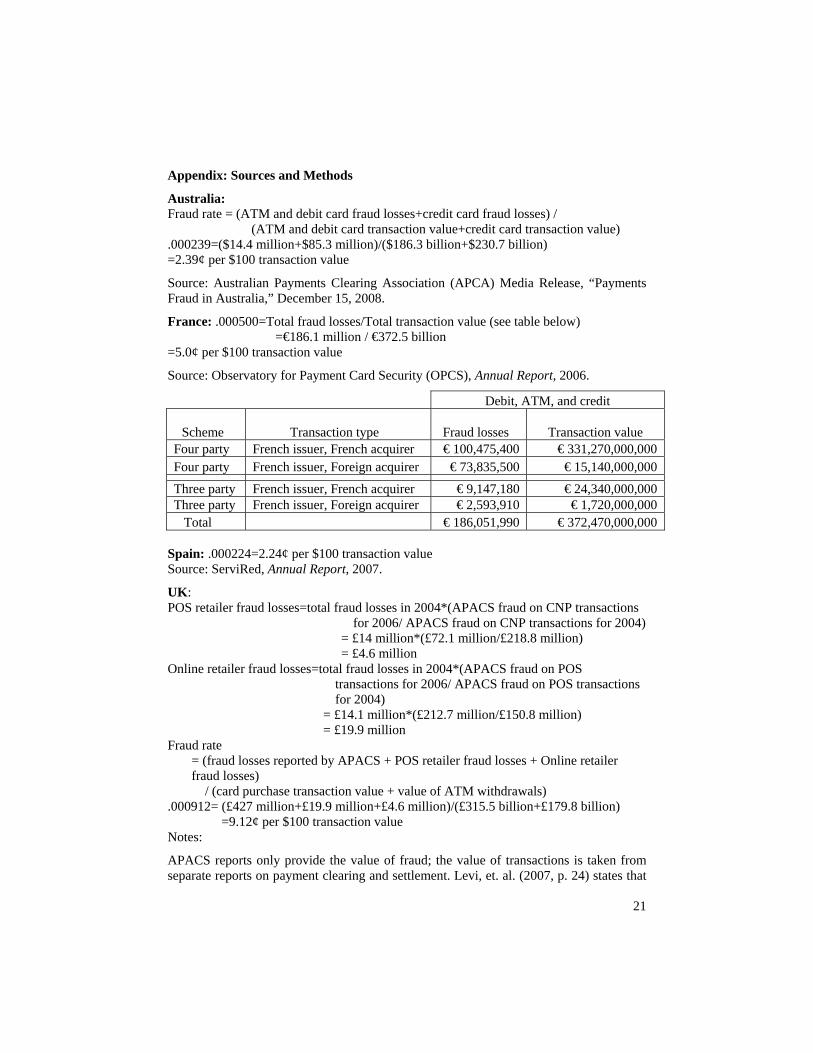
Appendix: Sources and Methods
Australia: Fraud rate = (ATM and debit card fraud losses+credit card fraud losses) /
(ATM and debit card transaction value+credit card transaction value) .000239=($14.4 million+$85.3 million)/($186.3 billion+$230.7 billion) =2.39¢ per $100 transaction value
Source: Australian Payments Clearing Association (APCA) Media Release, “Payments Fraud in Australia,” December 15, 2008.
France: .000500=Total fraud losses/Total transaction value (see table below) =€186.1 million / €372.5 billion
=5.0¢ per $100 transaction value
Source: Observatory for Payment Card Security (OPCS), Annual Report, 2006.
Debit, ATM, and credit
Scheme Transaction type Fraud losses
Transaction value Four party French issuer, French acquirer € 100,475,400 € 331,270,000,000 Four party French issuer, Foreign acquirer € 73,835,500 € 15,140,000,000
Three party French issuer, French acquirer € 9,147,180 € 24,340,000,000 Three party French issuer, Foreign acquirer € 2,593,910 € 1,720,000,000 Total € 186,051,990 € 372,470,000,000
Spain: .000224=2.24¢ per $100 transaction value Source: ServiRed, Annual Report, 2007.
UK: POS retailer fraud losses=total fraud losses in 2004*(APACS fraud on CNP transactions
for 2006/ APACS fraud on CNP transactions for 2004) = £14 million*(£72.1 million/£218.8 million) = £4.6 million
Online retailer fraud losses=total fraud losses in 2004*(APACS fraud on POS transactions for 2006/ APACS fraud on POS transactions for 2004)
= £14.1 million*(£212.7 million/£150.8 million) = £19.9 million
Fraud rate = (fraud losses reported by APACS + POS retailer fraud losses + Online retailer fraud losses) / (card purchase transaction value + value of ATM withdrawals)
.000912= (£427 million+£19.9 million+£4.6 million)/(£315.5 billion+£179.8 billion) =9.12¢ per $100 transaction value
Notes:
APACS reports only provide the value of fraud; the value of transactions is taken from separate reports on payment clearing and settlement. Levi, et. al. (2007, p. 24) states that
22
losses for transactions not fully authorized by card issuers are excluded from APACS data. They also report that in 2004 retail fraud losses not included in the APACS data amounted to £14.1 million for POS merchants and £14 million for CNP transactions. Because of the transition to chip-and-PIN payment cards, POS merchant card fraud declined, and CNP fraud increased, from 2004 to 2006. To get an estimate for 2006, the 2004 figures are adjusted using APACS data (from 2004 and 2006) for fraud on face-to-face and CNP transactions.
Sources:
Association for Payment Clearing Services (APACS), “Quarterly Statistical Release,” May 15, 2009.
APACS, “2008 Fraud Figures Announced by APACS,” Press Release March 19, 2008. Michael Levi, John Borrows, Mathew H. Fleming, and Matthew Hopkins, “The Nature
and Economic Impact of Fraud in the UK,” Report for the Association of Police Officers’ Economic Crime Portfolio, February 2007.
United States:
Card issuer losses on credit card transactions are the total value as reported by issuers. For other transactions, losses are calculated form loss rates on categories of payments (PIN debit, signature debit, and ATM transactions) multiplied the total value of these transactions.
Cards issuers: Credit card losses: $1.24 billion Debit and ATM cards: total losses=(PIN debit losses+signature debit losses+ATM withdrawal losses) $762 million = (.000085*$333 billion)+(.000505*$666 billion)+(.000686*$579 billion) Total credit, debit and ATM card loss=$2.0 billion=$1.24 billion+$762 million POS merchant: total losses=(PIN debit losses+signature debit losses+credit card losses) *share of card payments on cards issued by domestic financial institutions $0.829 billion = [(.0001*$333 billion)+(.0003*$666 billion)+(.0003*$2.1 trillion)]*0.96 Internet, mail order and telephone merchants: Total losses=Total Internet, mail order and telephone fraud loss* proportion of loss due to chargeback transactions $0.9 billion=$183 billion*.014*.35
Loss rate: ($2.0 billion+$0.829 billion+$0.9 billion)/ total value of debit and credit card .000924= $3.4 billion/$3.1 trillion value of credit and debit card transactions = 9.2¢ per $100 transaction value
Notes:
Loss rates are for actual debit and credit card fraud losses at domestic card issuing financial institutions, at POS retail establishments, and at Internet, mail order and
23
telephone merchants. Credit card loss are from “Credit Card Fraud—U.S.,” (2007). Debit card losses are based on a survey of debit card issuers (Pulse 2008). Debit card loss rates are an average of statistics reported for 2005 and 2007. The loss rates are applied to estimates of the value of PIN and signature debit card transactions for the United States (Gerdes 2008) to obtain total losses.
Losses for Internet, mail order and telephone merchants are found by applying a reported 1.4 percent loss rate on Internet sales (CyberSource 2007) to the overall sales for these merchants reported by the U.S. Census Bureau (2007). This results in $2.567 billion in payment fraud losses to Internet, mail order and telephone merchants. The CyberSource loss rate includes sales that the merchants did not accept because the transactions were suspicious. To obtain actual losses, I include 35 percent of the $2.567 billion, which represents the value of chargeback transactions. Losses for POS merchants are taken based on estimates of loss rates provided to the author by Steve Mott, the principal of BetterBuyDesign and an expert on payments who provides consulting services to merchants. Other sources of loss rate are similar but result in higher total losses than the rates provided by Mott (see McGrath and Kjos, footnote 22, p. 13; Mott 2007; and Taylor).
The estimates are for payment cards issued by domestic financial institutions, but some sales by U.S. merchants will be on payments cards issued by foreign financial institutions. According to the Bureau of Economic Analysis, foreign travelers in the U.S. spent $108 billion in 2006, which represents four percent of total card payments. Accordingly, the estimate for losses by POS merchants is reduced by 4 percent. This assumes foreign tourism and travel is purchased on payment cards and that the fraud rate for foreign and domestically issued cards is equal.
Sources:
“Credit Card Fraud—U.S.,” The Nilson Report, Issue 876, March 2007. Geoffrey R. Gerdes, “Recent Payment Trends in the United States,” Federal Reserve
Bulletin, October 2008, pp. A75-A106. CyberSource, Online Fraud Report, 2007. Steve Mott, “Why POS Merchants Don’t Buy in to Payment Security,” Digital
Transactions News, September 7, 2007, available at www.digitaltransactions.net/ newsstory.cfm?newsid=1503.
Office of Travel and Tourism Industries, “Annual 2006 U.S. Travel and Tourism Balance of Trade,” (http://tinet.ita.doc.gov/outreachpages/download_data_table/Balanceof Trade_1996-2006.pdf)
Pulse, “2008 Debit Issuer Study,” May 2008. U.S. Census Bureau, Annual Retail Trade Survey 2007. Taylor, Gray. “Card Payments: Global Key Data.” Presentation to the Association for
Convenience and Petroleum Retailing, 2009, p. 25. McGrath, James and Ann Kjos. “Information Security, Data Breaches, and Protecting
Cardholder Information: Facing Up to the Challenges.” Payment Cards Center, Federal Reserve Bank of Philadelphia, 2006.
24
References Anderson, Ross, Rainer Böhme, Richard Clayton, and Tyler Moore. “Security Economics
and the Internal Market.” Report to the European Network and Information Security Agency, 2008.
American Bankers Association. ABA Deposit Account Fraud Survey Report. 2009 edition.
Association of Financial Professionals. “2007 AFP Payments Fraud Survey.” March 2009.
Bradford, Terri, Fumiko Hayashi, Christian Hung, Simonetta Rosati, Richard J. Sullivan, Zhu Wang, and Stuart E. Weiner. “Nonbanks and Risk in Retail Payments: EU and U.S.” With In Managing Information Risk and the Economics of Security. Eric M. Johnson, ed. New York: Springer Publishing, 2009.
Braun, Michele, Jamie McAndrews, William Roberds and Richard J. Sullivan. “Understanding Risk Management in Emerging Retail Payments.” Economic Policy Review 14(2), Federal Reserve Bank of New York (September 2008), pp. 137-159.
Committee on Payment and Settlement Systems, Statistics on Payment and Settlement Systems in Selected Countries, Bank for International Settlements, September 2009.
CyberSource. “8th Annual Online Fraud Report.” 2007. _____. “11th Annual Online Fraud Report.” 2010. EC Staff Working Document. “Report on Cross-Border E-Commerce in the EU,” May 3,
2009. Foster, Kevin, Erik Meijer, Scott Schuh, and Michael A. Zabek. “The 2008 Survey of
Consumer Payment Choice.” Federal Reserve Bank of Boston, Public Policy Discussion Papers, No. 09-10.
Gerdes, Geoffrey. “Recent Payment Trends in the United States.” Federal Reserve Bulletin October 2008, pp. A75-A106.
Gorman, Siobhan and Evan Perez. “Hackers Indicted in Widespread ATM Heist.” The Wall Street Journal, November 11, 2009, p. A10.
Greenstein, Shane and Victor Stango. “Introduction.” In S. Greenstein and V. Stango, eds., Standards and Public Policy. Cambridge: Cambridge University Press, 2007, pp. 1-17.
Hernandez, Will. “Debate Lingers Over Definition Of 'End-To-End' Encryption.” ATM & Debit News, August 20, 2009, p. 1.
Hitachi Consulting, “2008 Study of Consumer Payment Preferences,” September 2008. ID Analytics. “National Data Breach Analysis.” 2006. Javelin Strategy and Research. “2009 Identity Fraud Survey Report.” February 2009. Leyden, John. “Merchants Call Credit Card Industry's Bluff on Compliance.” The
Register, June 24, 2008 (www.theregister.co.uk/2008/06/24/pci_dss_compliance). McGlasson, Linda. “Top 9 Breaches of 2009.” CU Info Security website, December 14,
2009 (www.cuinfosecurity.com/articles.php?art_id=2001&pg=1). Mandell, Lewis. The Credit Card Industry: A History. Boston: Twayne Publishers, 1990. Moore, Tyler, Richard Clayton, and Ross Anderson, “The Economics of Online Crime.”
Journal of Economic Perspectives 23(3) September 2009, pp. 3-20. Mott, Steve. “Why POS Merchants Don’t Buy in to Payment Security,” Digital
Transactions News, September 7, 2007, available at www.digitaltransactions.net/ newsstory.cfm?newsid=1503.
25
Observatory for Payment Card Security (OPCS), Annual Report, 2007. Perkins Coie. “Security Breach Notification Chart.” 2009. Available at www.perkinscoie
.com/files/ upload/LIT_09-09_Security_Breach_Notification_Law_Chart.pdf. Poulse, Kevin, “Credit Card Skimming Survey: What’s Your Magstripe Worth?” Wired
Magazine Threat Level blog, October 2, 2009 (www.wired.com/threatlevel/2009/10/ florida_skimming).
Roberds, William and Stacy Schreft, “Data Breaches and Identity Theft.” Federal Reserve Bank of Atlanta working paper 2008-22, September 2008.
_____, “Data Security, Privacy, and Identity Theft: The Economics Behind the Policy Debates.” Federal Reserve Bank of Chicago Economic Perspectives, 1st Quarter 2009, 22-30.
Simpson, John. “Security of Payments: A Retailer’s Viewpoint.” British Retail Consortium, 2003 (ec.europa.eu/internal_market/payments/docs/fraud/2003-conference/secure-pay-retailers_en.pdf).
Singel, Ryan, “Probe Targets Archives’ Handling of Data on 70 Million Vets.” Wired Magazine Threat Level blog, October 1, 2009 (http://www.wired.com/threatlevel/ 2009/10/probe-targets-archives-handling-of-data-on-70-million-vets/).
Smart Card Alliance, “End-to-End Encryption and Chip Cards in the U.S. Payments Industry,” September 2009 (www.smartcardalliance.org/resources/pdf/End-toEnd_ Encryption_Position Paper_090809.pdf).
Stearns, David. “In Plastic We Trust: Dependability and the Visa Payment System.” Paper presented at the DIRCshop Conference, April 10-11, 2006.
Steinfeld, Charles W., Rolf T. Wigand, M. Lynne Markus, and Gabe Minton. “Promoting E-business Through Vertical IS Standards: Lessons from the US Home Mortgage Industry. Chapter 5 in S. Greenstein and V. Stango, eds., Standards and Public Policy. Cambridge: Cambridge University Press, 2007, pp. 160-207.
Sullivan, Richard J. “Risk Management and Nonbank Participation in the U.S. Retail Payments System.” Economic Review 92(2), Federal Reserve Bank of Kansas City (Second Quarter 2007), pp. 5-40.
_____. “Can Smart Cards Reduce Payments Fraud and Identity Theft?” Economic Review 93(3), Federal Reserve Bank of Kansas City (Third Quarter 2008), pp. 35-62.
_____. "The Benefits of Collecting and Reporting Payment Fraud Statistics for the United States," Payment System Research Briefing, Federal Reserve Bank of Kansas City, October 2009.
Symantec. “Global Internet Security Threat Report.” April 2009. Available at eval.symantec.com/ mktginfo/enterprise/white_papers/b-whitepaper_internet_ security_threat_report_xiv_04-2009.en-us.pdf.
Taylor, David. “Data Security Slugfest: Tokenization Vs End-to-End Encryption.” Storefront Backtalk website, April 15th, 2009 (www.storefrontbacktalk.com/supply-chain/data-security-slugfest-tokenization-vs-end-to-end-encryption/#comments).
Tedder, Krista, “Now You See It, Now You Don’t: A Review of Fraud Costs and Trends.” First Data Corporation White Paper 2009 (http://www.firstdata.com/ downloads/thought-leadership/ fd_fraudcostsandtrends_whitepaper.pdf).
UK Cards Association, “New Card and Banking Fraud Figures,” Press release March 10, 2010, (www.theukcardsassociation.org.uk/media_centre/press_releases_new//page/ 922/).
26
UK Payments Council, UK Payment Statistics, 2009. Vijayan, Jaikumar. “Heartland data breach could be bigger than TJX's.”
ComputerWorld.com, January 20, 2009 ( //www.computerworld.com/action/ article.do?command=viewArticleBasic&articleId =9126379&intsrc=news_ts_head).
Visa. “U.S. PCI DSS Compliance Status.” September 30, 2009. Weiner, Stuart E. “The Federal Reserve's Role in Retail Payments: Adapting to a New
Environment.” Economic Review 93(4), Federal Reserve Bank of Kansas City (Fourth Quarter 2008), pp. 35-63.
Wolfe, Daniel. “New Security Focus Goes Beyond PCI.” American Banker, March 24, 2009, p. 1.
Zetter, Kim. “TJX Hacker Charged With Heartland, Hannaford Breaches.” Threatlevel blog, August 17, 2009 (http://www.wired.com/threatlevel/2009/08/tjx-hacker-charged-with-heartland/).