Embed Size (px)
Citation preview
This article was downloaded by: [Memorial University of Newfoundland]On: 31 July 2014, At: 19:44Publisher: RoutledgeInforma Ltd Registered in England and Wales Registered Number: 1072954 Registered office: Mortimer House, 37-41 Mortimer Street, London W1T 3JH, UK
Communication Research ReportsPublication details, including instructions for authors and subscription information:http://www.tandfonline.com/loi/rcrr20
The changing media environment of presidential campaignsWilliam L. Benoit a & Glenn J. Hansen ba Department of Communication , Professor at the University of Missouri , 115 Switzler Hall, Columbia, MO, 65211–2310 E-mail:b Assistant Professor at the University of OklahomaPublished online: 06 Jun 2009.
To cite this article: William L. Benoit & Glenn J. Hansen (2004) The changing media environment of presidential campaigns, Communication Research Reports, 21:2, 164-173, DOI: 10.1080/08824090409359978
To link to this article: http://dx.doi.org/10.1080/08824090409359978
PLEASE SCROLL DOWN FOR ARTICLE
Taylor & Francis makes every effort to ensure the accuracy of all the information (the “Content”) contained in the publications on our platform. However, Taylor & Francis, our agents, and our licensors make no representations orwarranties whatsoever as to the accuracy, completeness, or suitability for any purpose of the Content. Any opinions and views expressed in this publication are the opinions and views of the authors, and are not the views of orendorsed by Taylor & Francis. The accuracy of the Content should not be relied upon and should be independently verified with primary sources of information. Taylor and Francis shall not be liable for any losses, actions, claims,proceedings, demands, costs, expenses, damages, and other liabilities whatsoever or howsoever caused arising directly or indirectly in connection with, in relation to or arising out of the use of the Content.
This article may be used for research, teaching, and private study purposes. Any substantial or systematic reproduction, redistribution, reselling, loan, sub-licensing, systematic supply, or distribution in any form to anyone is expresslyforbidden. Terms & Conditions of access and use can be found at http://www.tandfonline.com/page/terms-and-conditions
The Changing Media Environment of Presidential Campaigns
William L. BenoitUniversity of Missouri
Glenn J. HansenUniversity of Oklahoma
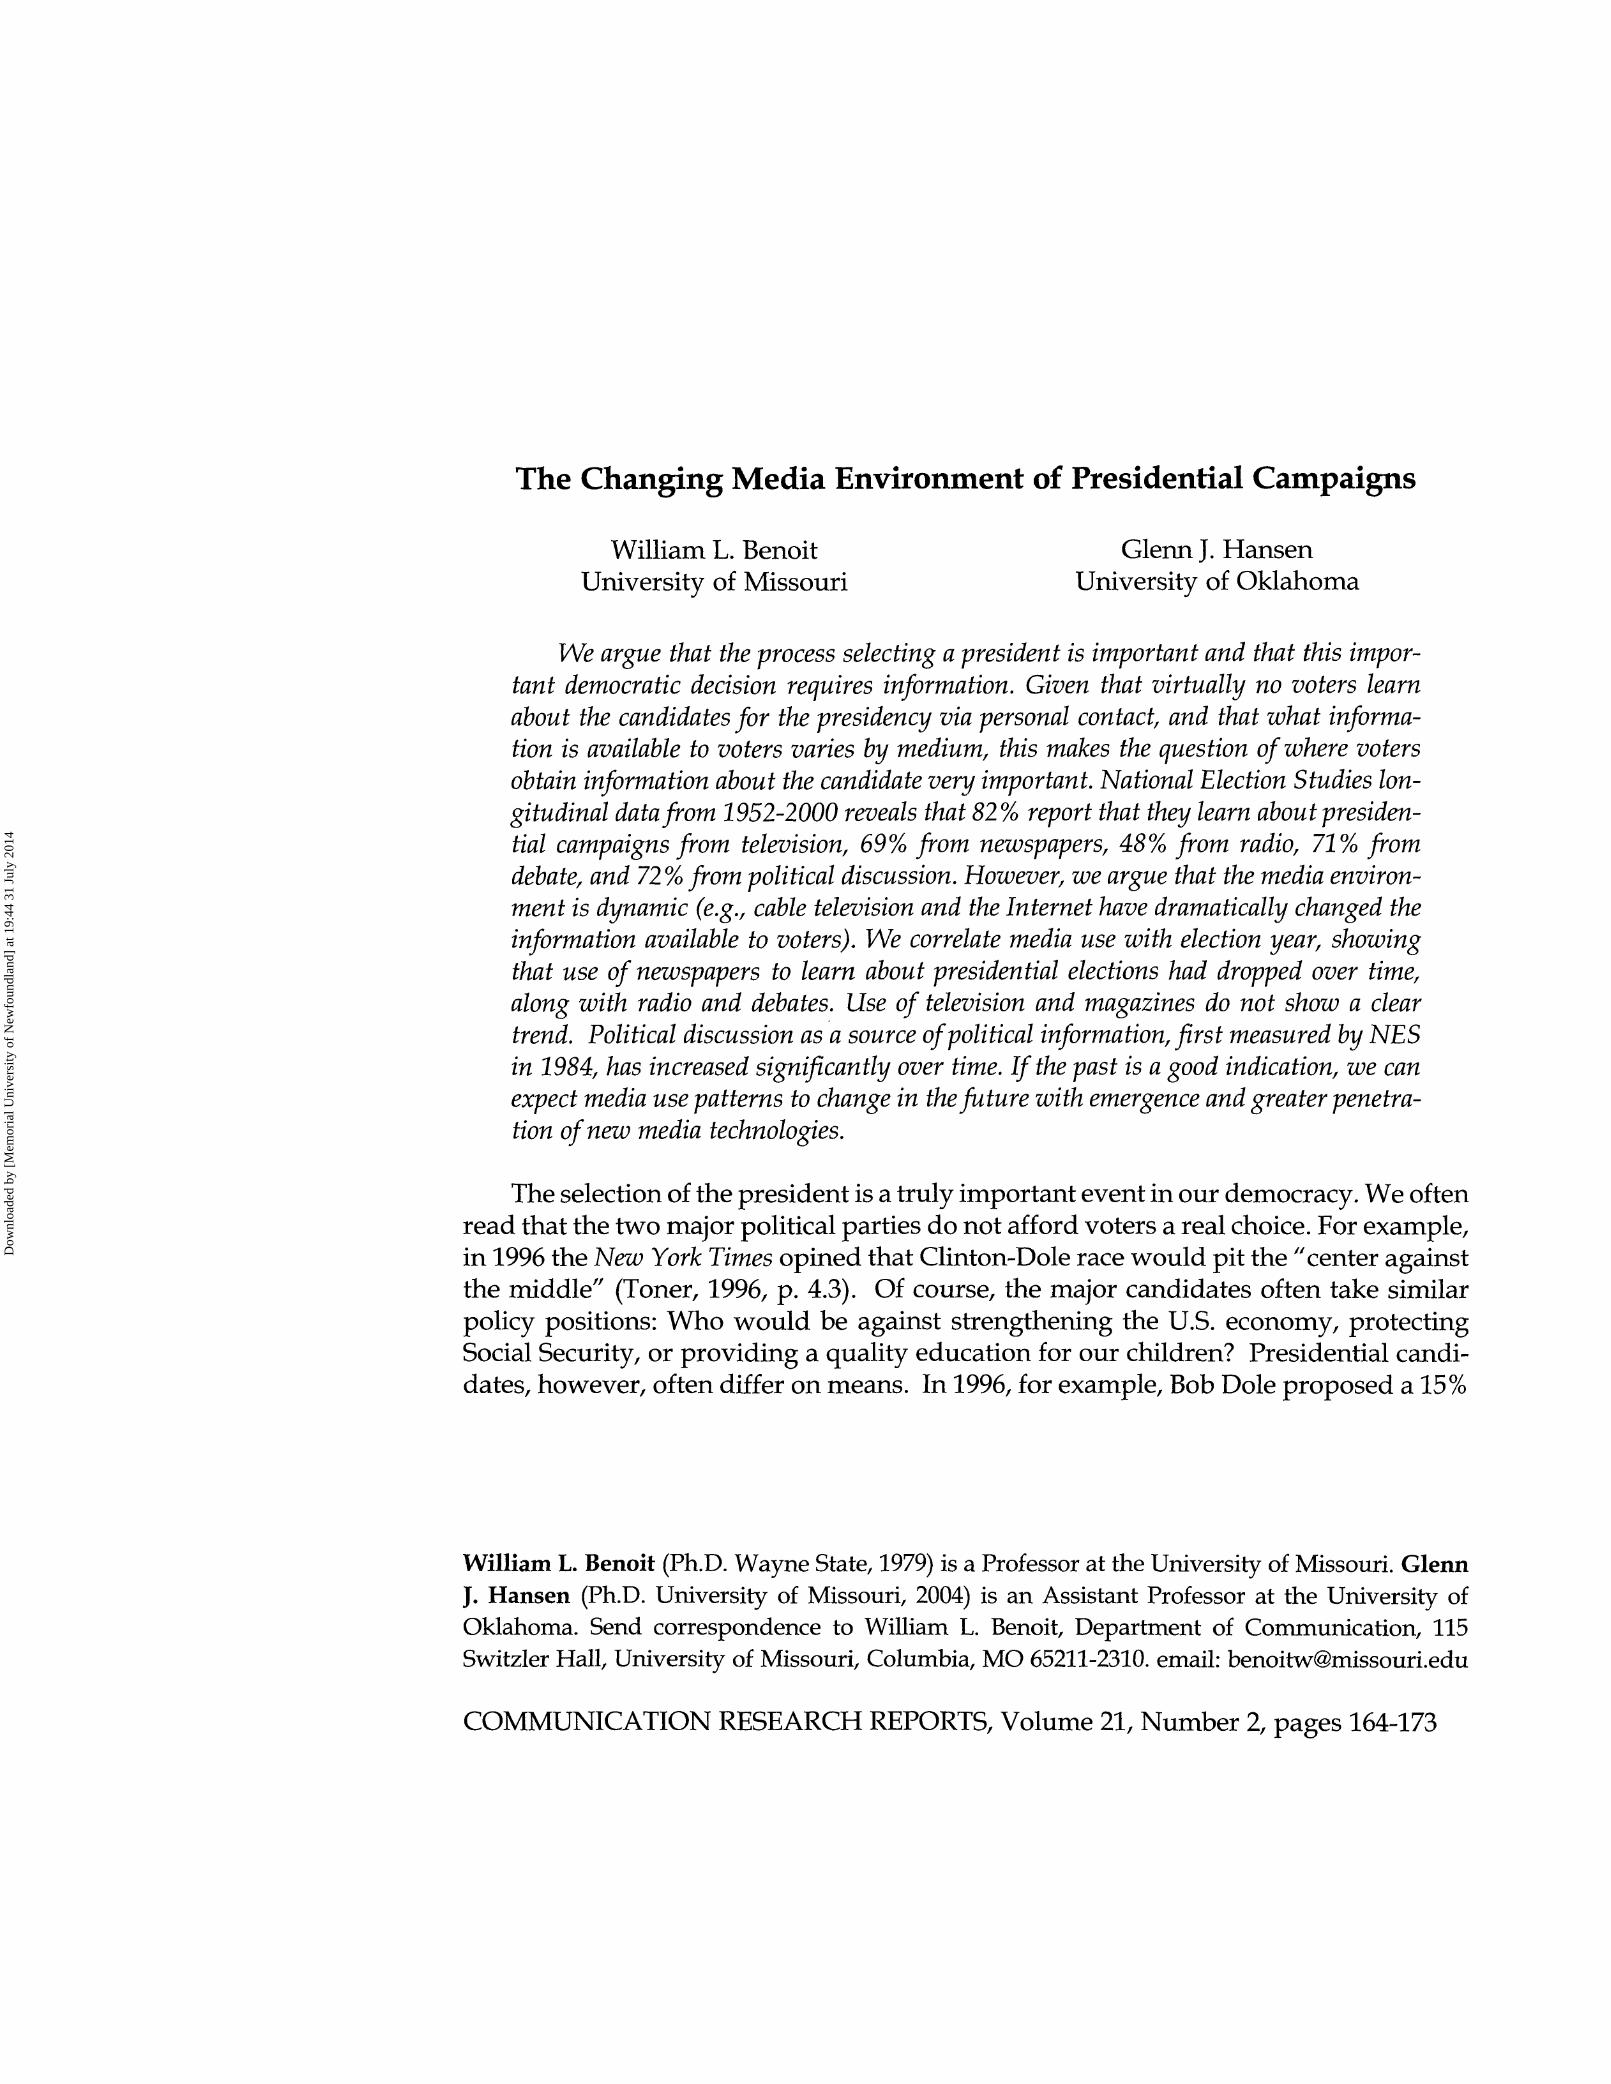
We argue that the process selecting a president is important and that this impor-tant democratic decision requires information. Given that virtually no voters learnabout the candidates for the presidency via personal contact, and that what informa-tion is available to voters varies by medium, this makes the question of where votersobtain information about the candidate very important. National Election Studies lon-gitudinal data from 1952-2000 reveals that 82% report that they learn about presiden-tial campaigns from television, 69% from newspapers, 48% from radio, 71% fromdebate, and 72% from political discussion. However, we argue that the media environ-ment is dynamic (e.g., cable television and the Internet have dramatically changed theinformation available to voters). We correlate media use with election year, showingthat use of newspapers to learn about presidential elections had dropped over time,along with radio and debates. Use of television and magazines do not show a cleartrend. Political discussion as a source of political information, first measured by NESin 1984, has increased significantly over time. If the past is a good indication, we canexpect media use patterns to change in the future with emergence and greater penetra-tion of new media technologies.
The selection of the president is a truly important event in our democracy. We oftenread that the two major political parties do not afford voters a real choice. For example,in 1996 the New York Times opined that Clinton-Dole race would pit the "center againstthe middle" (Toner, 1996, p. 4.3). Of course, the major candidates often take similarpolicy positions: Who would be against strengthening the U.S. economy, protectingSocial Security, or providing a quality education for our children? Presidential candi-dates, however, often differ on means. In 1996, for example, Bob Dole proposed a 15%
William L. Benoit (Ph.D. Wayne State, 1979) is a Professor at the University of Missouri. GlennJ. Hansen (Ph.D. University of Missouri, 2004) is an Assistant Professor at the University ofOklahoma. Send correspondence to William L. Benoit, Department of Communication, 115Switzler Hall, University of Missouri, Columbia, MO 65211-2310. email: [email protected]
COMMUNICATION RESEARCH REPORTS, Volume 21, Number 2, pages 164-173
Dow
nloa
ded
by [
Mem
oria
l Uni
vers
ity o
f N
ewfo
undl
and]
at 1
9:44
31
July
201
4
Changing Media of Presidential Campaigns -165
across-the-board tax cut whereas Bill Clinton advocated selected tax cuts. In 2000,George Bush and Al Gore disagreed on "privatizing" Social Security and on privateschool vouchers. In short, despite some important similarities between candidates, theseexamples make it clear that it does make a difference who is elected president.
This raises the question of where voters learn about the candidates and their policypositions (what medium or media inform voters). In 2000, Vice President Al Gore wasovershadowed by President Bill Clinton and George W. Bush was not well-known out-side the state in which he was Governor. Many voters are not "political junkies" whoavidly seek out information about the candidates; they learn about the campaign fromwhatever information they happen to encounter before election day. Where did voterslearn enough about Bush and Gore, for example, to make a voting decision?
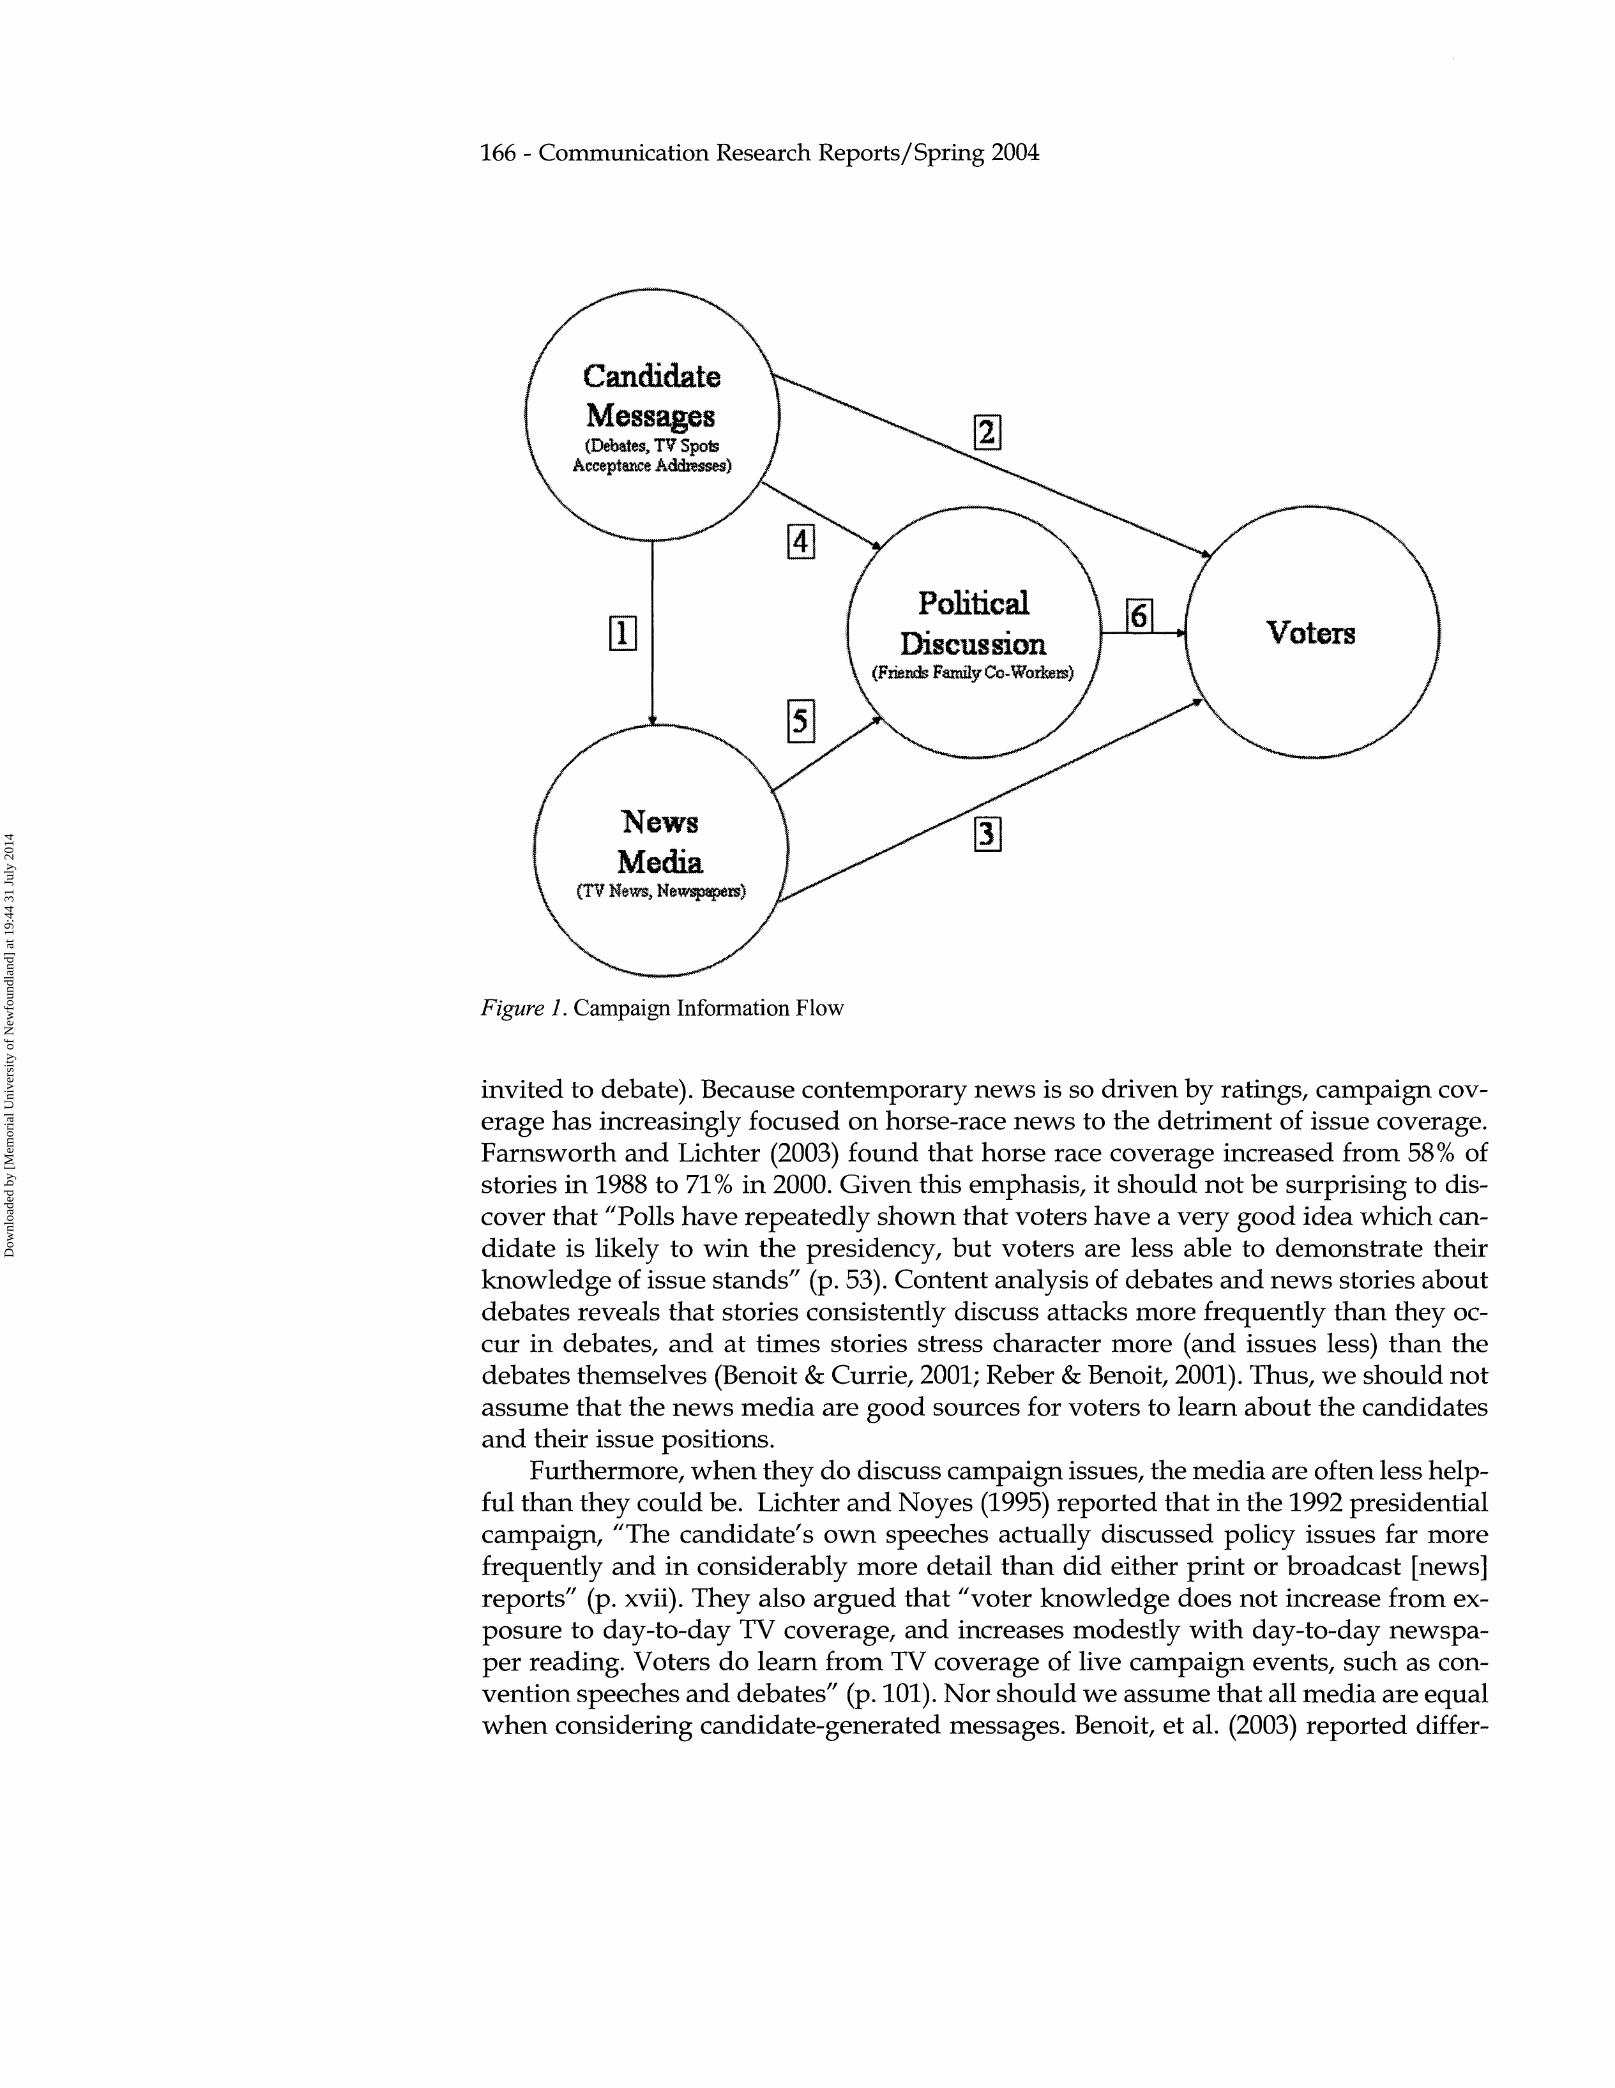
Figure 1 presents a simplified model of the campaign information process. Today,few voters learn about presidential candidates from direct (interpersonal) contact withnominees. The Census Bureau estimates that 212 million Americans are old enough tovote (2003); clearly no appreciable number can learn about the candidates for the presi-dency from direct contact with candidates. Instead, they learn about candidates throughmediated messages from candidates (e.g., television spots, debates, speeches, path 2)and from news media (e.g., newspapers, television news - and as noted in the Discus-sion, even from television talk shows and entertainment television, path 3). Some vot-ers learn second-hand, by talking with other voters who learned from candidate mes-sages and/or the news media (the path through political discussion, path 4 and/or 5 topath 6). The news media sometimes passes along information from candidates (path 1)and sometimes the news generate their own messages (which is why both candidatemessages and news media are represented on the left side of a model that moves fromleft to right).
It should be obvious that different voters are exposed to different sources of infor-mation. For example, in 2000 some voters watched the first presidential debate, somewatched only the second (or third), some watched all three debates, and others watchednone of the debates. Some voters access candidate webpages but others do not. Someviewers will see one television spot (and some will see it repeatedly), others will viewother spots. Some voters read a national or local newspaper, some read both, others donot read political news in the paper. Of course, some who read a national news paperfor political news read the New York Times whereas others opt for USA Today. Similarly,some voters watch local television news, some watch national news, others watch nopolitical news. Again, those who watch news could watch news on ABC, CBS, NBC(and in addition to these choices at the national level, we add CNN, HNN, MSNBC,CNBC, and FoxNews). Some watch the news (or read newspapers) every day, but oth-ers do so irregularly. Some discuss politics frequently, some occasionally, and somenever. The combinations are endless. But the point is that voters are exposed to (andhave the potential to learn from) a variety of candidate and news information sources(we also note the existence of interest groups, like the NRA, which also disseminateinformation).
The question of which sources voters use is an important question because differ-ent media provide different information to voters. The news media, for example, arewell-known for their proclivity to emphasize the drama of the "horse race" (who isahead in fund raising or tracking polls, who is contesting which states, who will be
Dow
nloa
ded
by [
Mem
oria
l Uni
vers
ity o
f N
ewfo
undl
and]
at 1
9:44
31
July
201
4
166 - Communication Research Reports/Spring 2004
CandidateMessages(Debates, T¥ Spats
PoliticalVotersDiscussion
iNewsMedia
Figure 1. Campaign Information Flow
invited to debate). Because contemporary news is so driven by ratings, campaign cov-erage has increasingly focused on horse-race news to the detriment of issue coverage.Farnsworth and Lichter (2003) found that horse race coverage increased from 58% ofstories in 1988 to 71% in 2000. Given this emphasis, it should not be surprising to dis-cover that 'Tolls have repeatedly shown that voters have a very good idea which can-didate is likely to win the presidency, but voters are less able to demonstrate theirknowledge of issue stands'' (p. 53). Content analysis of debates and news stories aboutdebates reveals that stories consistently discuss attacks more frequently than they oc-cur in debates, and at times stories stress character more (and issues less) than thedebates themselves (Benoit & Currie, 2001; Reber & Benoit, 2001). Thus, we should notassume that the news media are good sources for voters to learn about the candidatesand their issue positions.
Furthermore, when they do discuss campaign issues, the media are often less help-ful than they could be. Lichter and Noyes (1995) reported that in the 1992 presidentialcampaign, "The candidate's own speeches actually discussed policy issues far morefrequently and in considerably more detail than did either print or broadcast [news]reports" (p. xvii). They also argued that "voter knowledge does not increase from ex-posure to day-to-day TV coverage, and increases modestly with day-to-day newspa-per reading. Voters do learn from TV coverage of live campaign events, such as con-vention speeches and debates" (p. 101). Nor should we assume that all media are equalwhen considering candidate-generated messages. Benoit, et al. (2003) reported differ-
Dow
nloa
ded
by [
Mem
oria
l Uni
vers
ity o
f N
ewfo
undl
and]
at 1
9:44
31
July
201
4
Changing Media of Presidential Campaigns - 167
ent issues were stressed in different message forms in the 2000 campaign forms. Forexample, the three most frequently discussed issues in Bush's television spots were theeconomy, health care, and Social Security. In the debates, he most often discussed na-tional defense, taxes, and education. Different messages (media) contain different in-formation, so it matters where voters obtain their information about the candidates forthe Oval Office.
Recent research has investigated the relative impact of various media on voters'issue knowledge. Brians and Wattenberg (1996), using data from the National ElectionStudies (NES) database, found that voters in 1992 learned more about the issue posi-tions of the presidential candidates from television spots than from newspapers or tele-vision news. Holbert, Benoit, Hansen, and Wen (2002) replicated this design with NESdata from the 1996 presidential campaign. Television spots, debates, and political dis-cussion were significantly related with issue knowledge, whereas newspaper and tele-vision news use were not. In the 2000 presidential campaign, Benoit, Hansen, and Holbert(2002) found significant relationships between issue knowledge and debates, radio lis-tening, and watching television news, but not with newspaper reading or political dis-cussion. This research suggests that the media environment is both complex and dy-namic. However, while these studies provide a detailed understanding of the relation-ships among various media in a given election, they do not provide a longitudinalexamination of voters' reliance on various media.
A CHANGING MEDIA ENVIRONMENTNES data (2003) indicate that 82% of respondents in national surveys of voters
from 1952-2000 report that they learn about presidential campaigns from television,69% from newspapers, 48% from radio, 71% from debate, and 72% from political dis-cussion (the latter measured from 1984-2000). But are these figures for media use con-sistent over time? We argue that the media environment of today is much differentfrom the one that existed earlier. Take presidential debates as an example. The researchis clear that those who watch debates learn about the candidates' issue positions (Benoit,Hansen, & Verser, 2003). Up through 1992 the presidential debates typically werewatched by some 60 million viewers (the lone exception is 1980, when the sole debatebetween the Republican and Democratic candidates attracted 80 million viewers).However, the Commission on Presidential Debates (2002) reports that debate viewershipdropped sharply for the two debates in 1996 (46.1 and 36.3 million) and the three in2000 (46.6,37.5, and 37.7 million). Why the sharp drop-off? It seems likely one factor isthat viewers had much less choice about watching the debates in the past. All threenetworks broadcast presidential debates, and in earlier years viewers simply had fewother options. The VHS tape recorder was not invented until 1976 and even by 1980only 1% of US households owned VCRs. Not until 1987 did VCR penetration surpass50% (WSIU, 2002). CNN was launched in 1980; even in 1995 the penetration of cablewas only 64%, not quite 2/3 of homes (WSIU, 2002). Satellite TV, DVDs, and the Internetare more recent innovations not available as alternatives to watching debates in the1960s, 1970s, 1980s, and much of the 1990s. Thus, it seems likely that one reason fewervoters watch debates in recent years is that there are many more (media) options avail-able to them than in earlier campaigns. Going beyond debate, some of these relativelynew technologies (cable TV, the Internet) provide alternate sources of information about
Dow
nloa
ded
by [
Mem
oria
l Uni
vers
ity o
f N
ewfo
undl
and]
at 1
9:44
31
July
201
4
168 - Communication Research Reports/Spring 2004
the presidential campaign that now compete with newspapers and television news. Inshort, as technology and media have evolved, the sources of information available tovoters, and voters' uses of those media may have shifted as well. Ample reason existsto investigate voters' use of information sources longitudinally.
PURPOSEThis study investigates the question of whether there are trends in use of media to
obtain information about the election. National NES survey data from 1952-2000 re-ports which sources of information citizens report they use to learn about the presiden-tial campaign. We correlate these data with year of campaign to identify possible trendsin media use over time.
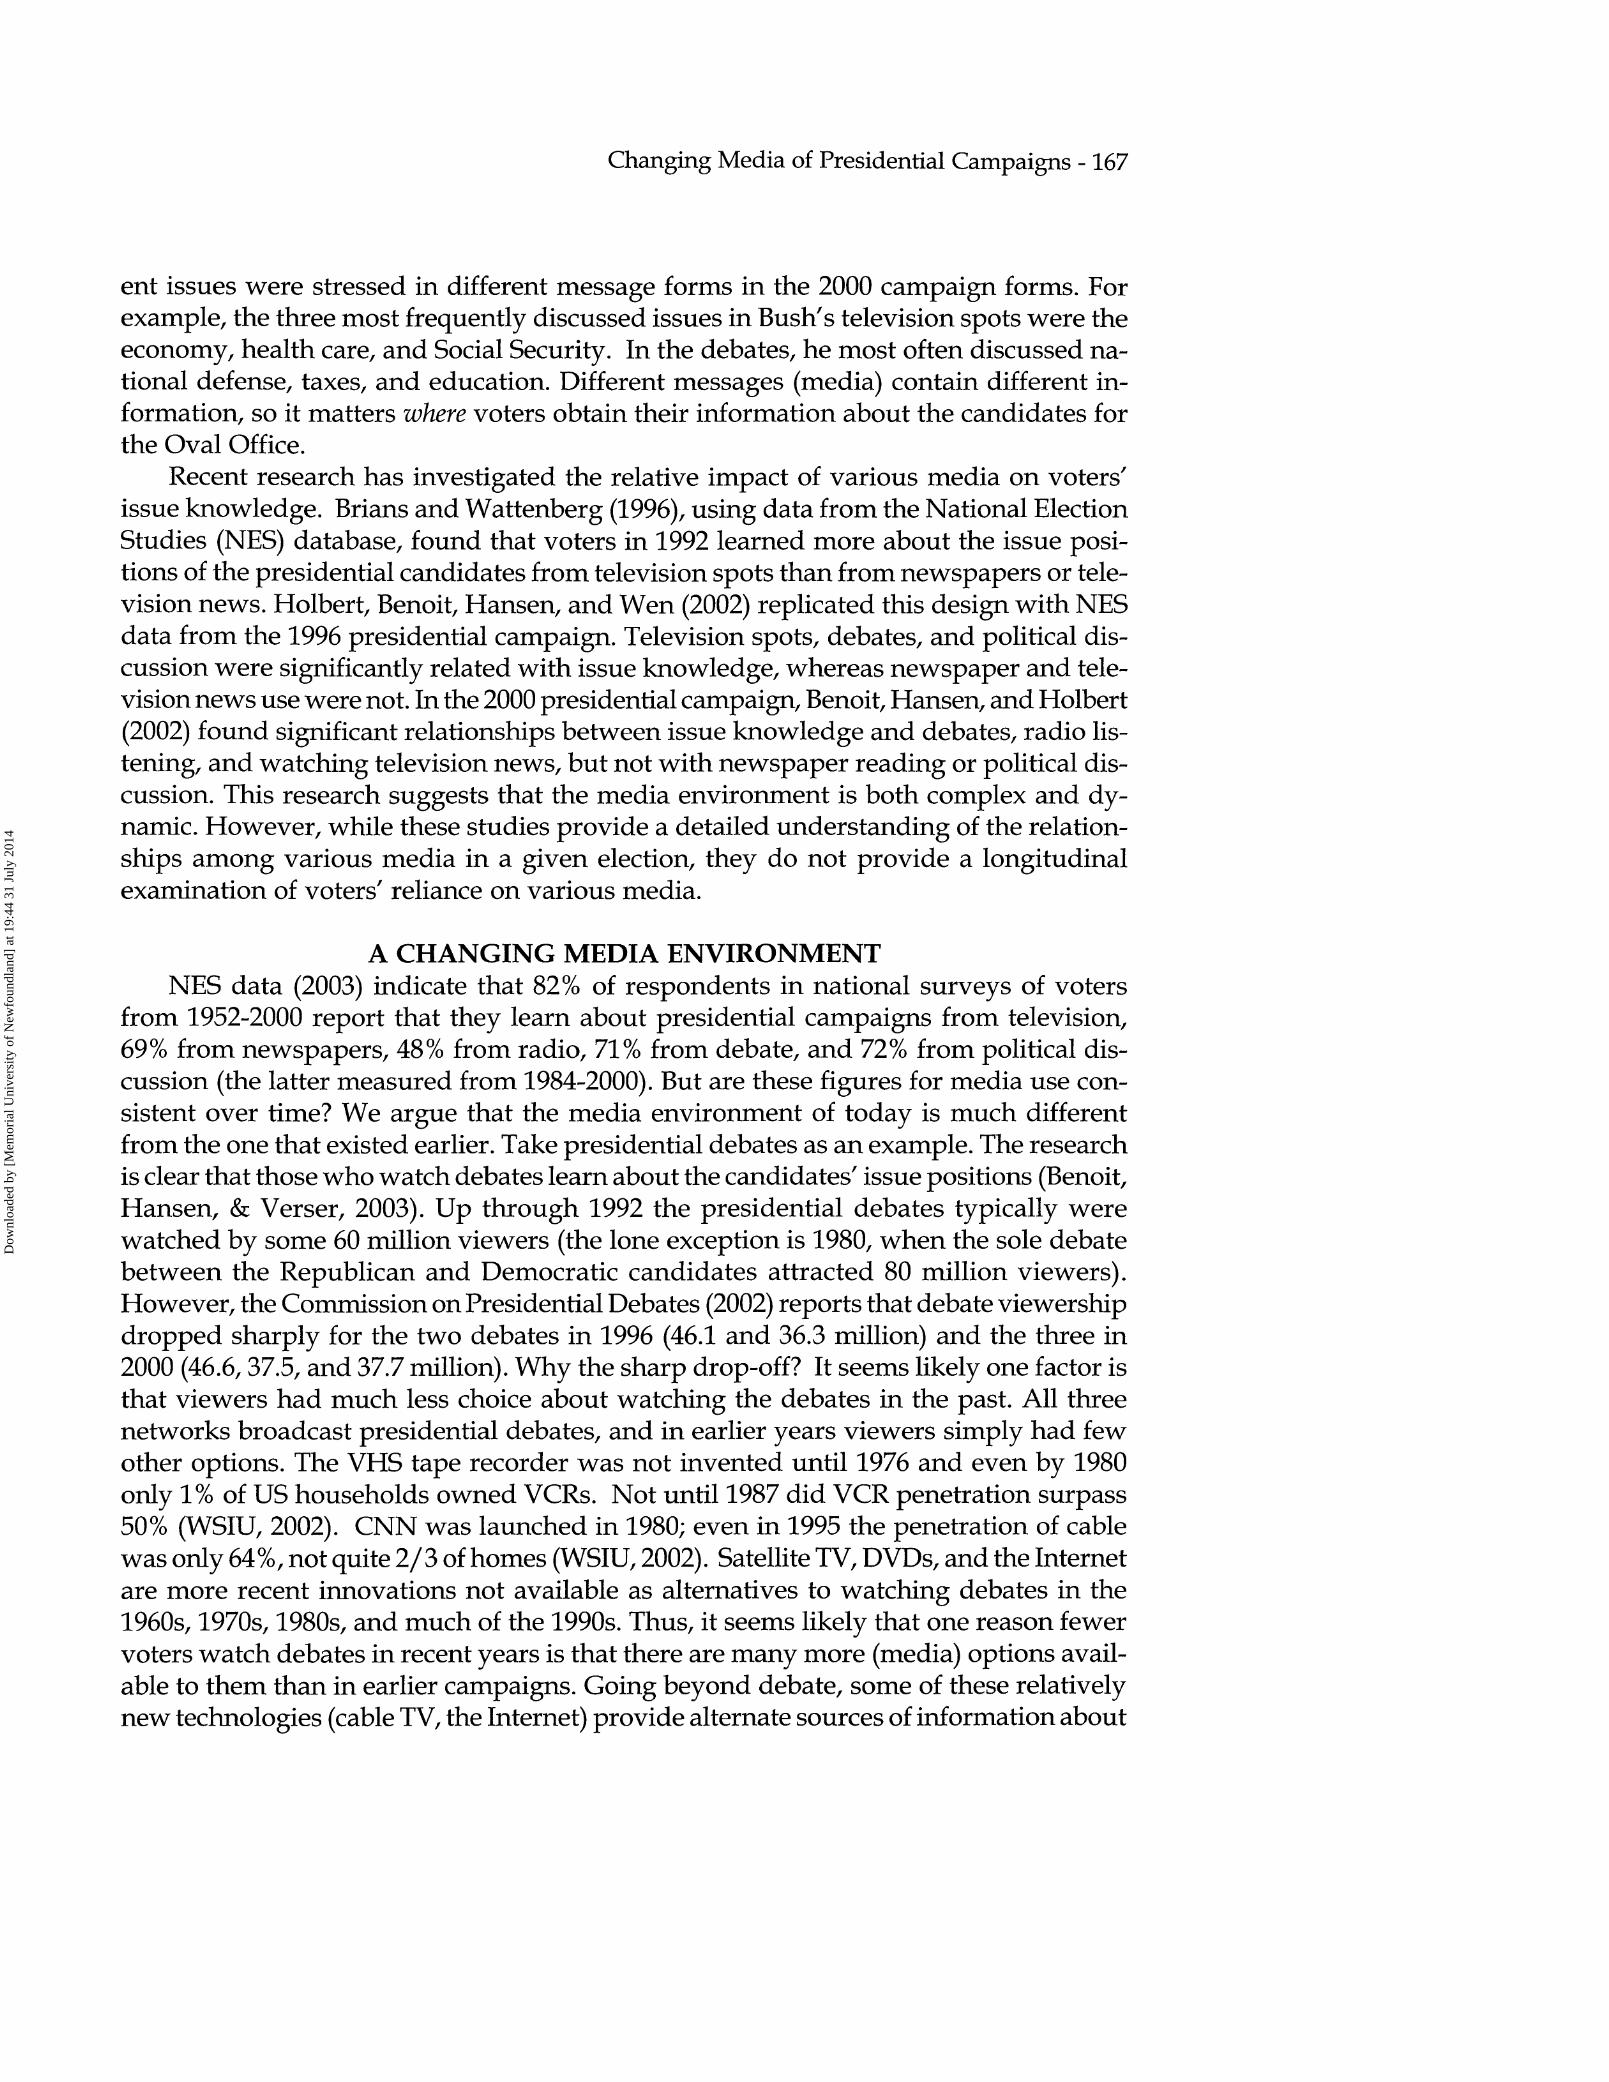
These data were collected by the National Election Studies (Center for PoliticalStudies at the University of Michigan-Ann Arbor). The data are obtained from in-per-son interviews (NES has also experimented with telephone interviews) of a cross sec-tion of voting aged citizens living in households within the United States. The totalnumber of participants is 28,322 (Table 1 reports the n for each year).
TABLE 1Use of Media to Learn about the Presidential Campaign, 1952-2000
Newspapers Magazines Radio Television Debates Discussion Contact byParty
Year n
1952 18991956 17621960 19541964 18341968 16731972 27051976 28701980 16141984 22571988 37481992 24851996 17142000 1807Mean %
7969807975577371776465555669%
403141393633483535252332
35%
7045424841434547453137383844%
5174878989558986868789748280%
91
837063
516971%
676471788172%
2226252928242424202636
25.8%
Source: NES (2003)
Although the wording of the questions varies somewhat from year to year, theserepresent the questions asked of respondents:
Did you read about the campaign in any newspapers?Did you read about the campaign in any magazines?Did you listen to any speeches or discussions about the campaign on the radio?Did you watch any programs on television about the campaign?Did you watch one of the presidential debates?Do you ever discuss politics with your family or friends?Did anyone from either of the political parties call you up or come around and talkto you about the campaign?
Dow
nloa
ded
by [
Mem
oria
l Uni
vers
ity o
f N
ewfo
undl
and]
at 1
9:44
31
July
201
4
Changing Media of Presidential Campaigns - 169
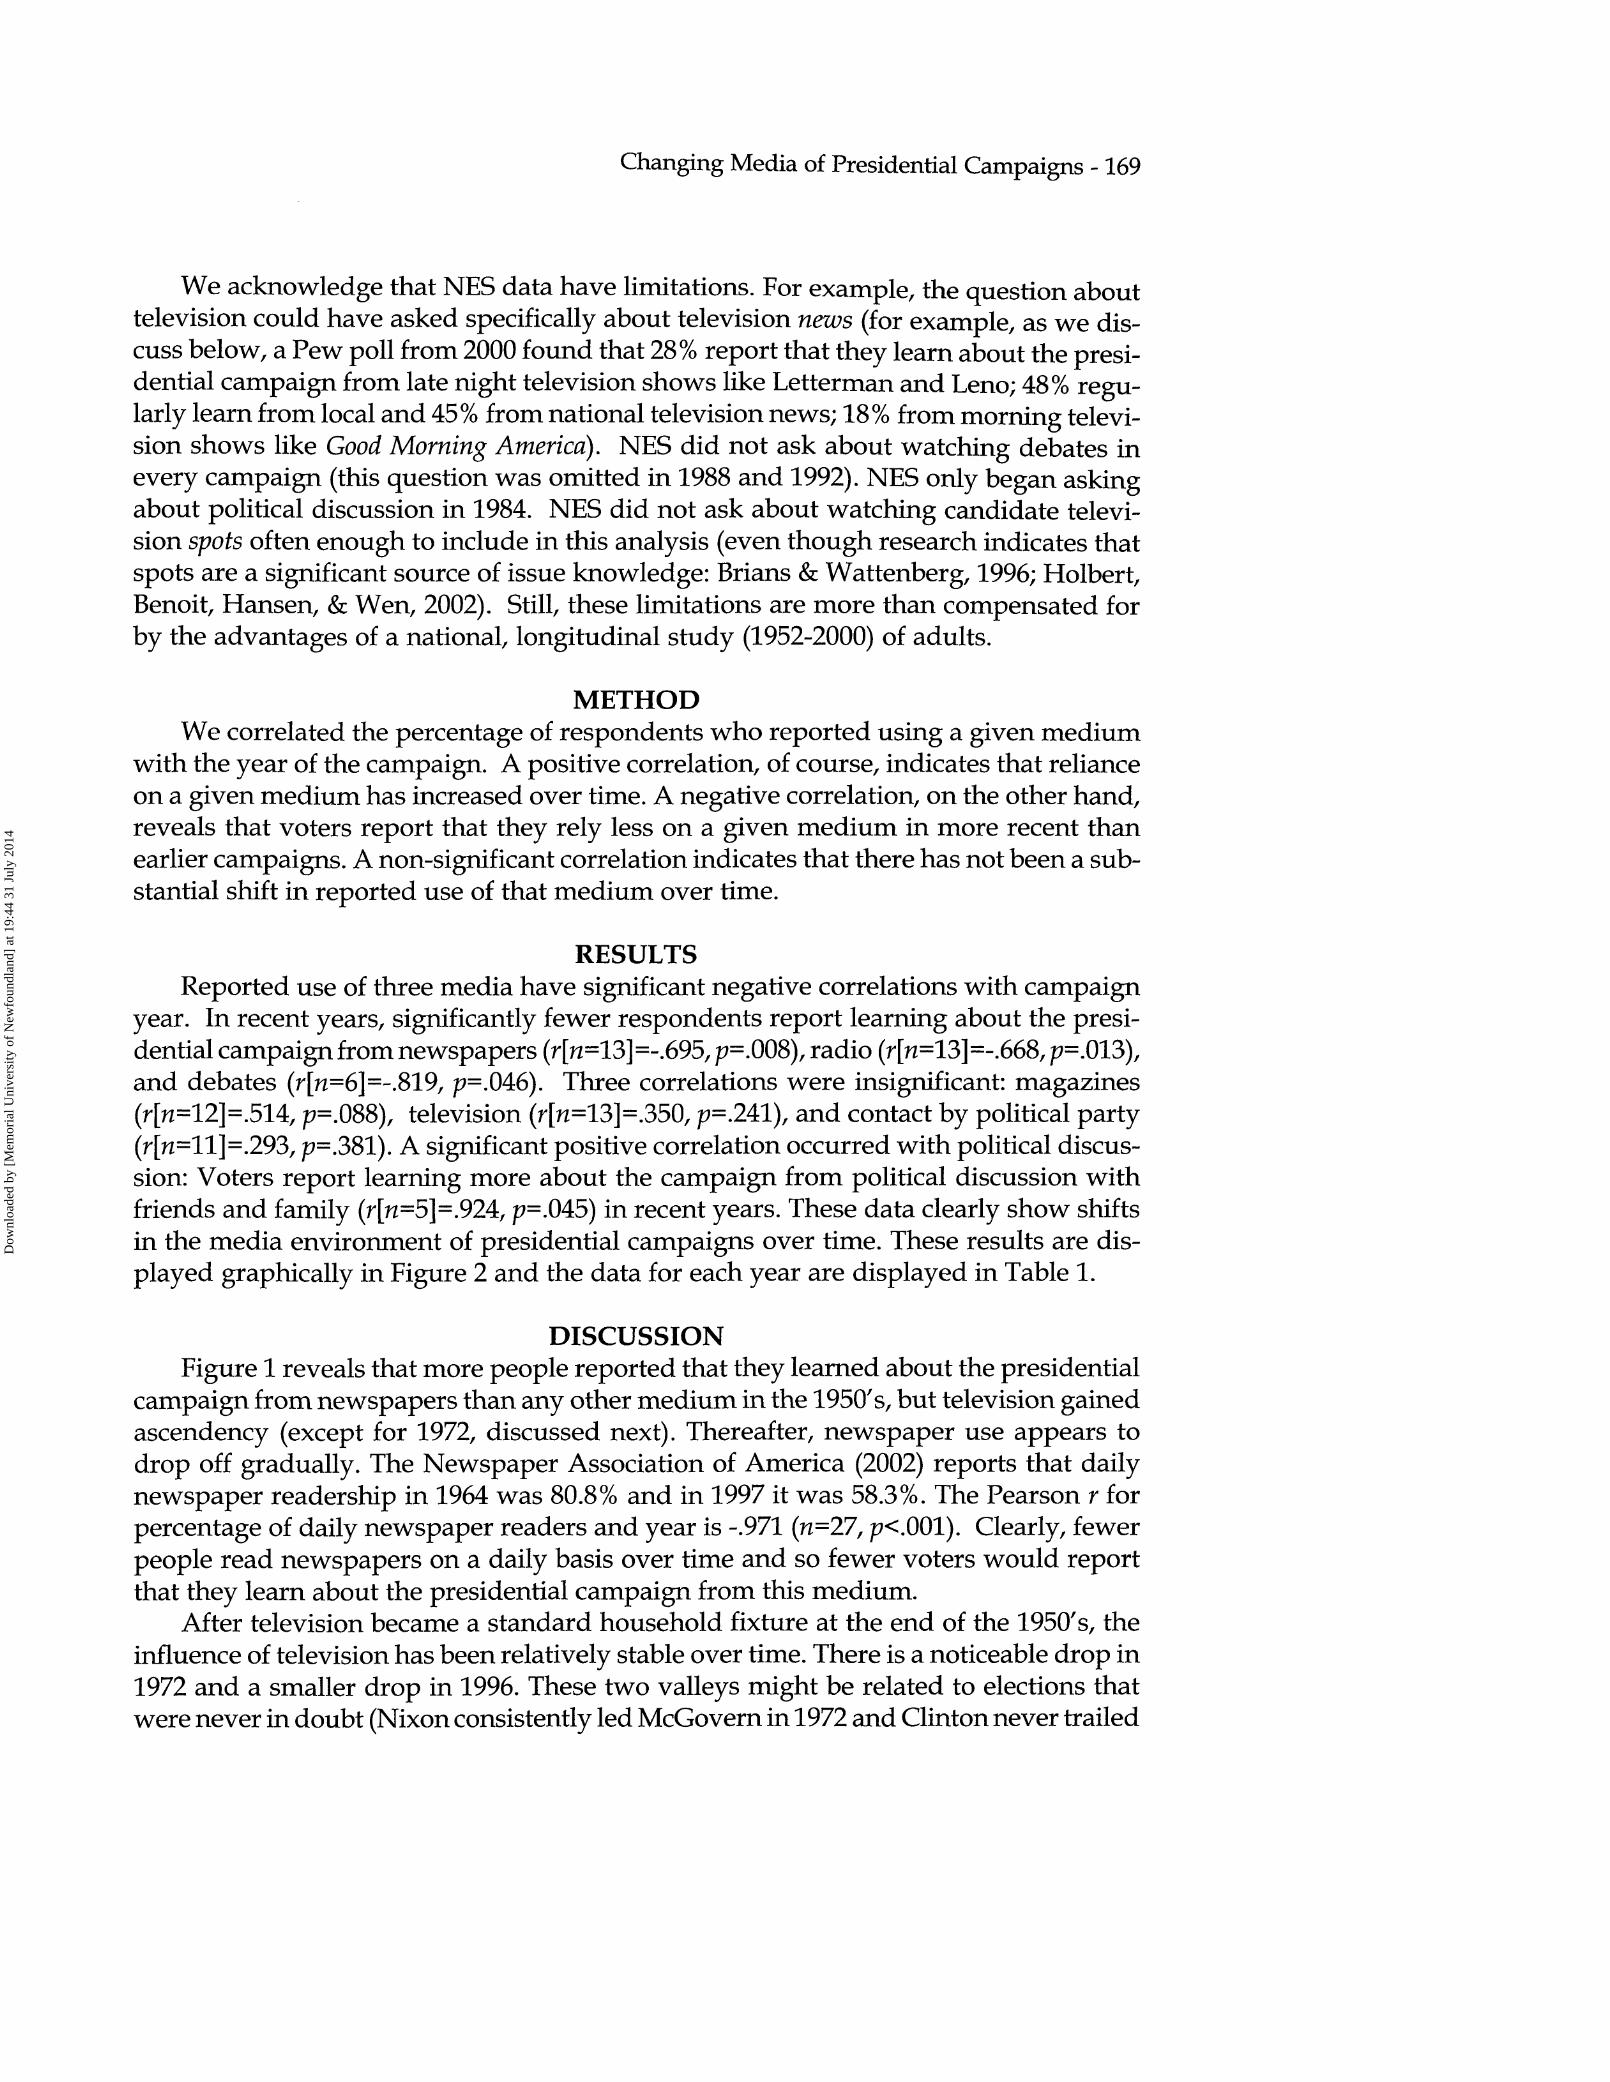
We acknowledge that NES data have limitations. For example, the question abouttelevision could have asked specifically about television news (for example, as we dis-cuss below, a Pew poll from 2000 found that 28% report that they learn about the presi-dential campaign from late night television shows like Letterman and Leno; 48% regu-larly learn from local and 45% from national television news; 18% from morning televi-sion shows like Good Morning America). NES did not ask about watching debates inevery campaign (this question was omitted in 1988 and 1992). NES only began askingabout political discussion in 1984. NES did not ask about watching candidate televi-sion spots often enough to include in this analysis (even though research indicates thatspots are a significant source of issue knowledge: Brians & Wattenberg, 1996; Holbert,Benoit, Hansen, & Wen, 2002). Still, these limitations are more than compensated forby the advantages of a national, longitudinal study (1952-2000) of adults.
METHODWe correlated the percentage of respondents who reported using a given medium
with the year of the campaign. A positive correlation, of course, indicates that relianceon a given medium has increased over time. A negative correlation, on the other hand,reveals that voters report that they rely less on a given medium in more recent thanearlier campaigns. A non-significant correlation indicates that there has not been a sub-stantial shift in reported use of that medium over time.
RESULTSReported use of three media have significant negative correlations with campaign
year. In recent years, significantly fewer respondents report learning about the presi-dential campaign from newspapers (r[n=13]=-.695, p=.008), radio (r[n=13]=-.668, p=.O13),and debates (r[n=6]=-.819, p=.O46). Three correlations were insignificant: magazines(r[n=12]=.514, p=.O88), television (r[n=13]=.35O, p=.241), and contact by political party(r[n=ll]=.293, p=.381). A significant positive correlation occurred with political discus-sion: Voters report learning more about the campaign from political discussion withfriends and family (r[n=5]=.924, p=.O45) in recent years. These data clearly show shiftsin the media environment of presidential campaigns over time. These results are dis-played graphically in Figure 2 and the data for each year are displayed in Table 1.
DISCUSSIONFigure 1 reveals that more people reported that they learned about the presidential
campaign from newspapers than any other medium in the 1950's, but television gainedascendency (except for 1972, discussed next). Thereafter, newspaper use appears todrop off gradually. The Newspaper Association of America (2002) reports that dailynewspaper readership in 1964 was 80.8% and in 1997 it was 58.3%. The Pearson r forpercentage of daily newspaper readers and year is -.971 (n=27, p<.001). Clearly, fewerpeople read newspapers on a daily basis over time and so fewer voters would reportthat they learn about the presidential campaign from this medium.
After television became a standard household fixture at the end of the 1950's, theinfluence of television has been relatively stable over time. There is a noticeable drop in1972 and a smaller drop in 1996. These two valleys might be related to elections thatwere never in doubt (Nixon consistently led McGovern in 1972 and Clinton never trailed
Dow
nloa
ded
by [
Mem
oria
l Uni
vers
ity o
f N
ewfo
undl
and]
at 1
9:44
31
July
201
4
170 - Communication Research Reports/Spring 2004
20
1952 1956 1960 1964 1968 1972 1976 1980 1984 1988 1992 1996 2000
Newspaper - - - - - Magazines
Television ^ — — Debates
Party Contact
- - Radio
Discussion
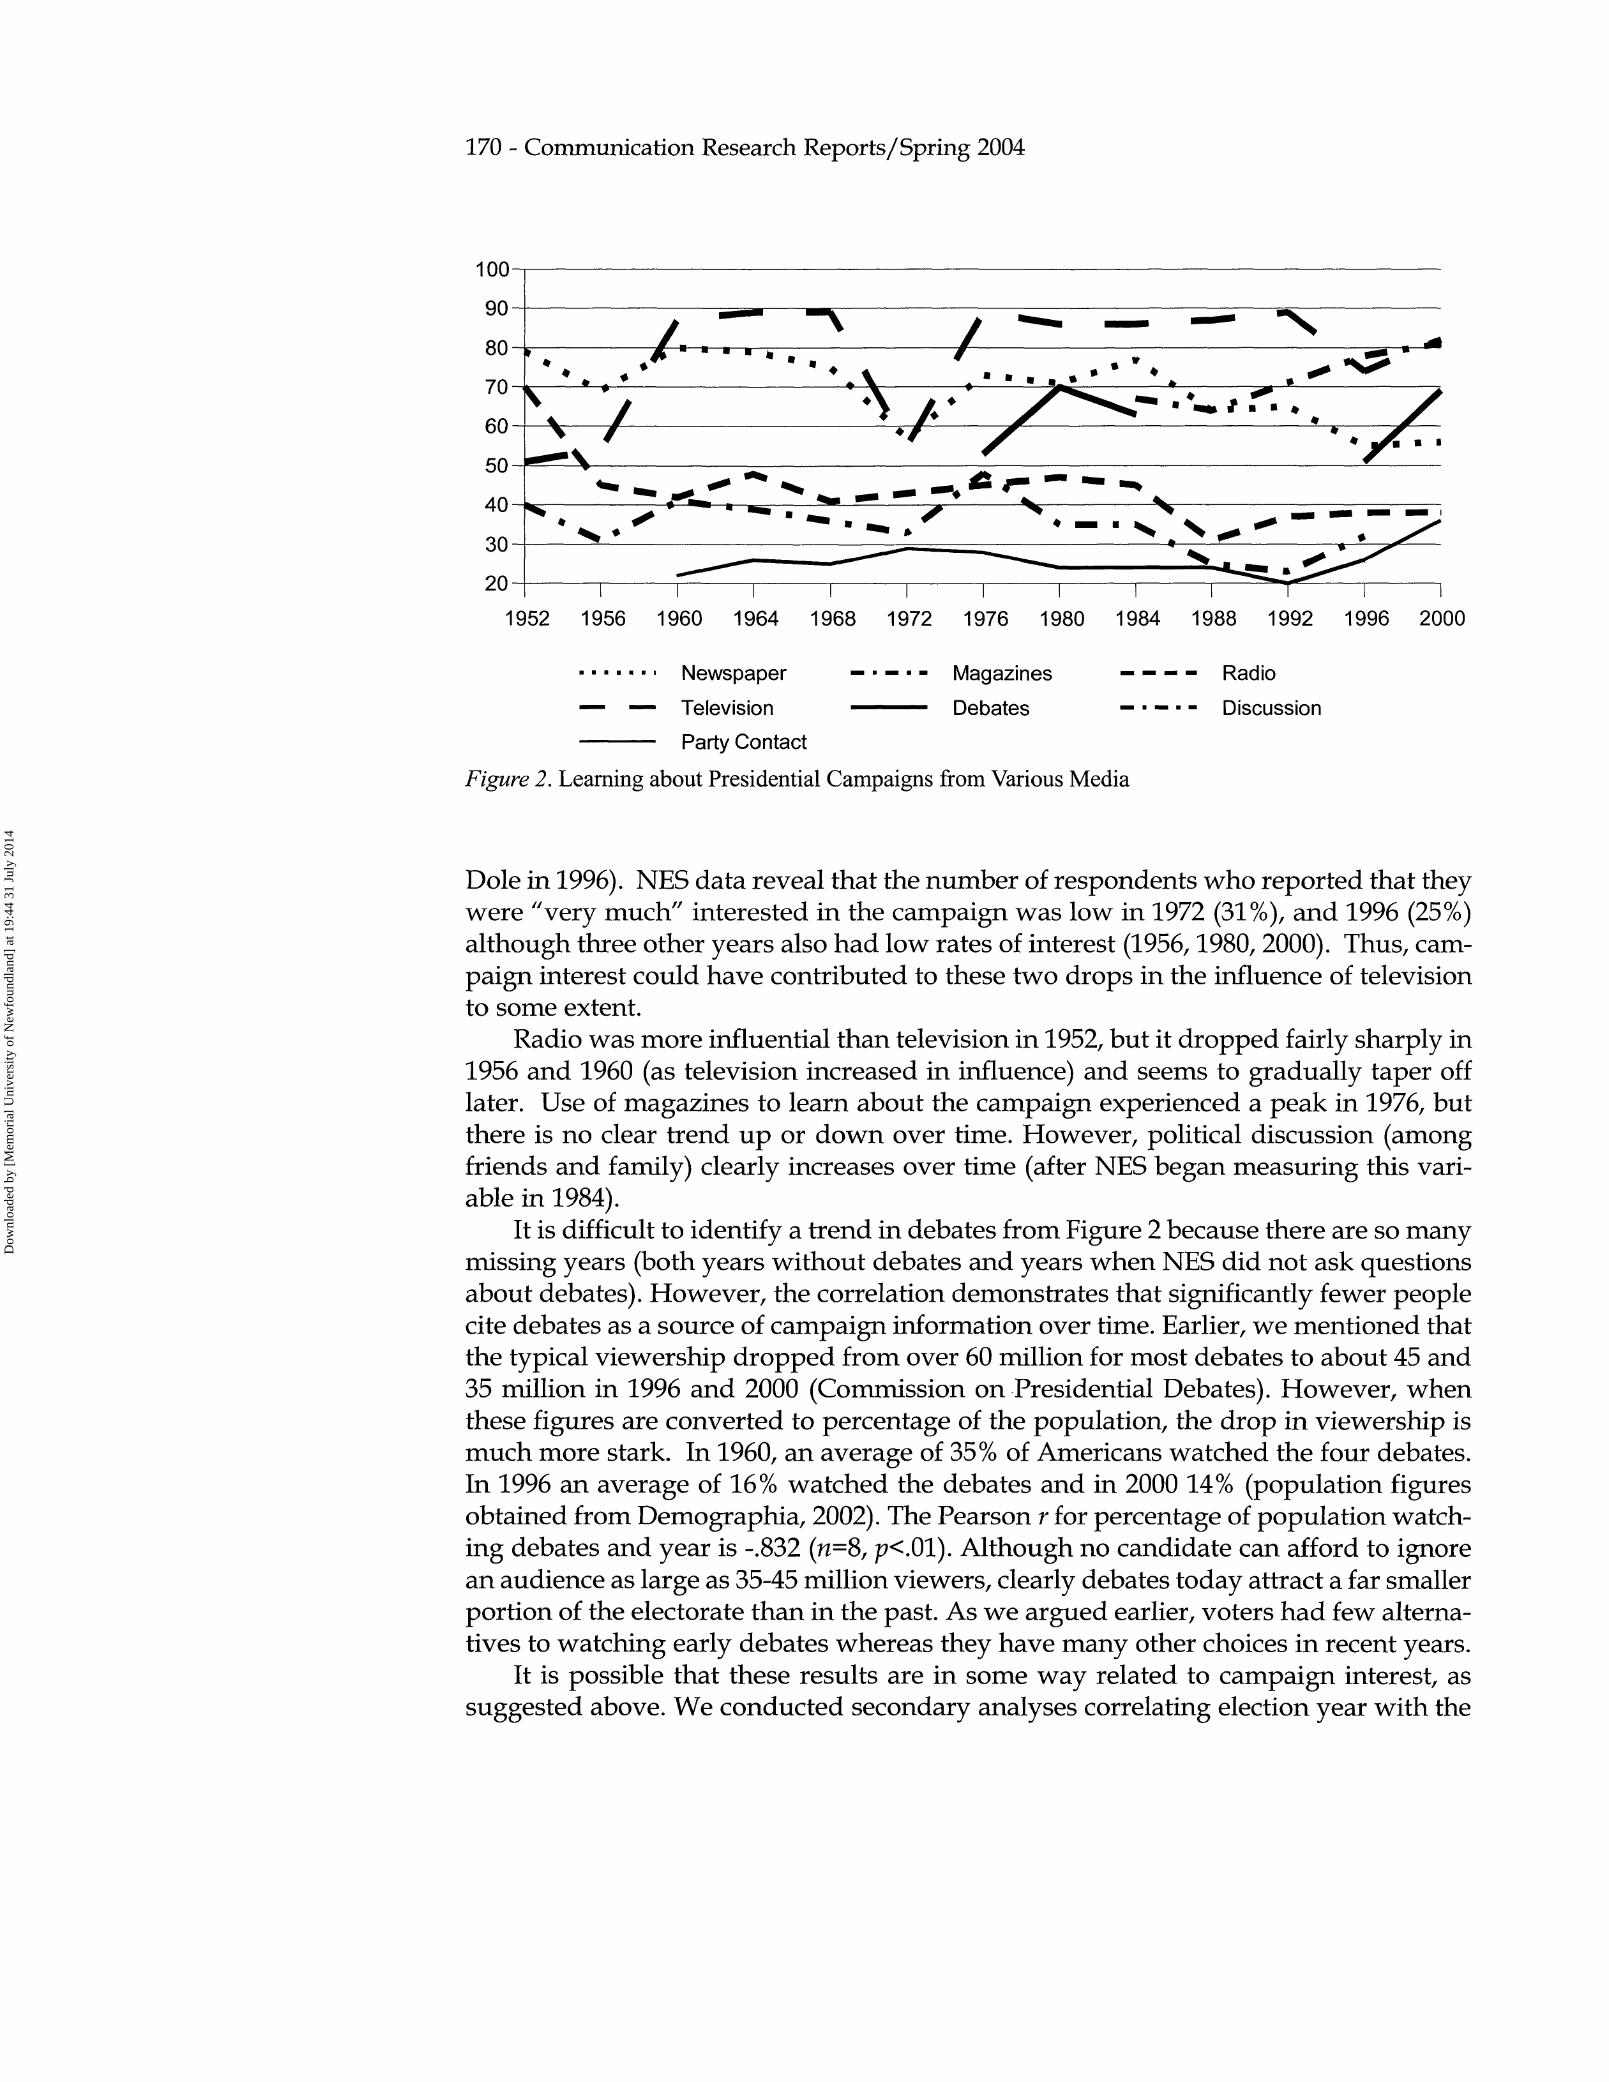
Figure 2. Learning about Presidential Campaigns from Various Media
Dole in 1996). NES data reveal that the number of respondents who reported that theywere "very much" interested in the campaign was low in 1972 (31%), and 1996 (25%)although three other years also had low rates of interest (1956,1980, 2000). Thus, cam-paign interest could have contributed to these two drops in the influence of televisionto some extent.
Radio was more influential than television in 1952, but it dropped fairly sharply in1956 and 1960 (as television increased in influence) and seems to gradually taper offlater. Use of magazines to learn about the campaign experienced a peak in 1976, butthere is no clear trend up or down over time. However, political discussion (amongfriends and family) clearly increases over time (after NES began measuring this vari-able in 1984).
It is difficult to identify a trend in debates from Figure 2 because there are so manymissing years (both years without debates and years when NES did not ask questionsabout debates). However, the correlation demonstrates that significantly fewer peoplecite debates as a source of campaign information over time. Earlier, we mentioned thatthe typical viewership dropped from over 60 million for most debates to about 45 and35 million in 1996 and 2000 (Commission on Presidential Debates). However, whenthese figures are converted to percentage of the population, the drop in viewership ismuch more stark. In 1960, an average of 35% of Americans watched the four debates.In 1996 an average of 16% watched the debates and in 2000 14% (population figuresobtained from Demographia, 2002). The Pearson r for percentage of population watch-ing debates and year is -.832 (n=8, p<.01). Although no candidate can afford to ignorean audience as large as 35-45 million viewers, clearly debates today attract a far smallerportion of the electorate than in the past. As we argued earlier, voters had few alterna-tives to watching early debates whereas they have many other choices in recent years.
It is possible that these results are in some way related to campaign interest, assuggested above. We conducted secondary analyses correlating election year with the
Dow
nloa
ded
by [
Mem
oria
l Uni
vers
ity o
f N
ewfo
undl
and]
at 1
9:44
31
July
201
4
Changing Media of Presidential Campaigns - 171
percentage of respondents who were very much, somewhat, and not much interestedin the campaign. The number of respondents who are very much interested in the cam-paign is negatively correlated with campaign year (r[n=13]=-.564, p=.O45) but so is thenumber who report that they are not much interested in the campaign (r[n=13]=-.646,p=.O17). The number of respondents who report that they are somewhat interested, asone would expect from the two previous analyses, is positively correlated (r[n=13]=-.908, p=.001). The trend in campaign interest appears to be that the extremes becomemore moderate over time, so it seems unlikely that longitudinal shifts in campaigninterest offer a simple explanation for either the negative or the positive correlationsobserved here.
CONCLUSIONExamination of NES election data from 1952-2000 supports our contention that the
media environment in presidential elections has changed. The percentage of voterswho report that they learn about the campaign from newspapers, radio, and debateshas declined over time. Although only measured by the NES since 1984, political dis-cussion among voters shows the strongest chronological relationship (r=.924). It is im-portant to realize that the media environment in presidential campaigns has changedover time as new technologies emerged and people shifted media use patterns (e.g.,less radio and newspapers to more television). This has important implications forvoters because, as we demonstrated earlier, different media contain different informa-tion.
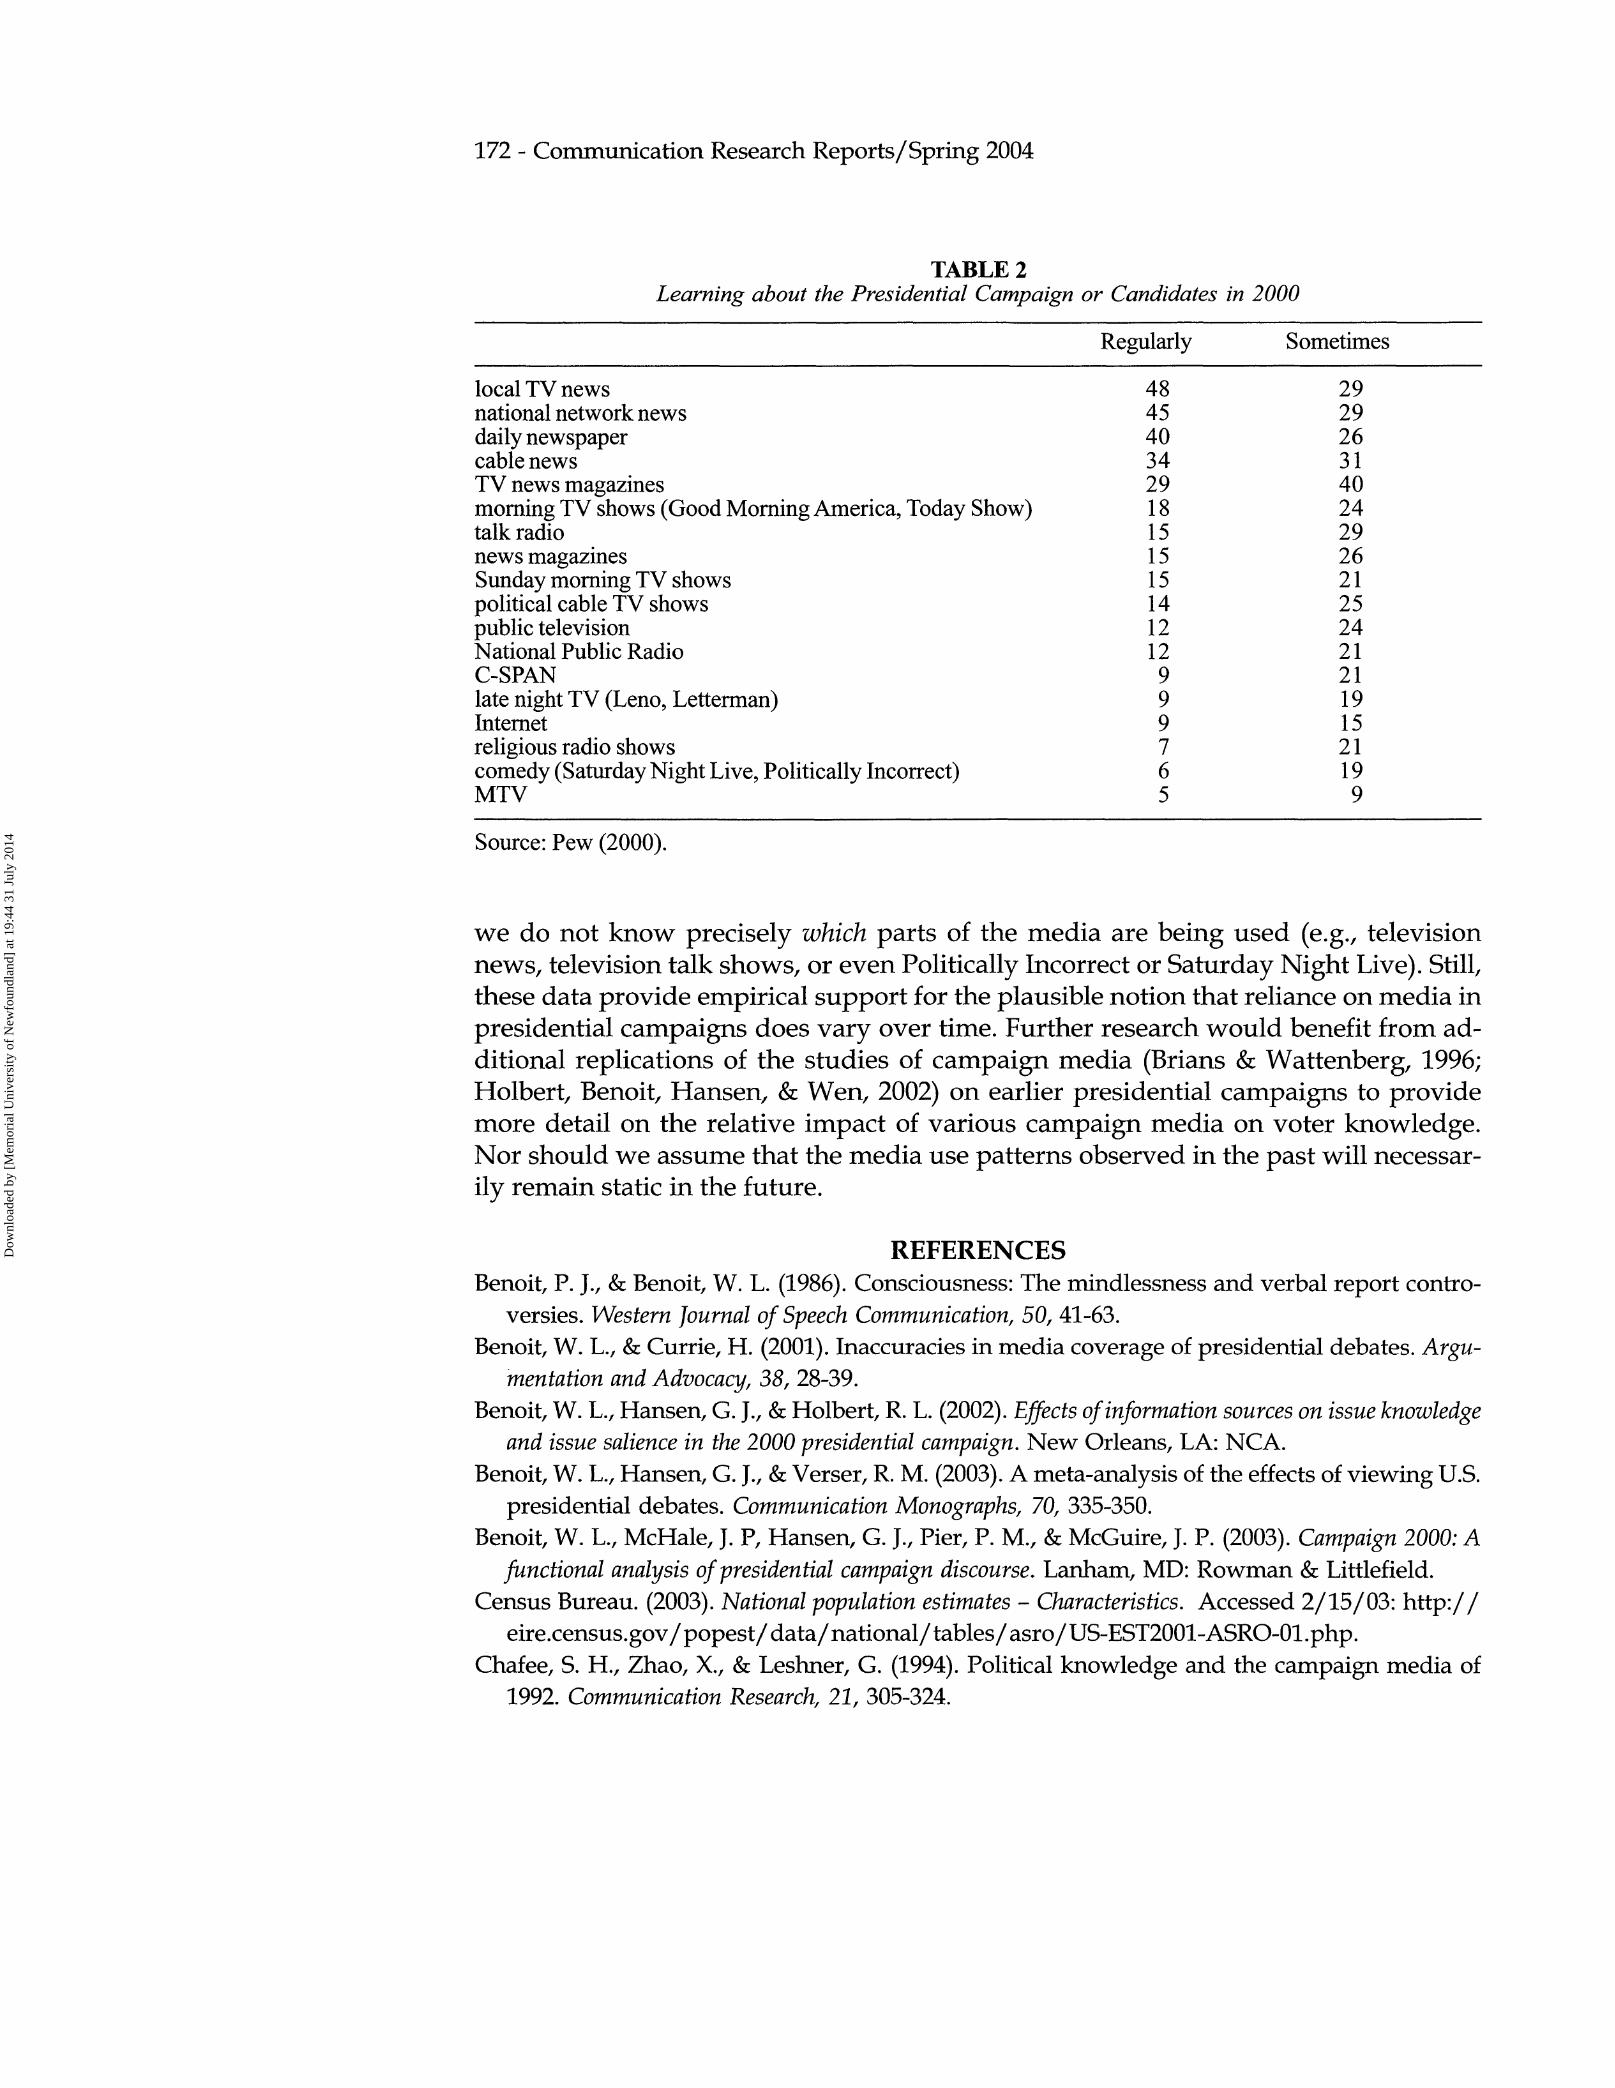
The NES began to study Internet use in 2000. Obviously attention to the Internetshould continue: A telephone poll conducted in February and March of 2002 reportedthat 66% of adults in the U.S. (137 million) are online (Harris Poll, 2002). We shouldalso investigate other non-traditional media as well. For example, Chaffee, Zhao, andLeshner (1994) found that in 1992, talk show viewing predicted candidate issue knowl-edge as much as television news and newspaper exposure. We know that Bill Clintonappeared on MTV in 1996; in 2000 Bush and Gore visited Letterman, Leno, Oprah, andother television talk shows. Public opinion poll data (Pew Research Center) from themost recent presidential campaign shows that 28% of the those surveyed say they learnabout the presidential campaign or candidates sometimes or regularly from late nightTV shows like David Letterman and Jay Leno, 25% from shows like Saturday NightLive and Politically Incorrect, 42% from morning television shows like Good MorningAmerica or the Today Show. Table 2 displays the range of information sources (noticethat this question is worded differently from NES survey, which means we should notexpect identical results for these Pew data and NES data from 2000). It will be interest-ing to see if use of traditional sources of information decline as new alternatives, likethe Internet, develop.
These data possess several limitations which should be acknowledged. These ques-tions are self report measures, asking respondents where they think they received infor-mation (Benoit & Benoit, 1986). We do not know to what extent voters pay attention to,and keep track of, where they obtained particular pieces of political information. Sec-ond, the data only tell what media are used and do not reveal how much information(or what information) is learned from them. Furthermore, given the general nature ofthe questions (e.g., Did you watch any programs on television about the campaign?),
Dow
nloa
ded
by [
Mem
oria
l Uni
vers
ity o
f N
ewfo
undl
and]
at 1
9:44
31
July
201
4
172 - Communication Research Reports/Spring 2004
TABLE 2Learning about the Presidential Campaign or Candidates in 2000
local TV newsnational network newsdaily newspapercable newsTV news magazinesmorning TV shows (Good Morning America, Today Show)talk radionews magazinesSunday morning TV showspolitical cable TV showspublic televisionNational Public RadioC-SPANlate night TV (Leno, Letterman)Internetreligious radio showscomedy (Saturday Night Live, Politically Incorrect)MTV
Regularly
484540342918151515141212999765
Sometimes
29292631402429262125242121191521199
Source: Pew (2000).
we do not know precisely which parts of the media are being used (e.g., televisionnews, television talk shows, or even Politically Incorrect or Saturday Night Live). Still,these data provide empirical support for the plausible notion that reliance on media inpresidential campaigns does vary over time. Further research would benefit from ad-ditional replications of the studies of campaign media (Brians & Wattenberg, 1996;Holbert, Benoit, Hansen, & Wen, 2002) on earlier presidential campaigns to providemore detail on the relative impact of various campaign media on voter knowledge.Nor should we assume that the media use patterns observed in the past will necessar-ily remain static in the future.
REFERENCESBenoit, P. J., & Benoit, W. L. (1986). Consciousness: The mindlessness and verbal report contro-
versies. Western Journal of Speech Communication, 50, 41-63.Benoit, W. L., & Currie, H. (2001). Inaccuracies in media coverage of presidential debates. Argu-
mentation and Advocacy, 38, 28-39.Benoit, W. L., Hansen, G. J., & Holbert, R. L. (2002). Effects of information sources on issue knowledge
and issue salience in the 2000 presidential campaign. New Orleans, LA: NCA.Benoit, W. L., Hansen, G. J., & Verser, R. M. (2003). A meta-analysis of the effects of viewing U.S.
presidential debates. Communication Monographs, 70, 335-350.Benoit, W. L., McHale, J. P, Hansen, G. J., Pier, P. M., & McGuire, J. P. (2003). Campaign 2000: A
functional analysis of presidential campaign discourse. Lanham, MD: Rowman & Littlefield.Census Bureau. (2003). National population estimates - Characteristics. Accessed 2/15/03: h t tp : / /
eire.census.gov/popest/data/national/tables/asro/US-EST2001-ASRO-01.php.Chafee, S. H., Zhao, X., & Leshner, G. (1994). Political knowledge and the campaign media of
1992. Communication Research, 21, 305-324.
Dow
nloa
ded
by [
Mem
oria
l Uni
vers
ity o
f N
ewfo
undl
and]
at 1
9:44
31
July
201
4
Changing Media of Presidential Campaigns - 173
Commission on Presidential Debates. (2002). http://www.debates.org/.Demographia. (2002). US population from 1900. Available: http://www.demographia.com/db-
uspopl900.htm.Farnsworth, S. J., & Lichter, S. R. (2003). The nightly news nightmare: Network television's coverage of
U.S. presidential elections, 1988-2000. Lanham, MD: Rowman & Littlefield.Harris Poll. (2002, April 17). Internet penetration at 66% of adults (137 million) nationwide. Avail-
able: http://www.harrisinteractive.com/harris_poll/index.asp?PID=295.Holbert, R. L., Benoit, W. L., Hansen, G. J., & Wen, W-C. (2002). The role of communication in the
formation of an issue-based citizenry. Communication Monographs, 69, 296-310.Lichter, S. R., & Noyes, R. E. (1995). Good intentions make bad news: Why Americans hate campaign
journalism. Lanham, MD: Rowman & Littlefield.National Election Studies (Center for Political Studies). (1994). Continuity guide to the American
National Election Studies 1952-1993. Accessed 10/6/03: http://www.umich.edu/~nes/re-sources/ conguide/ conguide.htm
National Election Studies. (2003). Political engagement. Accessed 8/4/03: h t t p : / /www.umich.edu/~nes/nesguide/gd-index.htm#6.
Newspaper Association of America. (2002). Daily newspaper readership trends. Available: http:// www.naa.org/ marketscope/ databank/tdnpr1299.htm
Pew Research Center. (2000, January 12-16). Poll. Available via Lexis-Nexis Academic Universe.Reber, B. H., & Benoit, W. L. (2001). Presidential debate stories accentuate the negative. Newspa-
per Research Journal, 22, 30-43.Toner, R. (1996, March 17). In this race, it's the center against the middle. New York Times, p. 4.3.WSIU, (2002). A broadcast technology timeline. Available: http://www.wsiu.org/digitaltv/
index.shtml
Dow
nloa
ded
by [
Mem
oria
l Uni
vers
ity o
f N
ewfo
undl
and]
at 1
9:44
31
July
201
4