Embed Size (px)
Citation preview

6225 Lusk Boulevard | San Diego, CA 92121 | Phone 800.317.4747 | Fax 858.546.3741 | www.chandlerasset.com
CHANDLER ASSET MANAGEMENT
September 12, 2013
The Changing Investment Landscape
CAJPA Fall Conference
Martin Cassell, CFA CEO & Chief Investment Officer

Table of Contents
Introduction Major Economic Indicators – Evolution Since Financial Crisis
Section 1 Federal Reserve Balance Sheet
Section 2 Demographic Trends and Their Impact on Fixed Income
Section 3 GSE Reform
Section 4 Portfolio Considerations in the New Investment Landscape
2

December 2006: Prior to the Onset of the Financial Crisis
December-06 Broad Economic Statistics GDP - most recent QoQ 3.2 Unemployment Rate 4.4 Underemployment Rate (U6) 7.9 CPI - YoY 2.5 CPI Core - YoY 2.6
Interest Rates Fed Funds Rate 5.25 Two Year Treasury Yield 4.81 Five Year Treasury Yield 4.69 Ten Year Treasury Yield 4.70
Equity Markets DJIA 12,463.15 S&P 500 1,418.30 NASDAQ 2,415.29
Currencies Dollar Index 83.65 Euro 1.3197 Yuan - China 7.8045 Yen 119.06
3
• GDP growth at trend, unemployment rate low at 4.4%
• Treasury yields comfortably outpaced inflation • Fed Funds rate higher than benchmark Treasury
rates as the interest rate “conundrum” leads to an inverted Treasury curve – recycling of dollars
• Equity market performance strong in 2006 • DJIA 16.29% • S&P 500 13.62% • NASDAQ 9.52%
• Dollar index declined 8.25% during the year
Source: Bloomberg

December 2007: The Financial Crisis Begins
4
December-06 December-07 Broad Economic Statistics GDP - most recent QoQ 3.2 1.5 Unemployment Rate 4.4 5.0 Underemployment Rate (U6) 7.9 8.8 CPI - YoY 2.5 4.1 CPI Core - YoY 2.6 2.4
Interest Rates Fed Funds Rate 5.25 4.25 Two Year Treasury Yield 4.81 3.05 Five Year Treasury Yield 4.69 3.44 Ten Year Treasury Yield 4.70 4.03
Equity Markets DJIA 12,463.15 13,264.82 S&P 500 1,418.30 1,468.36 NASDAQ 2,415.29 2,652.28
Currencies Dollar Index 83.65 76.66 Euro 1.3197 1.4589 Yuan - China 7.8045 7.3037 Yen 119.06 111.75
• GDP growth decelerates below trend and the unemployment rate ticks up
• Headline inflation moves higher but core inflation remains contained
• FOMC begins to ease monetary policy and Treasury yields remain below Fed Funds Rate – conundrum continues
• Equity markets post positive year over year returns
• DJIA 6.43% • S&P 500 3.53% • NASDAQ 9.81%
• Dollar continues to decline in the face of easing monetary policy and better growth prospects in alternative global regions
Source: Bloomberg

December 2008: Risk Markets Collapse
5
December-07 December-08 Broad Economic Statistics GDP - most recent QoQ 1.5 (8.3) Unemployment Rate 5.0 7.3 Underemployment Rate (U6) 8.8 13.5 CPI - YoY 4.1 0.1 CPI Core - YoY 2.4 1.8
Interest Rates Fed Funds Rate 4.25 0.25 Two Year Treasury Yield 3.05 0.76 Five Year Treasury Yield 3.44 1.56 Ten Year Treasury Yield 4.03 2.22
Equity Markets DJIA 13,264.82 8,776.39 S&P 500 1,468.36 903.25 NASDAQ 2,652.28 1,577.03
Currencies Dollar Index 76.66 81.31 Euro 1.4589 1.3971 Yuan - China 7.3037 6.8277 Yen 111.75 90.64
• GDP growth severely negative • Unemployment rate moves
materially higher • Inflation rolls over with the
slowdown in the economy • Fed Funds rate lowered to 0.25%
as the FOMC takes actions to stem deflation risk
• Treasury yields are lower and no longer inverted but one has to invest out to ten year to earn a yield above core inflation
• Equity market crushed • DJIA -33.84% • S&P 500 -38.49% • NASDAQ -40.54%
• Dollar firms in flight to quality Source: Bloomberg

December 2011: Three Years Later – Some Markets Have Recovered
6
December-08 December-11 Broad Economic Statistics GDP - most recent QoQ (8.3) 4.9 Unemployment Rate 7.3 8.5 Underemployment Rate (U6) 13.5 15.2 CPI - YoY 0.1 3.0 CPI Core - YoY 1.8 2.2
Interest Rates Fed Funds Rate 0.25 0.25 Two Year Treasury Yield 0.76 0.25 Five Year Treasury Yield 1.56 0.84 Ten Year Treasury Yield 2.22 1.87
Equity Markets DJIA 8,776.39 12,217.56 S&P 500 903.25 1,257.60 NASDAQ 1,577.03 2,605.15
Currencies Dollar Index 81.31 79.03 Euro 1.3971 1.2961 Yuan - China 6.8277 6.2950 Yen 90.64 76.91
• GDP growth above trend but not nearly strong enough to reverse the trend in unemployment
• Headline inflation too high but core inflation remains contained
• Investing in the Treasury market in any tenor out to ten years will produce a negative real return
• Equity markets higher but the DJIA and S&P 500 below year end 2006 valuations
• Dollar relatively stable, Euro materially weaker
Source: Bloomberg
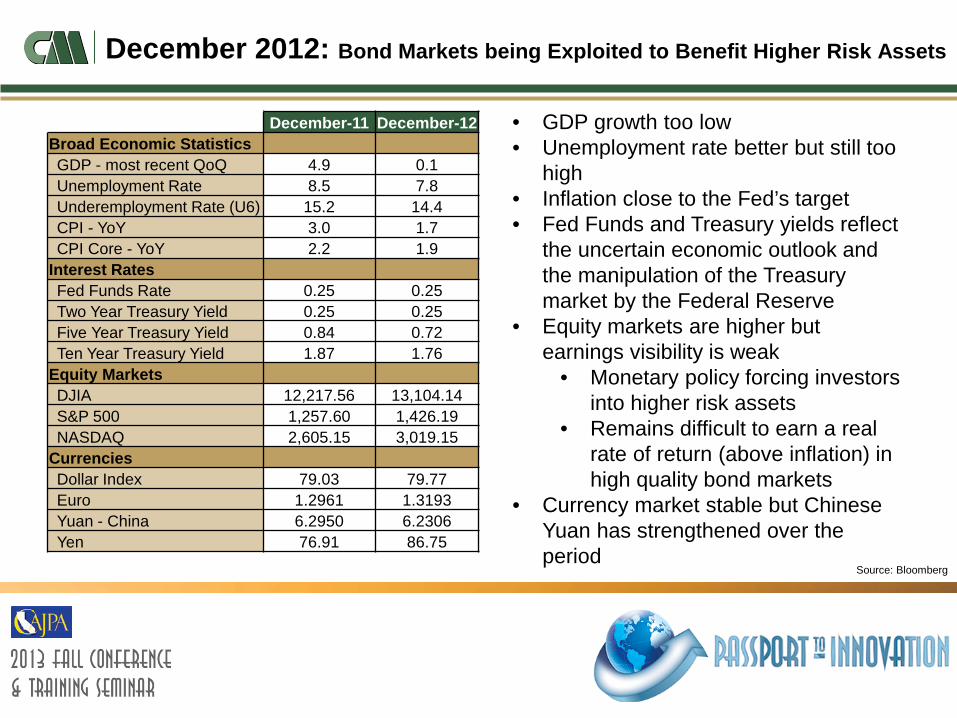
December 2012: Bond Markets being Exploited to Benefit Higher Risk Assets
7
• GDP growth too low • Unemployment rate better but still too
high • Inflation close to the Fed’s target • Fed Funds and Treasury yields reflect
the uncertain economic outlook and the manipulation of the Treasury market by the Federal Reserve
• Equity markets are higher but earnings visibility is weak
• Monetary policy forcing investors into higher risk assets
• Remains difficult to earn a real rate of return (above inflation) in high quality bond markets
• Currency market stable but Chinese Yuan has strengthened over the period
Source: Bloomberg
December-11 December-12 Broad Economic Statistics GDP - most recent QoQ 4.9 0.1 Unemployment Rate 8.5 7.8 Underemployment Rate (U6) 15.2 14.4 CPI - YoY 3.0 1.7 CPI Core - YoY 2.2 1.9
Interest Rates Fed Funds Rate 0.25 0.25 Two Year Treasury Yield 0.25 0.25 Five Year Treasury Yield 0.84 0.72 Ten Year Treasury Yield 1.87 1.76
Equity Markets DJIA 12,217.56 13,104.14 S&P 500 1,257.60 1,426.19 NASDAQ 2,605.15 3,019.15
Currencies Dollar Index 79.03 79.77 Euro 1.2961 1.3193 Yuan - China 6.2950 6.2306 Yen 76.91 86.75

December 2006 – December 2012: Summarizing the High Level Data
8
Source: Bloomberg
December-06 December-07 December-08 December-11 December-12 Broad Economic Statistics GDP - most recent QoQ 3.2 1.5 (8.3) 4.9 0.1 Unemployment Rate 4.4 5.0 7.3 8.5 7.8 Underemployment Rate (U6) 7.9 8.8 13.5 15.2 14.4 CPI - YoY 2.5 4.1 0.1 3.0 1.7 CPI Core - YoY 2.6 2.4 1.8 2.2 1.9
Interest Rates Fed Funds Rate 5.25 4.25 0.25 0.25 0.25 Two Year Treasury Yield 4.81 3.05 0.76 0.25 0.25 Five Year Treasury Yield 4.69 3.44 1.56 0.84 0.72 Ten Year Treasury Yield 4.70 4.03 2.22 1.87 1.76
Equity Markets DJIA 12,463.15 13,264.82 8,776.39 12,217.56 13,104.14 S&P 500 1,418.30 1,468.36 903.25 1,257.60 1,426.19 NASDAQ 2,415.29 2,652.28 1,577.03 2,605.15 3,019.15
Currencies Dollar Index 83.65 76.66 81.31 79.03 79.77 Euro 1.3197 1.4589 1.3971 1.2961 1.3193 Yuan - China 7.8045 7.3037 6.8277 6.2950 6.2306 Yen 119.06 111.75 90.64 76.91 86.75

Inflation Adjusted Fixed Income Returns
Possibility of Positive Real Returns in 2013-2015?
9
0.00
1.00
2.00
3.00
4.00
5.00
6.00
7.00
8.00
2004 2005 2006 2007 2008 2009 2010 2011 2012
High Quality Fixed Income versus Core CPI
US Treasury / Agency 1-5 Year Benchmark Core CPI, year over yearSource: Bloomberg & Bank of America Merrill Lynch Indices

SECTION 1
Federal Reserve Balance Sheet
10

Low Rate Environment – Catalysts for Change?
Monetary Policy – Evolution of the Fed’s Balance Sheet
11
• Prior to the depths of the financial crisis the Fed’s Balance sheet was pristine • Dominated by Treasury assets • Total asset between $850-900 billion
Source: Federal Reserve

Low Rate Environment – Catalysts for Change?
Monetary Policy – Evolution of the Fed’s Balance Sheet
12
• Fed’s balance sheet grows dramatically – 2.5x - to support the economy during the financial crisis
• Treasury assets are no longer the dominant holding • “Other” assets in 2008 include all the initial measures implemented by the Federal Reserve to
inject liquidity into the system • Quantitative easing expands in 2009 to include Mortgage Backed Securities
Source: Federal Reserve

Low Rate Environment – Catalysts for Change?
Monetary Policy – Evolution of the Fed’s Balance Sheet
13
• The “new normal” Fed Balance Sheet – bigger with less non traditional assets • Recently announced “open ended” Quantitative Easing has market participants
speculating the size could grow from $3 trillion to $4 trillion
Source: Federal Reserve

Low Rate Environment – Catalysts for Change?
Will the Fed begin to taper in 2013?
14
Source: Federal Reserve
$0.00
$500,000.00
$1,000,000.00
$1,500,000.00
$2,000,000.00
$2,500,000.00
$3,000,000.00
$3,500,000.00
7/24/2008 7/24/2009 7/24/2010 7/24/2011 7/24/2012 7/24/2013
Asse
ts In
Milli
ons $
Fed's Balance Sheet
Other Assets Emergency Programs Discount Window Borrowing GSE Debt Agency Mortgage Back Security Treasury Bonds
Bear Stearns
Lehman Brothers Fed attempting to
bring stability to the Banking system & the Housing Market
QE1 QE2
QE3
• March 2008 – Bear Stearns melts down and is purchased by JP Morgan • September 2008 – Lehman Brothers goes bankrupt – The Fed begins “Quantitative Easing” • November 2010 – The Fed begins QE-2, purchasing $600 trillion in Treasuries over the next 6 months • In September 2012: The Fed announced open ended purchases of MBSs at the rate of $40 billion per month. • In December 2012: The Fed announced purchases of treasury securities at the rate of $45 billion per month until unemployment remains above
6.5% or inflation rises above 2%.

FOMC Forecasts
Fed Forecast calling for a slow decline in the unemployment rate
15
Source: Federal Reserve

FOMC Forecasts
Dispersion – End of Calendar Year Forecasts
16
Source: Federal Reserve

SECTION 2
Demographic Trends and Their Impact on Fixed Income
17

Demographics
Baby Boom Generation Entering Retirement
18
Source: U.S. Census Bureau, decennial census of population, 1900 to 2000; 2012 Census Summary File 1

Demographics
Demand for Bond Funds Remains Strong
19
Source: Investment Company Institute
$- $0.20 $0.40 $0.60 $0.80 $1.00 $1.20 $1.40 $1.60 $1.80 $2.00
Jun-
03
Dec
-03
Jun-
04
Dec
-04
Jun-
05
Dec
-05
Jun-
06
Dec
-06
Jun-
07
Dec
-07
Jun-
08
Dec
-08
Jun-
09
Dec
-09
Jun-
10
Dec
-10
Jun-
11
Dec
-11
Jun-
12
Bill
ions
Fund Flows
Bond Funds Equity Funds

Demographics
Despite the Low Yield Environment Demand is Not Dropping
20

Demographics
Population Age 65 or Older as a Percentage of those 20-64 Years Old
21

SECTION 3
GSE Reform
22

GSE Reform
■ Fannie Mae and Freddie Mac remain under conservatorship
■ US Treasury recently mandated the retained portfolio accelerate the pace of contraction to 15% per year (previously 10%)
■ No longer required to pay 10% dividend on preferred shares bolstering the capital of each of the entities
■ But…. All profits now flow directly to the US Treasury
■ Agency asset class is likely to provide less yield to investors versus US Treasury securities
Government Sponsored Enterprises
23

Agency Sector Has Already Shrunk
24
Source: Bloomberg / ML Global Bond Indices Note: Corporate includes Yankee bonds, Agency excludes subordinated bonds
25%
24%
51%
December 31, 2006
Credit 1-5 yrs A-AAA Agencies 1-5 yrs US Treasury 1-5 yrs
25%
9%
66%
June 30, 2013
Credit 1-5 yrs A-AAA Agencies 1-5 yrs US Treasury 1-5 yrs

Yields and Spreads Have Collapsed
25
Source: Bloomberg / ML Global Bond Indices Note: Corporate includes Yankee bonds, Agency excludes subordinated bonds
0.000
1.000
2.000
3.000
4.000
5.000
6.000
12/31/06 12/31/07 12/31/08 12/31/09 12/31/10 12/31/11 12/31/12 06/30/13Credit 1-5 yrs A-AAA 5.259 4.757 5.784 2.757 2.071 2.174 1.048 1.476
Agencies 1-5 yrs 5.087 3.785 1.544 1.533 0.975 0.629 0.419 0.815
US Treasury 1-5 yrs 4.803 3.158 0.814 1.531 0.929 0.413 0.361 0.658
Historical Yields of Sector Components

Credit Quality Evolution
26
8%
40%52%
BofA Merrill Lynch 1-5 Year AAA-A US Corporate Index March 31, 2007
AAA AA A
1%
22%
77%
BofA Merrill Lynch 1-5 Year AAA-A US Corporate Index March 31, 2013
AAA AA A
Source: Bank of America Merrill Lynch Indices

Credit Quality Spread Differentiation
27
0
10
20
30
40
50
60
70
80
90
AAA AA A3/31/2007 44 53 62
3/31/2013 29 52 84
BofA Merrill Lynch 1-5 Year AAA-A US Corporate Index OAS
Source: Bank of America Merrill Lynch Indices
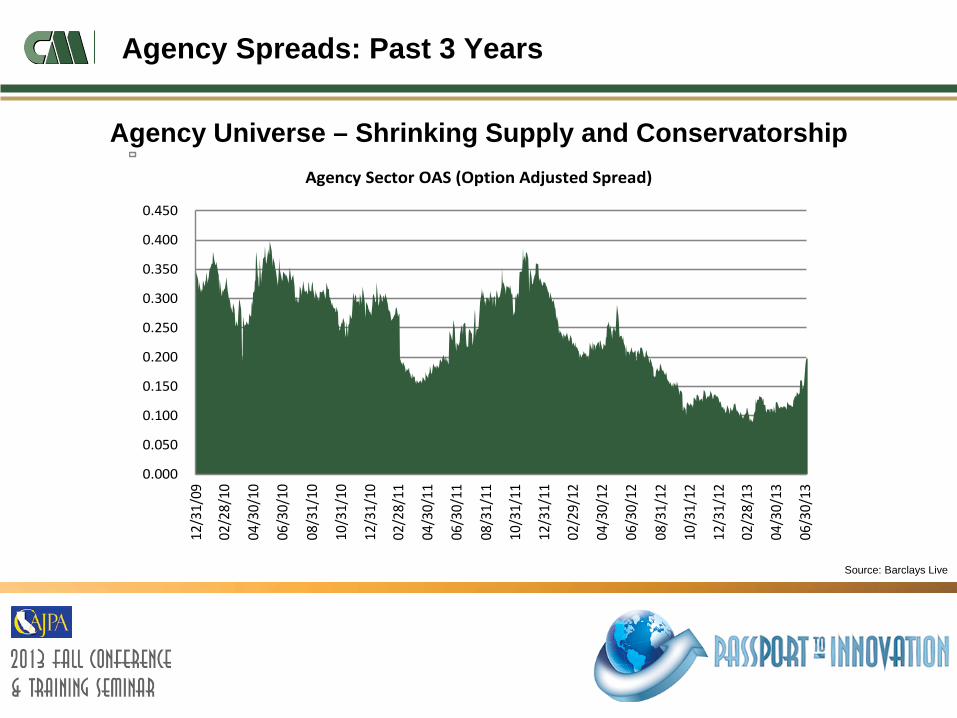
Agency Spreads: Past 3 Years
Agency Universe – Shrinking Supply and Conservatorship
28
Source: Barclays Live
0.000
0.050
0.100
0.150
0.200
0.250
0.300
0.350
0.400
0.45012
/31/
09
02/2
8/10
04/3
0/10
06/3
0/10
08/3
1/10
10/3
1/10
12/3
1/10
02/2
8/11
04/3
0/11
06/3
0/11
08/3
1/11
10/3
1/11
12/3
1/11
02/2
9/12
04/3
0/12
06/3
0/12
08/3
1/12
10/3
1/12
12/3
1/12
02/2
8/13
04/3
0/13
06/3
0/13
Agency Sector OAS (Option Adjusted Spread)

SECTION 4
Portfolio Considerations in the New Investment
Landscape
29
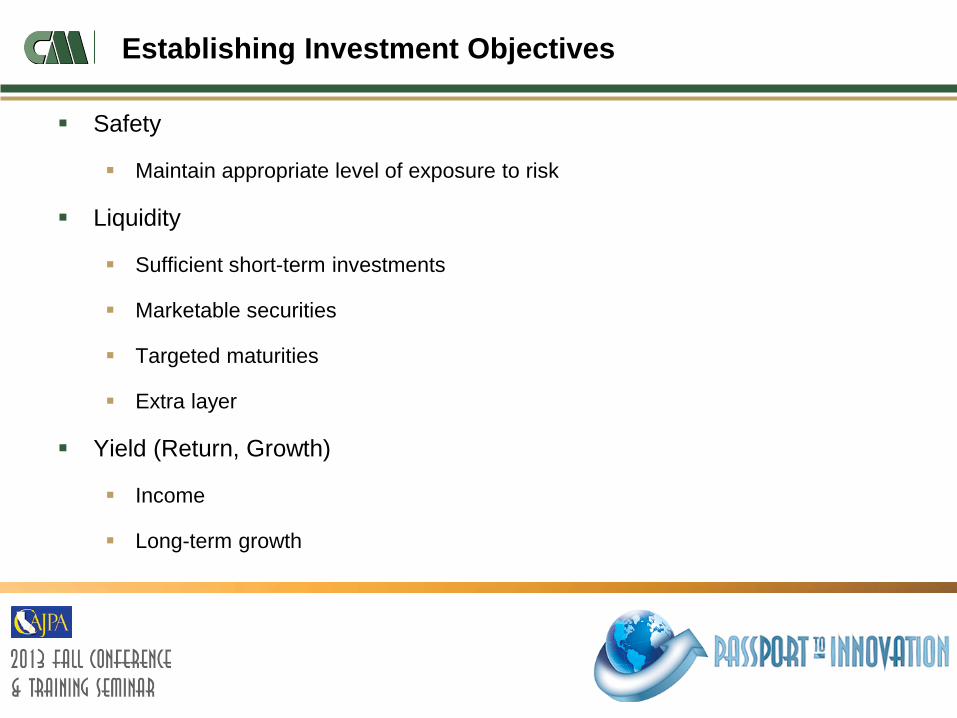
Establishing Investment Objectives
Safety
Maintain appropriate level of exposure to risk
Liquidity
Sufficient short-term investments
Marketable securities
Targeted maturities
Extra layer
Yield (Return, Growth)
Income
Long-term growth
30

Sector Allocation
■ Safety
■ Liquidity
■ Diversification
■ Value
Goals of Sector Allocation
31
US Treas
Hsng Ag
Other Ag
Corp. MTN
Money Market

Preparing for Investment Without Agencies
Housing Agency Issuance is Shrinking
32
■ Safety
■ Liquidity
■ Diversification
■ Value
US Treas
Hsng Ag
Other Ag
Corp. MTN

Alternative Asset Classes
■ Investors are seeking alternatives to traditional public funds asset classes – Treasury and Agency debt
■ Investing in Corporate Notes, Negotiable CDs, Yankee CDs, MBS and ABS can improve income from investments
BUT… as with all investments, the potential for increased return goes hand-in-hand with the assumption of more risk
33

Portfolio Management is Risk Management
The greater an investor’s exposure to properly diversified risk, the higher the expected return over time
The greater an investor’s exposure to risk, the higher the volatility of return from period to period
The objective of “safety” requires establishing risk constraints
Risk is something to be managed not avoided
34

Different Types of Risks
■ Market Risk
■ Credit Risk
■ Liquidity Risk
■ Reinvestment Risk
■ Event Risk
35

Market Risk
■ Also called interest rate risk
■ The risk that the value of a security or a portfolio will change as interest rates change
■ Value can go up or down, inversely to interest rate changes
■ All securities are subject to market risk, even US government guaranteed
■ The longer the duration of the portfolio, the greater the change in value
■ We can’t predict interest rates, but, using duration, we can calculate approximately how much the portfolio market value will change with a given, instantaneous change in interest rates
36

Credit Risk
■ Credit risk is the risk that the issuer of a bond may not be able to make timely payments of principal and/or interest
■ Investors receive higher yields when they purchase riskier securities
■ Agencies vs. Treasuries
■ Corporates vs. Agencies
■ “A” vs. “AAA” Corporates
■ Credit ratings change over time
■ Yield spreads vary over time
37

Liquidity Risk
■ Liquidity risk ■ The risk that the portfolio won’t provide adequate cash flow for
the agency ■ The risk that a security can’t be sold, if necessary, at a good
price ■ Measured by such factors as the difference between bid and
ask ■ Number of market makers for the issue ■ Usually, the larger the issue size, the greater the liquidity
■ Liquidity risk can be minimized by maintaining appropriate balances of short-term securities in the portfolio
38

Reinvestment Risk
■ Reinvestment risk: cash flows from a bond must be reinvested at the market rate at the time the cash flow occurs
■ Interest payments
■ Principal paid at maturity
■ Paydowns from mortgage securities
■ Principal from called bonds
39

Event Risk
■ An unexpected event causes a sudden deterioration in an issuer's credit quality, and a concomitant instant decline in price
■ NRSRO ratings do not (cannot) reflect event risk
40

Macroeconomic Analysis
■ Analysis of economic trends
■ Employment
■ Housing
■ Inflation
■ Federal Open Market Committee announcements and actions
41

Industry Analysis
■ Industry trends
■ Earnings
■ Sales
■ Regulatory issues and changes
■ Demographic and social changes
■ Industry business cycle analysis
42

Issuer Specific Analysis
■ Financial health
■ Profitability
■ Balance Sheet
■ Cash Flow
■ Management and corporate governance
■ Bond covenants
■ Capital structure
43

How to Leverage Changing Market Landscape
■ Conservative Approach: Objective should be consistent, steady returns versus the risk benchmark
■ Transparency: Holdings need to meet the requirements of the statues of the governing body
■ Diversification: A broad mix of securities across eligible sectors and term structure
■ Technology: Access to real time information is imperative to ensure best in class idea generation and trade execution
■ Depth of Team Managing Assets: Portfolio Managers with experience and expertise navigating varied market cycles
■ Manage Risk: Generate risk adjusted out-performance over an intermediate time horizon
High Level Characteristics of a Successful Short Duration Mandate
44

Wrap Up
■ Keep it safe - Don’t overstretch for yield
■ Provide for liquidity
■ Having non-governmental issuers in the portfolio offers greater expected earnings
■ AND involves greater risk
■ Effective implementation of a program of non-governmental investing requires
■ Expertise and the time to perform research and analysis
■ Sufficient resources, including external subscription services
■ Continuous monitoring of issues in the portfolio and under consideration
■ A high level of diversification by sector and by issuer
45

46
Conclusion
■ Do your own credit research, don’t rely strictly on ratings agencies
■ Be aware of the risks in your portfolio
■ Make sure you can pass the “sleep test”
Important Disclosures
47
Past performance is not indicative of future results. The information herein is provided for informational purposes only and should not be construed as a recommendation of any security, strategy or investment product, nor an offer or solicitation for the purchase or sale of any financial instrument. References to investment indices are for informational purposes and do not imply that managing portfolios to those styles will achieve comparable returns. Indices do not reflect the deduction of transaction and/or custodial charges or the deduction of an investment management fee, the incurrence of which would have the effect of decreasing historical performance results. Indices are unmanaged, and one cannot invest directly in an index.
Any forecasts, forward-looking statements and assumptions are inherently limited and should not be relied upon as an indicator of future results. Any opinions and views constitute judgments made by the author at the date of this presentation and may become outdated or superseded at any time without notice. Any statements concerning financial market trends are based on current market conditions, which will fluctuate.
Economic factors, market conditions and investment strategies will affect the performance of any portfolio and there are no assurances that it will match or outperform any particular benchmark. The data contained in this presentation is the property of those providers, which were obtained from sources believed to be reliable, but are subject to change at any time at the provider’s discretion. Unless otherwise noted, Chandler is the source of illustrations, performance data, and characteristics contained in this presentation.

Biography
48
Martin Cassell, CFA CEO, Chief Investment Officer Martin Cassell is the chief executive and investment officer at Chandler Asset Management and is a principal of the firm. Mr. Cassell is responsible for defining, planning, and directing company programs. He heads implementation of the firm’s investment strategies and portfolio risk management. He designed the proprietary quantitative models that drive our investment process, establishing duration, structure, and asset allocation throughout client portfolios. Mr. Cassell joined Chandler Asset Management in 1991 from the City of San Diego where he managed a $1 billion fixed income portfolio. He began his investment career in 1987 managing portfolios at World Savings and Loan. Mr. Cassell received his B.S. in finance from California State University, Hayward. He is a member of the CFA Society of San Diego and holds the designation of Chartered Financial Analyst. He is also a member of the California Association of Joint Power Authorities (CAJPA) finance committee.