Embed Size (px)
Citation preview
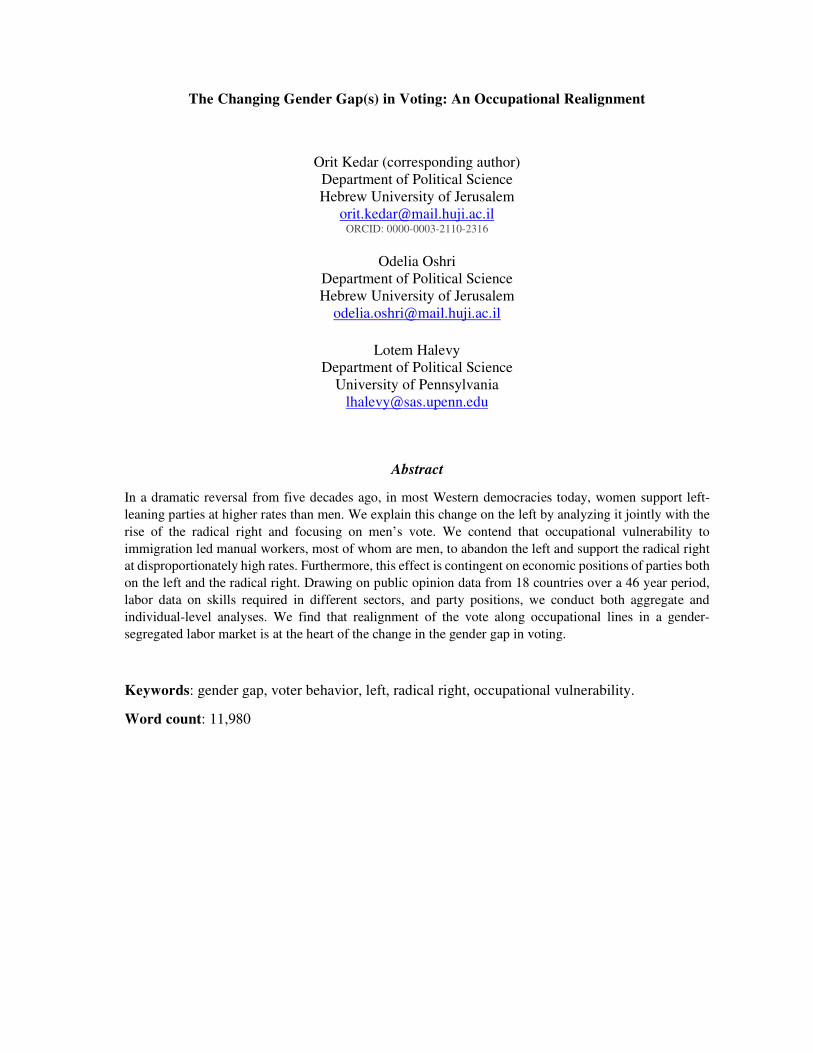
The Changing Gender Gap(s) in Voting: An Occupational Realignment
Orit Kedar (corresponding author)
Department of Political Science
Hebrew University of Jerusalem
[email protected] ORCID: 0000-0003-2110-2316
Odelia Oshri
Department of Political Science
Hebrew University of Jerusalem
Lotem Halevy
Department of Political Science
University of Pennsylvania
Abstract
In a dramatic reversal from five decades ago, in most Western democracies today, women support left-
leaning parties at higher rates than men. We explain this change on the left by analyzing it jointly with the
rise of the radical right and focusing on men’s vote. We contend that occupational vulnerability to
immigration led manual workers, most of whom are men, to abandon the left and support the radical right
at disproportionately high rates. Furthermore, this effect is contingent on economic positions of parties both
on the left and the radical right. Drawing on public opinion data from 18 countries over a 46 year period,
labor data on skills required in different sectors, and party positions, we conduct both aggregate and
individual-level analyses. We find that realignment of the vote along occupational lines in a gender-
segregated labor market is at the heart of the change in the gender gap in voting.
Keywords: gender gap, voter behavior, left, radical right, occupational vulnerability.
Word count: 9,11 80
1
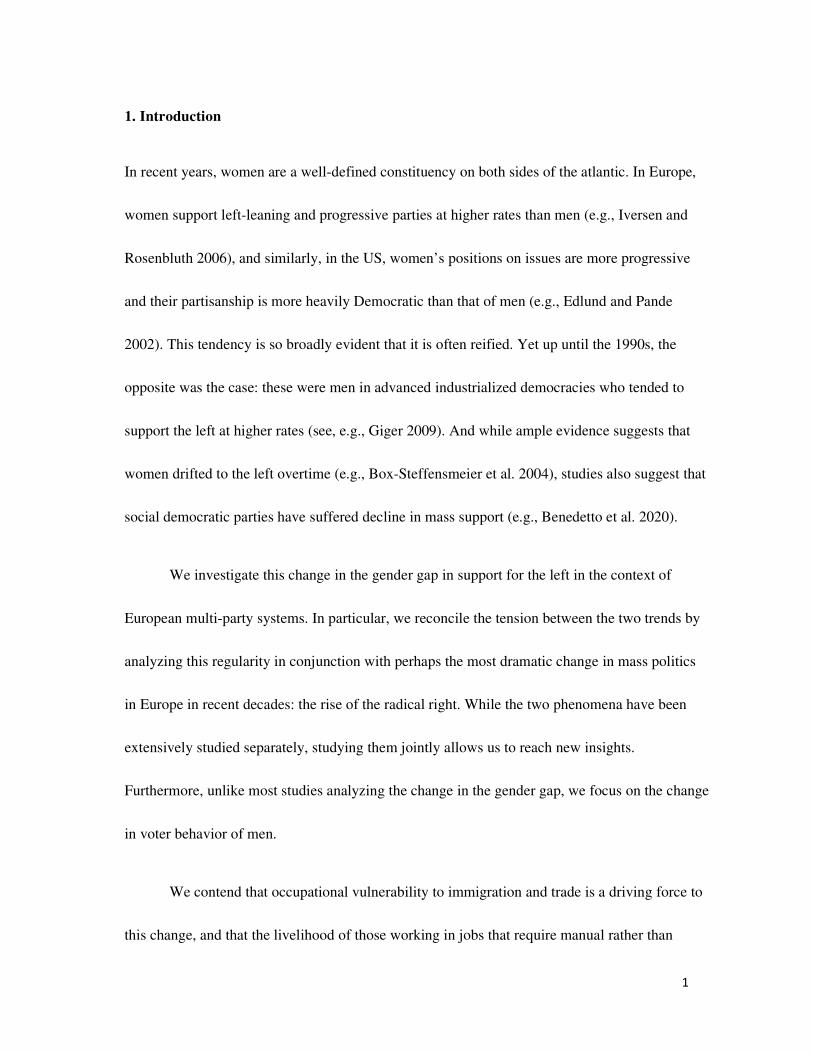
1. Introduction
In recent years, women are a well-defined constituency on both sides of the atlantic. In Europe,
women support left-leaning and progressive parties at higher rates than men (e.g., Iversen and
Rosenbluth 2006), and similarly, in the US, women’s positions on issues are more progressive
and their partisanship is more heavily Democratic than that of men (e.g., Edlund and Pande
2002). This tendency is so broadly evident that it is often reified. Yet up until the 1990s, the
opposite was the case: these were men in advanced industrialized democracies who tended to
support the left at higher rates (see, e.g., Giger 2009). And while ample evidence suggests that
women drifted to the left overtime (e.g., Box-Steffensmeier et al. 2004), studies also suggest that
social democratic parties have suffered decline in mass support (e.g., Benedetto et al. 2020).
We investigate this change in the gender gap in support for the left in the context of
European multi-party systems. In particular, we reconcile the tension between the two trends by
analyzing this regularity in conjunction with perhaps the most dramatic change in mass politics
in Europe in recent decades: the rise of the radical right. While the two phenomena have been
extensively studied separately, studying them jointly allows us to reach new insights.
Furthermore, unlike most studies analyzing the change in the gender gap, we focus on the change
in voter behavior of men.
We contend that occupational vulnerability to immigration and trade is a driving force to
this change, and that the livelihood of those working in jobs that require manual rather than

2
communication skill dexterity -- most of whom are men -- is particularly in peril. These workers
shift their support from the mainstream left to the radical right that presents itself as a guardian to
dislocated interests of manual workers. Additionally, we hold that these effects are contingent on
the economic positions endorsed by the left and the radical right. Where the left holds on to its
traditional values, greater male domination of the manual labor market will be associated with
greater support for the left by men. This is not the case, however, where the left and the radical
right each gravitate toward the center. Our puzzle of the realignment of the vote along gender
lines is therefore answered by an occupational realignment that takes place in a gender-
segregated labor market.
We utilize public opinion data in 18 democracies over a 46 year period (the
Eurobarometer and European Social Survey between 1970-2002 and 2002-2016, respectively),
along with labor data about skills relevant for different jobs, and party placement data (the
Chapel Hill Expert Survey). To the best of our knowledge, this analysis of the electoral gender
gap is the most extensive in scope undertaken to date. Our analysis is three pronged. We first
establish a bird's eye view of aggregate trends of the gender gaps and their relationships,
highlighting voting trends of manual workers. We next conduct individual-level analysis,
focusing on the effect of skills. Lastly, we revisit the gender gap and focus on the combined
effect of gender-segregation of the labor market and party placements. Our results support our
hypotheses.
The paper proceeds as follows. The next section reviews accounts of the gender gap on

3
the left and on the radical right. The following section develops our hypotheses. The empirical
analysis is presented in Section 4. The final section concludes.
2. The gender gap(s): Accounts and questions left
2.1 Change over time
Students of both gender and electoral politics have long established two stylized facts
with respect to the gender gap in political attitudes as well as in voting. First, compared with
men, women in Western democracies support progressive policies and vote for left-leaning and
progressive parties at higher rates (‘the modern gender gap’, e.g., Edlund and Pande 2002,
Iversen and Rosenbluth 2006). Second, about five decades ago, in the 1970s, the gender gap in
voting was in the opposite direction. Men were the ones to support left-leaning parties at higher
rates, while women tended to support conservative parties (‘the traditional gender gap’). A
secular trend in the gender gap led to the narrowing of the traditional gap and in most countries
to its reversal (e.g., Giger 2009, Inglehart and Norris 2000).
Studies of the electoral gender gap ascribe the drift of women to the left to one of two
(related) sets of factors. The first is structural and holds that women’s interests have changed
along with the rise in female participation in the labor force (e.g. Manza and Brooks 1998), their
employment in the public sector (e.g., Box-Steffensmeier et al. 2004), and changes in the family
structure due to the possibility of divorce (Iversen and Rosenbluth 2006). The second examines
how changes in values and political culture bring about change in political behavior (see, e.g.,

4
Inglehart and Norris's (2000, 2003) theory of a rise in post-material values, and Greenberg
(2001) on the effect of secularization).
While scholars are in agreement that women secularly drifted to the left overtime, it is
not the case that the left has been secularly gaining support overtime. In fact, alternation of
power between left-leaning and right-leaning parties and even decline in support for the left
overtime have been a commonplace (see, e.g., Benedetto et al. 2020, Rennwald and Pontusson
2020). It is likely the case, therefore, that alongside the shift of women to the left there has been
a shift of men away from the left. To the best of our knowledge, however, few studies analyzing
the gender gap focus on men’s voting behavior, and those that do, study it in the context of the
US two-party system (see Norrander 1999 for analysis of men’s vote in the South and Kaufmann
and Petrocik 1999 for analysis of salience men and women assign to different considerations).
2.2 The gender gap in support for the radical right
Perhaps the most dramatic phenomenon in mass behavior in Europe in the past several
decades has been the rise of the radical right. Taking different ideological forms (e.g., neo-
fascist, populist) and focusing on both domestic policy of immigration and foreign policy vis-a-
vis the European Union, radical right parties have acquired high levels of support and have
gradually infiltrated mainstream politics.
Analyses of support for the radical right have found that it enjoys support of men more
than that of women (Akkerman and Hagelund 2007, Givens 2004, 2005, Harteveld and

5
Ivarsflaten 2018, Van der Brug and Fennema 2007). Studies offer different accounts for this
regularity. According to some, the hierarchical and usually male-dominated structure of radical
right parties tends to attract more male supporters than female ones (Kitschelt and McGann
1997). An additional explanation focuses on the antifeminist agenda promoted by many radical
right parties (Mayer 1998). Yet another explanation highlights the fact that often women do not
differ from men in relevant policy positions (e.g., immigration) but they possess a stronger need
to control prejudice which in turn hinders their tendency to support the radical right (Harteveld
and Ivarsflaten 2018). Lastly, the ethics of caring, including sympathy for the disadvantaged
catalyzed by feminist consciousness (Conover 1988) may pull women away from radical right
parties.
A general analysis of the rise in support for the radical right is not within the scope of our
analysis. Importantly, our goal is not to adjudicate between key explanations for the general rise
in support for the radical right, most notably culturalist theories and interest based/structuralist
ones -- in fact, our empirical analysis incorporates elements from both these approaches. The
discussion here focuses on explanations that are directly relevant to analyzing the gender gap in
support for the radical right, and as we will show, assist in understanding the change in the
gender gap in support for the left.
The culturalist approach focuses on symbols, values, and identity as predictors of support
for the radical right in general and anti-immigrant sentiments in particular. In a comparative
study of European democracies, Sides and Citrin (2007) find that individuals’ attitudes toward
6
immigration are affected by national identity and in particular preference for cultural
homogeneity. More generally, in their analytic review, Hainmeuller and Hopkins (2014) contend
that attitudes on immigration can be systematically explained by cultural sentiments rather than
economic interests. Another strand of this literature argues that supporters of radical right parties
often feel that traditional values have been abandoned in current post-materialist cosmopolitan
culture (Inglehart and Norris 2017).
The interest-based approach emphasizes the economic interests of native workers in
shaping attitudes. Scheve and Slaughter (2001) find that, in the US, low-skill workers support
restrictions on immigration more than their high-skill counterparts (although see Hainmueller,
Hiscox and Margalit 2015, and Hainmueller and Hiscox 2010, who find no such evidence). This
relationship, they show, does not systematically vary with the level of immigration to the
community. In the European context, Ortega and Polavieja (2012) find that distinct from
education, the degree of manual skill dexterity required in a native worker’s occupation is
positively correlated with anti-immigrant sentiments, and holding a job that requires high human
capital is positively correlated with pro-immigrant attitudes (see also Polavieja 2016).
According to some within this strand of research, anti-immigrant sentiments promoted by
radical right parties are framed to appeal to those who have lost out due to globalization, usually
blue-collar male workers whose jobs have been put at risk by the influx of manual immigrant
workers (Givens 2004, Jackman and Volpert 1996, Mayer 1998). Indeed, Harteveld (2016) finds
that radical right parties that adopt a centrist or center-left economic platform succeed in
7
attracting voters of low socio-economic status better than their counterparts on the radical right
who do not do so1.
3. Putting the two together: the electoral gender gap(s) in a changing party system
The observed reversal of the gender gap on the left, along with the rise in support for the
radical right which is disproportionately championed by male voters calls for an examination of
the two gender gaps as potentially linked. How does the change in voting behavior of men
contribute to the change in the gender gap on the left?
3.1. Occupational vulnerability
Students of political economy have highlighted the importance of identifying the
advantaged and disadvantaged in the labor market. Yet depending on focus, studies differ in both
aspects of one’s disadvantage they identify and their operationalization. Rueda (2005), for
example, focuses on materialized hardship in individuals’ current labor market status and defines
outsiders as those who are either unemployed or hold low salary jobs. Häusermann and
Schwander (2011) conceptualize outsiderness as belonging to an occupational group that has
above-average rates of unemployment.
1 This is consistent with Schain’s (2000) finding that supporters of the National Front are
characterized by concern about unemployment compared to supporters of mainstream right parties.

8
Inspired by this framework and adapting it to the question at hand, we focus on
occupational vulnerability of workers to immigration and trade in particular. Individuals working
in sectors that require manual rather than communication skills are vulnerable to both
competition with immigrant workers who possess manual skills and offshoring of their jobs due
to trade. Language and communication skills, on the other hand, often serve as a security fence
for native workers and present a labor-market barrier for immigrants.2 We can thus think of
manual vs. communication skills as indicators of occupational uncertainty at times of rapid
globalization, trade and immigration, whereby the more (less) manual (communication) skill
dexterity one’s job requires, the more occupationally vulnerable one is.3
We classify workers by the skill dexterity required in the sector they work in and hence,
we contend, the potential threat to their livelihood posed by immigration or trade. Manual
workers might look for ways to offset that risk by supporting a party that explicitly promotes
anti-immigrant rhetoric, opposes trade and presents itself as a fighter against these “external”
threats. This approach allows us to capture a worker’s vulnerability in the face of current and
potential future shocks to the labor market. This logic resonates with recent work on the
2 This is consistent with Peri and Sparber’s (2011) finding of limited substitutability between highly
educated immigrants and native workers.
3 Note that manual skills are differentiated from routine skills, a predictor of job vulnerability vis-a-vis
automation (e.g., Kurer 2020, Thesissen and Rueda 2019).
9
importance of economic risk in shaping policy preferences and political behavior (Rehm 2016).
In particular, we hypothesize that:
H1a. Individuals working in sectors that require high manual skill dexterity are more likely to
support the radical right compared to their counterparts working in sectors that do not require a
high level of manual skills.
H1b. Individuals working in sectors that require high communication skill dexterity are less
likely to support the radical right compared to their counterparts working in sectors that do not
require a high level of communication skills.
While our first set of hypotheses focuses on the individual-level and links occupational
vulnerability and vote choice, we now turn to contextualize it. Our next step specifies how
positions of parties on the left and the radical right interact with labor market characteristics to
affect the gender gap.
3.2 Political context: The gender gap, parties and labor markets
We contend that, under certain conditions, manual workers will be more likely to
abandon the left, and given that more men than women work in manual jobs, this will in turn
affect the gender gap on the left. We focus on two factors: the degree to which the manual labor
market is gender segregated, and the economic position of the mainstream left and the radical
right.
Although a coherent party family, some social democratic parties persistently promote
10
traditional social democratic macro-economic policies, while others have pursued centrist
policies and third-way solutions or have shifted their efforts to other domains such as identity.
The policy supported by the mainstream left, we propose, is relevant for vote shifting of manual
workers. Where the mainstream left takes decidedly leftist positions, a greater number of men in
position of occupational vulnerability will be associated with a greater number of men
supporting the left, and thus the gender gap will be larger. Conversely, where mainstream left
parties take centrist policy positions, greater male domination of the manual labor market will be
associated with a smaller gender gap -- i.e., with fewer men than women who support the left.
This relationship will be observed where the radical right is a viable alternative for voters, but
not otherwise. Under the latter, neither the economic position of the mainstream left nor the
gender segregation of the manual labor market will be associated with a particular change of the
gender gap in support for the left. Therefore, where the radical right is a viable alternative:
H2. where mainstream left parties pursue leftist (centrist) economic positions, greater male
domination of manual sectors will be associated with a larger (smaller) gender gap on the left.
In conjunction with changes in policies pursued by the mainstream left that may serve as
push factors for some of its constituencies, radical right parties might play a role in pulling voters
in their direction. While most radical right parties pursue anti-immigrant rhetoric and claim to
guard workers’ dislocated interests, some endorse decidedly laissez faire economic policies
while others support state intervention in the economy (Mudde 2007). Indeed, in a study of ten
radical right European parties, Harteveld (2016) finds that those endorsing redistribution tend to
11
win the support of pro-welfare nativists, a group of voters often embedded in working class
roots. Additionally, upper middle-class voters (measured in subjective terms) tend to support
radical right parties that hold pro-market economic positions. We therefore expect the
combination of positions of the two parties to play a role in encouraging or discouraging voters
to shift their support. When both the left and the radical right take distinctly different positions, it
is harder for voters to shift their support. When their respective positions are closer to the center,
however, the combination of push and pull factors might make it easier for occupationally
vulnerable (male) voters to shift their support. Combined with gender-segregation of manual
sectors, we thus hypothesize that:
H3. where the mainstream left and the radical right pursue relatively similar (different) economic
positions, greater male domination of manual sectors will be associated with a smaller (greater)
gender gap.
In the next section we empirically examine these hypotheses.
4. Empirical strategy: The gender gap on the left and on the radical right
Our starting point (which we establish empirically below) is that the gender gap on the
left in Europe has secularly changed from a traditional gap to a modern gap such that to date,
women support left leaning parties at higher rates than men (Giger 2009). The study of large
overtime drifts in voter behavior in a multiparty system poses challenges not present in the two-
party context. Many potential drifts may take place simultaneously, making it difficult to
12
empirically isolate the realignment of a particular group. While due to data limitations we are
unable to trace individual votes and follow them over decades ‘wherever they went’, in the
below three-pronged empirical analysis, we show that as a group men holding manual jobs
realigned compared to the general population.
We begin with a broad-brush analysis of a 46-year aggregate trends in a cross-section of
countries. We focus on the gender gap on the left and the radical right, as well as the rate of
support for the two among male and female manual workers. Informed by these analyses, in the
second part we shift to an individual-level analysis of support for the radical right drawing on
ESS data (2002-2016), highlighting the effect of gender and skill. Lastly, we contextualize our
findings in the first two sections, analyzing the contingency of the gender gap on the gender
segregation of the manual labor market and the economic positions of mainstream left and
radical right parties.
4.1. Data and measurement
Public opinion and vote choice. To conduct our analysis, we draw on several sources of data.
For public opinion data, we utilize Eurobarometer (hereafter EB) data between 1970-2002 as
well as eight waves of the European Social Survey (hereafter ESS) between 2002-2016,
providing us public opinion data from forty-six years altogether. The former includes five
countries from 1970 and quickly turns into nine in 1973, and then gradually grows in scope as
more countries join the EU, reaching respondents from sixteen countries in the 2002 wave and a

13
total of 339 country/year samples, while the latter includes eighteen countries in all waves with a
total of 119 country/year samples (for details regarding the countries sampled in each wave see
Appendix A).4
To evaluate the gender gap, we first sorted parties that obtained at least a single
parliamentary seat in the elections immediately following the survey into party families. To do
so, we pooled four classifications of party families that once combined cover the time range of
1970-2016. Specifically, we drew on (i) Armingeon et al. (2009), (ii) Laver et al.(2011), (iii)
Norris (2005) (the latter classifies radical right parties only), and (iv) the ParlGov data set. While
the first three sources usually cover the period of 1970-2002, the classifications by ParlGov and
Laver et al. cover most of our data between 2002-2016 (for further details on party classification
see Appendix B).
Having sorted parties to families, we proceeded to focus on two party families: the left
and the radical right. The left includes socialist, social democratic, and left-socialist parties. The
radical right includes radical right, right wing, populist, protest, far right, and neo-fascist parties.
We then coded each respondent’s vote choice employing dummy variables that correspond with
these two families (with a total of 223,858 positive scores for the left and 18,218 positive scores
for the radical right). We calculated vote-shares of the two party families for each country/year.
Finally, and consistent with previous studies, we defined the gender gap for every party family as
4 Note that vote choice is not asked in the Eurobarometer as of 2002.
14
the proportion of men supporting a particular party family minus the proportion of women
supporting that same party family.5
Skills. For our analysis of occupational vulnerability of native workers in the face of
competition with immigrant workers, we utilize information about the degree to which different
occupations require manual or communication skills. To do so, we classify each sector (first digit
of ISCO code in our ESS data) by the degree to which it relies on manual or communication
skills. This is done by utilizing and adapting D’Amuri and Peri (2014) categorization of O*NET
characterization of occupations. We also adapt EB occupational categorization and match it with
the appropriate ESS category (see Appendix C for detailed description). Thus, sectors requiring
tasks such as oral comprehension, oral expression, speech clarity, written comprehension and
written expression score high on communication skills while those requiring wrist-finger speed
and trunk strength score high on manual skills.
Economic positions of parties. To measure economic positions of left and radical right
parties, we utilize the Chapel Hill Expert Survey (CHES) data (2002, 2006, 2010 and 2014). The
economic left-right item runs from 0 to 10, where parties on the lower end of the scale ‘want
government to play an active role in the economy’ and those on the upper end ‘emphasize
reduced economic role for government: privatization, lower taxes, less regulation, less
government spending, and a leaner welfare state’ (Bakker et al. 2014). The 2010 wave was cross-
5 Throughout our analysis, we screen for self-reported turnout in the last elections.
15
validated with alternative sources of party positioning information by Bakker and his colleagues,
who conclude that ‘party experts in Europe view the left/right economic dimension of party
competition in largely the same way across countries’ (2014: 1100). Scores range from 1.5 to 5
on the left and 4 to just above 8 for the radical right.
Gender segregation of the manual labor market. To measure gender segregation of
manual sectors we subtracted the number of women working in the three most manual sectors
from the number of men in them and divided the difference by the total number of manual
workers (ESS 2002-2016). Theoretically, it varies from -1 (perfect female domination) to +1
(perfect male domination), with 0 representing a perfectly even distribution. Empirically, all
manual sectors in our data were found to be male dominated (Portugal 2012 and 2016 are
exceptions with scores of -0.14 and -0.08, respectively), with Sweden (2008) scoring the highest
(0.62), indicating that four in five employees in manual sectors are men.
5 Empirical analysis
5.1 Gender gaps: aggregate trends
We begin our empirical investigation with an examination of the gender gap
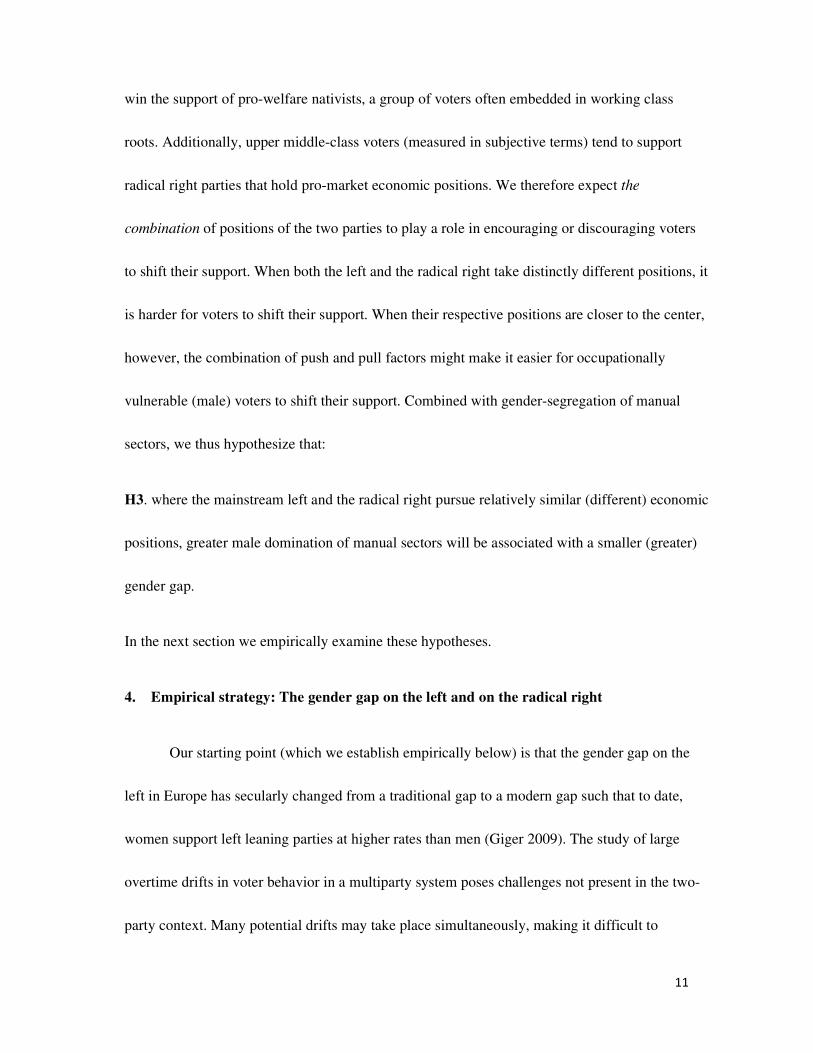
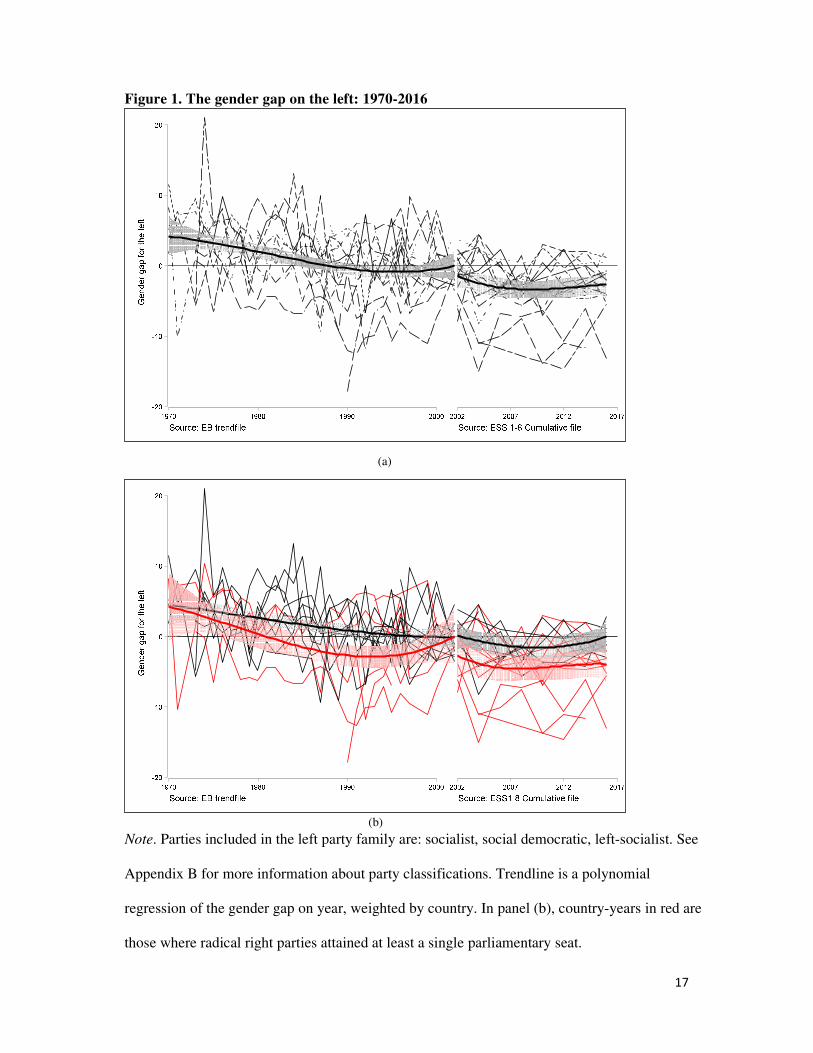
overtime. Figure 1a presents the trend of the gender gap for the left over time. The combination
of the EB survey (1970-2002) and ESS (2002-2016) allows for a forty-six year trend with five to
sixteen and eighteen Western European countries surveyed at any single point, respectively. The
EB is run twice (and in some cases thrice) a year (and collapsed to a single annual dataset in the

16
longitudinal file) and the ESS is run biennially. The figure presents the gender gap for the left
party family on the vertical axis such that a positive gender gap indicates that men support the
left at a higher rate than women do (traditional gap). The aggregate trend depicted in the figure
shows a secular trend from a traditional gap to a modern one whereby women support left-
leaning parties at higher rates than men do. Cross-country variation in pace of change
notwithstanding, with the exception of Spain, all countries exhibit a trend in the same direction
(see Giger 2009 for similar findings) and by the mid 1990’s an overwhelming majority of
countries exhibit a modern gender gap. Having established this trend, we shift now to examining
the gender gap for the radical right.
17
Figure 1. The gender gap on the left: 1970-2016
(a)
(b)
Note. Parties included in the left party family are: socialist, social democratic, left-socialist. See
Appendix B for more information about party classifications. Trendline is a polynomial
regression of the gender gap on year, weighted by country. In panel (b), country-years in red are
those where radical right parties attained at least a single parliamentary seat.
18
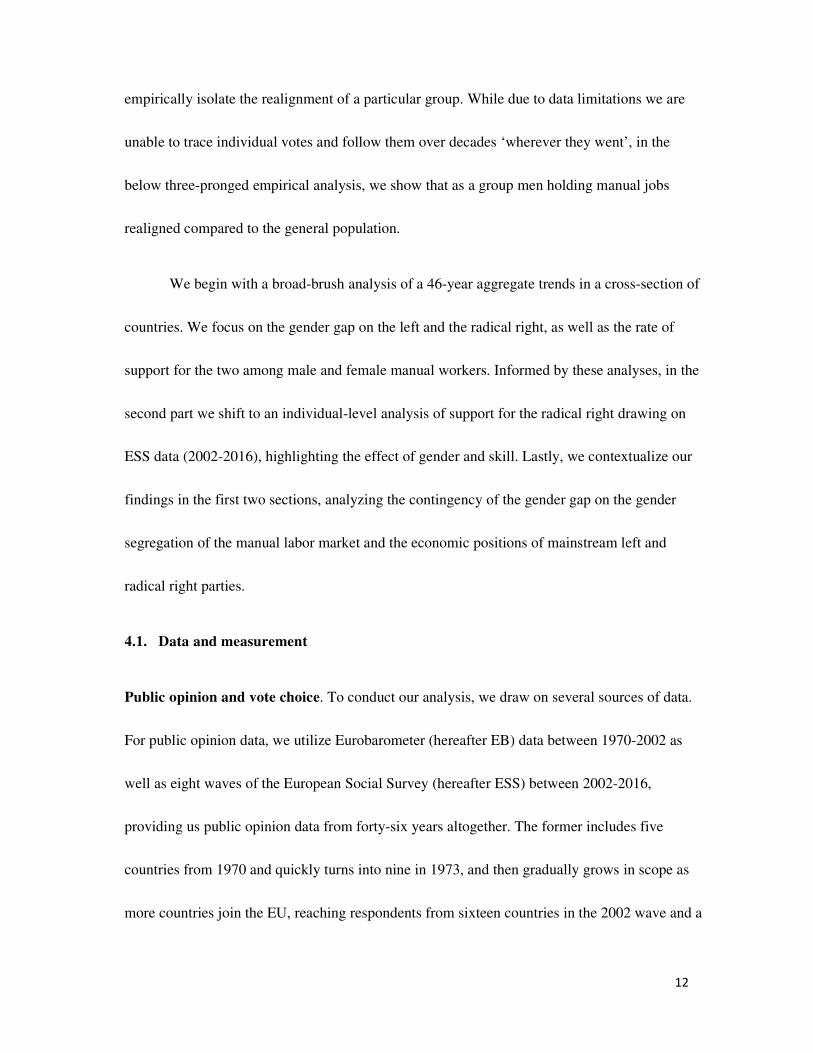
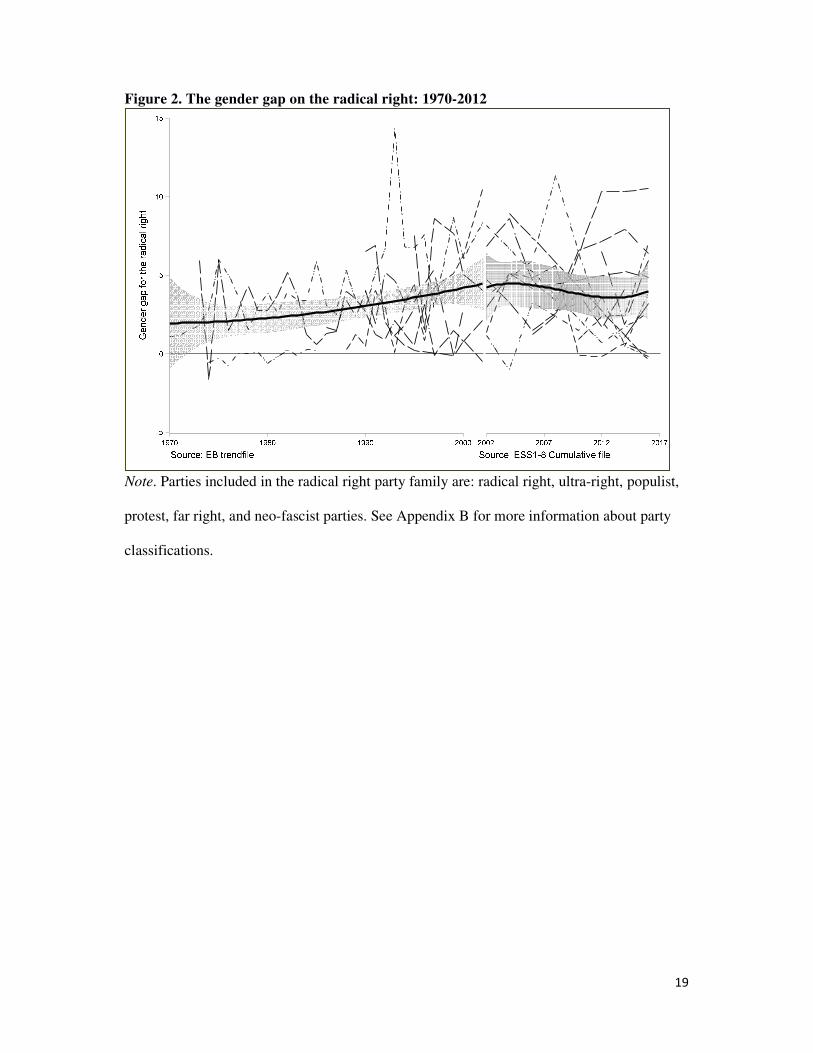
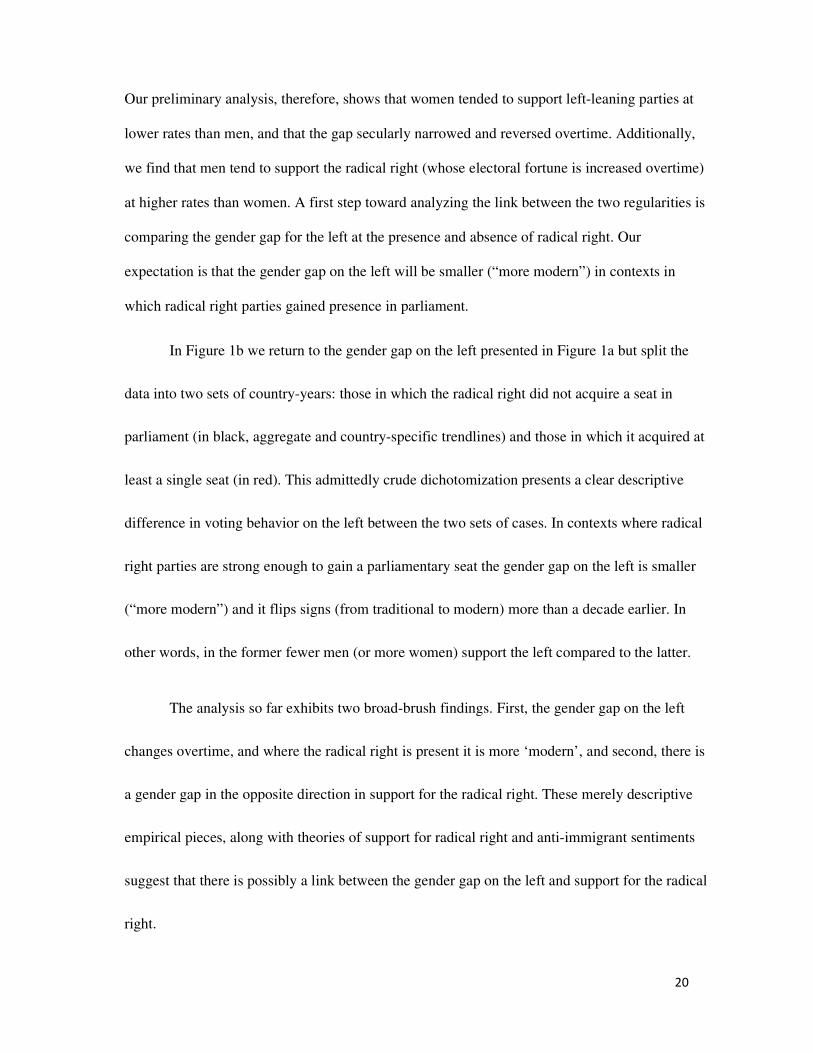
Figure 2 presents the gender gap for the radical right across countries and over time (1970-2016).
On the vertical axis is the gap for the radical right party family. Here, too, a positive gap implies
that men support the radical right at a higher rate than women do. The aggregate trend reflected
in the data indicates a clear pattern whereby men are consistently more likely to support radical
right parties than women.
19
Figure 2. The gender gap on the radical right: 1970-2012
Note. Parties included in the radical right party family are: radical right, ultra-right, populist,
protest, far right, and neo-fascist parties. See Appendix B for more information about party
classifications.
20
Our preliminary analysis, therefore, shows that women tended to support left-leaning parties at
lower rates than men, and that the gap secularly narrowed and reversed overtime. Additionally,
we find that men tend to support the radical right (whose electoral fortune is increased overtime)
at higher rates than women. A first step toward analyzing the link between the two regularities is
comparing the gender gap for the left at the presence and absence of radical right. Our
expectation is that the gender gap on the left will be smaller (“more modern”) in contexts in
which radical right parties gained presence in parliament.
In Figure 1b we return to the gender gap on the left presented in Figure 1a but split the
data into two sets of country-years: those in which the radical right did not acquire a seat in
parliament (in black, aggregate and country-specific trendlines) and those in which it acquired at
least a single seat (in red). This admittedly crude dichotomization presents a clear descriptive
difference in voting behavior on the left between the two sets of cases. In contexts where radical
right parties are strong enough to gain a parliamentary seat the gender gap on the left is smaller
(“more modern”) and it flips signs (from traditional to modern) more than a decade earlier. In
other words, in the former fewer men (or more women) support the left compared to the latter.
The analysis so far exhibits two broad-brush findings. First, the gender gap on the left
changes overtime, and where the radical right is present it is more ‘modern’, and second, there is
a gender gap in the opposite direction in support for the radical right. These merely descriptive
empirical pieces, along with theories of support for radical right and anti-immigrant sentiments
suggest that there is possibly a link between the gender gap on the left and support for the radical
right.
21
5.2. Manual workers: aggregate trends
Recall that our argument holds that (a) occupational vulnerability due to immigration and
trade in particular leads voters to rally around the radical right, and that (b) given the segregation
of the labor market, men tend to hold jobs that are more vulnerable to these factors compared to
women. In the next step, we focus aggregately on women and men holding manual jobs between
1970-2016. Specifically, utilizing the EB and ESS, we (a) compare the voting behavior of these
groups to that of the general population, and (b) complement this analysis with an examination of
the relative weight of these groups among supporters of the left and the radical right.
To do so, we first identify manual workers. We append the data for each respondent with
the degree to which their job requires manual and communication skill dexterity. The two are
measured in terms of percentiles: the score indicates the percentile of the sector in the economy
in terms of use of the relevant skill such that high number indicates that workers in the sector use
the skill with greater intensity compared to others (see Appendix C for sources and construction
of these variables). Not surprisingly, the two are strongly and negatively correlated (r = -0.98).
The fit is nearly perfect: the more a sector requires communication skills the less it requires
manual skills.
Table 1 presents the ten sectors classified by ISCO along with examples of specific
occupations and their percentiles on manual and communication skills. Sectors are organized in
ascending order of manual skill dexterity with senior officials and managers (Sector 1) scoring
22
the highest on communication skill and the lowest on reliance on manual skills. At the bottom
end of the list are the three most manual sectors: elementary occupations, immediately followed
by craft workers and plant and machine operators and assemblers. In the analysis below we refer
to workers in these three sectors (9, 7, and 8) as manual workers (the next sector in terms of use
of manual skills is services which substantially differs from these three).6
The last column of Table 1 presents the share of male workers in each sector. Note the
gender segregation of the manual sectors, with craft and plant and machine operators sectors
being heavily dominated by men (seventy-nine and eighty-six percent, respectively). Elementary
occupations, however, have more women than men due to occupations such as domestic helpers
that are included in this category. Overall, while in many aspects of labor market segregation it is
women who are disadvantaged compared to men (see, e.g., Sector 1), our argument about skill-
based occupational vulnerability due to immigration and trade applies to men more than women.
6 Skill intensity scores are not available for skilled agricultural and fishery workers (3.82% of
respondents) and armed forces (0.35%).

23
Table 1. Classification of sectors by skill dexterity
Example Occupations Manual
skill
percentile
Com.
skill
percentile
% men
in
sector
1. Legislators, senior
officials and managers
Corp. managers, managers in
restaurants and hotels
21.75 85.45 69
4. Clerks Accounting and bookkeeping,
secretaries
29.2 70.18 29
3. Technicians and
associate professionals
Estate agents, medical
assistants
37.83 67.42 47
2. Professionals Computing professionals,
lawyers
38.14 69.46 47
5. Service, shop and market
sales workers
Cooks, police officers, waiters 38.61 64.46 29
9. Elementary occupations Street vendors, domestic
helpers, garbage collectors
71.19 29.86 37
7. Craft and related trades
workers
Roofers, plumbers, sheet
metal workers
75.32 18.1 86
8. Plant and machine
operators and assemblers
Plant operators, textile, fur
and leather plant operators
78.23 21.11 80
6. Skilled agricultural and
fishery workers
Dairy and livestock producers, crop growers
Note. Percentiles describe manual and communication skill intensity (Source: D'Amuri and Peri,
2014)
24
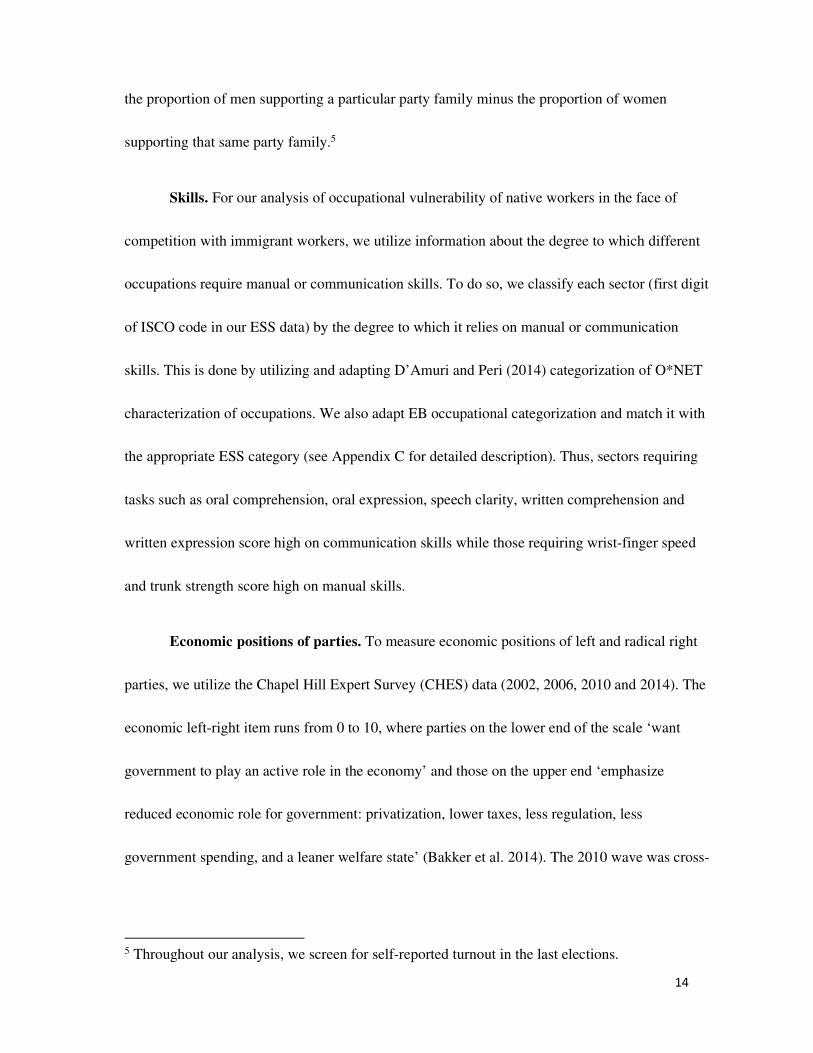
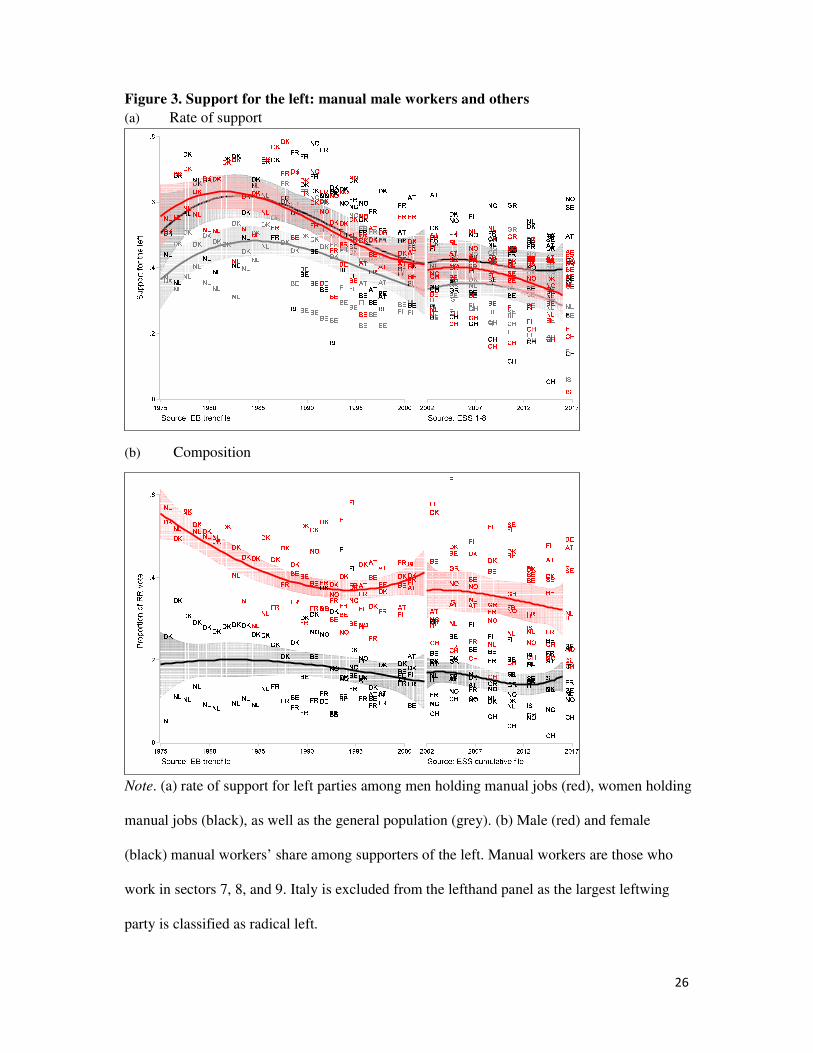
We begin by examination of the proclivity of women and men working in manual jobs to
support the left overtime. For comparability with the analysis below, data in the figure are
limited to country-years in which the radical right attained presence (at least a single seat) in
parliament. As a reference point, the figure presents the vote-share for the left among the general
population (in gray). Figure 3a shows that support for the left among both women and men
holding manual jobs declines overtime, as is that of the general population, but the decline
among men is steeper. Note that the trendlines for the two subsets (male and female manual
workers who support the left) is calculated among the broader group of male and female manual
workers. Thus, it is not about the relative size of each group in these sectors.
In Panel (b) we examine the composition of the left overtime and in particular the
proportion of men holding a manual job (in red) and that of women holding similar jobs (in
black) among left supporters. The figure shows two important things. First, men holding manual
jobs are a larger sub-constituency among supporters of left parties compared to their female
counterparts. This is consistent with the fact that more men are occupied in manual jobs
compared to women (37% compared to 25% in the EB, and 35% compared to 16% in the ESS
data). Second, both men and women holding manual jobs become less of a central constituency
for left parties: their share among party supporters declines overtime, and that of men declines
more steeply. And although regardless of their vote, the share of manual workers in the general
population in advanced industrialized democracies declines overtime due to technological
changes and global economic forces, the analogous analysis of the radical right presented next

25
suggests that this trend is not simply a product of the decline of this segment of the population.
Rather, it suggests an occurrence of an occupational and gender-based realignment of vote
choice.
26
Figure 3. Support for the left: manual male workers and others
(a) Rate of support
(b) Composition
Note. (a) rate of support for left parties among men holding manual jobs (red), women holding
manual jobs (black), as well as the general population (grey). (b) Male (red) and female
(black) manual workers’ share among supporters of the left. Manual workers are those who
work in sectors 7, 8, and 9. Italy is excluded from the lefthand panel as the largest leftwing
party is classified as radical left.

27
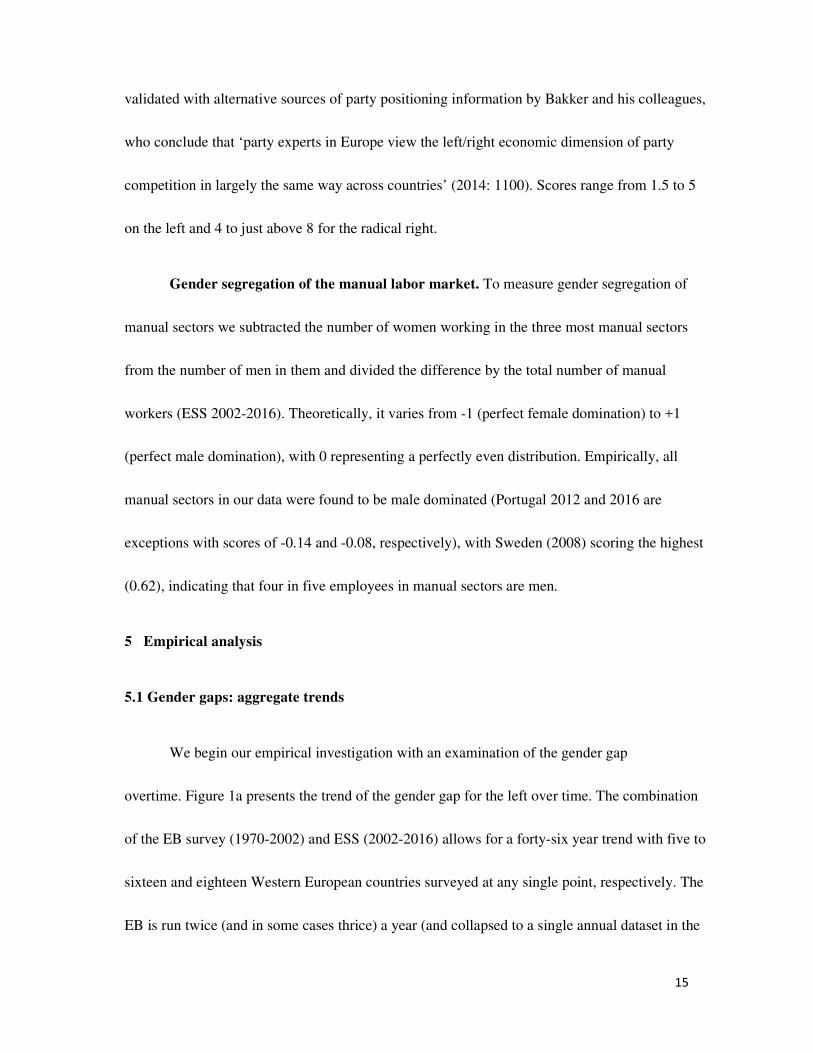
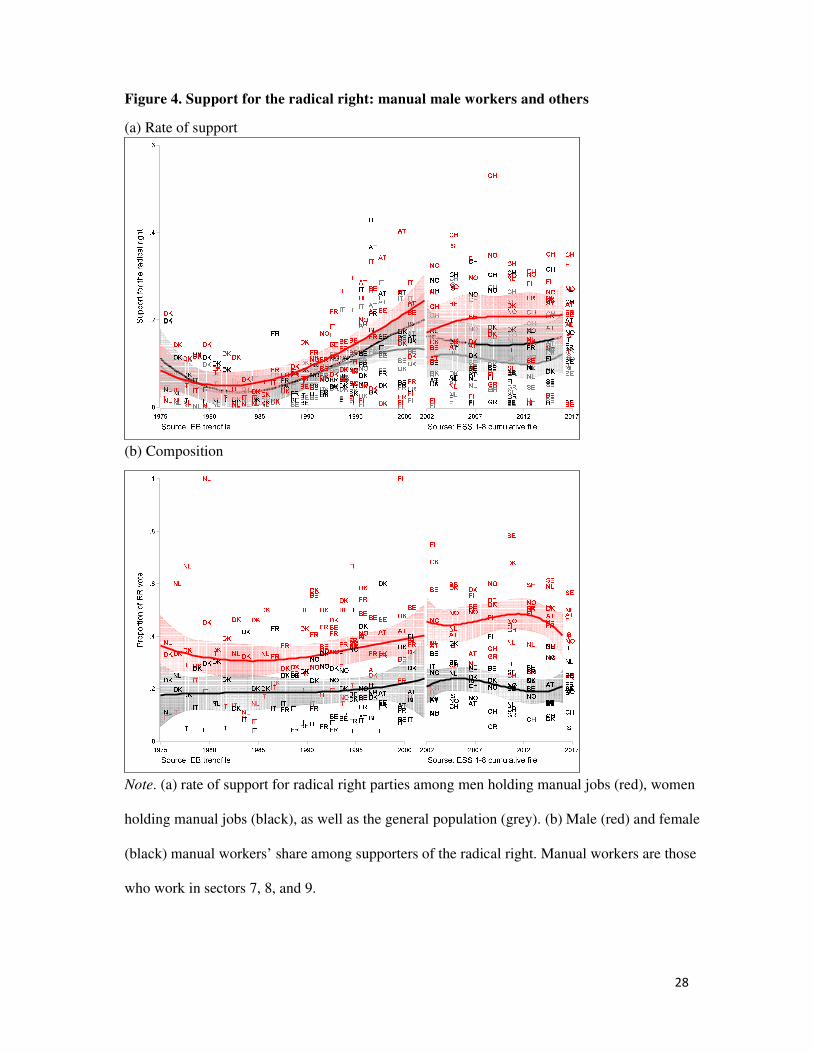
Figure 4 displays analogous patterns in the radical right. Panel (a) presents the rate of
support for the radical right overtime among men and women who hold manual jobs (in red and
black, respectively), as well as that of the overall sample (in gray). Consistent with common
knowledge, the general trend is an increase in the vote-share of the radical right. This is also the
trend among women and men holding manual jobs, at rates slightly higher than those of the
general population. Panel (b) presents the share of men and women holding manual jobs among
all supporters of the radical right overtime (in red and black, respectively). The figure shows a
clear pattern by which overtime men holding manual jobs become a key constituency of the
radical right relative to women. This pattern is particularly important in light of the decline in the
share of men working in manual jobs on the left observed in Figure 3b.
28
Figure 4. Support for the radical right: manual male workers and others
(a) Rate of support
(b) Composition
Note. (a) rate of support for radical right parties among men holding manual jobs (red), women
holding manual jobs (black), as well as the general population (grey). (b) Male (red) and female
(black) manual workers’ share among supporters of the radical right. Manual workers are those
who work in sectors 7, 8, and 9.

29
The analysis above further links between the gender gap on the left and that on the radical
right. It shows that manual workers abandoned left-wing parties as well as that they support the
radical right at a rate greater than that of the general population. We turn next to examine the
gender gap in support for the radical right and in particular the effect of occupational
vulnerability on the vote and its relation to gender.
5.3. The gender gap in support for the radical right: Individual-level analysis
To investigate the effect of occupational vulnerability on the vote, we conduct an
individual-level analysis of vote choice utilizing eight ESS waves (2002-2016). Our dependent
variable is dichotomized, such that 1 indicates support for the radical right and 0 otherwise.
Recall that our first hypothesis linked the type of skill required in one’s job (as a proxy
for occupational vulnerability) to their vote choice. We thus include in the regression gender and
skill dexterity (communication or manual). Our predictions, therefore, refer to the coefficients of
the job market variables: we expect communication skills to have a negative effect on support for
the radical right and manual skills to have a positive one. Gender in itself may still be a factor
predicting support for the radical right due to some (or all) of the explanations mentioned above -
- it is not our specific prediction that the gender coefficient will be zero, nor is it our goal to
nullify it.
Cultural factors. As mentioned above, we do not argue against cultural explanations for
support of the radical right. In fact, we include in our analysis three items available from the ESS
that measure anti-immigrant attitudes based on cultural/identity-based sentiments: (i)

30
agreement/disagreement that immigrants undermine country’s cultural life, (ii) support for
allowing immigrants of a race different from the country’s majority, (iii)
agreement/disagreement that immigrants make the country a worse place to live. We also include
education (in years) (Hainmueller and Hiscox 2007), as well as the size/type of community in
which one lives (a farm home in the countryside to a big city), which is a likely indicator of
opportunities for contact with and exposure to immigrants as well as cosmopolitanism (Haubert
and Fussell 2006).
Additionally, we include two items that measure interest-based immigration sentiments:
(iv) support for allowing immigrants from poorer countries outside Europe, and (v)
agreement/disagreement that immigrants are bad for the country’s economy. Both these items
and the three cultural items are coded such that high values indicate higher levels of anti-
immigrant sentiment. Given the focus of our argument on occupational vulnerability, we also
control for unemployment (specifically, has the respondent ever been unemployed for a period
greater than three months), as well as union membership. Lastly, we control for age, religiosity,
and whether one is native or foreign born.7 Appendix D reports question wording of all items
used and Appendix E reports descriptive statistics.
7 We omit from the analysis Finland 2002, 2004, and 2006 in which the number of
respondents reporting support for the radical right was smaller than 1 percent and did not
allow for a meaningful multivariate estimation.

31
One might wonder why the number of immigrants per sector in any given country-year is
not included on the right hand side. The reason is twofold. Theoretically, according to our
argument, the penetration of immigrants to the sector is post-treatment to skill: it is affected by
the degree to which communication vs. manual skills are required in the sector and thus should
not be controlled for in the analysis. Empirically, studies show that the number of immigrants in
one’s surroundings does not necessarily predict anti-immigrant attitudes (e.g., Scheve and
Slaughter 2001).
Table 2 presents the results drawing on all eight waves, including country and year fixed
effects (results are similar across years, see Appendix F). As a reference, our first model includes
only gender and control variables. The next three models include communication skill dexterity
and control variables. While Model 2 omits anti-immigrant sentiments on the right hand side,
Model 3 includes them. The results support our hypotheses. Requirement of communication
skills in one’s sector reduces the tendency to support the radical right in both models. Note that
while gender alone has an effect on supporting the radical right in Model 1 (as expected, men
support it at a higher rate than women do), this result is somewhat weakened in most following
models.
Models 5 and 6 repeat this exercise with manual rather than communication skills. Here,
too, we find support for our thesis. The more manual skill dexterity is required in one’s job, the
more likely she is to support the radical right. Across models, the coefficients on our control
variables are as expected. Education, union membership, religiosity, and having born outside
32
one’s country reduce the likelihood of supporting the radical right while being unemployed in the
past increases it. Additionally, in most models, residing in an urban area reduces the likelihood
of supporting the radical right. Lastly, where included, all anti-immigrant attitude items are
positively correlated with support for the radical right.
As a complementary examination of our argument, we test a differential effect of skill
and anti-immigrant attitudes on the vote for women and men. We first interact gender with skill.
While a gender-differential effect of skill in supporting the radical right does not flatly contradict
our theory, our argument leads us to think that the effect is driven by skill and gender segregation
of the labor market rather than in a differential response of men and women to skill-related
vulnerability. The pooled results of this analysis (Models 4 and 7) suggest that there is indeed an
interactive effect, namely, that the effect of skill is stronger among men than it is among women.
However, this result dissipates almost entirely when each of the eight rounds of the ESS is
examined separately (see Appendix F). This result is consistent with our argument: while skill
(and thus occupational vulnerability) is correlated with gender, men do not inherently differ from
women in the magnitude of the effect of skill on vote choice.
We next combine the three cultural anti-immigrant items and the two economic ones to
two scaled items.8 Our analysis shows statistically significant though substantively insignificant
8 Both the three cultural anti-immigrant items and the two economic ones are strongly
correlated (α’s =0.80, and 0.64 respectively).
33
(in fact, miniscule) difference in anti-immigrant attitudes between the sexes. We also interact
each of the two scales with gender and find that there is no gender differentiated effect of
culturally based anti-immigrant attitudes on support for the radical right (Appendix F).
Combined with the findings above on the effect of education and residing in rural vs. urban
areas, we infer that while cultural considerations have an effect, this effect is not necessarily
gender-specific.
We now turn to substantively evaluate the effect of one’s position in the labor market on
their choice to support the radical right.

34
Table 2. Support for the radical right (Probit Models, ESS 1-8)
Communication Manual
(1) (2) (3) (4) (5) (6) (7)
Male 0.22*** 0.17*** 0.18*** 0.30*** 0.17*** 0.18*** 0.04
(0.01) (0.01) (0.02) (0.05) (0.01) (0.02) (0.04)
Communication -0.64*** -0.41*** -0.25***
(0.03) (0.04) (0.07)
Male x communication -0.21**
(0.08)
Manual 0.70*** 0.43*** 0.21**
(0.04) (0.04) (0.07)
Male x manual 0.32***
(0.09)
Education (yrs.) -0.06*** -0.05*** -0.03*** -0.03*** -0.05*** -0.03*** -0.03***
(0.00) (0.00) (0.00) (0.00) (0.00) (0.00) (0.00)
Population density -0.04*** -0.04*** -0.01* -0.01* -0.04*** -0.01* -0.01*
(0.01) (0.01) (0.01) (0.01) (0.01) (0.01) (0.01)
Age -0.00 -0.00 -0.00 -0.00 -0.00 -0.00 -0.00
(0.00) (0.00) (0.00) (0.00) (0.00) (0.00) (0.00)
Age squared -0.00 -0.00 -0.00 -0.00 -0.00 -0.00 -0.00
(0.00) (0.00) (0.00) (0.00) (0.00) (0.00) (0.00)
Religiosity -0.01*** -0.01*** -0.01*** -0.01*** -0.01*** -0.01*** -0.01***
(0.00) (0.00) (0.00) (0.00) (0.00) (0.00) (0.00)
Unemployed for > 3
months
0.14***
(0.02)
0.12***
(0.02)
0.12***
(0.02)
0.12***
(0.02)
0.12***
(0.02)
0.12***
(0.02)
0.12***
(0.02)
Foreign born -0.18*** -0.20*** -0.12** -0.12** -0.20*** -0.12** -0.12**
(0.03) (0.04) (0.04) (0.04) (0.04) (0.04) (0.04)
Immigrants undermine
country’s cultural life
0.07***
(0.00)
0.08***
(0.00)
0.08***
(0.00)
0.08***
(0.00)
Do not allow immig. of
a different race
0.13***
(0.02)
0.13***
(0.02)
0.13***
(0.02)
0.13***
(0.02)
Immig. make country a
worse place to live
0.07***
(0.01)
0.07***
(0.01)
0.07***
(0.01)
0.07***
(0.01)
Do not allow immig.
from poorer countries
outside Europe
0.13***
(0.01)
0.13***
(0.01)
0.13***
(0.01)
0.13***
(0.01)
Immig. are bad for the
economy
0.05***
(0.00)
0.05***
(0.00)
0.05***
(0.00)
0.05***
(0.00)
Constant -0.20** 0.10 -2.24*** -2.34*** -0.54*** -2.65*** -2.56***
(0.07) (0.08) (0.09) (0.10) (0.08) (0.09) (0.10)
Observations 72,464 66,673 66,673 66,673 66,673 66,673 66,673
Standard errors in parentheses; * p < 0.05, ** p < 0.01, *** p < 0.001. Country and year FE are
included.
35
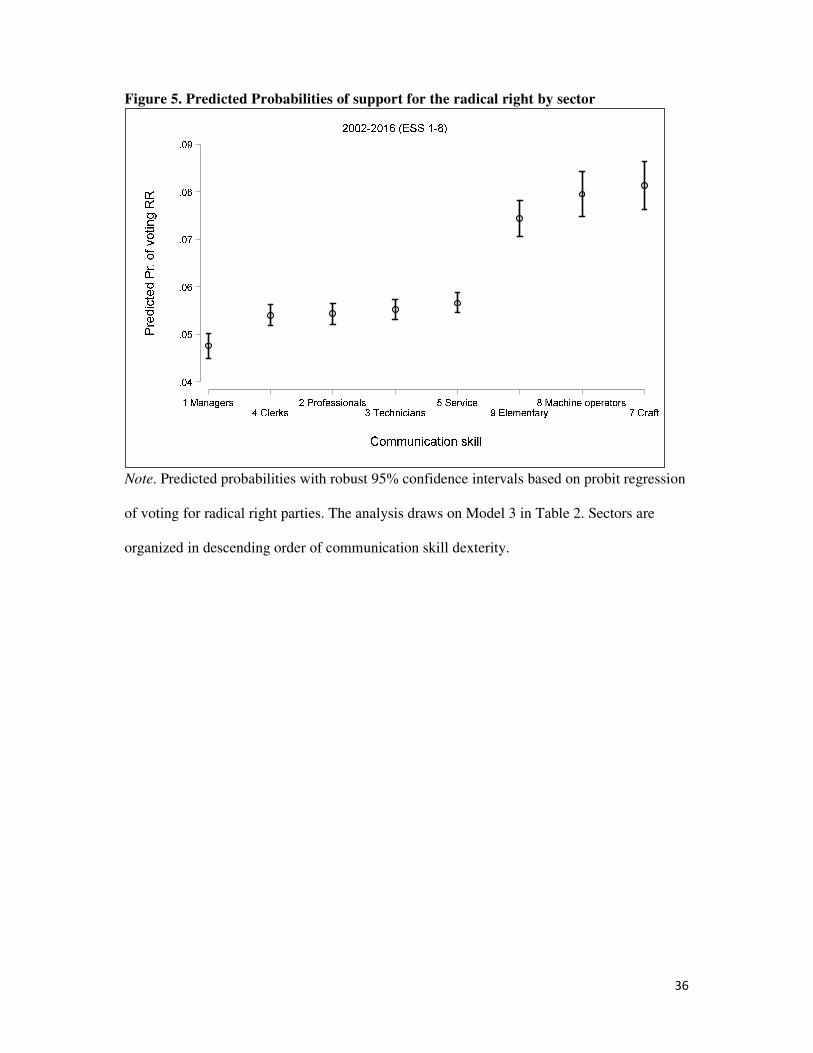
Figure 5 shows the predicted probability of supporting the radical right for each of the
sectors. Sectors are ordered by descending order of communication skill dexterity such that those
sectors that rely least on communication and most on manual dexterity are on the right end of the
figure. The probabilities are calculated off the results reported in Model 3 such that all other
variables are held constant at their mean value. The figure shows that those working in a sector
that requires a high level of communication skills (e.g., clerks, professionals) are less likely to
support the radical right. Although not shown directly here, the converse is true with respect to
manual skills. Those working in the three sectors that rely most on manual skills (least on
communication skills) – elementary jobs, machine operators, and crafts – are those with the
highest likelihood of supporting radical right parties. The results are therefore consistent with our
first hypothesis.
36
Figure 5. Predicted Probabilities of support for the radical right by sector
Note. Predicted probabilities with robust 95% confidence intervals based on probit regression
of voting for radical right parties. The analysis draws on Model 3 in Table 2. Sectors are
organized in descending order of communication skill dexterity.
37
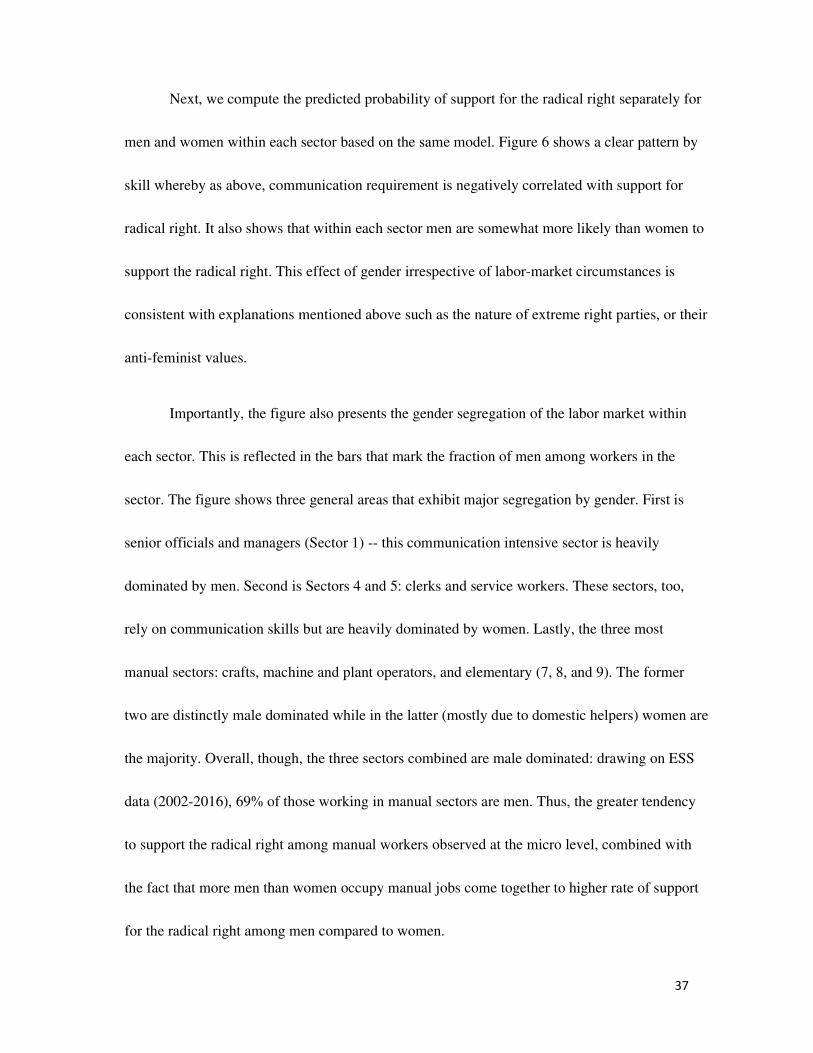
Next, we compute the predicted probability of support for the radical right separately for
men and women within each sector based on the same model. Figure 6 shows a clear pattern by
skill whereby as above, communication requirement is negatively correlated with support for
radical right. It also shows that within each sector men are somewhat more likely than women to
support the radical right. This effect of gender irrespective of labor-market circumstances is
consistent with explanations mentioned above such as the nature of extreme right parties, or their
anti-feminist values.
Importantly, the figure also presents the gender segregation of the labor market within
each sector. This is reflected in the bars that mark the fraction of men among workers in the
sector. The figure shows three general areas that exhibit major segregation by gender. First is
senior officials and managers (Sector 1) -- this communication intensive sector is heavily
dominated by men. Second is Sectors 4 and 5: clerks and service workers. These sectors, too,
rely on communication skills but are heavily dominated by women. Lastly, the three most
manual sectors: crafts, machine and plant operators, and elementary (7, 8, and 9). The former
two are distinctly male dominated while in the latter (mostly due to domestic helpers) women are
the majority. Overall, though, the three sectors combined are male dominated: drawing on ESS
data (2002-2016), 69% of those working in manual sectors are men. Thus, the greater tendency
to support the radical right among manual workers observed at the micro level, combined with
the fact that more men than women occupy manual jobs come together to higher rate of support
for the radical right among men compared to women.

38
39
Figure 6. Predicted Probabilities of support for the radical right by sector and gender
Note. The analysis draws on Model 3 in Table 2. Sectors are organized in
descending order of communication skill dexterity. Bars, and numbers on top of
them, show the percentage of male workers in each sector.

40
Our interpretation of the results is that working in a sector that requires communication
skills serves as a shield of protection for workers against either losing one’s job for an immigrant
worker or having one’s wage decline due to immigration or trade and thus reduces their support
for radical right parties. Having a manual-skill job has the opposite effect.
5.4. Revisiting the gender gap: The political context
Having examined aggregate trends and individual-level behavior, the present section
revisits the original gender gap in support for the left and analyzes it in the context of the party
system and the gender-segregation of the manual labor market. Recall that our second hypothesis
linked the gender gap to economic positions of the left. In particular, it stated that where the
radical right is a viable alternative for voters and the mainstream left takes centrist policy
positions, greater gender segregation (i.e., male domination) of manual sectors will be associated
with a smaller (more “modern”) gender gap. Put differently, the more jobs in immigration-
vulnerable sectors are occupied by men, fewer men compared to women will support the left,
contingent on the economic position of the left.
To evaluate this hypothesis, we draw on the ESS (2002-2016) and the Chapel Hill expert
survey. Specifically, we estimate the gender gap on the left as a function of gender segregation of
manual sectors and economic position of the mainstream left party in the elections preceding the
survey as well as their interaction, both measured as described in Section 4.1. We also control for
the position of both the mainstream left and the radical right on the second dimension (Kitschelt
41
1994)9 as well as the economic position of the radical right and include country and year fixed
effects. We split our cases to two -- those in which the radical right secured at least a single
parliamentary seat in parliament in the elections preceding the survey and therefore was arguably
a viable option for voters, and those where it did not.
Results of this estimation (reported in Model 2 in Table 3) present a clear picture. Where
the radical right secured at least a single parliamentary seat in the previous elections, the
constitutive term of male domination of manual sectors is positively associated with the gender
gap, yet its interaction with the economic position of the left is negative (note that results hold in
the baseline Model 1 as well). Figure 7a presents the marginal effect of male domination of the
manual sectors on the gender gap in support for the left (on the vertical axis), modified by the
economic position of the largest left-wing party in the election preceding the survey (on the
horizontal axis). All other variables are held constant at their respective mean. The results are
based on the full model reported in the second column of Table 3. Where the mainstream left
takes a traditional social democratic position (on the left side of the picture), greater male
domination of the manual labor market translates to a larger gender gap in support for the left.
This positive correlation implies that where more men compared to women work in manual jobs,
more men compared to women support the left. As we move to the right on the horizontal axis
and social democratic parties take more centrist economic positions, this relationship fades away
9 We use the CHES 0–10 GAL-TAN question that focuses on questions of rights, freedoms
and morality.
42
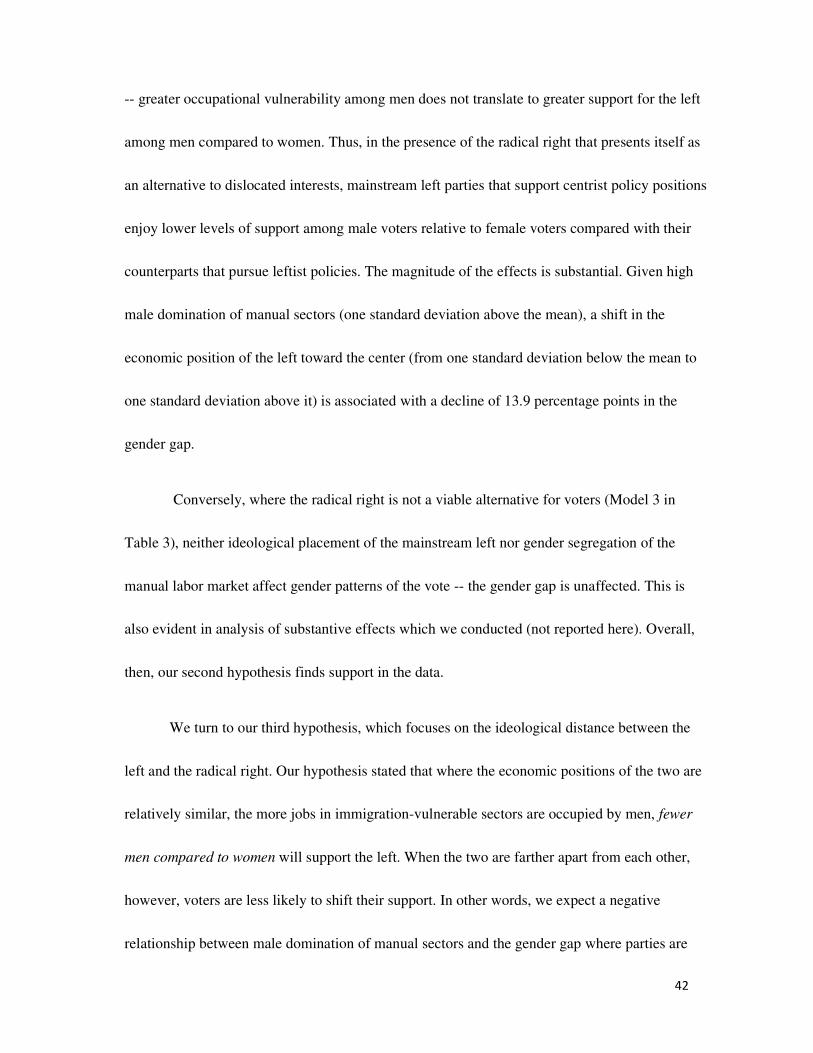
-- greater occupational vulnerability among men does not translate to greater support for the left
among men compared to women. Thus, in the presence of the radical right that presents itself as
an alternative to dislocated interests, mainstream left parties that support centrist policy positions
enjoy lower levels of support among male voters relative to female voters compared with their
counterparts that pursue leftist policies. The magnitude of the effects is substantial. Given high
male domination of manual sectors (one standard deviation above the mean), a shift in the
economic position of the left toward the center (from one standard deviation below the mean to
one standard deviation above it) is associated with a decline of 13.9 percentage points in the
gender gap.
Conversely, where the radical right is not a viable alternative for voters (Model 3 in
Table 3), neither ideological placement of the mainstream left nor gender segregation of the
manual labor market affect gender patterns of the vote -- the gender gap is unaffected. This is
also evident in analysis of substantive effects which we conducted (not reported here). Overall,
then, our second hypothesis finds support in the data.
We turn to our third hypothesis, which focuses on the ideological distance between the
left and the radical right. Our hypothesis stated that where the economic positions of the two are
relatively similar, the more jobs in immigration-vulnerable sectors are occupied by men, fewer
men compared to women will support the left. When the two are farther apart from each other,
however, voters are less likely to shift their support. In other words, we expect a negative
relationship between male domination of manual sectors and the gender gap where parties are

43
clustered together but a positive one where their positions are distinct.
To test this hypothesis, we repeat the exercise above with the gender gap on the left as a
dependent variable and focus on labor market segregation as modified by the economic distance
between the left and the radical right. As above, party positions are measured in the elections
immediately preceding the survey, and the model controls for party positioning on second-
dimension and includes country and year fixed effects.
Model 4 in Table 3 reports the result of this estimation, and based on the raw results
presented in the table, Figure 7b presents substantive effects. The results in the table show a
negative albeit statistically insignificant coefficient of male domination in manual sectors and a
positive interaction term between male domination and economic distance. The figure shows the
contingency of the relationship. On the horizontal axis is the economic distance between the two
parties, and on the vertical one the marginal effect of labor market segregation. The effect is as
predicted, though statistical significance is weaker than above. Let us begin with the right hand
side of the figure. Where the distance between left and the radical right is substantial, a large
number of men compared to women working in manual sectors is associated with a large number
of men compared to women supporting the left. As we move leftward and the distance between
the two declines, greater male domination of manual sectors is not associated with greater
support for the left by men compared to women. Put differently, where the left and the radical
right present each their version of relatively centrist economic policies, greater occupational
vulnerability of men does not translate to greater support for the left by men.
44
Finally, to complete the picture, we examined the pull factor alone. Analogous to Model
3, Model 5 examines the effect of male domination in the manual labor market as modified by
the economic position of the radical right. As above, the analysis controls for second dimension
and country and year fixed effects. Neither the constitutive terms nor the interaction are
statistically significant.
In sum, our first contextual hypothesis finds support in the data while our second one
finds partial support. Where more men work in manual jobs and are thus occupationally
vulnerable vis-s-vis immigration, more men than women support the left if the left holds on to
its traditional positions and if the left and the radical right hold distinct economic positions. This
finding attest to the importance of push factors as well as the combination of push and pull.
Where both the left and the radical right moderate their positions, i.e., when they shift their
economic positions toward the center, the radical right successfully presents itself as a substitute
for the left in guarding dislocated interests of occupationally vulnerable manual workers. And
while our analysis in the previous section shows that the radical right is successful in presenting
itself as a substitute guardian of workers’ interests, our contextual analysis suggests that in
combination with the position of the left, the economic position it takes can modify the
relationship between the gender segregation of the manual labor market and the gender gap in
vote choice on the left. Put differently, the position of the radical right alone might not draw men
working in manual jobs to abandon the left, but combined with a centrist left it can do so.

45

46
Table 3. Gender gap in support for the left
Gender gap for the left
H2 H3
RR present RR not
present
RR present
(1) (2) (3) (4) (5)
Male domination of manual sectors 0.64* 1.13*** -0.02 -0.21 -0.12
(0.26) (0.30) (0.34) (0.14) (0.32)
Economic position of left 0.04 0.07** 0.01 -0.02
(0.02) (0.03) (0.03) (0.01)
Ec. position of left * male dom. of
manual sectors
-0.20**
(0.07)
-0.34***
(0.09)
-0.04
(0.07)
Cultural position of left -0.03* 0.02 -0.02+ -0.01
(0.01) (0.01) (0.01) (0.01)
Economic position of RR -0.01 -0.01
(0.01) (0.02)
Cultural position of RR -0.01+ -0.01 -0.01
(0.01) (0.01) (0.01)
Distance in ec.position b/w RR and
Left
-0.02
(0.01)
Distance in ec. position * male
dom. of manual sectors
0.10*
(0.05)
Ec. position of RR * male dom. of
manual sectors
0.02
(0.05)
Country and year FEs √ √ √ √ √
Constant -0.12 0.01 -0.05 0.21+ 0.24
(0.09) (0.12) (0.10) (0.12) (0.17)
Observations 55 50 44 51 52
R-squared 0.72 0.79 0.47 0.69 0.67
Standard errors in parentheses; *** p<0.001, ** p<0.01, * p<0.05, + p<0.1.
Note. Models 1-3 test H2. Models 4-5 test H3. All models include country and year fixed effects.

47
Figure 7. Estimated effect of labor market segregation on the gender gap across levels of
economic positions of the left (H2) and distance between radical right and left on economic
positions (H3)
Note. Marginal effect of male domination in manual sectors on the gender gap for the left
(vertical axis) across levels of economic positions of the left (left-hand panel) and distance
between economic position of the radical right and the left (right-hand panel). 95% confidence
intervals are marked. Results are based on estimation reported in Table 3, Models 2 (H2) and 5
(H3).
48
5.5 Movement from the left to other parties and mobilization of non-voters
One might wonder whether this is truly about occupational vulnerability or perhaps some
other factor leads men holding manual jobs to abandon the left and to favor the radical right. An
additional way of empirically addressing this concern is an examination of whether a similar
trend is observed among supporters of other party families. We first examined the gender gap in
support for a party family that offers a different solution to dislocated interests: the radical left.10
The picture that evolves overtime is a modest and rather stable gap: men support radical left
parties at a slightly higher rate than women. The gap declines from just below four percentage
points in the early 1970s to over one percentage point in 2000 and onward.
We also examined whether men (and women) holding manual jobs abandon the left and
in turn support mainstream right parties, namely Christian Democrats and Conservative party
families, at higher rates. Our analysis of the Christian Democratic party family shows no secular
trend for either female or male manual workers that differs from that of the general population.
As for the Conservative party family, here, too, electoral support of men holding manual jobs
follows closely that of the general public, albeit at a lower level. Overall, we find no evidence
that men holding manual jobs disproportionately turn to mainstream right parties.
Importantly, we do not argue that the radical right is the new destination of all manual
workers who abandoned the left or that the left is its only source of additional votes. In fact,
studies have shown that the radical right draws on disenchanted voters or otherwise abstainers
10 The radical left party family includes all parties classified as communist and socialist-communist.
49
who feel alienated by the political establishment and mobilizes them to join the political process
by casting a radical right ballot (Guiso et al. 2018). Rather, the combination of the aggregate
analysis along with the individual-level analysis presented above jointly present a dynamic
picture of occupational realignment in a multi-party system. The results suggest that men whose
occupational position is particularly vulnerable to competition with immigrants or trade deserted
the left. Also, such male voters turned out in high numbers for radical right parties but not for
mainstream conservative parties. This is consistent not only with rates of support for and
constituency composition of the radical right but also in the change of the gender gap on the left
and in the composition of supporters of the left overtime.
5.6 Robustness analysis
We reconducted our analysis varying some of our empirical specifications. In a nutshell,
our results hold across almost all variations.
Separate waves. We repeated our analysis utilizing ESS data from each of Waves 1 through 8
(2002-2016) separately. The results (reported in Appendix F) closely follow the results reported
above.
Green parties. We included Green and ecological parties in the family of left parties (consistent
with that used by Giger 2009) and reconducted our aggregate analysis (see Appendix F). The
results of this categorization are nearly identical to those presented in our aggregate analyses,
both in Figure 1 and in Figures 3 and 4.
50
We also rerun our individual-level analysis employing alternative specifications and
utilizing multiple datasets:
Skill. As noted above, the import of skill rating percentiles from the US draws on relative sector
sizes in the US economy and assumes that on average the economies included in the analysis are
similar to the US economy in their relative sector sizes. To relax this admittedly stringent
assumption, we rank-order the sectors on both communication and manual skill, eliminating
percentiles. Results of this analysis are similar to, and in fact slightly stronger than, the results
reported in our main analysis (see Appendix F), assuaging concerns over differences in labor
market structure.
Retirees. We identified retirees (who are included in the analysis above based on their reported
past occupation) by a dummy variable in models identical to Models 3 and 6 in Table 2. We also
excluded them from the analysis altogether. The results are fully consistent with the original ones
(see Appendix F).
Spouses and partners. We included in the analysis partner’s education as well as their skill.
Our results show that a partner’s education is negatively correlated with the likelihood of
supporting the radical right, and their skill is correlated with it in the same direction as one’s own
skill (see also Abou-Chadi and Kurer 2020). In both cases, however, our main result regarding
the effect of one’s own skill holds (see Appendix F).
Income. We examine the income distribution in the three most manual sectors against that in

51
other sectors. Our analysis shows that although on average income of communication-based
sectors is higher than that in manual ones, the distributions overlap considerably. Most
importantly, once income is included in the model, our results hold (see Appendix F).
6. Conclusion
What explains the secular trend in gender realignment of the vote over the past five
decades? Past research documents various explanations for the gradual drift of women to the left.
This study shows that voting behavior of men, and particularly men who hold manual jobs,
contributes to the extensively documented change in the gender gap on the left.
The premises of our analysis are that (i) there are potentially several gender gaps in
voting, (ii) these gaps may change due to changes in voting behavior of both women and men,
and (iii) these changes take place within a dynamic party system. These premises allow us to link
two well documented regularities analyzed separately to date -- the gender gap on the left and the
rise of the radical right -- and thereby reach new insights regarding the gender gap in multi-party
systems. We demonstrate that occupational vulnerability in the face of competition with
immigrants and trade plays a role in this change, and identify those whose jobs require high
manual (low communication) skill dexterity as particularly vulnerable. Manual workers – most
of whom are men – abandon the left (compared to their female counterparts), and support the
radical right.
Our study opens the door to exciting new research avenues. We find two extensions of
52
our analysis to be particularly interesting to follow in future research. The first extension has to
do with occupational vulnerability. In our analysis, we point at communication skills as a key
barrier to integration of immigrants and assume that occupations that require communication
skill dexterity are harder for immigrants to find jobs in. Although a good proxy for integration
potential of immigrants, the degree to which a particular language serves as a barrier for
immigrants may vary depending on the diad of language at the host country and language in the
country of origin. Due to historical or cultural ties and colonial history, some relevant host
languages are widely spoken in some countries of origin, while others are not. Additionally,
linguistic similarity varies across languages making some easier to get command of than others,
depending on one’s language of origin. Thus, a possible extension of our analysis might entail a
more nuanced classification of languages required and those spoken by groups of immigrants in
different countries.
The second extension has to do with party positions. In our analysis, we contextualized
the realignment of the vote along gender and occupational lines using a well-established, albeit
quite general indicator of party economic position. We show that the position of the mainstream
left, as well as a combination of it and that of the extreme right, affect the sensitivity of the
gender gap to occupational vulnerability. And while the left-right economic scale offers a helpful
heuristic for party positions, one might seek to refine the analysis of party socio-economic policy
position, as recent research goes beyond the unidimensional scale of more or less public
spending. Parties differ in their emphasis: some focus on income while others on human capital
53
(Beramendi et al. 2015), some on benefits directed at insiders while others at outsiders, some on
redistribution while others on social insurance (Häusermann 2018). A more nuanced analysis
would take into consideration the different aspects of socio-economic policies pursued by
different parties, and examine how they affect occupationally vulnerable workers.
54
References
Abou-Chadi, Tarik, and Thomas Kurer. (2020). "Economic Risk within the Household and Voting for
the Radical Right." Working paper.
Akkerman, Tjitske and Anniken Hagelund. 2007. “Women and children first: anti-immigration parties
and gender in Norway and the Netherlands.” Patters of Prejudice 41(2): 192-214.
Armingeon, Klaus, David Weisstanner, Sarah Engler, Panajotis Potolidis, Marlène Gerber, and Phillip
Leimgruber. 2009. Comparative Political Data Set 1960-2009, 21-35.
Bakker, Ryan, Seth Jolly, Jonathan Polk, and Keith Poole. 2014. "The European common space:
Extending the use of anchoring vignettes." The Journal of Politics 76(4): 1089-1101.
Benedetto, Giacomo, Simon Hix, and Nicola Mastrorocco. 2020. "The rise and fall of social
democracy, 1918-2017." American Political Science Review. DOI:
https://doi.org/10.1017/S0003055420000234
Beramendi, P., Häusermann, S., Kitschelt, H. and Kriesi, H. (eds.) 2015. The Politics of Advanced
Capitalism, Cambridge: Cambridge University Press.
Betz, Hans-Georg. 1994. Radical right-wing populism in Western Europe. New York: St. Martin’s.
Box-Steffensmeier, Janet. M., Suzanna De Boef, and Tse-Min Lin. 2004. “The Dynamics of the
Partisan Gender Gap.” American Political Science Review 98(3): 515-528.
Conover, Pamela J. 1988. “Feminists And The gender Gap.” The Journal of Politics, 50(4): 985-1010.
D'Amuri, Francesco, and Giovanni Peri. 2014. “Immigration, Jobs, and Employment Protection:
Evidence from Europe before and During The Great Recession.” Journal of the European
Economic Association 12(2): 432-464.
Edlund, Lena, and Rohini Pande. 2002. “Why Have Women Become Left-Wing? The Political Gender
Gap and The Decline in Marriage.” Quarterly Journal of Economics 117(3): 917–961.
55
ESS Cumulative File: European Social Survey Round 1-6 Data (2002-2010). Data file edition
6.1. Norwegian Social Science Data Services, Norway.
Giger, Nathalie. 2009. “Towards a Modern Gender gap in Europe? A Comparative Analysis of Voting
Behavior in 12 Countries.” The Social Science Journal 46(3): 474-492.
Givens, Terri E. 2004. “The radical right gender gap.” Comparative Political Studies 37(1): 30-54.
Givens, Terri E. 2005. Voting radical right in Western Europe. Cambridge University Press.
Greenberg, Anna. 2001. “A Gender Divided: Women as Voters in the 2000 Presidential
Election.” Women's Policy Journal of Harvard 1: 59-82.
Guiso, Luigi, Helios Herrera, Massimo Morelli, and Tommaso Sonno. 2018. “Populism: Demand and
Supply”, EIEF Work. Pap. 1703, Einaudi Inst. Econ. Finance, Rome.
Hainmueller, Jens, and Michael J. Hiscox. 2010. “Attitudes toward highly skilled and low-skilled
immigration: Evidence from a survey experiment.” American Political Science Review 104(1):
61-84.
Hainmueller, Jens, and Michael J. Hiscox. 2007. “Educated preferences: Explaining attitudes toward
immigration in Europe.” International organization 61(2): 399-442.
Hainmueller, Jens, Michael J. Hiscox, and Yotam Margalit. 2015. “Do concerns about labor market
competition shape attitudes toward immigration? New evidence.” Journal of International
Economics 97(1): 193-207.
Hainmueller, Jens, and Daniel J. Hopkins. 2014. “Public Attitudes Toward Immigration.” Annual
Review of Political Science 17: 225-249.
Häusermann, Silja. 2018. ‘Social Democracy and the Welfare State in Context: The Conditioning
Effect of Institutional Legacies and Party Competition’. In Manow P., Palier B., Schwander H.
(eds) Welfare Democracies and Party Politics: Explaining Electoral Dynamics in Times of
Changing Welfare Capitalism, Oxford, Oxford University Press, pp. 150–170.

56
Häusermann S., Schwander H. (2011). ‘Varieties of Dualization. Identifying Insiders and Outsiders
across Regimes.’ In Emmenegger, P., Häusermann, S., Palier, B. and Seelieb-Kaiser, M. (eds)
The Age of Dualization. The Changing Face of Inequality in Deindustrializing Societies. Oxford:
Oxford University Press, 27-51.
Harteveld, Eelco. 2016. “Winning The ‘Losers’ But Losing The ‘Winners’? The Electoral
Consequences of The Radical Right Moving to the Economic Left.” Electoral Studies 44: 225-
234.
Harteveld, Eelco, and Elisabeth Ivarsflaten. 2018. “Why women avoid the radical right: Internalized
norms and party reputations.” British Journal of Political Science 48(2): 369-384.
Haubert, Jeannie, and Elizabeth Fussell. 2006. “Explaining pro-immigrant sentiment in the US: Social
class, cosmopolitanism, and perceptions of immigrants.” International Migration Review 40(3):
489-507.
Inglehart, Ronald and Pippa Norris. 2000. “The Developmental Theory of The Gender Gap: Women’s
and Men’s Voting Behavior in Global Perspective.” International Political Science Review
21(4): 441–463.
Inglehart, Ronald, and Pippa Norris. 2003. Rising tide. Gender Equality and Cultural Change. Oxford:
Cambridge University Press.
Inglehart, Ronald, and Pippa Norris. 2017. “Trump and the populist authoritarian parties: the silent
revolution in reverse.” Perspectives on Politics 15(2): 443-454.
International Labour Organization. 2000. Employment by sex and occupation. Geneva: International
Labour Office.
Iversen, Torben, and Frances Rosenbluth. 2006. “The Political Economy of Gender: Explaining cross-
National Variation in The gender Division of Labor and The Gender Voting Gap.” American
Journal of Political Science 50(1): 1–19.

57
Jackman, Robert W., and Karin Volpert. 1996. “Conditions Favouring Parties of The Extreme Right in
Western Europe.” British Journal of Political Science 26(4): 501-521.
Kaufmann, Karen, and Petrocik, John. 1999. “The Changing Politics of American Men: Understanding
The Sources of The Gender Gap.” American Journal of Political Science 43(3): 864-887.
Kitschelt, Herbert. 1994. The Transformation of European Social Democracy. Cambridge: Cambridge
University Press.
Kitschelt, Herbert, and Anthony J. McGann. 1997. The radical right in Western Europe: A
comparative analysis. University of Michigan Press.
Kurer, Thomas. 2020. “The Declining Middle: Occupational Change, Social Status, and the Populist
Right.” Comparative Political Studies 53(10-11): 1798–1835.
Laver, Michael, Michael Gallagher, and Peter Mair. 2011. Representative Government in Modern
Europe. McGraw-Hill.
Manza, Jeff, and Clem Brooks. 1998. “The Gender Gap in U.S. Presidential Elections: When? Why?
Implications?” American Journal of Sociology 102(5): 1235–1266.
Mayer, N. 1998. ‘The French National Front.’ In The New Politics of the Right: Neo-Populist Parties
and Movements in Established Democracies. Betz, Hans-Georg, and Stefan Immerfall, eds.
Macmillan.
Norrander, Barbara. 1999. “The evolution of The Gender Gap.” The Public Opinion Quarterly 63(4):
566-576.
Norris, Pippa. 2005. Radical Right: Voters And Parties in The Electoral Market. Cambridge University
Press.
Ortega, Francesc, and Javier G. Polavieja. 2012. “Labor-Market Exposure as a Determinant of
Attitudes Toward Immigration.” Labour Economics 19(3): 298-311.
58
Peri, Giovanni, and Chad Sparber. 2011. “Highly Educated Immigrants and Native Occupational
Choice.” Industrial Relations 50(3): 385-411.
Polavieja, Javier, G. 2016. “Labour-Market Competition, Recession And Anti-Immigrant Sentiments
in Europe: Occupational And Environmental Drivers of Competitive Threat.” Socio-Economic
Review 14(3): 395-417.
Rehm, Philipp. 2016. Risk inequality and welfare states: Social policy preferences, development, and
dynamics. Cambridge University Press, 2016.
Rennwald, Line, and Jonas Pontusson. 2020. “Paper Stones Revisited: Class Voting, Unionization and
the Electoral Decline of the Mainstream Left.” Perspectives on Politics 1-19.
doi:10.1017/S1537592720000067.
Rueda D. (2005). “Insider–outsider Politics in Industrialized Democracies: The Challenge to Social
Democratic Parties” American Political Science Review 99: 61–74.
Schain, Martin S. 2000. ‘The National Front And the Legislative Elections of 1997.’ In How France
Votes, ed. Michael S. Lewis-Beck. 70-86. New York: Chatham House Publishers, Seven Bridges
Press.
Scheve, Kenneth F., and Matthew J. Slaughter. 2001. “Labor Market Competition and Individual
Preferences over Immigration policy.” Review of Economics and Statistics 83(1): 133-145.
Schmitt, Herman. Scholz, Evi, Leim, I., Moschner, M. 2008. The Mannheim Eurobarometer Trend File
1970-2002 (ed. 2.00). European Commission. GESIS Data Archive, Cologne. ZA3521 Data file
Version 2.0.1, doi:10.4232/1.10074.
Sides, John, and Jack Citrin. 2007. “European Opinion about Immigration: The Role of Identities,
Interests and Information.” British Journal of Political Science 37(3): 477-504.
Thewissen, Stefan, and David Rueda. 2019. “Automation and the welfare state: Technological change
as a determinant of redistribution preferences.” Comparative Political Studies 52(2): 171-208.
59
Van der Brug, Wouter, and Meindert Fennema. 2007. “Causes of Voting for The Radical Right.”
International Journal of Public Opinion Research 19(4): 474-487.

60
The Changing Gender Gap(s) in Voting: An Occupational Realignment
Online Appendix
Appendix A. Countries and years sampled in the Eurobarometer and ESS
Appendix B. Party classifications
Appendix C. Communication and manual skills
Appendix D. Survey question wording
Appendix E. Descriptive statistics
Appendix F. Robustness tests and supplementary empirical analyses
Tables F1. Individual-level analysis by year
Table F2. Individual-level analysis with interaction between anti-immigrant attitudes and
gender
Table F3. Individual-level analysis different measure for skill
Table F4. Individual-level analysis excluding retirees
Tables F5. Individual-level analysis including spouse’s education and occupation
Table F6. Individual-level analysis including income
Figure F1. Gender gap on the left including green parties
Figure F2. Gender gap for the left including green parties differentiated by radical
right presence in parliament

2
Appendix A. Countries included and years sampled
The tables note for each country whether it was surveyed in either the Eurobarometer (EB) (1970-2002)
or ESS (rounds 1-6). A check mark denotes that the country surveyed and had a radical right party in
parliament at the surveyed period, and a circle denotes that the country was surveyed but did not have a
radical right party in parliament during the surveyed period. An empty cell denotes that the country was
not surveyed in the specific period.
Eurobarometer (1970-2002)
1
9
7
0
1
9
7
1
1
9
7
2
1
9
7
3
1
9
7
3
1
9
7
4
1
9
7
5
1
9
7
5
1
9
7
6
1
9
7
7
1
9
7
8
1
9
7
9
1
9
8
0
1
9
8
1
1
9
8
2
1
9
8
3
1
9
8
4
1
9
8
5
1
9
8
5
1
9
8
6
1
9
8
6
1
9
8
7
1
9
8
8
1
9
8
9
1
9
9
0
1
9
9
1
1
9
9
2
1
9
9
3
1
9
9
4
1
9
9
5
1
9
9
6
1
9
9
7
1
9
9
8
1
9
9
9
2
0
0
0
2
0
0
1
2
0
0
2
AT ✔ ✔ ✔ ✔ ✔ ✔
BE ◯ ◯ ◯ ◯ ◯ ◯ ◯ ✔ ✔ ✔ ✔ ✔ ✔ ✔ ✔ ✔ ✔ ✔ ✔ ✔ ✔ ✔ ✔ ✔ ✔ ✔ ✔ ✔ ✔ ✔ ✔ ✔ ✔
CH ✔
DE ◯ ◯ ◯ ◯ ◯ ◯ ◯ ◯ ◯ ◯ ◯ ◯ ◯ ◯ ◯ ◯ ◯ ◯ ◯ ◯ ◯ ◯ ◯ ◯ ◯ ◯ ◯ ◯ ◯ ◯ ◯ ◯ ◯
DK ✔ ✔ ✔ ✔ ✔ ✔ ✔ ✔ ✔ ✔ ✔ ✔ ✔ ✔ ✔ ✔ ✔ ✔ ✔ ✔ ✔ ✔ ✔ ✔ ✔ ✔ ✔ ✔ ✔ ✔ ✔
ES ◯ ◯ ◯ ◯ ◯ ◯ ◯ ◯ ◯ ◯ ◯ ◯ ◯ ◯ ◯ ◯ ◯
FR ◯ ◯ ◯ ◯ ◯ ◯ ◯ ◯ ◯ ◯ ◯ ◯ ◯ ◯ ◯ ✔ ✔ ✔ ✔ ✔ ✔ ✔ ✔ ✔ ✔ ✔ ✔ ✔ ✔ ✔ ✔ ✔ ✔ ✔
FI ✔ ✔ ✔ ✔ ✔ ✔ ✔ ✔ ✔
IE ◯ ◯ ◯ ◯ ◯ ◯ ◯ ◯ ◯ ◯ ◯ ◯ ◯ ◯ ◯ ◯ ◯ ◯ ◯ ◯ ◯ ◯ ◯ ◯ ◯ ◯ ◯ ◯ ◯ ◯ ◯
IT ✔ ✔ ✔ ✔ ✔ ✔ ✔ ✔ ✔ ✔ ✔ ✔ ✔ ✔ ✔ ✔ ✔ ✔ ✔ ✔ ✔ ✔ ✔ ✔ ✔ ✔ ✔ ✔ ✔ ✔ ✔
GB ◯ ◯ ◯ ◯ ◯ ◯ ◯ ◯
GR ◯ ◯ ◯ ◯ ◯ ◯ ◯ ◯ ◯ ◯ ◯ ◯ ◯ ◯ ◯ ◯ ◯ ◯ ◯ ◯ ◯ ◯
LU ◯ ◯ ◯ ◯ ◯ ◯ ◯ ◯ ◯ ◯ ◯ ◯ ◯ ◯ ◯ ◯ ◯ ◯ ◯ ◯ ◯ ◯ ◯ ◯ ◯ ✔ ✔ ✔ ✔ ✔ ✔ ✔
NL ◯ ◯ ◯ ◯ ◯ ◯ ◯ ◯ ◯ ◯ ◯ ◯ ◯ ◯ ◯ ◯ ◯ ◯ ◯ ◯ ◯ ◯ ◯ ◯ ◯ ◯ ◯ ◯ ◯ ◯ ◯
PT ◯ ◯ ◯ ◯ ◯ ◯ ◯ ◯ ◯ ◯ ◯ ◯ ◯ ◯ ◯ ◯
SE ◯ ◯ ◯ ◯ ◯ ◯
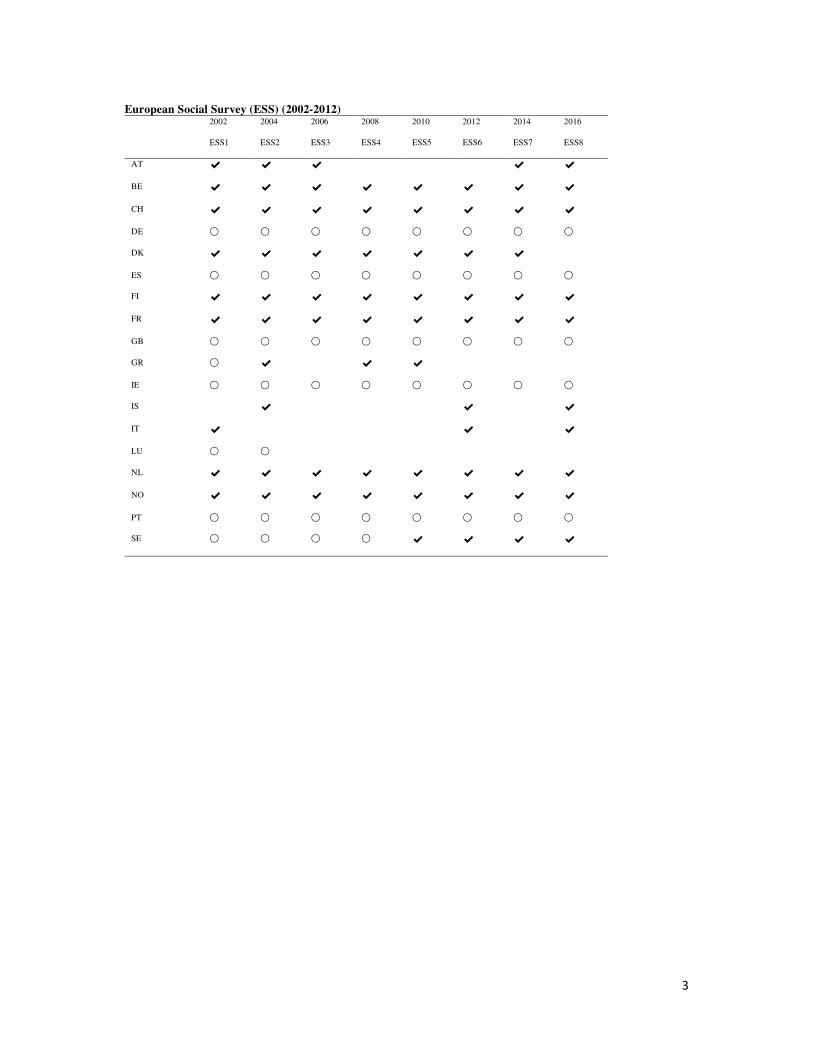
3
European Social Survey (ESS) (2002-2012) 2002 2004 2006 2008 2010 2012 2014 2016
ESS1 ESS2 ESS3 ESS4 ESS5 ESS6 ESS7 ESS8
AT ✔ ✔ ✔ ✔ ✔
BE ✔ ✔ ✔ ✔ ✔ ✔ ✔ ✔
CH ✔ ✔ ✔ ✔ ✔ ✔ ✔ ✔
DE ◯ ◯ ◯ ◯ ◯ ◯ ◯ ◯
DK ✔ ✔ ✔ ✔ ✔ ✔ ✔
ES ◯ ◯ ◯ ◯ ◯ ◯ ◯ ◯
FI ✔ ✔ ✔ ✔ ✔ ✔ ✔ ✔
FR ✔ ✔ ✔ ✔ ✔ ✔ ✔ ✔
GB ◯ ◯ ◯ ◯ ◯ ◯ ◯ ◯
GR ◯ ✔ ✔ ✔
IE ◯ ◯ ◯ ◯ ◯ ◯ ◯ ◯
IS ✔ ✔ ✔
IT ✔ ✔ ✔
LU ◯ ◯
NL ✔ ✔ ✔ ✔ ✔ ✔ ✔ ✔
NO ✔ ✔ ✔ ✔ ✔ ✔ ✔ ✔
PT ◯ ◯ ◯ ◯ ◯ ◯ ◯ ◯
SE ◯ ◯ ◯ ◯ ✔ ✔ ✔ ✔

4
Appendix B. Party classifications
Political parties that were awarded at least one parliamentary seat during the surveyed period are sorted
into party families according to several party classifications: (1) Comparative political data set, (2) Norris,
Pippa (2005), (3) Laver, M., Gallagher, M., & Mair, P (2011), and (4) The Parliament and Government
Composition Database. Each party is given a numeric code where the first digit indicates the super family
and the ones digit represents a specific party family. For example, 21 = Socialist 22 = Left/Socialist. The
super party family Left is an aggregation of the parties that fall into the following categories: socialist,
social democracy, left-socialist and communist-socialist. The super party family Radical Right is an
aggregation of the parties which fall into the following categories: agrarian, radical right, right wing,
populist, protest, and far right.
The four classifications are listed below.
1) Comparative Political Data Set. http://www.cpds-
data.org/images/Update2015/CPDS_Codebook_1960-2013.pdf (p.45)
2) Norris, Pippa. 2005. Radical Right: Voters and Parties in the Electoral Market. Cambridge University
Press pp. 54-57.
3) Gallagher, Michael, Michael Laver, and Peter Mair. 2011. Representative government in modern
Europe. McGraw-Hill.
4) Döring, Holger, and Philip Manow. 2019. “Parliaments and Governments Database (ParlGov):
Information on Parties, Elections and Cabinets in Modern Democracies. Development Version.” /.
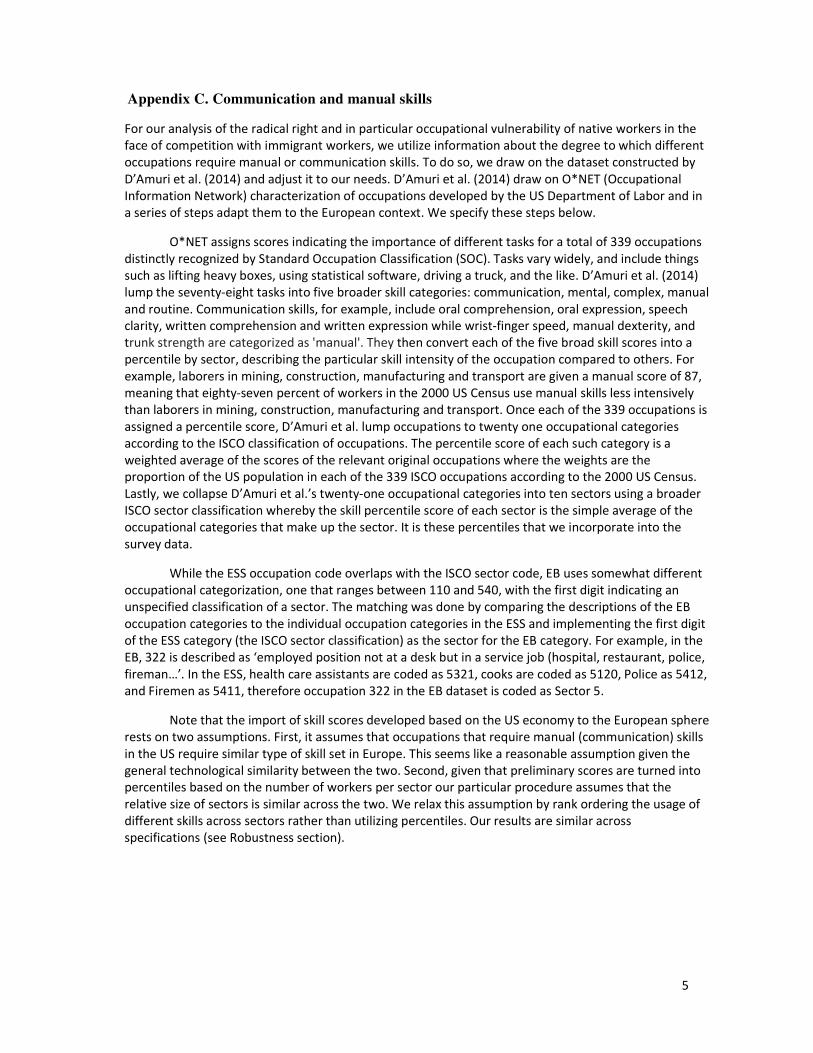
5
Appendix C. Communication and manual skills
For our analysis of the radical right and in particular occupational vulnerability of native workers in the
face of competition with immigrant workers, we utilize information about the degree to which different
occupations require manual or communication skills. To do so, we draw on the dataset constructed by
D’Amuri et al. (2014) and adjust it to our needs. D’Amuri et al. (2014) draw on O*NET (Occupational
Information Network) characterization of occupations developed by the US Department of Labor and in
a series of steps adapt them to the European context. We specify these steps below.
O*NET assigns scores indicating the importance of different tasks for a total of 339 occupations
distinctly recognized by Standard Occupation Classification (SOC). Tasks vary widely, and include things
such as lifting heavy boxes, using statistical software, driving a truck, and the like. D’Amuri et al. (2014)
lump the seventy-eight tasks into five broader skill categories: communication, mental, complex, manual
and routine. Communication skills, for example, include oral comprehension, oral expression, speech
clarity, written comprehension and written expression while wrist-finger speed, manual dexterity, and
trunk strength are categorized as 'manual'. They then convert each of the five broad skill scores into a
percentile by sector, describing the particular skill intensity of the occupation compared to others. For
example, laborers in mining, construction, manufacturing and transport are given a manual score of 87,
meaning that eighty-seven percent of workers in the 2000 US Census use manual skills less intensively
than laborers in mining, construction, manufacturing and transport. Once each of the 339 occupations is
assigned a percentile score, D’Amuri et al. lump occupations to twenty one occupational categories
according to the ISCO classification of occupations. The percentile score of each such category is a
weighted average of the scores of the relevant original occupations where the weights are the
proportion of the US population in each of the 339 ISCO occupations according to the 2000 US Census.
Lastly, we collapse D’Amuri et al.’s twenty-one occupational categories into ten sectors using a broader
ISCO sector classification whereby the skill percentile score of each sector is the simple average of the
occupational categories that make up the sector. It is these percentiles that we incorporate into the
survey data.
While the ESS occupation code overlaps with the ISCO sector code, EB uses somewhat different
occupational categorization, one that ranges between 110 and 540, with the first digit indicating an
unspecified classification of a sector. The matching was done by comparing the descriptions of the EB
occupation categories to the individual occupation categories in the ESS and implementing the first digit
of the ESS category (the ISCO sector classification) as the sector for the EB category. For example, in the
EB, 322 is described as ‘employed position not at a desk but in a service job (hospital, restaurant, police,
fireman…’. In the ESS, health care assistants are coded as 5321, cooks are coded as 5120, Police as 5412,
and Firemen as 5411, therefore occupation 322 in the EB dataset is coded as Sector 5.
Note that the import of skill scores developed based on the US economy to the European sphere
rests on two assumptions. First, it assumes that occupations that require manual (communication) skills
in the US require similar type of skill set in Europe. This seems like a reasonable assumption given the
general technological similarity between the two. Second, given that preliminary scores are turned into
percentiles based on the number of workers per sector our particular procedure assumes that the
relative size of sectors is similar across the two. We relax this assumption by rank ordering the usage of
different skills across sectors rather than utilizing percentiles. Our results are similar across
specifications (see Robustness section).
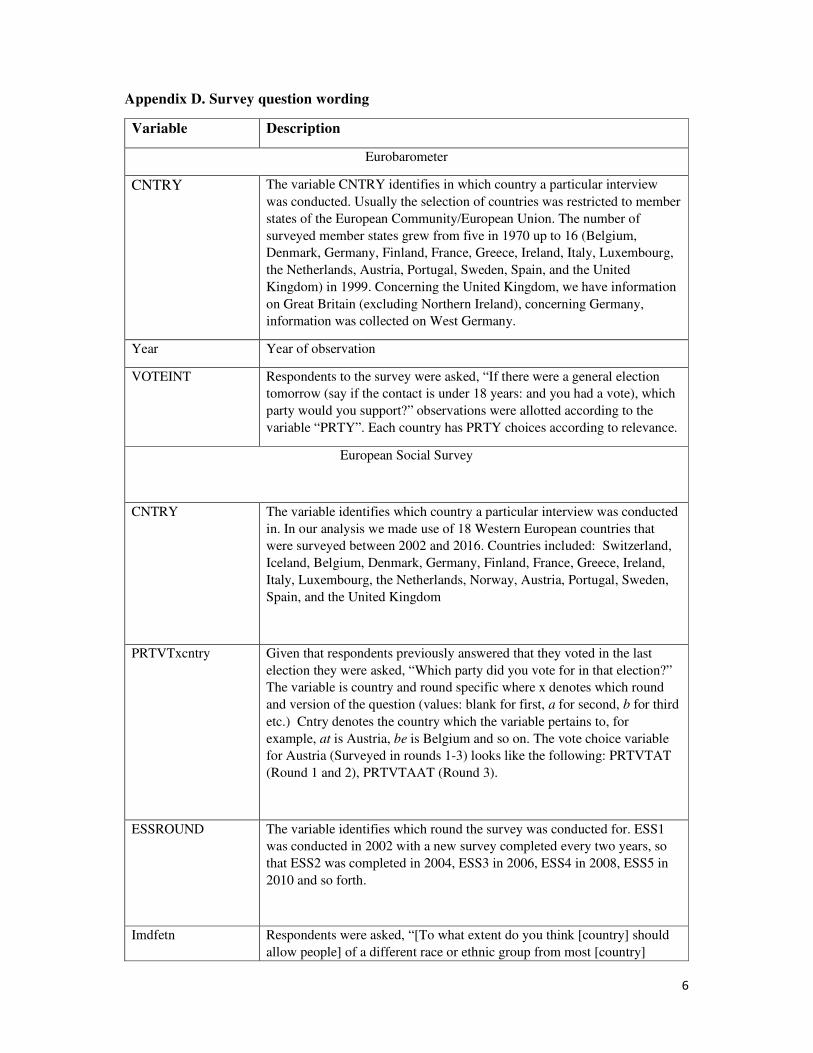
6
Appendix D. Survey question wording
Variable Description
Eurobarometer
CNTRY The variable CNTRY identifies in which country a particular interview
was conducted. Usually the selection of countries was restricted to member
states of the European Community/European Union. The number of
surveyed member states grew from five in 1970 up to 16 (Belgium,
Denmark, Germany, Finland, France, Greece, Ireland, Italy, Luxembourg,
the Netherlands, Austria, Portugal, Sweden, Spain, and the United
Kingdom) in 1999. Concerning the United Kingdom, we have information
on Great Britain (excluding Northern Ireland), concerning Germany,
information was collected on West Germany.
Year Year of observation
VOTEINT Respondents to the survey were asked, “If there were a general election
tomorrow (say if the contact is under 18 years: and you had a vote), which
party would you support?” observations were allotted according to the
variable “PRTY”. Each country has PRTY choices according to relevance.
European Social Survey
CNTRY The variable identifies which country a particular interview was conducted
in. In our analysis we made use of 18 Western European countries that
were surveyed between 2002 and 2016. Countries included: Switzerland,
Iceland, Belgium, Denmark, Germany, Finland, France, Greece, Ireland,
Italy, Luxembourg, the Netherlands, Norway, Austria, Portugal, Sweden,
Spain, and the United Kingdom
PRTVTxcntry Given that respondents previously answered that they voted in the last
election they were asked, “Which party did you vote for in that election?”
The variable is country and round specific where x denotes which round
and version of the question (values: blank for first, a for second, b for third
etc.) Cntry denotes the country which the variable pertains to, for
example, at is Austria, be is Belgium and so on. The vote choice variable
for Austria (Surveyed in rounds 1-3) looks like the following: PRTVTAT
(Round 1 and 2), PRTVTAAT (Round 3).
ESSROUND The variable identifies which round the survey was conducted for. ESS1
was conducted in 2002 with a new survey completed every two years, so
that ESS2 was completed in 2004, ESS3 in 2006, ESS4 in 2008, ESS5 in
2010 and so forth.
Imdfetn Respondents were asked, “[To what extent do you think [country] should
allow people] of a different race or ethnic group from most [country]

7
people?” Respondents either answered, “allow many”, “allow some”,
“allow few”, or “allow none”. We recoded these into categories into
numeric values 1-4 where one takes the category of “allow many
immigrants” and 4 is “allow none”.
imdfetn Respondents were asked, “[To what extent do you think [country] should
allow people] of a different race or ethnic group from most [country]
people?” Respondents either answered, “allow many”, “allow some”,
“allow few”, or “allow none”. We recoded these into categories into
numeric values 1-4 where one takes the category of “allow many
immigrants” and 4 is “allow none”.
Impcntr Description: Respondents were asked, “[Should country C] allow
many/few immigrants from poorer countries outside Europe Respondents
either answered, “allow many”, “allow some”, “allow few”, or “allow
none”. We recoded these into categories into numeric values 1-4 where
one takes the category of “allow many immigrants” and 4 is “allow none”.
Imbgeco Respondents were asked “Would you say it is generally bad or good for
[country]'s economy that people come to live here from other countries?”
Respondents gave a numeric answer between 0-10, where 10 indicated
“good for the economy” and 0 indicated bad for the economy. We recoded
this variable so answers ranged from 0-10, and 0 indicated good for the
economy and 10 indicates bad for the economy
Imueclt Respondents were asked “Would you say that [country’s] cultural life is
generally undermined or enriched by people coming to live here from other
countries?”
Respondents gave a numeric answer between 0-10, where 10 indicated
“cultural life enriched” and 0 indicated cultural life undermined”. We
recoded this variable so answers ranged from 0-10, and 0 indicated
“cultural life enriched” and 10 indicates “cultural life undermined”.
Imwbcnt Respondents were asked “Is [country] made a worse or a better place to
live by people coming to live here from other countries?” Respondents
gave a numeric answer between 0-10, where 10 indicated “better place to
live” and 0 indicated “worse place to live”. We recoded this variable so
answers ranged from 0-10, and 0 indicates “better place to live” and 10
indicated “worse place to live”.
Rlgdgr Respondents were asked “Regardless of whether you belong to a particular
religion, how religious would you say you are?” Respondents gave a
numeric answer between 0-10, where 10 indicated “not at all religious”
and 0 indicated “very religious”.

8
Brncntr Respondents were asked “Were you born in [country]?” A score of 1
indicated “Yes” and a score of 2 indicated “No”. We recoded this variable
so that a score of 0 indicated “Yes” and a score of 1 indicated “No”.
Eduyrs Respondents were asked, “How many years of full-time education have
you completed?” Answers varied from 1-37 years.
Domicil Respondents were asked, “Which phrase on this card best describes the
area where you live?” They were given five choices, “a big city”, “suburbs
or outskirts of big city”, “town or small city”, “country village” or “farm or
home in countryside”. We recoded this variable so that 5 indicated, “a big
city” and 1 indicated “farm or home in countryside”.
uemp3m Respondents were asked “Have you ever been unemployed and seeking
work for a period of more than three months” A score of 1 indicated “Yes”
and a score of 2 indicated “No”. We recoded this variable so that a score of
0 indicated “No” and a score of 1 indicated “Yes”.
Mbtru Respondents were asked, “Are you or have you ever been a member of a
trade union or similar organisation?” A score of 1 indicated “Yes,
currently”, 2 indicated “Yes, previously” and 3 indicated “No”. We
recoded this variable so that 1 indicates “Yes, currently” and 0 indicates
“Yes, previously” and “No”.
Agea Age of the respondent calculated from the year of birth (yrbrn) and the
year of the interview. We dropped all observations for those respondents
under the age 18 (age of suffrage).
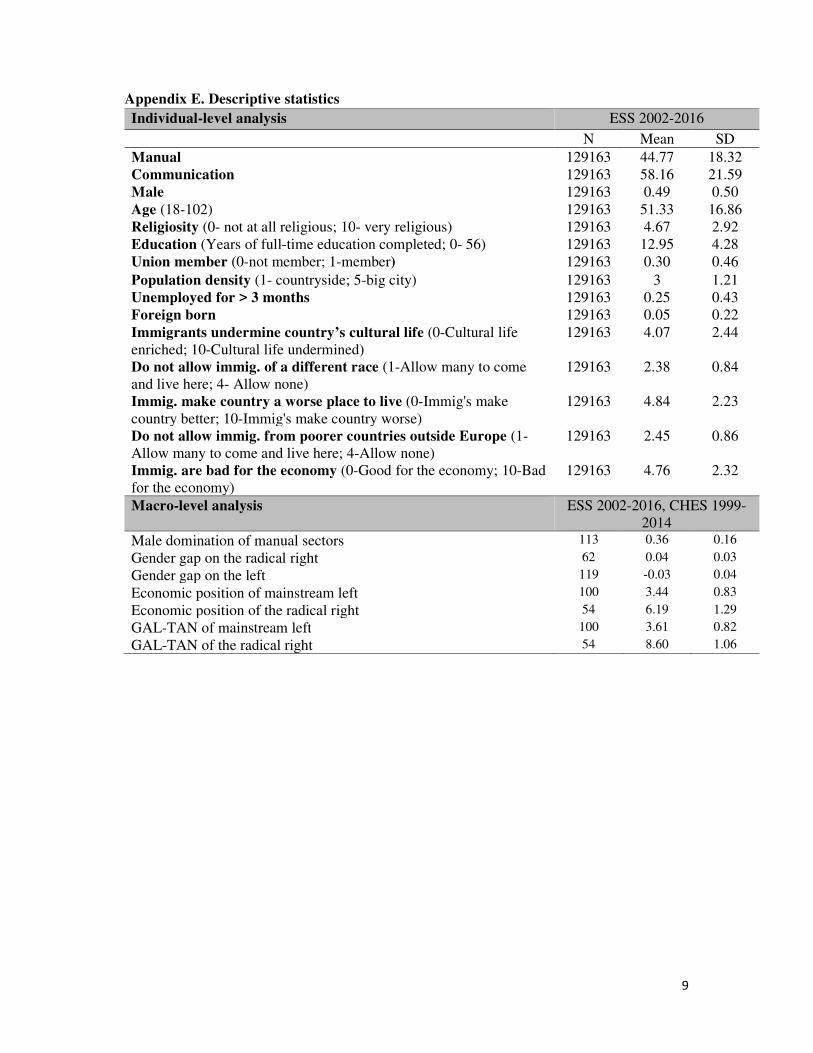
9
Appendix E. Descriptive statistics
Individual-level analysis ESS 2002-2016
N Mean SD
Manual 129163 44.77 18.32
Communication 129163 58.16 21.59
Male 129163 0.49 0.50
Age (18-102) 129163 51.33 16.86
Religiosity (0- not at all religious; 10- very religious) 129163 4.67 2.92
Education (Years of full-time education completed; 0- 56) 129163 12.95 4.28
Union member (0-not member; 1-member) 129163 0.30 0.46
Population density (1- countryside; 5-big city) 129163 3 1.21
Unemployed for > 3 months 129163 0.25 0.43
Foreign born 129163 0.05 0.22
Immigrants undermine country’s cultural life (0-Cultural life
enriched; 10-Cultural life undermined)
129163 4.07 2.44
Do not allow immig. of a different race (1-Allow many to come
and live here; 4- Allow none)
129163 2.38 0.84
Immig. make country a worse place to live (0-Immig's make
country better; 10-Immig's make country worse)
129163 4.84 2.23
Do not allow immig. from poorer countries outside Europe (1-
Allow many to come and live here; 4-Allow none)
129163 2.45 0.86
Immig. are bad for the economy (0-Good for the economy; 10-Bad
for the economy)
129163 4.76 2.32
Macro-level analysis ESS 2002-2016, CHES 1999-
2014
Male domination of manual sectors 113 0.36 0.16
Gender gap on the radical right 62 0.04 0.03
Gender gap on the left 119 -0.03 0.04
Economic position of mainstream left 100 3.44 0.83
Economic position of the radical right 54 6.19 1.29
GAL-TAN of mainstream left 100 3.61 0.82
GAL-TAN of the radical right 54 8.60 1.06
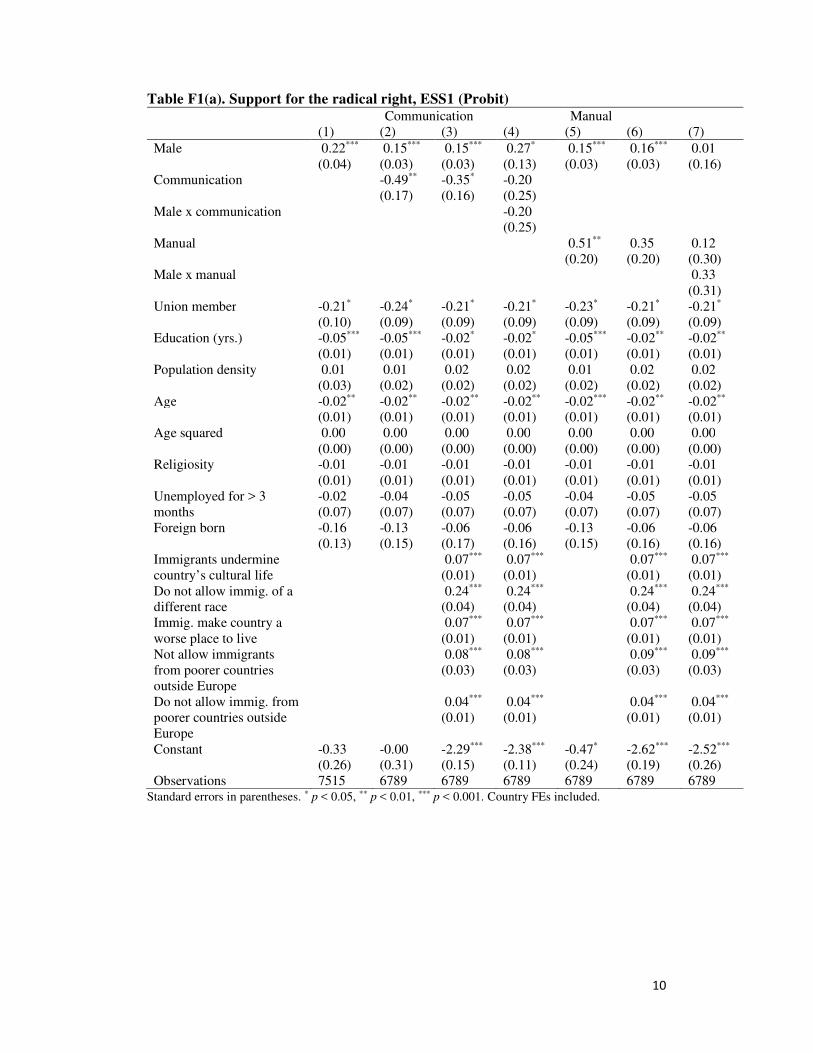
10
Table F1(a). Support for the radical right, ESS1 (Probit)
Communication Manual
(1) (2) (3) (4) (5) (6) (7)
Male 0.22*** 0.15*** 0.15*** 0.27* 0.15*** 0.16*** 0.01
(0.04) (0.03) (0.03) (0.13) (0.03) (0.03) (0.16)
Communication -0.49** -0.35* -0.20
(0.17) (0.16) (0.25)
Male x communication -0.20
(0.25)
Manual 0.51** 0.35 0.12
(0.20) (0.20) (0.30)
Male x manual 0.33
(0.31)
Union member -0.21* -0.24* -0.21* -0.21* -0.23* -0.21* -0.21*
(0.10) (0.09) (0.09) (0.09) (0.09) (0.09) (0.09)
Education (yrs.) -0.05*** -0.05*** -0.02* -0.02* -0.05*** -0.02** -0.02**
(0.01) (0.01) (0.01) (0.01) (0.01) (0.01) (0.01)
Population density 0.01 0.01 0.02 0.02 0.01 0.02 0.02
(0.03) (0.02) (0.02) (0.02) (0.02) (0.02) (0.02)
Age -0.02** -0.02** -0.02** -0.02** -0.02*** -0.02** -0.02**
(0.01) (0.01) (0.01) (0.01) (0.01) (0.01) (0.01)
Age squared 0.00 0.00 0.00 0.00 0.00 0.00 0.00
(0.00) (0.00) (0.00) (0.00) (0.00) (0.00) (0.00)
Religiosity -0.01 -0.01 -0.01 -0.01 -0.01 -0.01 -0.01
(0.01) (0.01) (0.01) (0.01) (0.01) (0.01) (0.01)
Unemployed for > 3
months
-0.02
(0.07)
-0.04
(0.07)
-0.05
(0.07)
-0.05
(0.07)
-0.04
(0.07)
-0.05
(0.07)
-0.05
(0.07)
Foreign born -0.16 -0.13 -0.06 -0.06 -0.13 -0.06 -0.06
(0.13) (0.15) (0.17) (0.16) (0.15) (0.16) (0.16)
Immigrants undermine
country’s cultural life
0.07***
(0.01)
0.07***
(0.01)
0.07***
(0.01)
0.07***
(0.01)
Do not allow immig. of a
different race
0.24***
(0.04)
0.24***
(0.04)
0.24***
(0.04)
0.24***
(0.04)
Immig. make country a
worse place to live
0.07***
(0.01)
0.07***
(0.01)
0.07***
(0.01)
0.07***
(0.01)
Not allow immigrants
from poorer countries
outside Europe
0.08***
(0.03)
0.08***
(0.03)
0.09***
(0.03)
0.09***
(0.03)
Do not allow immig. from
poorer countries outside
Europe
0.04***
(0.01)
0.04***
(0.01)
0.04***
(0.01)
0.04***
(0.01)
Constant -0.33 -0.00 -2.29*** -2.38*** -0.47* -2.62*** -2.52***
(0.26) (0.31) (0.15) (0.11) (0.24) (0.19) (0.26)
Observations 7515 6789 6789 6789 6789 6789 6789 Standard errors in parentheses. * p < 0.05, ** p < 0.01, *** p < 0.001. Country FEs included.
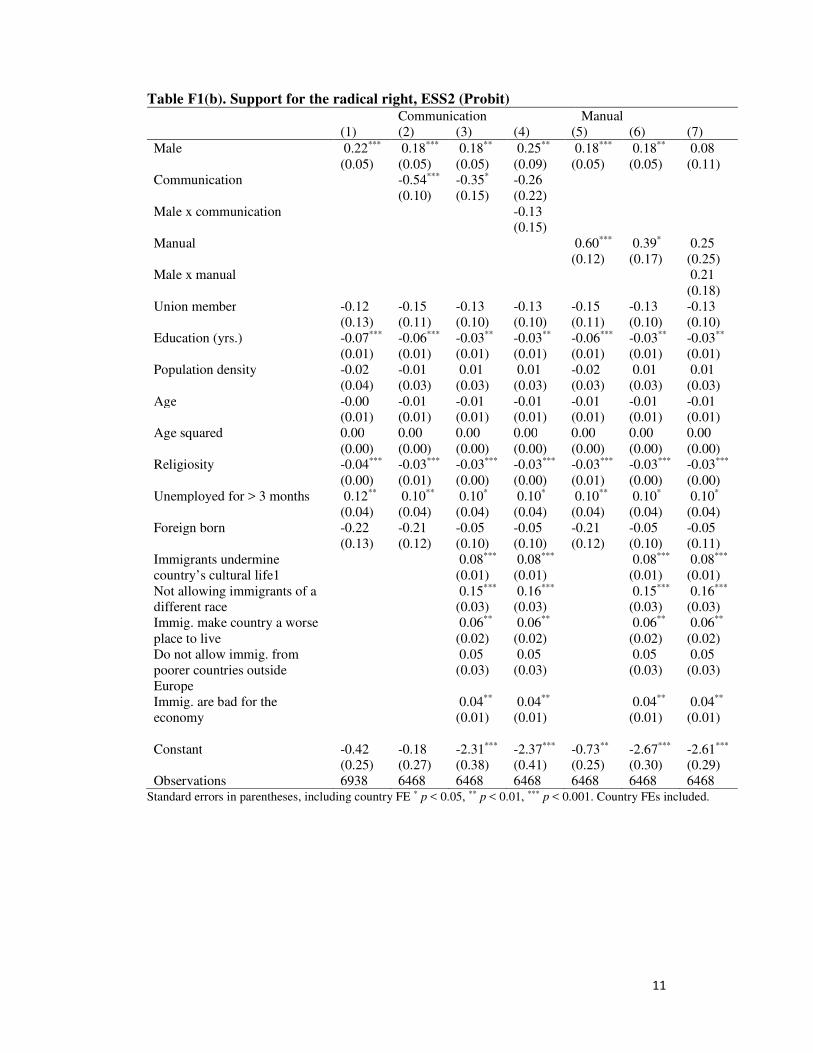
11
Table F1(b). Support for the radical right, ESS2 (Probit)
Communication Manual
(1) (2) (3) (4) (5) (6) (7)
Male 0.22*** 0.18*** 0.18** 0.25** 0.18*** 0.18** 0.08
(0.05) (0.05) (0.05) (0.09) (0.05) (0.05) (0.11)
Communication -0.54*** -0.35* -0.26
(0.10) (0.15) (0.22)
Male x communication -0.13
(0.15)
Manual 0.60*** 0.39* 0.25
(0.12) (0.17) (0.25)
Male x manual 0.21
(0.18)
Union member -0.12 -0.15 -0.13 -0.13 -0.15 -0.13 -0.13
(0.13) (0.11) (0.10) (0.10) (0.11) (0.10) (0.10)
Education (yrs.) -0.07*** -0.06*** -0.03** -0.03** -0.06*** -0.03** -0.03**
(0.01) (0.01) (0.01) (0.01) (0.01) (0.01) (0.01)
Population density -0.02 -0.01 0.01 0.01 -0.02 0.01 0.01
(0.04) (0.03) (0.03) (0.03) (0.03) (0.03) (0.03)
Age -0.00 -0.01 -0.01 -0.01 -0.01 -0.01 -0.01
(0.01) (0.01) (0.01) (0.01) (0.01) (0.01) (0.01)
Age squared 0.00 0.00 0.00 0.00 0.00 0.00 0.00
(0.00) (0.00) (0.00) (0.00) (0.00) (0.00) (0.00)
Religiosity -0.04*** -0.03*** -0.03*** -0.03*** -0.03*** -0.03*** -0.03***
(0.00) (0.01) (0.00) (0.00) (0.01) (0.00) (0.00)
Unemployed for > 3 months 0.12** 0.10** 0.10* 0.10* 0.10** 0.10* 0.10*
(0.04) (0.04) (0.04) (0.04) (0.04) (0.04) (0.04)
Foreign born -0.22 -0.21 -0.05 -0.05 -0.21 -0.05 -0.05
(0.13) (0.12) (0.10) (0.10) (0.12) (0.10) (0.11)
Immigrants undermine
country’s cultural life1
0.08***
(0.01)
0.08***
(0.01)
0.08***
(0.01)
0.08***
(0.01)
Not allowing immigrants of a
different race
0.15***
(0.03)
0.16***
(0.03)
0.15***
(0.03)
0.16***
(0.03)
Immig. make country a worse
place to live
0.06**
(0.02)
0.06**
(0.02)
0.06**
(0.02)
0.06**
(0.02)
Do not allow immig. from
poorer countries outside
Europe
0.05
(0.03)
0.05
(0.03)
0.05
(0.03)
0.05
(0.03)
Immig. are bad for the
economy
0.04**
(0.01)
0.04**
(0.01)
0.04**
(0.01)
0.04**
(0.01)
Constant -0.42 -0.18 -2.31*** -2.37*** -0.73** -2.67*** -2.61***
(0.25) (0.27) (0.38) (0.41) (0.25) (0.30) (0.29)
Observations 6938 6468 6468 6468 6468 6468 6468 Standard errors in parentheses, including country FE * p < 0.05, ** p < 0.01, *** p < 0.001. Country FEs included.
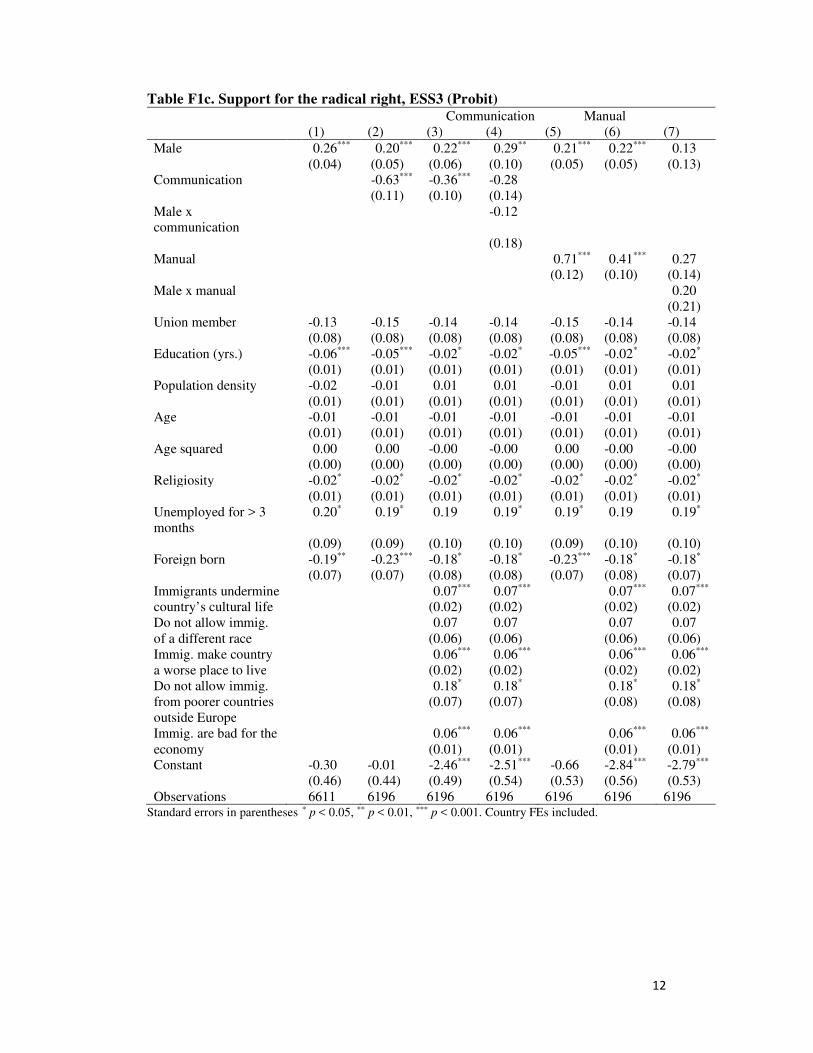
12
Table F1c. Support for the radical right, ESS3 (Probit)
Communication Manual
(1) (2) (3) (4) (5) (6) (7)
Male 0.26*** 0.20*** 0.22*** 0.29** 0.21*** 0.22*** 0.13
(0.04) (0.05) (0.06) (0.10) (0.05) (0.05) (0.13)
Communication -0.63*** -0.36*** -0.28
(0.11) (0.10) (0.14)
Male x
communication
-0.12
(0.18)
Manual 0.71*** 0.41*** 0.27
(0.12) (0.10) (0.14)
Male x manual 0.20
(0.21)
Union member -0.13 -0.15 -0.14 -0.14 -0.15 -0.14 -0.14
(0.08) (0.08) (0.08) (0.08) (0.08) (0.08) (0.08)
Education (yrs.) -0.06*** -0.05*** -0.02* -0.02* -0.05*** -0.02* -0.02*
(0.01) (0.01) (0.01) (0.01) (0.01) (0.01) (0.01)
Population density -0.02 -0.01 0.01 0.01 -0.01 0.01 0.01
(0.01) (0.01) (0.01) (0.01) (0.01) (0.01) (0.01)
Age -0.01 -0.01 -0.01 -0.01 -0.01 -0.01 -0.01
(0.01) (0.01) (0.01) (0.01) (0.01) (0.01) (0.01)
Age squared 0.00 0.00 -0.00 -0.00 0.00 -0.00 -0.00
(0.00) (0.00) (0.00) (0.00) (0.00) (0.00) (0.00)
Religiosity -0.02* -0.02* -0.02* -0.02* -0.02* -0.02* -0.02*
(0.01) (0.01) (0.01) (0.01) (0.01) (0.01) (0.01)
Unemployed for > 3
months
0.20* 0.19* 0.19 0.19* 0.19* 0.19 0.19*
(0.09) (0.09) (0.10) (0.10) (0.09) (0.10) (0.10)
Foreign born -0.19** -0.23*** -0.18* -0.18* -0.23*** -0.18* -0.18*
(0.07) (0.07) (0.08) (0.08) (0.07) (0.08) (0.07)
Immigrants undermine
country’s cultural life
0.07***
(0.02)
0.07***
(0.02)
0.07***
(0.02)
0.07***
(0.02)
Do not allow immig.
of a different race
0.07
(0.06)
0.07
(0.06)
0.07
(0.06)
0.07
(0.06)
Immig. make country
a worse place to live
0.06***
(0.02)
0.06***
(0.02)
0.06***
(0.02)
0.06***
(0.02)
Do not allow immig.
from poorer countries
outside Europe
0.18*
(0.07)
0.18*
(0.07)
0.18*
(0.08)
0.18*
(0.08)
Immig. are bad for the
economy
0.06***
(0.01)
0.06***
(0.01)
0.06***
(0.01)
0.06***
(0.01)
Constant -0.30 -0.01 -2.46*** -2.51*** -0.66 -2.84*** -2.79***
(0.46) (0.44) (0.49) (0.54) (0.53) (0.56) (0.53)
Observations 6611 6196 6196 6196 6196 6196 6196 Standard errors in parentheses * p < 0.05, ** p < 0.01, *** p < 0.001. Country FEs included.
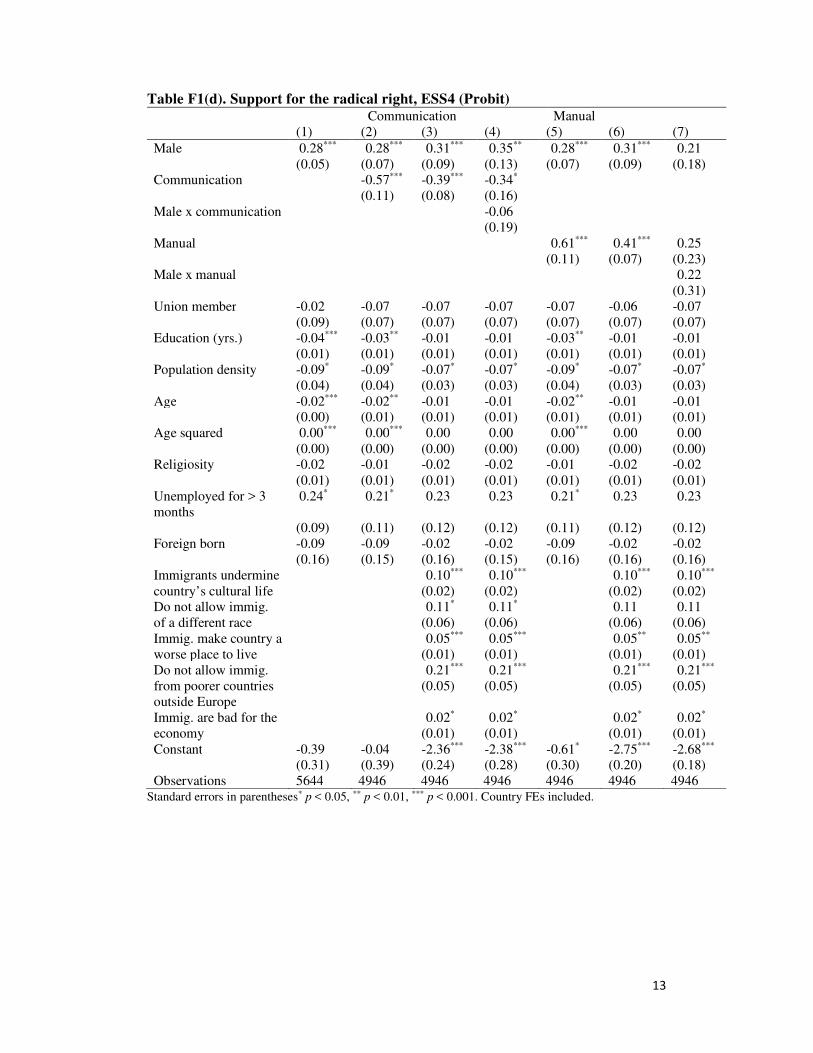
13
Table F1(d). Support for the radical right, ESS4 (Probit)
Communication Manual
(1) (2) (3) (4) (5) (6) (7)
Male 0.28*** 0.28*** 0.31*** 0.35** 0.28*** 0.31*** 0.21
(0.05) (0.07) (0.09) (0.13) (0.07) (0.09) (0.18)
Communication -0.57*** -0.39*** -0.34*
(0.11) (0.08) (0.16)
Male x communication -0.06
(0.19)
Manual 0.61*** 0.41*** 0.25
(0.11) (0.07) (0.23)
Male x manual 0.22
(0.31)
Union member -0.02 -0.07 -0.07 -0.07 -0.07 -0.06 -0.07
(0.09) (0.07) (0.07) (0.07) (0.07) (0.07) (0.07)
Education (yrs.) -0.04*** -0.03** -0.01 -0.01 -0.03** -0.01 -0.01
(0.01) (0.01) (0.01) (0.01) (0.01) (0.01) (0.01)
Population density -0.09* -0.09* -0.07* -0.07* -0.09* -0.07* -0.07*
(0.04) (0.04) (0.03) (0.03) (0.04) (0.03) (0.03)
Age -0.02*** -0.02** -0.01 -0.01 -0.02** -0.01 -0.01
(0.00) (0.01) (0.01) (0.01) (0.01) (0.01) (0.01)
Age squared 0.00*** 0.00*** 0.00 0.00 0.00*** 0.00 0.00
(0.00) (0.00) (0.00) (0.00) (0.00) (0.00) (0.00)
Religiosity -0.02 -0.01 -0.02 -0.02 -0.01 -0.02 -0.02
(0.01) (0.01) (0.01) (0.01) (0.01) (0.01) (0.01)
Unemployed for > 3
months
0.24* 0.21* 0.23 0.23 0.21* 0.23 0.23
(0.09) (0.11) (0.12) (0.12) (0.11) (0.12) (0.12)
Foreign born -0.09 -0.09 -0.02 -0.02 -0.09 -0.02 -0.02
(0.16) (0.15) (0.16) (0.15) (0.16) (0.16) (0.16)
Immigrants undermine
country’s cultural life
0.10***
(0.02)
0.10***
(0.02)
0.10***
(0.02)
0.10***
(0.02)
Do not allow immig.
of a different race
0.11*
(0.06)
0.11*
(0.06)
0.11
(0.06)
0.11
(0.06)
Immig. make country a
worse place to live
0.05***
(0.01)
0.05***
(0.01)
0.05**
(0.01)
0.05**
(0.01)
Do not allow immig.
from poorer countries
outside Europe
0.21***
(0.05)
0.21***
(0.05)
0.21***
(0.05)
0.21***
(0.05)
Immig. are bad for the
economy
0.02*
(0.01)
0.02*
(0.01)
0.02*
(0.01)
0.02*
(0.01)
Constant -0.39 -0.04 -2.36*** -2.38*** -0.61* -2.75*** -2.68***
(0.31) (0.39) (0.24) (0.28) (0.30) (0.20) (0.18)
Observations 5644 4946 4946 4946 4946 4946 4946 Standard errors in parentheses* p < 0.05, ** p < 0.01, *** p < 0.001. Country FEs included.

14
Table F1(e). Support for the radical right, ESS5 (Probit)
Communication Manual
(1) (2) (3) (4) (5) (6) (7)
Male 0.22*** 0.13 0.17* 0.22** 0.14* 0.17** 0.11
(0.06) (0.07) (0.07) (0.07) (0.07) (0.06) (0.09)
Communication -0.73** -0.49* -0.41*
(0.22) (0.19) (0.20)
Male x
communication
-0.10
(0.09)
Manual 0.78** 0.52* 0.41
(0.26) (0.23) (0.23)
Male x manual 0.14
(0.09)
Union member -0.09 -0.10 -0.04 -0.04 -0.10 -0.04 -0.04
(0.05) (0.05) (0.06) (0.06) (0.05) (0.06) (0.06)
Education (yrs.) -0.05*** -0.04** -0.02 -0.02 -0.05** -0.02 -0.02
(0.01) (0.02) (0.01) (0.01) (0.02) (0.01) (0.01)
Population density -0.05 -0.05 -0.01 -0.01 -0.05* -0.01 -0.01
(0.03) (0.02) (0.03) (0.03) (0.02) (0.03) (0.03)
Age -0.02** -0.02** -0.01* -0.01* -0.02** -0.01* -0.01*
(0.01) (0.01) (0.00) (0.00) (0.01) (0.00) (0.00)
Age squared 0.00* 0.00 0.00 0.00 0.00 0.00 0.00
(0.00) (0.00) (0.00) (0.00) (0.00) (0.00) (0.00)
Religiosity -0.00 -0.01 -0.00 -0.00 -0.01 -0.00 -0.00
(0.01) (0.01) (0.01) (0.01) (0.01) (0.01) (0.01)
Unemployed for > 3
months
0.19** 0.16** 0.18* 0.18* 0.17** 0.18* 0.18*
(0.06) (0.06) (0.07) (0.07) (0.06) (0.07) (0.07)
Foreign born -0.25** -0.29** -0.21 -0.21 -0.29** -0.21 -0.21
(0.09) (0.10) (0.11) (0.11) (0.10) (0.11) (0.11)
Immigrants undermine
country’s cultural life
0.09***
(0.02)
0.09***
(0.02)
0.09***
(0.02)
0.09***
(0.02)
Do not allow immig.
of a different race
0.09
(0.05)
0.09
(0.05)
0.09
(0.05)
0.09
(0.05)
Immig. make country
a worse place to live
0.07**
(0.02)
0.07**
(0.02)
0.07**
(0.02)
0.07**
(0.02)
Do not allow immig.
from poorer countries
0.16**
(0.06)
0.16**
(0.06)
0.16**
(0.06)
0.16**
(0.06)
Immig. are bad for the
economy
0.07**
(0.02)
0.07**
(0.02)
0.07**
(0.02)
0.07**
(0.02)
Constant -1.07*** -0.78** -3.51*** -3.55*** -1.51*** -4.00*** -3.96***
(0.29) (0.27) (0.18) (0.17) (0.37) (0.34) (0.34)
Observations 8305 7495 7495 7495 7495 7495 7495 Standard errors in parentheses* p < 0.05, ** p < 0.01, *** p < 0.001. Country FEs included.

15
Table F1(f). Support for the radical right, ESS6 (Probit)
Communication Manual
(1) (2) (3) (4) (5) (6) (7)
Male 0.27*** 0.21*** 0.25*** 0.44*** 0.22*** 0.25*** 0.06
(0.04) (0.04) (0.06) (0.13) (0.04) (0.06) (0.10)
Communication -0.68*** -0.37*** -0.13
(0.09) (0.10) (0.13)
Male x
communication
-0.33
(0.17)
Manual 0.75*** 0.41*** 0.10
(0.11) (0.12) (0.14)
Male x manual 0.43*
(0.21)
Union member -0.11 -0.12 -0.08 -0.08 -0.12 -0.07 -0.08
(0.08) (0.07) (0.06) (0.06) (0.07) (0.06) (0.06)
Education (yrs.) -0.07*** -0.06*** -0.04*** -0.04*** -0.06*** -0.04*** -0.04***
(0.01) (0.01) (0.01) (0.01) (0.01) (0.01) (0.01)
Population density -0.07** -0.06** -0.04 -0.04 -0.06** -0.04 -0.04
(0.03) (0.02) (0.02) (0.02) (0.02) (0.02) (0.02)
Age 0.00 0.00 0.00 0.00 -0.00 0.00 0.00
(0.01) (0.01) (0.01) (0.01) (0.01) (0.01) (0.01)
Age squared -0.00 -0.00 -0.00 -0.00 -0.00 -0.00 -0.00
(0.00) (0.00) (0.00) (0.00) (0.00) (0.00) (0.00)
Religiosity -0.02** -0.02** -0.02* -0.02* -0.02** -0.02* -0.02*
(0.01) (0.01) (0.01) (0.01) (0.01) (0.01) (0.01)
Unemployed for > 3
months
0.11** 0.09* 0.11** 0.11*** 0.09* 0.11*** 0.11***
(0.04) (0.04) (0.03) (0.03) (0.04) (0.03) (0.03)
Foreign born -0.12* -0.12* -0.03 -0.03 -0.12* -0.03 -0.03
(0.06) (0.05) (0.06) (0.06) (0.05) (0.06) (0.06)
Immigrants
undermine country’s
cultural life
0.06***
(0.01)
0.06***
(0.01)
0.06***
(0.01)
0.06***
(0.01)
Do not allow immig.
of a different race
0.14***
(0.04)
0.14***
(0.04)
0.14***
(0.04)
0.14***
(0.04)
Immig. make country
a worse place to live
0.09***
(0.01)
0.09***
(0.01)
0.09***
(0.01)
0.09***
(0.01)
Do not allow immig.
from poorer countries
0.18***
(0.03)
0.18***
(0.03)
0.18***
(0.03)
0.18***
(0.03)
Immig. are bad for
the economy
0.06***
(0.02)
0.06***
(0.02)
0.06***
(0.02)
0.06***
(0.02)
Constant -1.19*** -0.98*** -3.73*** -3.88*** -1.68*** -4.12*** -3.98***
(0.20) (0.23) (0.30) (0.26) (0.23) (0.28) (0.31)
Observations 9786 9157 9157 9157 9157 9157 9157 Standard errors in parentheses* p < 0.05, ** p < 0.01, *** p < 0.001. Country FEs included.
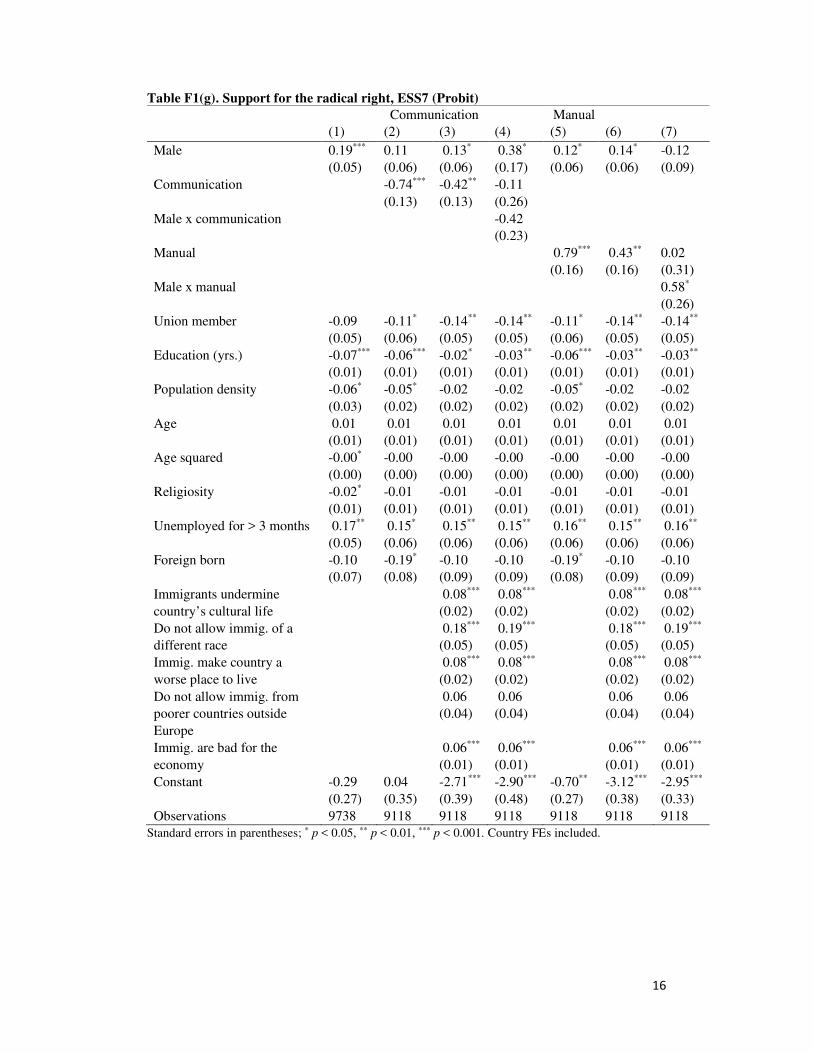
16
Table F1(g). Support for the radical right, ESS7 (Probit)
Communication Manual
(1) (2) (3) (4) (5) (6) (7)
Male 0.19*** 0.11 0.13* 0.38* 0.12* 0.14* -0.12
(0.05) (0.06) (0.06) (0.17) (0.06) (0.06) (0.09)
Communication -0.74*** -0.42** -0.11
(0.13) (0.13) (0.26)
Male x communication -0.42
(0.23)
Manual 0.79*** 0.43** 0.02
(0.16) (0.16) (0.31)
Male x manual 0.58*
(0.26)
Union member -0.09 -0.11* -0.14** -0.14** -0.11* -0.14** -0.14**
(0.05) (0.06) (0.05) (0.05) (0.06) (0.05) (0.05)
Education (yrs.) -0.07*** -0.06*** -0.02* -0.03** -0.06*** -0.03** -0.03**
(0.01) (0.01) (0.01) (0.01) (0.01) (0.01) (0.01)
Population density -0.06* -0.05* -0.02 -0.02 -0.05* -0.02 -0.02
(0.03) (0.02) (0.02) (0.02) (0.02) (0.02) (0.02)
Age 0.01 0.01 0.01 0.01 0.01 0.01 0.01
(0.01) (0.01) (0.01) (0.01) (0.01) (0.01) (0.01)
Age squared -0.00* -0.00 -0.00 -0.00 -0.00 -0.00 -0.00
(0.00) (0.00) (0.00) (0.00) (0.00) (0.00) (0.00)
Religiosity -0.02* -0.01 -0.01 -0.01 -0.01 -0.01 -0.01
(0.01) (0.01) (0.01) (0.01) (0.01) (0.01) (0.01)
Unemployed for > 3 months 0.17** 0.15* 0.15** 0.15** 0.16** 0.15** 0.16**
(0.05) (0.06) (0.06) (0.06) (0.06) (0.06) (0.06)
Foreign born -0.10 -0.19* -0.10 -0.10 -0.19* -0.10 -0.10
(0.07) (0.08) (0.09) (0.09) (0.08) (0.09) (0.09)
Immigrants undermine
country’s cultural life
0.08***
(0.02)
0.08***
(0.02)
0.08***
(0.02)
0.08***
(0.02)
Do not allow immig. of a
different race
0.18***
(0.05)
0.19***
(0.05)
0.18***
(0.05)
0.19***
(0.05)
Immig. make country a
worse place to live
0.08***
(0.02)
0.08***
(0.02)
0.08***
(0.02)
0.08***
(0.02)
Do not allow immig. from
poorer countries outside
Europe
0.06
(0.04)
0.06
(0.04)
0.06
(0.04)
0.06
(0.04)
Immig. are bad for the
economy
0.06***
(0.01)
0.06***
(0.01)
0.06***
(0.01)
0.06***
(0.01)
Constant -0.29 0.04 -2.71*** -2.90*** -0.70** -3.12*** -2.95***
(0.27) (0.35) (0.39) (0.48) (0.27) (0.38) (0.33)
Observations 9738 9118 9118 9118 9118 9118 9118
Standard errors in parentheses; * p < 0.05, ** p < 0.01, *** p < 0.001. Country FEs included.

17
Table F1(h). Support for the radical right, ESS8 (Probit)
Communication Manual
(1) (2) (3) (4) (5) (6) (7)
Male 0.24*** 0.20*** 0.18*** 0.16 0.20*** 0.18*** 0.16
(0.05) (0.05) (0.04) (0.15) (0.05) (0.04) (0.12)
Communication -0.54*** -0.33* -0.37*
(0.15) (0.13) (0.18)
Male x communication 0.04
(0.23)
Manual 0.59*** 0.36* 0.34
(0.16) (0.15) (0.20)
Male x manual 0.04
(0.28)
Union member -0.12 -0.16** -0.15*** -0.15*** -0.16** -0.15*** -0.15***
(0.06) (0.05) (0.04) (0.04) (0.05) (0.04) (0.04)
Education (yrs.) -0.08*** -0.07*** -0.04*** -0.04*** -0.07*** -0.04*** -0.04***
(0.01) (0.01) (0.00) (0.00) (0.01) (0.00) (0.00)
Population density -0.04 -0.04 -0.01 -0.01 -0.04 -0.01 -0.01
(0.03) (0.03) (0.03) (0.03) (0.03) (0.03) (0.03)
Age 0.02* 0.02* 0.01 0.01 0.02* 0.01 0.01
(0.01) (0.01) (0.01) (0.01) (0.01) (0.01) (0.01)
Age squared -0.00*** -0.00** -0.00* -0.00* -0.00** -0.00* -0.00*
(0.00) (0.00) (0.00) (0.00) (0.00) (0.00) (0.00)
Religiosity -0.01* -0.01* -0.01* -0.01* -0.01* -0.01* -0.01*
(0.01) (0.01) (0.01) (0.01) (0.01) (0.01) (0.01)
Unemployed for > 3 months 0.18* 0.16 0.13 0.13 0.16* 0.13 0.13
(0.08) (0.08) (0.08) (0.08) (0.08) (0.08) (0.08)
Foreign born -0.20* -0.25** -0.21* -0.21* -0.25** -0.21* -0.21*
(0.09) (0.09) (0.08) (0.08) (0.09) (0.08) (0.08)
Immigrants undermine
country’s cultural life
0.10***
(0.02)
0.10***
(0.02)
0.10***
(0.02)
0.10***
(0.02)
Do not allow immig. of a
different race
0.15**
(0.05)
0.15**
(0.05)
0.15**
(0.05)
0.15**
(0.05)
Immig. make country a
worse place to live
0.05***
(0.01)
0.05***
(0.01)
0.05***
(0.01)
0.05***
(0.01)
Do not allow immig. from
poorer countries outside
Europe
0.14**
(0.05)
0.14**
(0.05)
0.14**
(0.05)
0.14**
(0.05)
Immig. are bad for the
economy
0.05*
(0.02)
0.05*
(0.02)
0.05*
(0.02)
0.05*
(0.02)
Constant -0.16 0.16 -2.41*** -2.39*** -0.39 -2.75*** -2.74***
(0.27) (0.29) (0.28) (0.28) (0.21) (0.22) (0.24)
Observations 9792 9096 9096 9096 9096 9096 9096
Standard errors in parentheses; * p < 0.05, ** p < 0.01, *** p < 0.001. Country FEs included.

18
Table F2. Support for the radical right
(Probit, incl. interaction between gender and anti-immigrant attitudes, ESS 1-8)
Cultural anti-immigrant
attitudes
Economic anti-
immigrant attitudes
(1) (2) (3) (4)
Male 0.19** 0.19** 0.25*** 0.25***
(0.06) (0.06) (0.03) (0.03)
Communication -0.43*** -0.45***
(0.05) (0.05)
Manual 0.46*** 0.48***
(0.06) (0.06)
cultural anti-immigrant attitudes 2.54*** 2.55***
(0.16) (0.16)
M * cultural anti-immigrant attitudes -0.05
(0.11)
-0.05
(0.11)
economic anti-immigrant attitudes 2.16*** 2.16***
(0.12) (0.12)
M * economic anti-immigrant
attitudes
-0.09
(0.06)
-0.09
(0.06)
Union member -0.12** -0.12** -0.13** -0.13**
(0.04) (0.04) (0.04) (0.04)
Education (Yrs.) -0.03*** -0.03*** -0.03*** -0.03***
(0.01) (0.01) (0.01) (0.01)
Population density -0.01 -0.02 -0.02 -0.02
(0.01) (0.01) (0.01) (0.01)
Age -0.00 -0.00 -0.00 -0.00
(0.00) (0.00) (0.00) (0.00)
Age squared -0.00 -0.00 -0.00 -0.00
(0.00) (0.00) (0.00) (0.00)
Religiosity -0.01*** -0.01*** -0.01** -0.01**
(0.00) (0.00) (0.00) (0.00)
Unemployed for>3 months 0.12** 0.12** 0.12** 0.12**
(0.04) (0.04) (0.04) (0.04)
Foreign born -0.13** -0.13** -0.16** -0.16**
(0.05) (0.04) (0.05) (0.05)
Constant -1.88*** -2.30*** -1.51*** -1.96***
(0.25) (0.25) (0.23) (0.23)
Observations 66673 66673 66673 66673 Standard errors in parentheses* p < 0.05, ** p < 0.01, *** p < 0.001. Country and year FEs included.
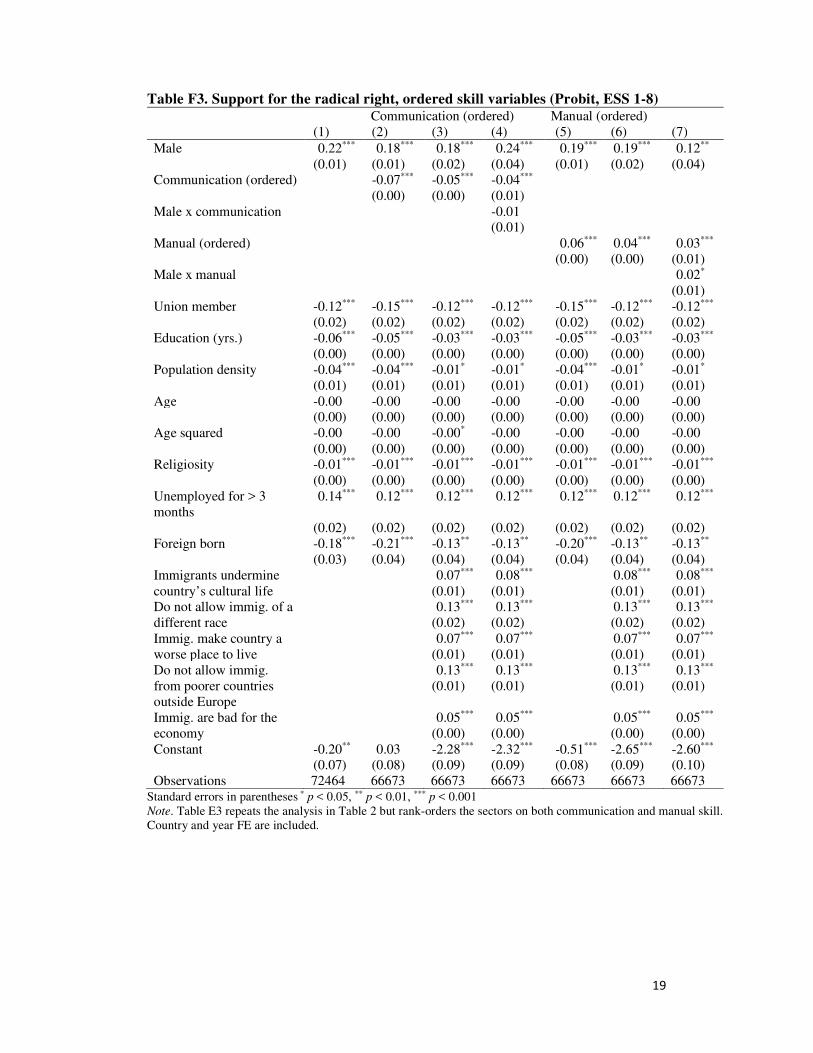
19
Table F3. Support for the radical right, ordered skill variables (Probit, ESS 1-8)
Communication (ordered) Manual (ordered)
(1) (2) (3) (4) (5) (6) (7)
Male 0.22*** 0.18*** 0.18*** 0.24*** 0.19*** 0.19*** 0.12**
(0.01) (0.01) (0.02) (0.04) (0.01) (0.02) (0.04)
Communication (ordered) -0.07*** -0.05*** -0.04***
(0.00) (0.00) (0.01)
Male x communication -0.01
(0.01)
Manual (ordered) 0.06*** 0.04*** 0.03***
(0.00) (0.00) (0.01)
Male x manual 0.02*
(0.01)
Union member -0.12*** -0.15*** -0.12*** -0.12*** -0.15*** -0.12*** -0.12***
(0.02) (0.02) (0.02) (0.02) (0.02) (0.02) (0.02)
Education (yrs.) -0.06*** -0.05*** -0.03*** -0.03*** -0.05*** -0.03*** -0.03***
(0.00) (0.00) (0.00) (0.00) (0.00) (0.00) (0.00)
Population density -0.04*** -0.04*** -0.01* -0.01* -0.04*** -0.01* -0.01*
(0.01) (0.01) (0.01) (0.01) (0.01) (0.01) (0.01)
Age -0.00 -0.00 -0.00 -0.00 -0.00 -0.00 -0.00
(0.00) (0.00) (0.00) (0.00) (0.00) (0.00) (0.00)
Age squared -0.00 -0.00 -0.00* -0.00 -0.00 -0.00 -0.00
(0.00) (0.00) (0.00) (0.00) (0.00) (0.00) (0.00)
Religiosity -0.01*** -0.01*** -0.01*** -0.01*** -0.01*** -0.01*** -0.01***
(0.00) (0.00) (0.00) (0.00) (0.00) (0.00) (0.00)
Unemployed for > 3
months
0.14*** 0.12*** 0.12*** 0.12*** 0.12*** 0.12*** 0.12***
(0.02) (0.02) (0.02) (0.02) (0.02) (0.02) (0.02)
Foreign born -0.18*** -0.21*** -0.13** -0.13** -0.20*** -0.13** -0.13**
(0.03) (0.04) (0.04) (0.04) (0.04) (0.04) (0.04)
Immigrants undermine
country’s cultural life
0.07***
(0.01)
0.08***
(0.01)
0.08***
(0.01)
0.08***
(0.01)
Do not allow immig. of a
different race
0.13***
(0.02)
0.13***
(0.02)
0.13***
(0.02)
0.13***
(0.02)
Immig. make country a
worse place to live
0.07***
(0.01)
0.07***
(0.01)
0.07***
(0.01)
0.07***
(0.01)
Do not allow immig.
from poorer countries
outside Europe
0.13***
(0.01)
0.13***
(0.01)
0.13***
(0.01)
0.13***
(0.01)
Immig. are bad for the
economy
0.05***
(0.00)
0.05***
(0.00)
0.05***
(0.00)
0.05***
(0.00)
Constant -0.20** 0.03 -2.28*** -2.32*** -0.51*** -2.65*** -2.60***
(0.07) (0.08) (0.09) (0.09) (0.08) (0.09) (0.10)
Observations 72464 66673 66673 66673 66673 66673 66673 Standard errors in parentheses * p < 0.05, ** p < 0.01, *** p < 0.001
Note. Table E3 repeats the analysis in Table 2 but rank-orders the sectors on both communication and manual skill.
Country and year FE are included.
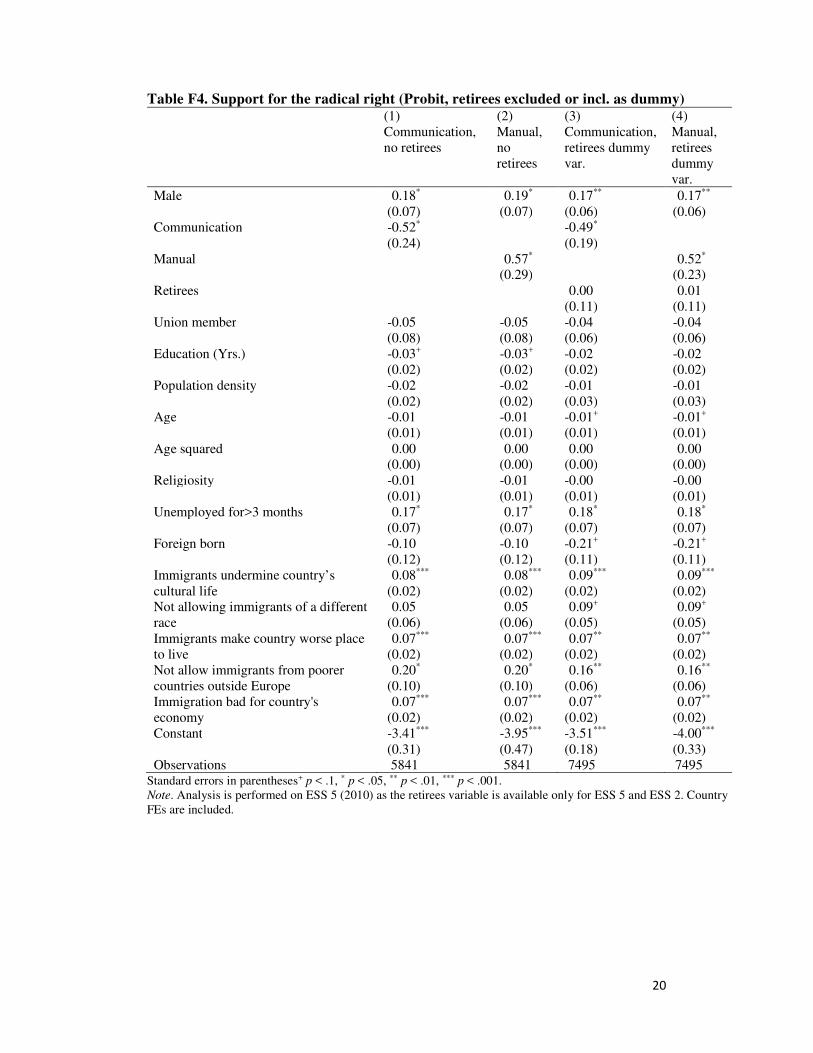
20
Table F4. Support for the radical right (Probit, retirees excluded or incl. as dummy)
(1) (2) (3) (4)
Communication,
no retirees
Manual,
no
retirees
Communication,
retirees dummy
var.
Manual,
retirees
dummy
var.
Male 0.18* 0.19* 0.17** 0.17**
(0.07) (0.07) (0.06) (0.06)
Communication -0.52* -0.49*
(0.24) (0.19)
Manual 0.57* 0.52*
(0.29) (0.23)
Retirees 0.00 0.01
(0.11) (0.11)
Union member -0.05 -0.05 -0.04 -0.04
(0.08) (0.08) (0.06) (0.06)
Education (Yrs.) -0.03+
(0.02)
-0.03+
(0.02)
-0.02
(0.02)
-0.02
(0.02)
Population density -0.02 -0.02 -0.01 -0.01
(0.02) (0.02) (0.03) (0.03)
Age -0.01 -0.01 -0.01+ -0.01+
(0.01) (0.01) (0.01) (0.01)
Age squared 0.00 0.00 0.00 0.00
(0.00) (0.00) (0.00) (0.00)
Religiosity -0.01 -0.01 -0.00 -0.00
(0.01) (0.01) (0.01) (0.01)
Unemployed for>3 months 0.17* 0.17* 0.18* 0.18*
(0.07) (0.07) (0.07) (0.07)
Foreign born -0.10 -0.10 -0.21+ -0.21+
(0.12) (0.12) (0.11) (0.11)
Immigrants undermine country’s
cultural life
0.08***
(0.02)
0.08***
(0.02)
0.09***
(0.02)
0.09***
(0.02)
Not allowing immigrants of a different
race
0.05
(0.06)
0.05
(0.06)
0.09+
(0.05)
0.09+
(0.05)
Immigrants make country worse place
to live
0.07***
(0.02)
0.07***
(0.02)
0.07**
(0.02)
0.07**
(0.02)
Not allow immigrants from poorer
countries outside Europe
0.20*
(0.10)
0.20*
(0.10)
0.16**
(0.06)
0.16**
(0.06)
Immigration bad for country's
economy
0.07***
(0.02)
0.07***
(0.02)
0.07**
(0.02)
0.07**
(0.02)
Constant -3.41*** -3.95*** -3.51*** -4.00***
(0.31) (0.47) (0.18) (0.33)
Observations 5841 5841 7495 7495 Standard errors in parentheses+ p < .1, * p < .05, ** p < .01, *** p < .001.
Note. Analysis is performed on ESS 5 (2010) as the retirees variable is available only for ESS 5 and ESS 2. Country
FEs are included.
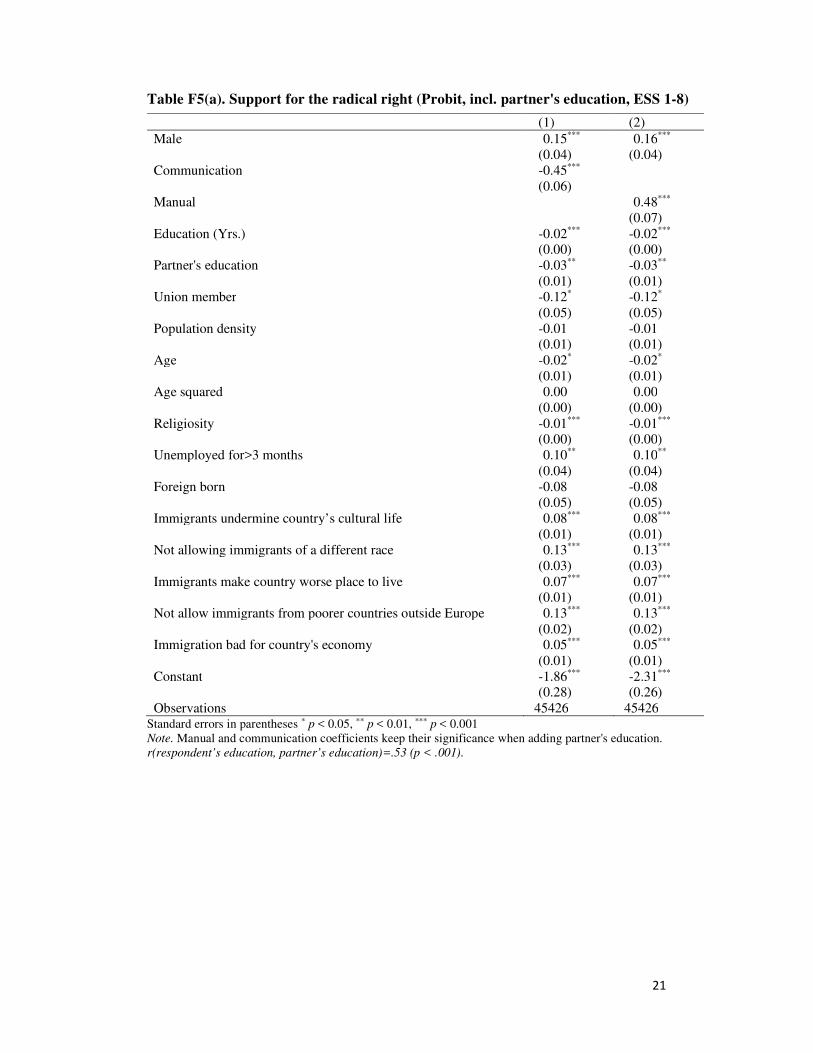
21
Table F5(a). Support for the radical right (Probit, incl. partner's education, ESS 1-8)
(1) (2)
Male 0.15*** 0.16***
(0.04) (0.04)
Communication -0.45***
(0.06)
Manual 0.48***
(0.07)
Education (Yrs.) -0.02*** -0.02***
(0.00) (0.00)
Partner's education -0.03** -0.03**
(0.01) (0.01)
Union member -0.12* -0.12*
(0.05) (0.05)
Population density -0.01 -0.01
(0.01) (0.01)
Age -0.02* -0.02*
(0.01) (0.01)
Age squared 0.00 0.00
(0.00) (0.00)
Religiosity -0.01*** -0.01***
(0.00) (0.00)
Unemployed for>3 months 0.10** 0.10**
(0.04) (0.04)
Foreign born -0.08 -0.08
(0.05) (0.05)
Immigrants undermine country’s cultural life 0.08*** 0.08***
(0.01) (0.01)
Not allowing immigrants of a different race 0.13*** 0.13***
(0.03) (0.03)
Immigrants make country worse place to live 0.07*** 0.07***
(0.01) (0.01)
Not allow immigrants from poorer countries outside Europe 0.13*** 0.13***
(0.02) (0.02)
Immigration bad for country's economy 0.05*** 0.05***
(0.01) (0.01)
Constant -1.86*** -2.31***
(0.28) (0.26)
Observations 45426 45426 Standard errors in parentheses * p < 0.05, ** p < 0.01, *** p < 0.001
Note. Manual and communication coefficients keep their significance when adding partner's education.
r(respondent’s education, partner’s education)=.53 (p < .001).
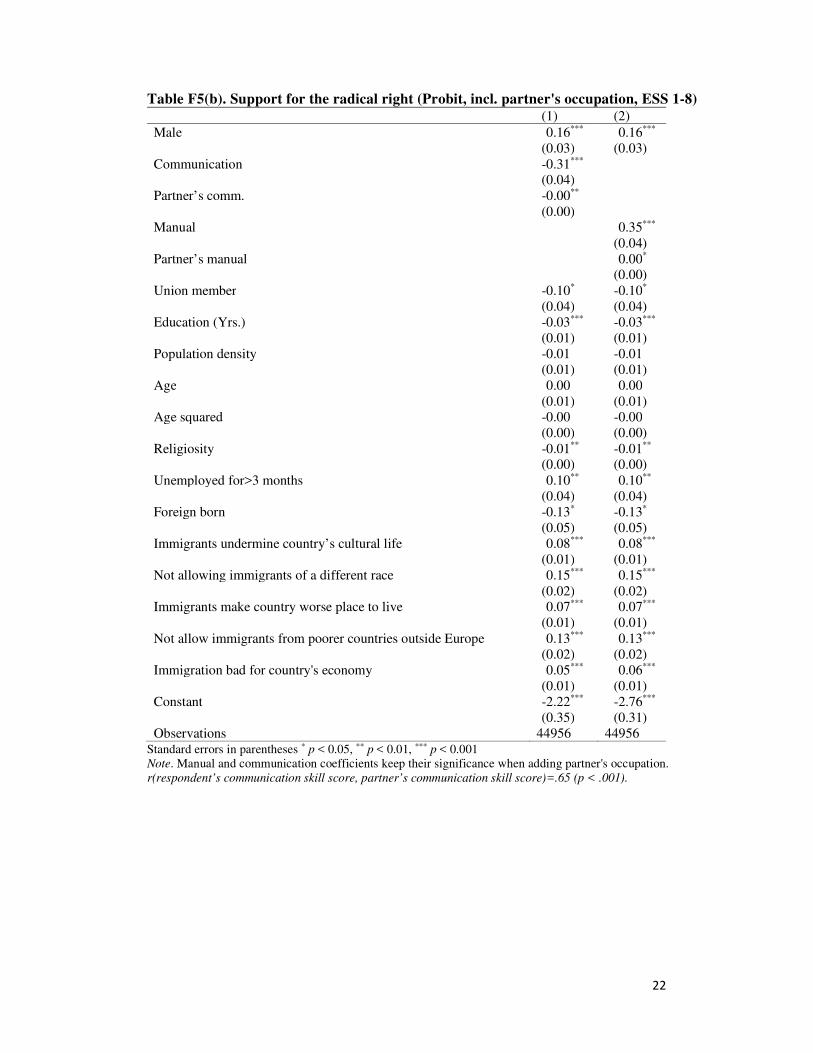
22
Table F5(b). Support for the radical right (Probit, incl. partner's occupation, ESS 1-8)
(1) (2)
Male 0.16*** 0.16***
(0.03) (0.03)
Communication -0.31***
(0.04)
Partner’s comm. -0.00**
(0.00)
Manual 0.35***
(0.04)
Partner’s manual 0.00*
(0.00)
Union member -0.10* -0.10*
(0.04) (0.04)
Education (Yrs.) -0.03*** -0.03***
(0.01) (0.01)
Population density -0.01 -0.01
(0.01) (0.01)
Age 0.00 0.00
(0.01) (0.01)
Age squared -0.00 -0.00
(0.00) (0.00)
Religiosity -0.01** -0.01**
(0.00) (0.00)
Unemployed for>3 months 0.10** 0.10**
(0.04) (0.04)
Foreign born -0.13* -0.13*
(0.05) (0.05)
Immigrants undermine country’s cultural life 0.08*** 0.08***
(0.01) (0.01)
Not allowing immigrants of a different race 0.15*** 0.15***
(0.02) (0.02)
Immigrants make country worse place to live 0.07*** 0.07***
(0.01) (0.01)
Not allow immigrants from poorer countries outside Europe 0.13*** 0.13***
(0.02) (0.02)
Immigration bad for country's economy 0.05*** 0.06***
(0.01) (0.01)
Constant -2.22*** -2.76***
(0.35) (0.31)
Observations 44956 44956 Standard errors in parentheses * p < 0.05, ** p < 0.01, *** p < 0.001
Note. Manual and communication coefficients keep their significance when adding partner's occupation.
r(respondent’s communication skill score, partner’s communication skill score)=.65 (p < .001).
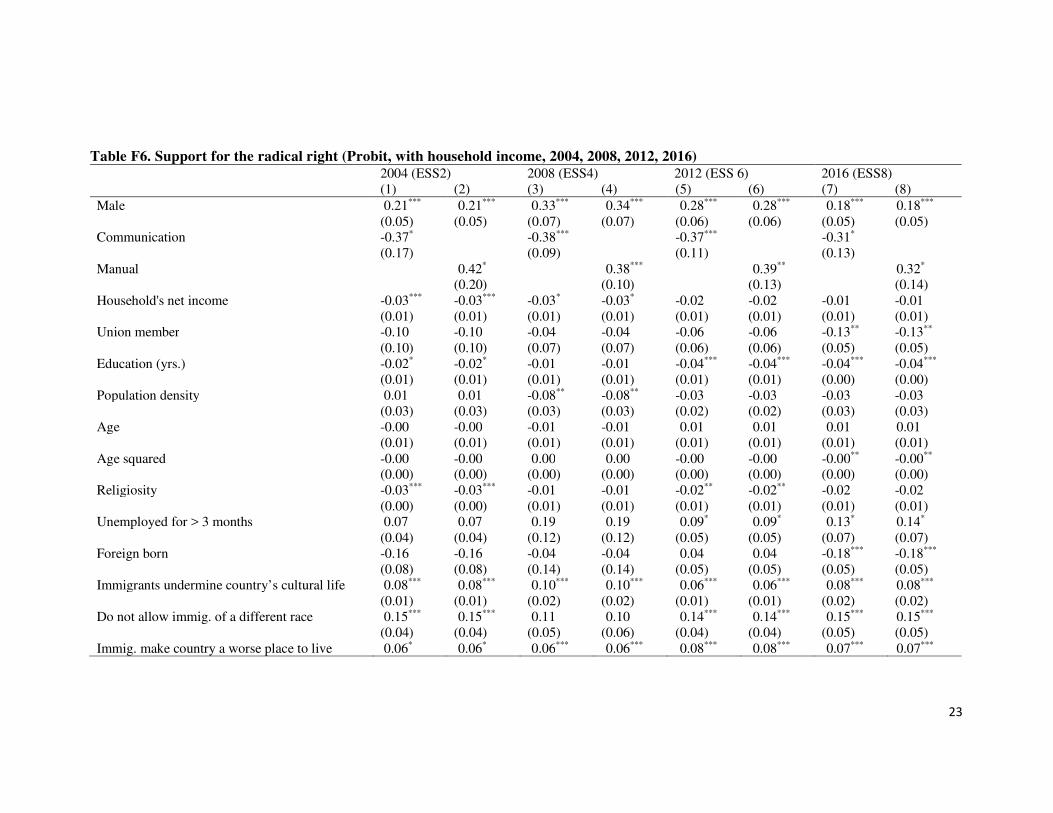
23
Table F6. Support for the radical right (Probit, with household income, 2004, 2008, 2012, 2016)
2004 (ESS2) 2008 (ESS4) 2012 (ESS 6) 2016 (ESS8)
(1) (2) (3) (4) (5) (6) (7) (8)
Male 0.21*** 0.21*** 0.33*** 0.34*** 0.28*** 0.28*** 0.18*** 0.18***
(0.05) (0.05) (0.07) (0.07) (0.06) (0.06) (0.05) (0.05)
Communication -0.37* -0.38*** -0.37*** -0.31*
(0.17) (0.09) (0.11) (0.13)
Manual 0.42* 0.38*** 0.39** 0.32*
(0.20) (0.10) (0.13) (0.14)
Household's net income -0.03*** -0.03*** -0.03* -0.03* -0.02 -0.02 -0.01 -0.01
(0.01) (0.01) (0.01) (0.01) (0.01) (0.01) (0.01) (0.01)
Union member -0.10 -0.10 -0.04 -0.04 -0.06 -0.06 -0.13** -0.13**
(0.10) (0.10) (0.07) (0.07) (0.06) (0.06) (0.05) (0.05)
Education (yrs.) -0.02* -0.02* -0.01 -0.01 -0.04*** -0.04*** -0.04*** -0.04***
(0.01) (0.01) (0.01) (0.01) (0.01) (0.01) (0.00) (0.00)
Population density 0.01 0.01 -0.08** -0.08** -0.03 -0.03 -0.03 -0.03
(0.03) (0.03) (0.03) (0.03) (0.02) (0.02) (0.03) (0.03)
Age -0.00 -0.00 -0.01 -0.01 0.01 0.01 0.01 0.01
(0.01) (0.01) (0.01) (0.01) (0.01) (0.01) (0.01) (0.01)
Age squared -0.00 -0.00 0.00 0.00 -0.00 -0.00 -0.00** -0.00**
(0.00) (0.00) (0.00) (0.00) (0.00) (0.00) (0.00) (0.00)
Religiosity -0.03*** -0.03*** -0.01 -0.01 -0.02** -0.02** -0.02 -0.02
(0.00) (0.00) (0.01) (0.01) (0.01) (0.01) (0.01) (0.01)
Unemployed for > 3 months 0.07 0.07 0.19 0.19 0.09* 0.09* 0.13* 0.14*
(0.04) (0.04) (0.12) (0.12) (0.05) (0.05) (0.07) (0.07)
Foreign born -0.16 -0.16 -0.04 -0.04 0.04 0.04 -0.18*** -0.18***
(0.08) (0.08) (0.14) (0.14) (0.05) (0.05) (0.05) (0.05)
Immigrants undermine country’s cultural life 0.08*** 0.08*** 0.10*** 0.10*** 0.06*** 0.06*** 0.08*** 0.08***
(0.01) (0.01) (0.02) (0.02) (0.01) (0.01) (0.02) (0.02)
Do not allow immig. of a different race 0.15*** 0.15*** 0.11 0.10 0.14*** 0.14*** 0.15*** 0.15***
(0.04) (0.04) (0.05) (0.06) (0.04) (0.04) (0.05) (0.05)
Immig. make country a worse place to live 0.06* 0.06* 0.06*** 0.06*** 0.08*** 0.08*** 0.07*** 0.07***
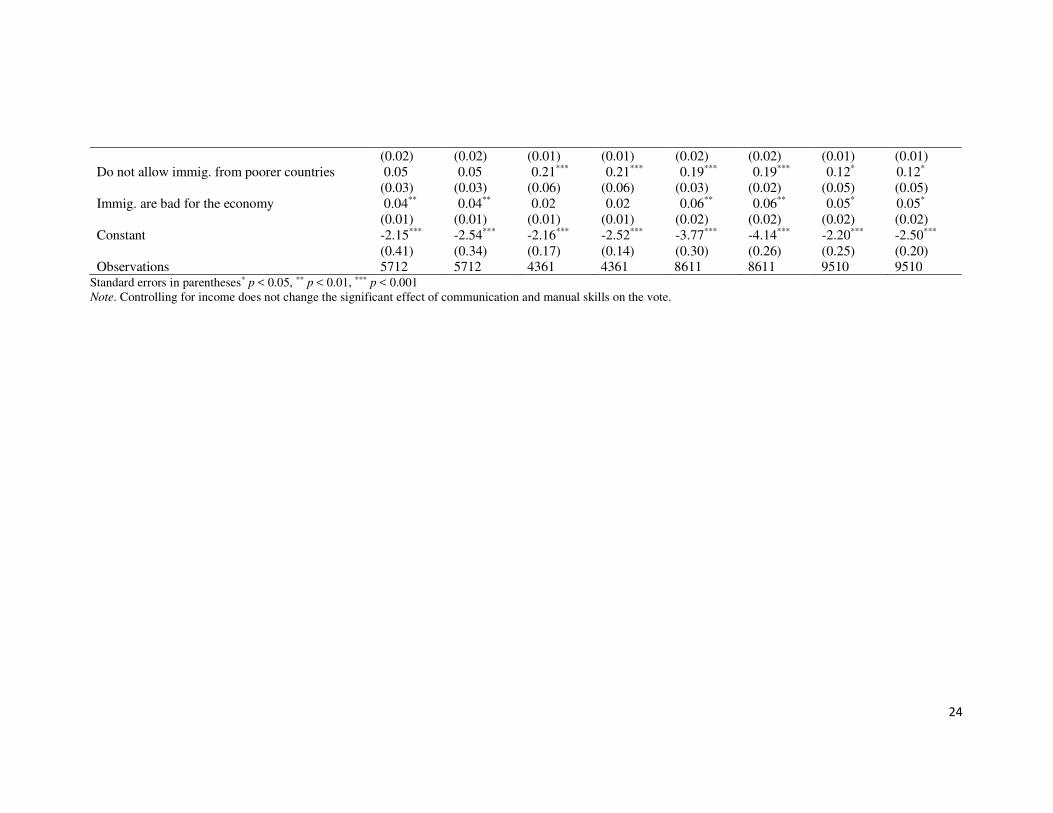
24
(0.02) (0.02) (0.01) (0.01) (0.02) (0.02) (0.01) (0.01)
Do not allow immig. from poorer countries 0.05 0.05 0.21*** 0.21*** 0.19*** 0.19*** 0.12* 0.12*
(0.03) (0.03) (0.06) (0.06) (0.03) (0.02) (0.05) (0.05)
Immig. are bad for the economy 0.04** 0.04** 0.02 0.02 0.06** 0.06** 0.05* 0.05*
(0.01) (0.01) (0.01) (0.01) (0.02) (0.02) (0.02) (0.02)
Constant -2.15*** -2.54*** -2.16*** -2.52*** -3.77*** -4.14*** -2.20*** -2.50***
(0.41) (0.34) (0.17) (0.14) (0.30) (0.26) (0.25) (0.20)
Observations 5712 5712 4361 4361 8611 8611 9510 9510 Standard errors in parentheses* p < 0.05, ** p < 0.01, *** p < 0.001
Note. Controlling for income does not change the significant effect of communication and manual skills on the vote.
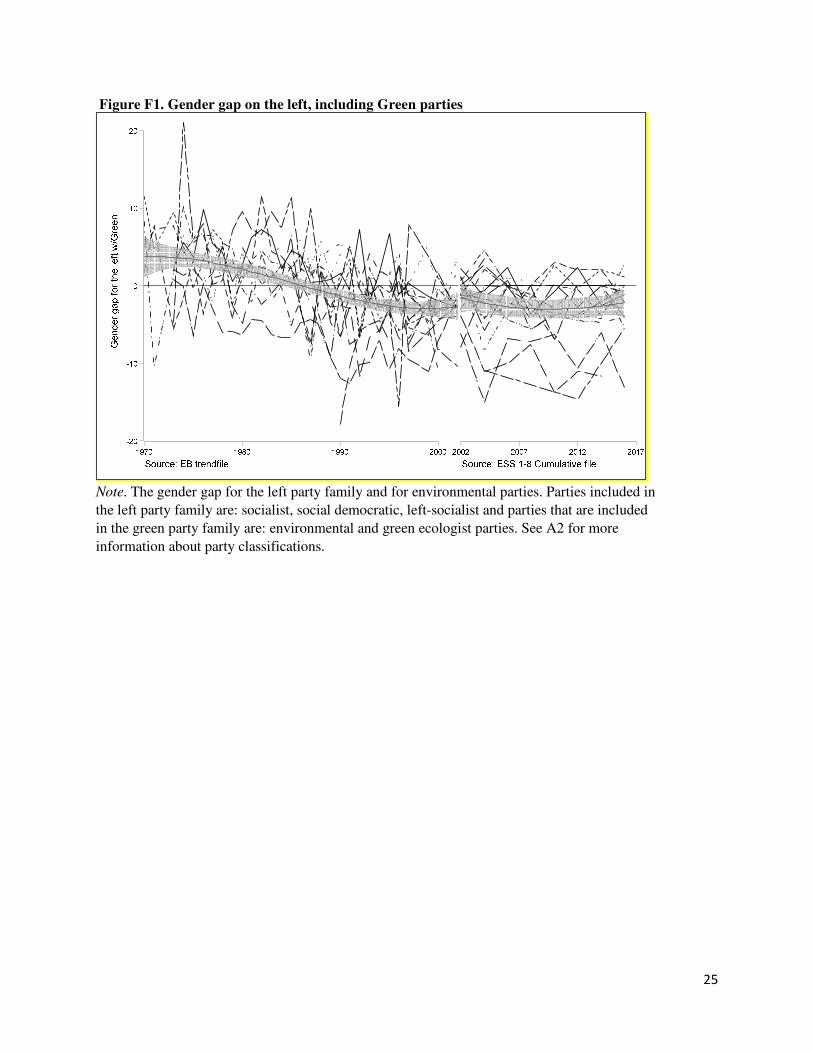
25
Figure F1. Gender gap on the left, including Green parties
Note. The gender gap for the left party family and for environmental parties. Parties included in
the left party family are: socialist, social democratic, left-socialist and parties that are included
in the green party family are: environmental and green ecologist parties. See A2 for more
information about party classifications.
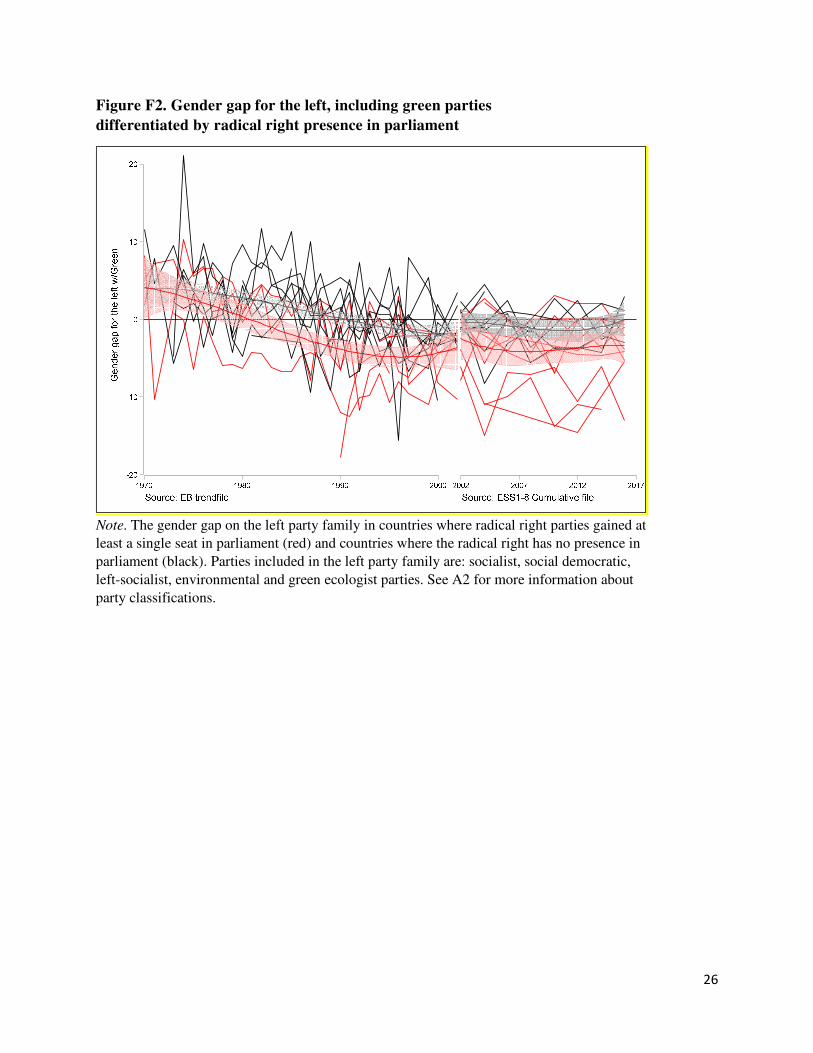
26
Figure F2. Gender gap for the left, including green parties
differentiated by radical right presence in parliament
Note. The gender gap on the left party family in countries where radical right parties gained at
least a single seat in parliament (red) and countries where the radical right has no presence in
parliament (black). Parties included in the left party family are: socialist, social democratic,
left-socialist, environmental and green ecologist parties. See A2 for more information about
party classifications.