Embed Size (px)
Citation preview
The Change in Low Cloud Cover in a Warmed Climate Inferred from
AIRS, MODIS and ERA-Interim
Dennis L. Hartmann, Daniel T. McCoy, Ryan Eastman and Robert Wood
Department of Atmospheric Sciences University of Washington
McCoy, D. T., R. Eastman, D. L. Hartmann, and R. Wood, 2017: The Change in Low Cloud Cover in a Warmed Climate Inferred from AIRS, MODIS, and ERA-Interim. J. Climate, 30, 3609-3620.
Daniel McCoy now at University of Leeds
Nasa Grants NNX14AG26G-Hartmann and NNXBAQ35G-Wood
* Climate sensitivity is the most important policy relevant question in climate science.
* The most uncertain aspect of climate sensitivity is cloud feedback.
* Low Cloud changes have the greatest leverage on cloud feedback in the current generation of climate models.
* IPCC AR5 said cloud feedback is likely positive (66%)
Low Cloud Feedback
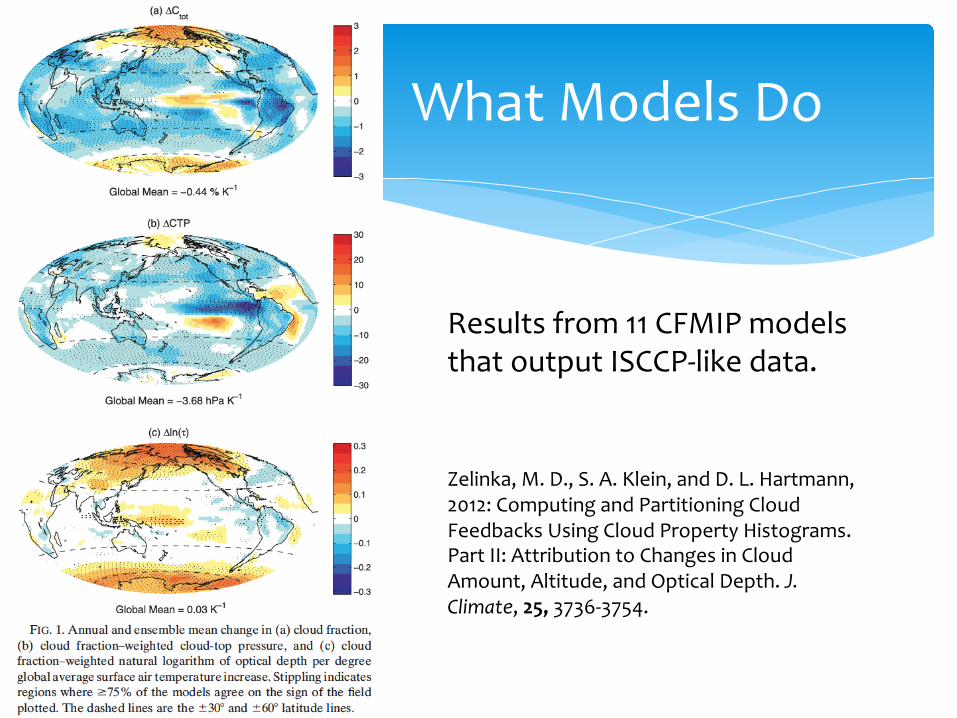
What Models Do
Results from 11 CFMIP models that output ISCCP-like data.
Zelinka, M. D., S. A. Klein, and D. L. Hartmann, 2012: Computing and Partitioning Cloud Feedbacks Using Cloud Property Histograms. Part II: Attribution to Changes in Cloud Amount, Altitude, and Optical Depth. J. Climate, 25, 3736-3754.
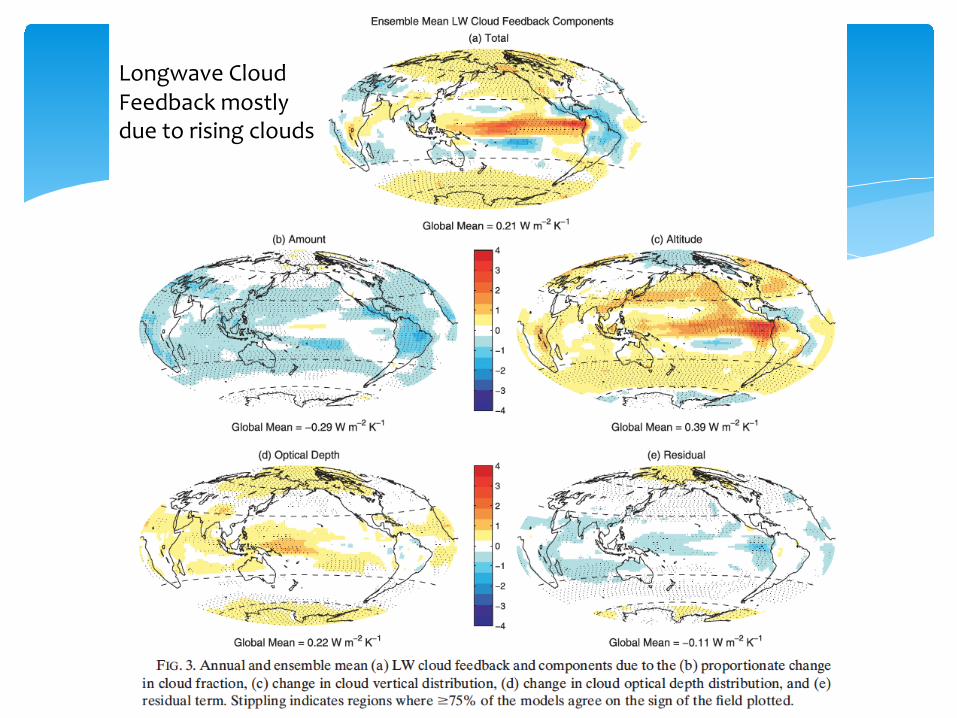
Longwave CloudFeedback mostlydue to rising clouds

Shortwave CloudFeedback due to decreased cloudfraction in lowerlatitudes and increasedoptical depth in highlatitudes.
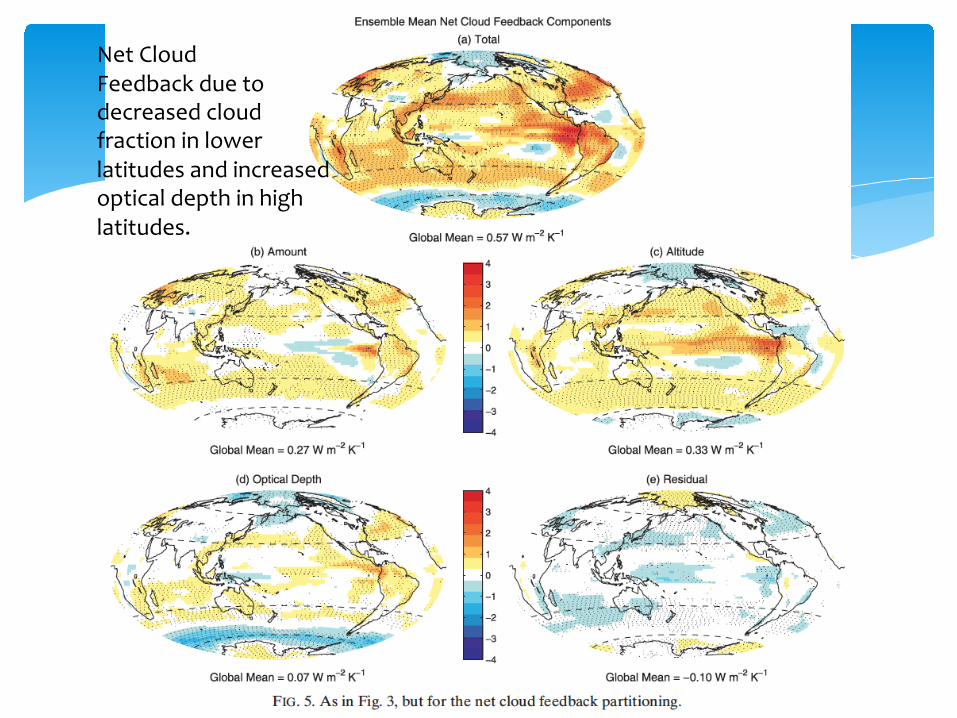
Net CloudFeedback due to decreased cloudfraction in lowerlatitudes and increasedoptical depth in highlatitudes.
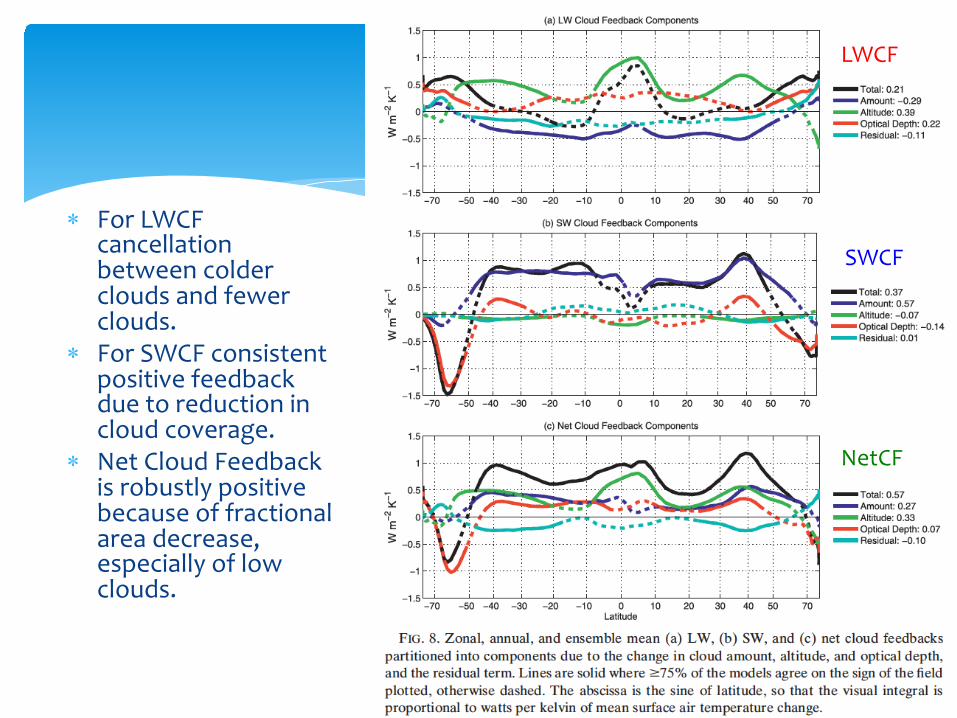
* For LWCF cancellation between colder clouds and fewer clouds.
* For SWCF consistent positive feedback due to reduction in cloud coverage.
* Net Cloud Feedback is robustly positive because of fractional area decrease, especially of low clouds.
SWCF
LWCF
NetCF

* GCMs consistently do it.* We have a robust theory that explains it.* We have observational evidence that supports it.
What gives us confidence?
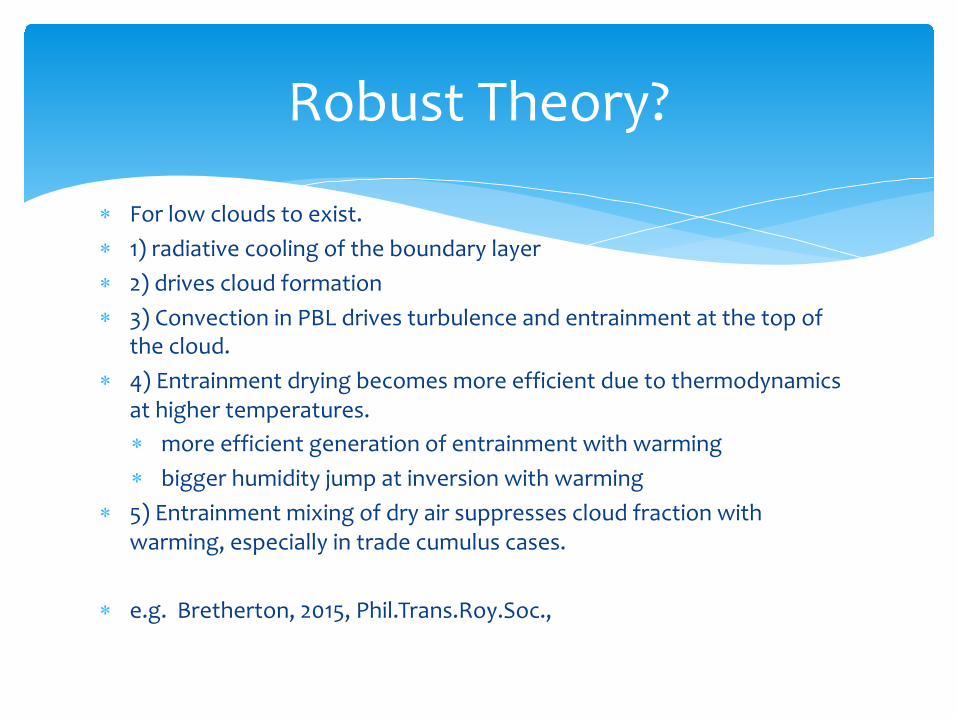
* For low clouds to exist.* 1) radiative cooling of the boundary layer * 2) drives cloud formation* 3) Convection in PBL drives turbulence and entrainment at the top of
the cloud.* 4) Entrainment drying becomes more efficient due to thermodynamics
at higher temperatures. * more efficient generation of entrainment with warming* bigger humidity jump at inversion with warming
* 5) Entrainment mixing of dry air suppresses cloud fraction with warming, especially in trade cumulus cases.
* e.g. Bretherton, 2015, Phil.Trans.Roy.Soc.,
Robust Theory?
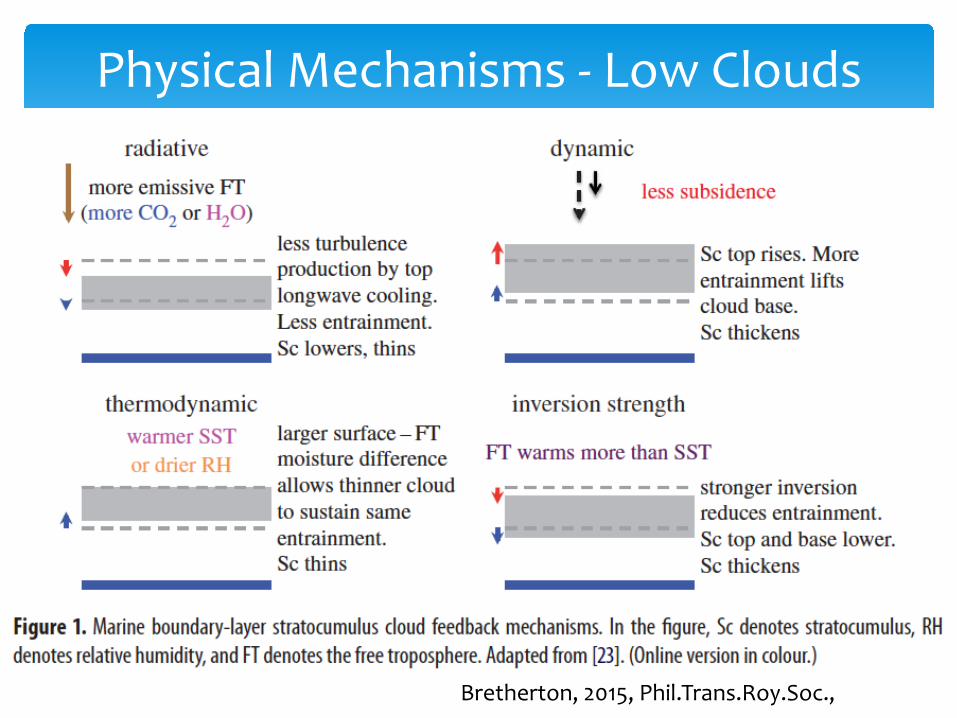
Physical Mechanisms - Low Clouds
Bretherton, 2015, Phil.Trans.Roy.Soc.,
* Natural variations of the current climate can provide relationships between variables that guide our understanding of climate change.
* This can be tested with climate models, for which it seems to work.
* Thus we have some confidence that observed natural variations in the current climate can give us insights in to climate feedbacks.
Observational AnalysisAssumption
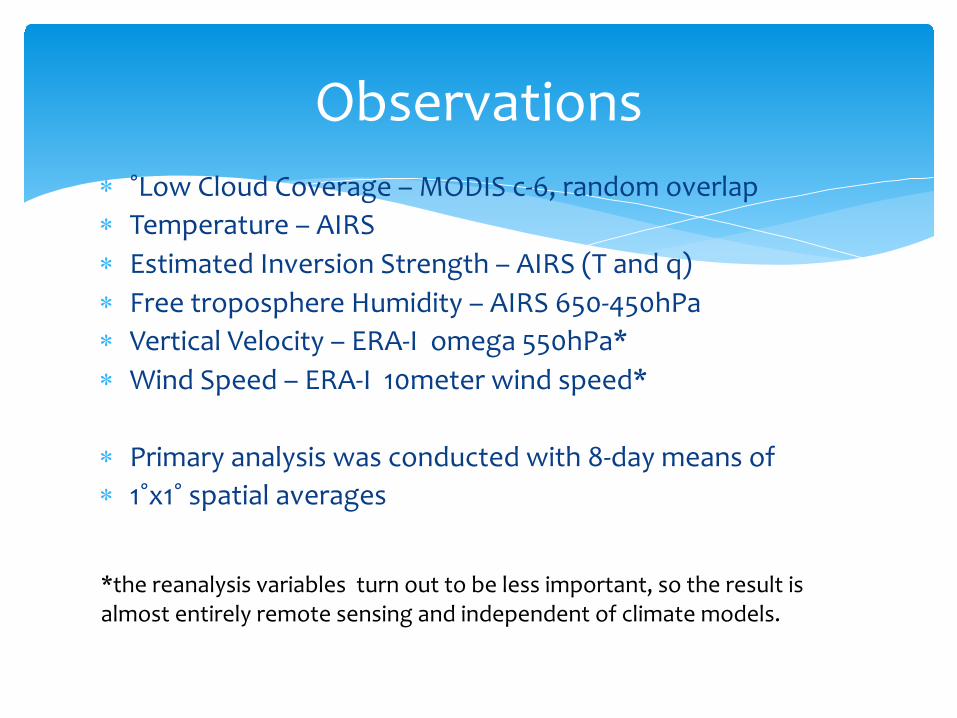
* ˚Low Cloud Coverage – MODIS c-6, random overlap
* Temperature – AIRS
* Estimated Inversion Strength – AIRS (T and q)
* Free troposphere Humidity – AIRS 650-450hPa
* Vertical Velocity – ERA-I omega 550hPa*
* Wind Speed – ERA-I 10meter wind speed*
* Primary analysis was conducted with 8-day means of
* 1˚x1˚ spatial averages
Observations
*the reanalysis variables turn out to be less important, so the result isalmost entirely remote sensing and independent of climate models.
* Partial least squares analysis, to minimize problems with colinearity, e.g. Temperature and EIS
* Separate analysis of different regions* 40˚N-40˚S* 20˚x20˚ subregions* Dynamical subregions – trade cumulus, stratocumulus,
and all
Analysis
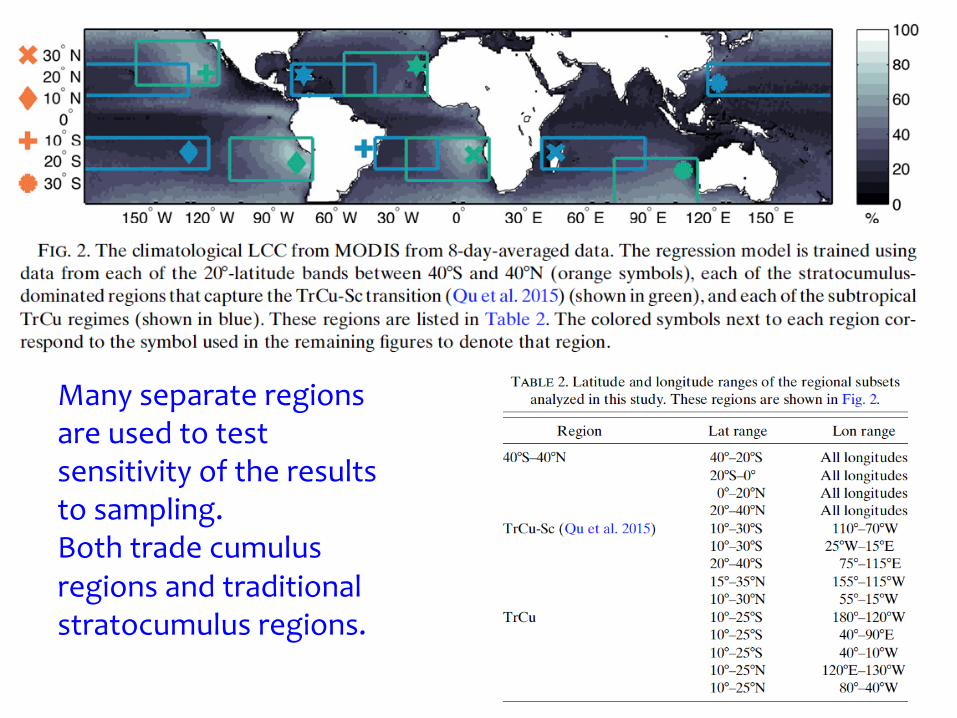
Many separate regions are used to test sensitivity of the results to sampling. Both trade cumulus regions and traditional stratocumulus regions.
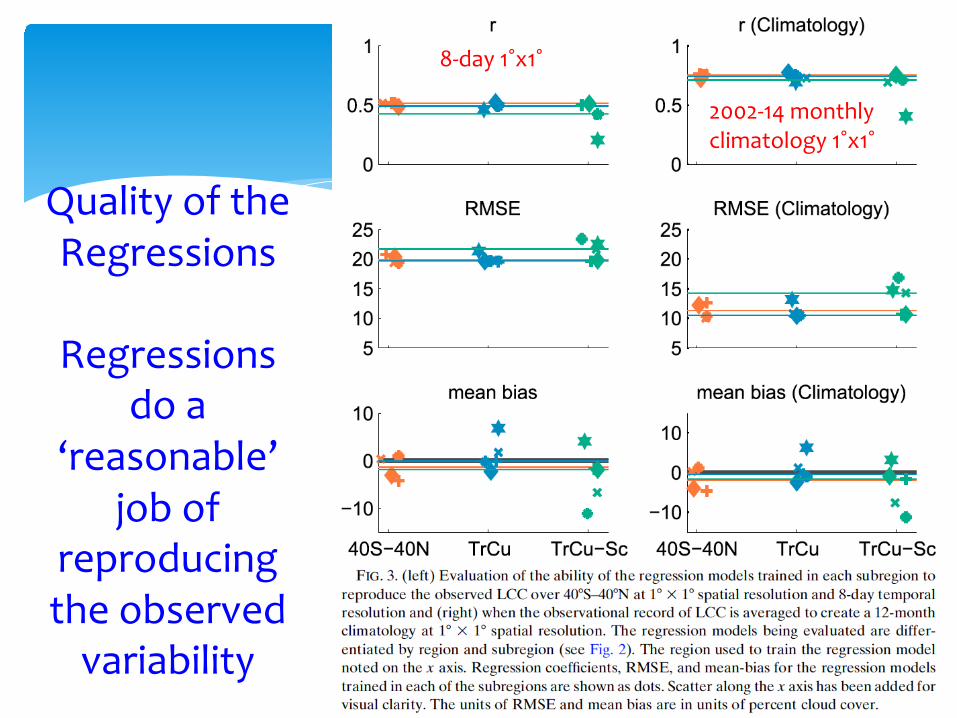
Quality of the Regressions
Regressions do a
‘reasonable’ job of
reproducing the observed
variability
8-day 1˚x1˚
2002-14 monthly climatology 1˚x1˚

Parameter Sensitivity Results
EIS > more Low Cloud Cover
Surface Wind > more LCC
Free Troposphere RH > Less LCC
Omega 550hPa ~ uncertain
SST > Less LCC
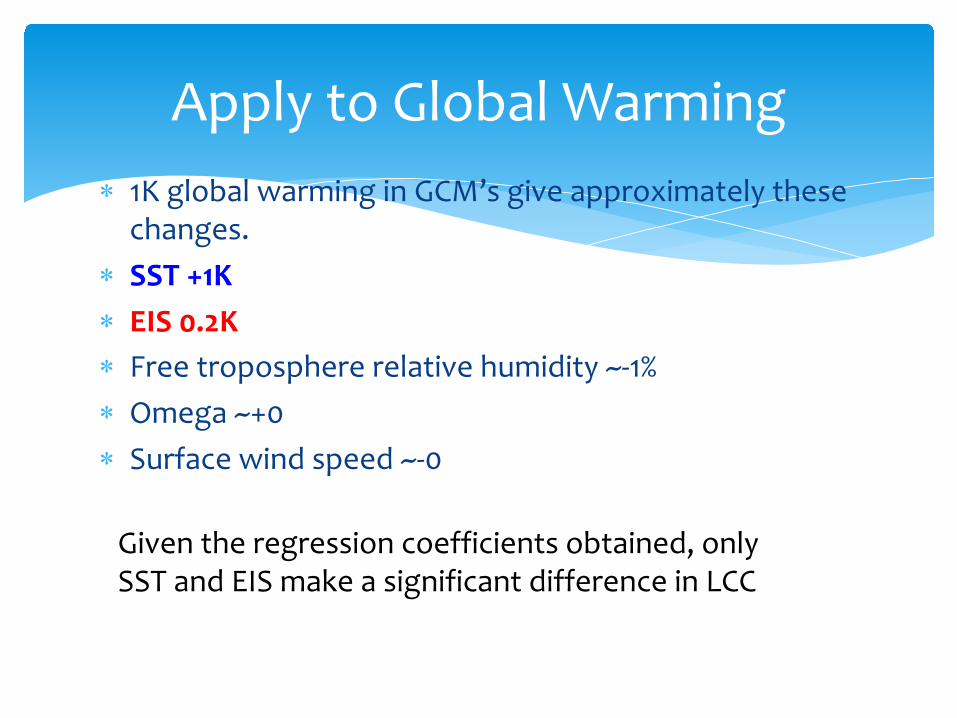
* 1K global warming in GCM’s give approximately these changes.
* SST +1K* EIS 0.2K* Free troposphere relative humidity ~-1%* Omega ~+0* Surface wind speed ~-0
Apply to Global Warming
Given the regression coefficients obtained, only SST and EIS make a significant difference in LCC
Global Warming
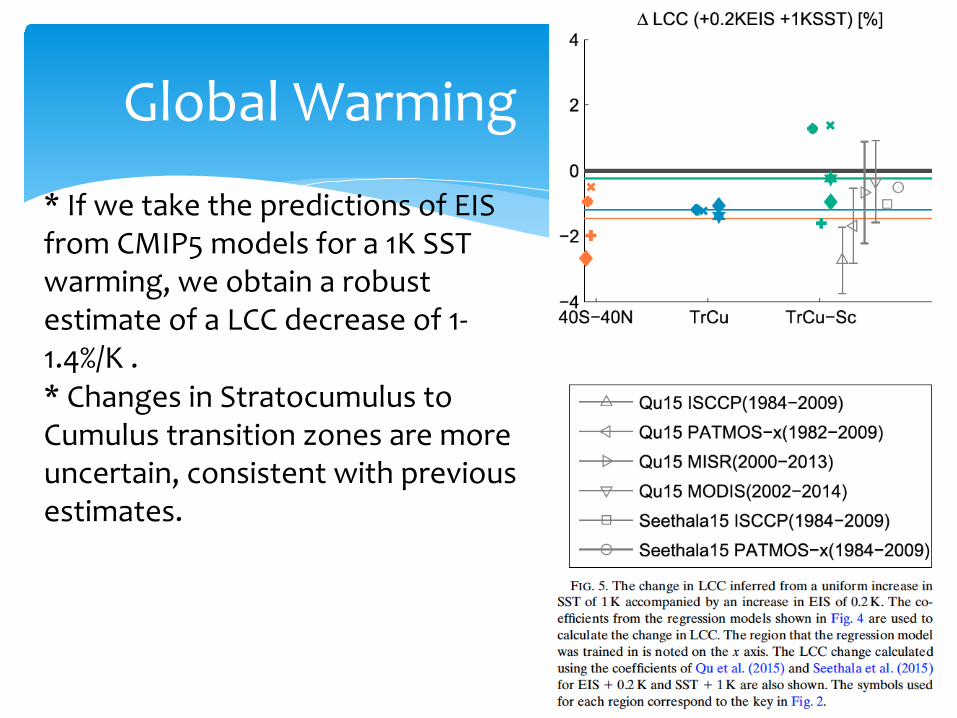
* If we take the predictions of EIS from CMIP5 models for a 1K SST warming, we obtain a robust estimate of a LCC decrease of 1-1.4%/K .* Changes in Stratocumulus to Cumulus transition zones are more uncertain, consistent with previous estimates.
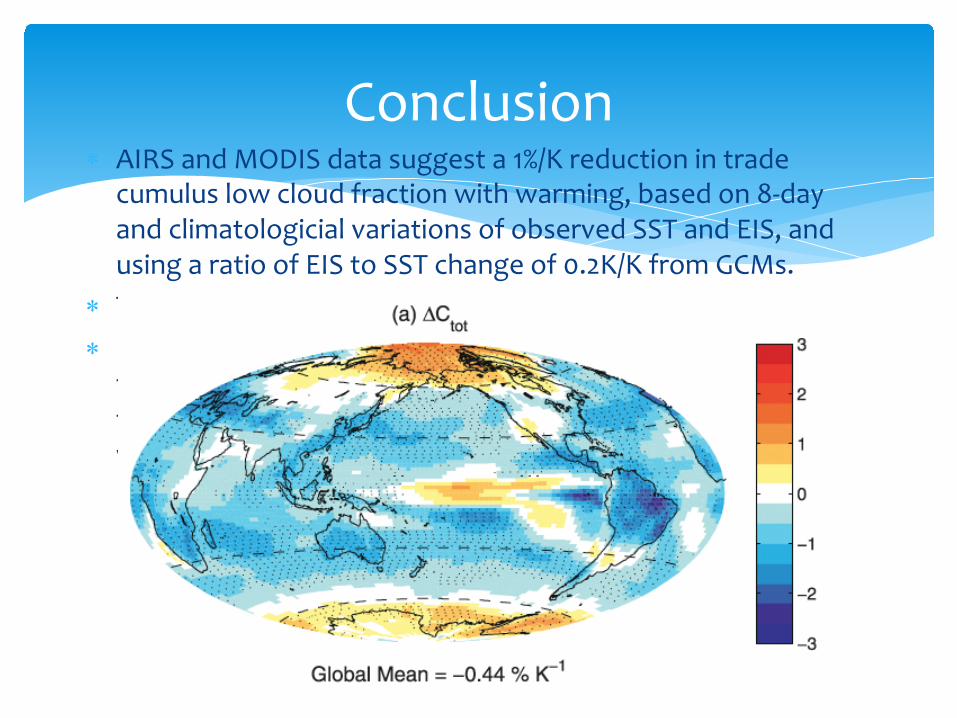
* AIRS and MODIS data suggest a 1%/K reduction in trade cumulus low cloud fraction with warming, based on 8-day and climatologicial variations of observed SST and EIS, and using a ratio of EIS to SST change of 0.2K/K from GCMs.
* This is in the ballpark of what CMIP5 models indicate.
* But, some analysies suggest that the CMIP5 Models have too great a sensitivity to EIS and are producing a slightly too small reduction in trade cumulus, compared to what we would predict from AIRS MODIS regressions.
Conclusion