Embed Size (px)
Citation preview

The Challenges of the U.S. Coal Industry and Lessons for Europe
1
THE CHALLENGES OF THE
U.S. COAL INDUSTRY
AND LESSONS FOR EUROPE
Adriana Popa, Ajith Das Menon, Bartłomiej Walentyński, John Rudoph Young,
Hing Yee Ching, Lia Cairone, Miguel Barros Brito, Wilson Ying Kit Yung
Columbia SIPA | United Nations Economic Commission for Europe | May 2016
The Challenges of the U.S. Coal Industry and Lessons for Europe
2
Acknowledgements
We would like to thank the following experts and faculty members for sharing their insights
with our team in the development of this report. All errors and omissions are solely our own.
Jonathan Chanis, Columbia University
David Lipschitz, CLSA
Sergej Mahnovski, Con Edison
Leslie Palti-Guzman, The Rapidan Group
David Schwimmer, Goldman Sachs
Katherine Spector, Columbia University (Capstone Advisor)
Michael Tran, Royal Bank of Canada
Natasha Udensiva, Columbia University (Capstone Advisor)
School of International and Public Affairs
Columbia University
May 2016

The Challenges of the U.S. Coal Industry and Lessons for Europe
3
EXECUTIVE SUMMARY In recent years, economic, social, and political forces have reduced the global demand for coal,
threatening the historical dominance of coal for power generation, and greatly diminishing the
outlook of the U.S. coal mining sector. The development of U.S. shale gas reserves have brought
about an abundant supply of cheap domestic natural gas, with utilities increasingly turning
away from coal and into natural gas for baseload generation. Renewables also see increasing
cost competitiveness as they move along the experience curve, and its development and use is
strongly supported by the public. Beyond economic woes, the introduction of stringent
environmental regulations which are less favorable against coal have added another dimension
to the coal’s industry troubles. Together, these forces have brought about a structural rather than
cyclical transformation in the coal industry in which traditional coal companies face financiall.
Against this backdrop of The United Nations Economic Council on Europe (UNECE) and their
Committee on Sustainable Energy is committed to ensuring its member countries have the
information necessary to adapt to this shifting market landscape. Through their subdivision, the
Group of Experts on Coal Mine Methane, they work with the energy officials of member states
and their national coal producers to cope with the deteriorating coal outlook. Our project aims
to assist the Group of Experts on Coal Mine Methane in its work to educate decision makers in
its European member states about the economic as well as social impacts of this declining
national coal market, and suggest policy changes that help their national coal producers to avoid
bankruptcy.
To this end, the research team undertook four main tasks. First, the team analyzed the recent
trends in the U.S. coal production and determined that flat electricity demand, falling natural
gas prices, weak demand for U.S. coal exports, and a more challenging regulatory environment
have contributed to the recent decline. The team also examined the U.S. electric utility sector
and how U.S. companies have adjusted to the increased regulation and changes in fuel prices.
The team examined the forces driving coal-to-gas switching, and uncovered geographic location
and market regulations as the main factors that influence utility strategy. Second, the team
performed case studies of U.S. coal companies, and highlighted the trends of financial
restructuring, diversification away from coal, and concentrating operation to boost efficiency,
as the common survival strategies for coal companies. Third, the team studied the effects of coal
mining company bankruptcies on the populations they support, examining the impacts of a
collapsed local economy (lost tax revenue, discharged pension liabilities, and devastating
unemployment), and identifying federal policies that provide support for the coal miner
communities and promote a smoother transition away from coal. Finally, the team considered
the applicability of lessons from the U.S. coal industry for the European context.

The Challenges of the U.S. Coal Industry and Lessons for Europe
4
The research conducted for this report revealed several important trends. U.S. coal production
peaked in 2008 and has been declining since, while electricity demand has flattened since 2010.
Declining costs have enabled natural gas and renewables to displace coal. These market factors
in addition to falling global steel demand and more stringent regulations, have contributed to
the steady fall of U.S. coal prices. At the same time, utilities across the U.S. are decisively
shifting away from coal and towards natural gas and renewables, with the depth and speed of
this shift depending on local regulations and geography. The switch from coal-to-gas presents
its own challenges to the utilities, leading to the fall of both plant lifespans and capacity
factors.
This confluence of coal sector trends, is a main driver of the major bankruptcies recently seen in
the coal mining sector. This report examines how excessive optimism about the coal sector led
to aggressive investment and growth strategies, with major companies taking on massive debt
to finance asset acquisitions. While diversification and low-cost/high-efficiency mining
operations have allowed some coal companies to survive, these surviving companies still face
financial distress. While the case studies in this report highlight the path forward for coal
companies that diversify or streamline themselves, cash flow constraints and investor attitudes
may be a challenge to implementation. The research also suggests that the potential for coal
mine methane, to assist in coal sector diversification, is limited.
This report identifies the threat coal sector bankruptcy and economic woes pose to U.S. coal
mining communities, and suggest new sector job training and the use of severance taxes to create
permanent funds to support those communities. It also examines the increasing similarities
between the U.S. and European energy markets and their views on environmental protection. It
also identifies opportunities to support European economies through increased coal sector
productivity, financial responsibility and energy sector diversification.
This project is significant because it identifies the best and worst practices of the U.S. coal sector
and translates them for use in the European context. Any successful labor policies from the U.S.
could benefit Europe as well. Additionally, the shift from coal to sustainable energy sources has
created a growing renewable energy sector that could provide new jobs while meeting European
emissions targets. It is also important to note that, as coal becomes less significant to domestic
electricity generation, European countries, especially in Eastern Europe, will need to contend
with security concerns resulting from a loss of energy independence. It is the goal of this report
to be beneficial to the United Nations Economic Council for Europe, Committee on Sustainable
Energy, Group of Experts on Coal Mine Methane, in their efforts to learn from the collapse of
the U.S. coal mining sector and apply the lessons learned in helping their member states
smoothly transition their nationalized coal production sector towards more environmentally
sustainable energy policies that align with the broader climate goals of the European
community.

The Challenges of the U.S. Coal Industry and Lessons for Europe
5
Table of Contents Executive Summary ................................................................................................................................. 3
SECTION I U.S. COAL TRENDS ........................................................................................................... 7
1.1 Overview .................................................................................................................................... 8
U.S. coal production has been declining dramatically since its 2008 peak. ............................. 8
Appalachia has been hit the hardest. ............................................................................................ 8
Four broad trends led to the decline in coal production and prices. ..................................... 11
U.S. electricity demand has flattened in recent years. .............................................................. 11
Declining costs have enabled natural gas and renewables to displace coal. ........................ 12
Coal exports continue to be hurt from falling global steel demand. ...................................... 13
The regulatory environment has become increasingly unfavorable towards coal. ............. 14
1.2 Utilities ...................................................................................................................................... 16
On a national level, utilities are decisively shifting away from coal. ..................................... 16
At the regional and local level, coal-to-gas transition is not uniform. ................................... 18
Regardless of regional variations, all utilities face coal-to-gas transition challenges. ......... 20
SECTION II CASE STUDIES ................................................................................................................ 22
2.1 Financial and Operational Restructuring ............................................................................ 23
Coal over-optimism led to poor investment decisions. ............................................................ 24
Case Study: Arch Coal. ................................................................................................................. 25
Case Study: Alpha Natural Resources Inc.................................................................................. 26
Case Study: Peabody Energy ....................................................................................................... 27
Financial restructuring necessitates streamlining operations. ................................................ 28
Bankrupted companies’ shedding of liabilities has led to societal problems. ...................... 29
Some coal companies have reduced exports in an effort to survive. ..................................... 30
2.2 Diversification and Divestment from Coal .......................................................................... 32
Diversification success relies on geographical advantages and good timing. ...................... 32
Case Study: CONSOL Energy ...................................................................................................... 35
Coal mine methane production is not considered a viable investment opportunity. ......... 36
2.3 Focus on Core Profitable Operations.................................................................................... 37
Fiscal conservatism is best, but does not ensure success in today’s troubled coal market. 37

The Challenges of the U.S. Coal Industry and Lessons for Europe
6
Case Study: Alliance Resource Partners ..................................................................................... 37
Case Study: Westmoreland........................................................................................................... 38
SECTION III SOCIETAL IMPACT ...................................................................................................... 40
3.1 Political Influence .................................................................................................................... 41
Coal-mining lobby ris losing political influence. ...................................................................... 41
U.S. public sentiment on coal is divided along party lines and geographic location. ......... 43
3.2 Employment ............................................................................................................................. 45
Bankruptcies and economic woes threaten employment opportunities in coal mining. .... 45
Coal mining job losses can be particularly difficult for communities. ................................... 45
Some counties relying primarily on coal mining. ..................................................................... 46
Job losses in Central Appalachia are higher due to lower productivity and higher costs. . 47
Job losses are less painful in regions that are experiencing the shale gas boom. ................. 50
3.3 Opportunities for the Future ................................................................................................. 51
Invest in new sector job training and incentivize new industry development. ................... 51
Redirect severance taxes back to coal communities and create permanent funds. .............. 52
Federal programs were proposed to support workers, but have not been fully funded. ... 53
Regional efforts are also essential to economic revival. ........................................................... 54
SECTION IV LESSONS FOR EUROPE ............................................................................................... 55
4.1 Overview .................................................................................................................................. 56
U.S and European energy markets are becoming more similar. ............................................ 56
Coal sector in Europe tends to be closely tied with government. .......................................... 58
Coal mining is supported by society and unemployment prevails after mine closures. .... 59
4.2 Lessons for Europe .................................................................................................................. 62
Low productivity is a key challenge plaguing European coal mining. ................................. 62
Conservative investment profiles will help coal companies to remain on the market. ...... 63
European can find opportunities in transition. ......................................................................... 65
Bibliography ........................................................................................................................................... 68
The Challenges of the U.S. Coal Industry and Lessons for Europe
7
SECTION I
U.S. COAL TRENDS
This section provides an overview of developments in the U.S. energy landscape, with a focus on trends most relevant for coal companies. The four main trends driving the decline in coal in the U.S. are flat domestic electricity deman d, low natural gas prices, falling demand for global exports, and stricter environmental regulations. This section also examines the national and regional trends affecting utilities’ fuel mix decisions.
The Challenges of the U.S. Coal Industry and Lessons for Europe
8
1.1 OVERVIEW
U.S. coal production has been declining dramatically since its 2008 peak.
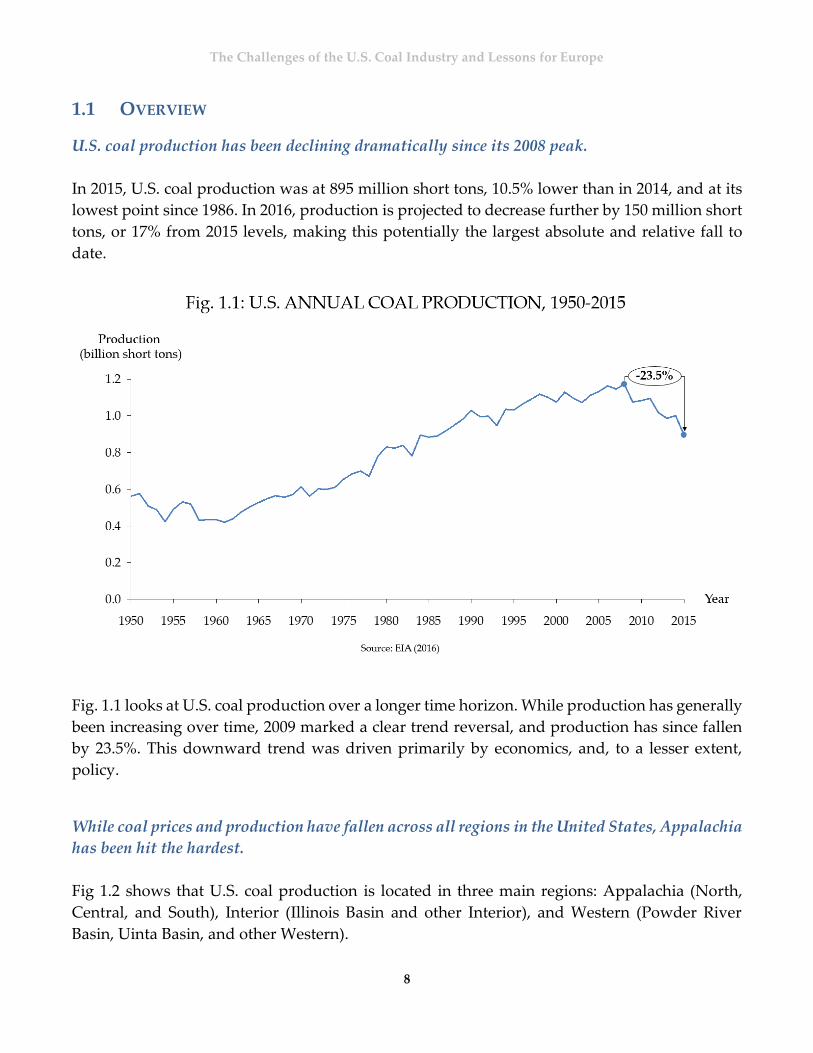
In 2015, U.S. coal production was at 895 million short tons, 10.5% lower than in 2014, and at its
lowest point since 1986. In 2016, production is projected to decrease further by 150 million short
tons, or 17% from 2015 levels, making this potentially the largest absolute and relative fall to
date.
Fig. 1.1 looks at U.S. coal production over a longer time horizon. While production has generally
been increasing over time, 2009 marked a clear trend reversal, and production has since fallen
by 23.5%. This downward trend was driven primarily by economics, and, to a lesser extent,
policy.
While coal prices and production have fallen across all regions in the United States, Appalachia
has been hit the hardest.
Fig 1.2 shows that U.S. coal production is located in three main regions: Appalachia (North,
Central, and South), Interior (Illinois Basin and other Interior), and Western (Powder River
Basin, Uinta Basin, and other Western).

The Challenges of the U.S. Coal Industry and Lessons for Europe
9
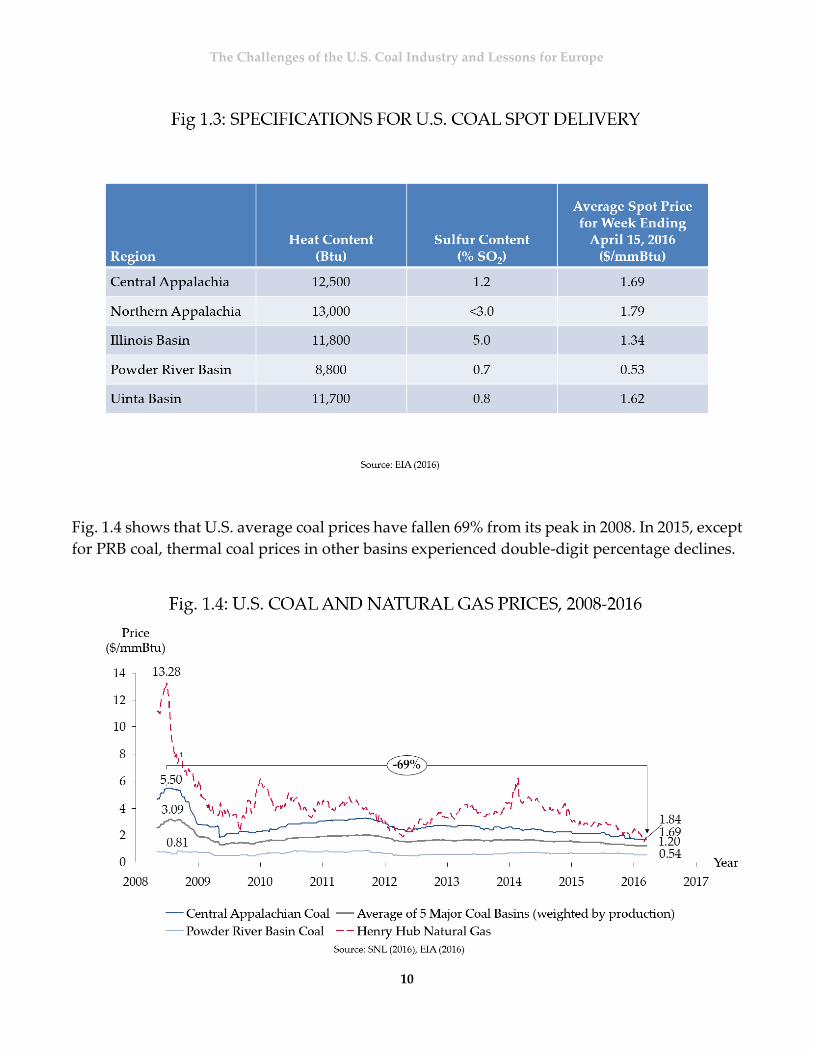
Fig. 1.3 lists the specifications and prices for coal spot markets in the five major U.S. coal basins.
This report makes reference to two main types of coal: Central Appalachian (CAPP) coal, which
is primarily bituminous with higher heating value but contains more sulfur content; and Powder
River Basin (PRB) coal, which is subbituminous with lower heating value and lower sulfur
content. Most coal produced in the United States are steam or thermal coal, which is used to
generate heat and electricity, but a small portion of Appalachian production goes to
metallurgical or coking coal, which is used to make steel.
The Challenges of the U.S. Coal Industry and Lessons for Europe
10
Fig. 1.4 shows that U.S. average coal prices have fallen 69% from its peak in 2008. In 2015, except
for PRB coal, thermal coal prices in other basins experienced double-digit percentage declines.

The Challenges of the U.S. Coal Industry and Lessons for Europe
11
While all regions have experienced a decline in coal production and prices, Central Appalachia,
home to many coal mining communities, has seen the greatest fall. Because of geological
reasons, Appalachia has many mines that are small in size, whereas Powder River Basin has
fewer mines but they are larger in scale and use surface mining. As a result, productivity in
Powder River Basin is much higher, making PRB coal far cheaper than Appalachian coal. In
addition, air pollution legislation and the associated scrubber costs have also worked to favor
greater demand for PRB coal, which has lower sulfur content.
Across the United States, four broad trends led to the decline in coal production and prices.
The four broad trends are: flattening electricity demand, falling natural gas prices, weaker
demand for coal exports, and an increasingly challenging regulatory environment.
U.S. electricity demand has flattened in recent years, resulting in lower derived demand for coal.
In recent years there has been a clear decoupling between economic growth and electricity
demand in the United States. While the U.S. economy has grown by over 2.2% annually since
2008, the growth in net electricity demand has averaged only 1.3% during this period.
Fig. 1.5 shows that while U.S. annual electricity consumption grew by 1.9% between 1990 and
2007, there has been zero growth since then. This is primarily due to a greater uptake in energy
efficiency, demand response, and distributed generation. Naturally, with lower electricity
demand, the derived demand for coal for electricity generation has also decreased over time.

The Challenges of the U.S. Coal Industry and Lessons for Europe
12
Declining costs have enabled natural gas and renewables to displace coal.
The U.S. shale boom has allowed domestic natural gas prices to fall steadily since 2008. Fig. 1.4
shows that Henry Hub spot prices declined from a high of $13.28/mmBtu in 2008 and to around
$2.00/mmBtu in May 2016. Fig 1.6 compares different fuel sources on a levelized cost of
electricity (LCOE) basis. Natural gas LCOE has fallen from $73-112/MWh in 2008 to $52-78/MWh
in 2015, which is below the $65/MWh price floor for coal in 2015 (1).

The Challenges of the U.S. Coal Industry and Lessons for Europe
13
With the gap between coal and natural gas prices narrowing, utilities are taking advantage of
low gas prices and using more natural gas to generate electricity. In 2015, electricity generated
by natural gas increased by 18%, and electricity from coal fell by 12%.
At the same time, costs for deploying renewables have also fallen as a result of technological
advances and supply chain efficiency. Renewables are also becoming competitive with coal on
a levelized cost of electricity (LCOE) basis, and some forms of renewable power are cheaper than
coal, even without federal subsidies. Nevertheless, because of their intermittent nature,
renewables alone cannot replace baseload power generation from coal.
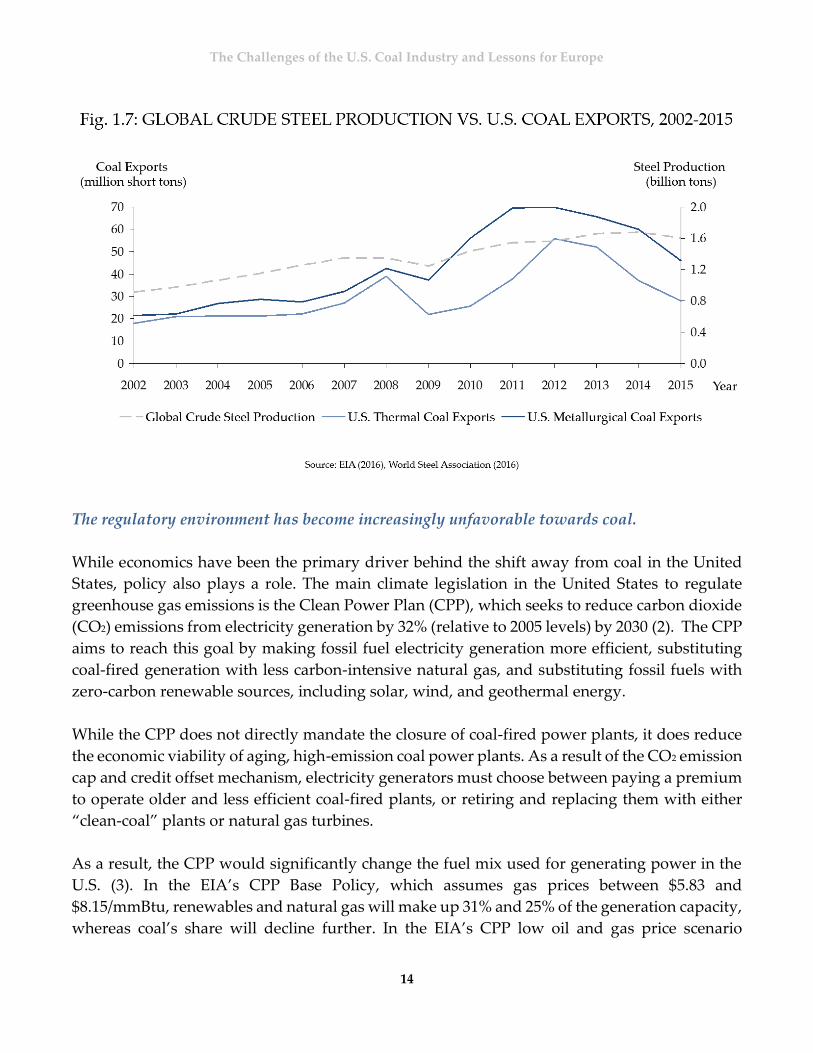
Coal exports continue to be hurt from falling global steel demand.
Although global steel production grew fairly strongly in the past decade, recent years have seen
demand flatten. U.S. coal companies that previously relied on exports to offset slowing U.S. steel
production now have fewer avenues to sell their metallurgical coal. Similarly, U.S. exports of
thermal coal have also become less viable due to lower global demand and prices.
Fig 1.7 shows that U.S. coal exports started falling around five years ago. Lower mining costs,
cheaper transportation costs, and favorable exchange rates are expected to continue to provide
an advantage to mines in other major coal-exporting countries compared to U.S. producers.
The Challenges of the U.S. Coal Industry and Lessons for Europe
14
The regulatory environment has become increasingly unfavorable towards coal.
While economics have been the primary driver behind the shift away from coal in the United
States, policy also plays a role. The main climate legislation in the United States to regulate
greenhouse gas emissions is the Clean Power Plan (CPP), which seeks to reduce carbon dioxide
(CO2) emissions from electricity generation by 32% (relative to 2005 levels) by 2030 (2). The CPP
aims to reach this goal by making fossil fuel electricity generation more efficient, substituting
coal-fired generation with less carbon-intensive natural gas, and substituting fossil fuels with
zero-carbon renewable sources, including solar, wind, and geothermal energy.
While the CPP does not directly mandate the closure of coal-fired power plants, it does reduce
the economic viability of aging, high-emission coal power plants. As a result of the CO2 emission
cap and credit offset mechanism, electricity generators must choose between paying a premium
to operate older and less efficient coal-fired plants, or retiring and replacing them with either
“clean-coal” plants or natural gas turbines.
As a result, the CPP would significantly change the fuel mix used for generating power in the
U.S. (3). In the EIA’s CPP Base Policy, which assumes gas prices between $5.83 and
$8.15/mmBtu, renewables and natural gas will make up 31% and 25% of the generation capacity,
whereas coal’s share will decline further. In the EIA’s CPP low oil and gas price scenario

The Challenges of the U.S. Coal Industry and Lessons for Europe
15
suggests, as shown in the chart below, even in a low gas price environment (less than
$5/mmBtu), the CPP emissions cap will cause more coal plants to be retired and replaced by a
mixture of renewables and natural gas generation.
Although the CPP is facing a stay1 by the U.S. Supreme Court at the time of this report, it has
already influenced utilities’ capacity addition plans today as the decisions they make today
could incur huge compliance costs for them in the future in the event that the CPP is upheld.
1 A stay is an act of temporarily stopping a judicial proceeding through the order of a court.

The Challenges of the U.S. Coal Industry and Lessons for Europe
16
1.2 UTILITIES
Across the United States, utilities are decisively shifting away from coal for power generation.
Coal-fired plants have been the backbone of U.S. power generation for more than a century, but
its dominance is waning. From Fig. 1.9, coal made up 55.6% of U.S. generation capacity in 1985,
but its share has fallen to just 33.3% in 2015. It will remain a significant source of power
generation in the future—coal is expected to account for about one quarter of the country's
generating capacity in 2030—but natural gas and renewables will account for an increasing
share of the nation's fuel mix (4).
Following the U.S. shale gas boom, cheaper natural gas supply has allowed the share of natural
gas in U.S. electricity generation to triple within 30 years to 32.8% in 2015. For the first time,
natural gas generation surpassed coal generation in 2015, but only for a few months.
The EIA projects that in 2016, natural gas generation will surpass coal generation on an annual
basis for the first time. Aside from natural gas generation, utilities have also deployed greater
renewable generation in their fuel mix, following the declining costs of solar, wind, and other
renewable sources.

The Challenges of the U.S. Coal Industry and Lessons for Europe
17
Not only is coal’s relative share within utilities’ fuel mix being reduced, its absolute level of
generation has also declined dramatically since its peak in 2007. Utilities generated 3.02 million
gigawatt-hours (GWh) of electricity from coal in 2007; in 2015, this fell to 1.36 million GWh. With
distributed generation, efficiency measures, and demand response, utilities that had
traditionally experienced strong electricity demand growth are now seeing flattening electricity
demand.
At the same time, most of the existing U.S. coal fleet is very old. The average age of a coal plant
operating in the United States is 45.2 years. With more than half of the entire U.S. coal generation
capacity built at least 40 years ago, it is no longer a question of whether coal plants will be retired,
but when they will be retired. Utilities are, on the whole, retiring their existing coal plants at an
earlier age.
Fig 1.10 shows that the average age of coal plants at retirement in the U.S. has dropped from 73
years in 1993 to 54 years in 2014. Thirty-six GW of coal capacity, or 10.9% of the U.S.’ existing
coal capacity, will be retired between 2015 and 2023. Between 2015 and 2030, only 2 GW of the
109,391 GW of planned capacity additions will be from coal.

The Challenges of the U.S. Coal Industry and Lessons for Europe
18
At the regional and local level, coal-to-gas transition is not uniform and depends largely on
geography, the state of market regulation, and the transmission and interconnection networks.
While many people are aware that utilities, as a whole, are making this coal-to-gas transition at
the national level, the story at the local and regional levels is much more varied. Specifically, the
strategies and approaches by individual utilities differ based on their geographic reach,
regulatory environment in their respective markets, and access to transmission and
interconnection networks.
First, geographic regions shape utilities’ fuel mix strategy and choices. Historically, utilities
owned generation assets, which were used to service the electricity load in their surrounding
areas. Naturally, utilities in areas with higher coal availability generate more of their electricity
from coal. Conversely, utilities which are closer to shale gas plays are able to switch more easily
to natural gas.
Second, utilities’ fuel mix strategy and choices are also shaped by the market structure of the
states they operate in. In the U.S. energy markets, deregulation in the 1970s started classifying
states into regulated or deregulated utility markets. Regulated markets generally feature
vertically integrated utilities that own or control the entire flow of electricity from generation to
the customer’s meter.

The Challenges of the U.S. Coal Industry and Lessons for Europe
19
In deregulated markets, utilities have divested from owning power generation assets, and are
responsible for only the transmission and distribution of electricity to the customer. Deregulated
utilities typically bid into the power market, allowing for much more competition in the power
generation sector. In states with deregulated and competitive electricity markets, coal’s low
marginal costs enable energy producers to place lower bids in the power markets, resulting in a
tendency for a greater proportion of coal generation in such deregulated markets.
In regulated markets, however, utilities are able to recover from ratepayers their costs of
investing in new power plants, mostly gas-fired and renewable, resulting in lower use of coal in
their generation mix. Consider the case of American Electric Power (AEP), one of the largest U.S.
utilities, which operates in eleven states, nine of which are regulated markets, and the remaining
two competitive markets. Coal makes up 73.9% of AEP’s generation capacity in competitive
markets, compared to 46.3% in regulated markets. This trend does not necessarily indicate that
competitive markets will continue to see a dominance of coal, considering the many other
influencing factors such as emissions reduction policies and low natural gas prices.
Third, utilities’ fuel mix strategy and choices also depend on their scale. Utilities that operate on
a larger scale across states have greater flexibility to purchase generation assets in regions with
cheaper fuel sources or with more favorable regulatory environments.
Ownership of, or access to, transmission and interconnection networks also influence utilities’
fuel mix strategy. For instance, utilities operating in the U.S. West Coast have less flexibility to
change their fuel mix in response to the domestic shale gas boom, as the Western Interconnection
is not linked to the Eastern Interconnection.
Although clean coal technology is one strategy that utilities can deploy to comply with the Clean
Power Plan, few utilities have adopted the technology. For instance, only five of the 1,145 coal
plants in the U.S. are integrated gasification combined cycle (IGCC) plants.

The Challenges of the U.S. Coal Industry and Lessons for Europe
20
Regardless of regional variations, all utilities face some challenges in pursuing a coal-to-gas
transition.
The transformation of the U.S. power market is creating new challenges for utilities. Specifically,
the shortage of natural gas storage sites, inadequate pipeline infrastructure, and long-term
contracts with coal providers pose persistent challenges. Utilities must cope with these
challenges and balance cost, reliability, environmental, and social considerations in determining
their fuel mix strategy.
Utilities switching to natural gas may find it prohibitively expensive to access additional natural
gas in spot markets when actual electricity demand exceeds expectations. Few gas storage sites
exist, and the high pressurization and liquefaction costs from accessing stored natural gas make
this option less attractive. In contrast, coal storage facilities are more widely available, and
utilities can easily tap their coal reserves during periods of higher demand. As a result, natural
gas has historically experienced greater price volatility compared to coal. Utilities have to
consider the trade-offs between cost volatility and the ability to draw from storage and reserves.
The inadequacy of the current domestic pipeline infrastructure is another impediment to full
coal-to-gas transition in the United States. (5). Fig 1.12 shows that utilities located in the West
Coast remain geographically isolated from the extensive transmission line and pipeline network
linking the Eastern part of the country.

The Challenges of the U.S. Coal Industry and Lessons for Europe
21
With increasing use of natural gas for baseload generation, coal plants that are traditionally
baseload plants are now being run as load-following plants to serve intermediate load. This new
mode of operation involves more frequent ramping up and down of the coal plants, and in doing
so, may shorten the effective operating life of the coal plants that were designed to run
continuously rather than intermittently (6). As a result, as seen in Fig. 1.13, coal capacity factors
have fallen from 64.6% in 2001 to 55.4% in 2014.
Finally, many utilities are still contractually bound to their long-term take-or-pay agreements
with coal suppliers, limiting conversion options for coal-fired plants in the short term (7). 93%
of the coal consumed for electricity generation in the United States in 2011 was purchased via
long‐term contracts instead of spot markets. Nevertheless, utilities are currently renegotiating
their coal contracts, using the lower natural gas environment as leverage.
The key takeaway from Section 1 is that industry and utility macro trends greatly impact the
operations and responses of coal companies. Coal mining operations with low costs and
favorable locations will likely survive the downturn, and will be well-positioned when the
market re-balances (8). Section 2 explores the various trends that coal companies have followed
in the face of this industry decline.

The Challenges of the U.S. Coal Industry and Lessons for Europe
22
SECTION II
CASE STUDIES
How are U.S. coal producers responding to the changing economic and regulatory energy landscape? We have identified three main trends in coal producers’ responses : 1) financial restructuring, 2) diversification away from coal, and 3) a focus on core profitable operations. It is important to note that these responses are not mutually exclusive, and can be pursued simultaneously. Company case studies are provided to demonstrate these trends.

The Challenges of the U.S. Coal Industry and Lessons for Europe
23
2.1 FINANCIAL AND OPERATIONAL RESTRUCTURING
The first trend is that an overwhelming proportion of U.S. coal companies have had to file for
bankruptcy in the past two years. Since 2015, some of the largest U.S. coal competitors such as
Arch Coal Inc., Alpha Natural Resources, and Peabody Inc. have filed for protection under the
U.S. Chapter 11 bankruptcy code. Frequently referred to as “reorganization bankruptcy,”
Chapter 11 bankruptcy allows a debtor to propose a plan of reorganization while keeping its
business alive in order to repay its lenders over time. Unable to service their debt and left with
few other options, these companies are currently in the process of negotiating with their lenders,
in hopes of emerging from bankruptcy in a better financial position.
Fig. 2.1 highlights the major coal company bankruptcies that have occurred recently, against the
backdrop of falling coal prices.2 The circles represent the size of the company at the time of its
bankruptcy, based on coal production numbers. It is important to note that the chart does not
provide an exhaustive list of bankruptcies over time, as production numbers were not available
for all companies. However, a striking observation is that three of the largest U.S. coal companies
have all filed for Chapter 11 bankruptcy within the past year as coal prices dropped to an all-
time low.
2 Fig 2.1 contains two circles for Patriot Coal as it filed for bankruptcy twice.
The Challenges of the U.S. Coal Industry and Lessons for Europe
24
Coal over-optimism led to poor investment decisions.
There has been some debate as to whether the current industry shakeout is the result of
structural issues or is merely a cyclical phenomenon, as coal prices have also fluctuated in the
past. Many factors contribute to coal’s decline, but our analysis shows that the current wave of
bankruptcies is more likely the result of structural issues. In the case of many companies,
bankruptcies have been the result of companies thinking that there were good times ahead when
in fact the industry was about to undergo a structural decline.
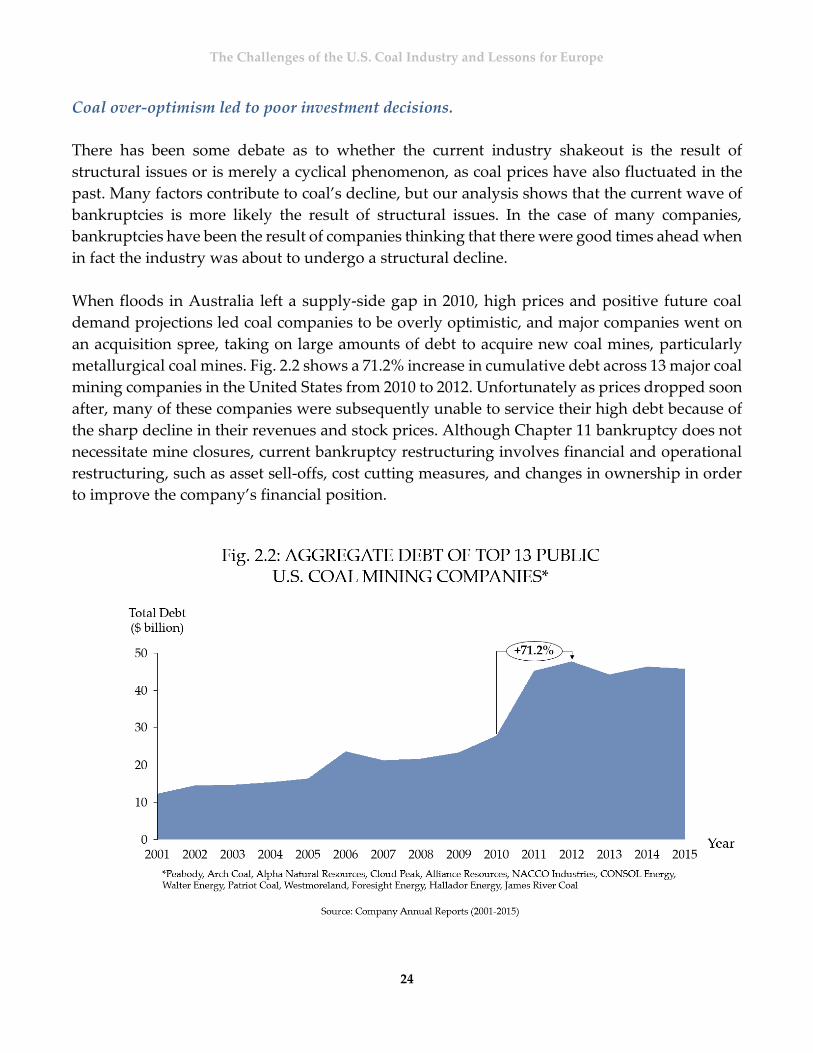
When floods in Australia left a supply-side gap in 2010, high prices and positive future coal
demand projections led coal companies to be overly optimistic, and major companies went on
an acquisition spree, taking on large amounts of debt to acquire new coal mines, particularly
metallurgical coal mines. Fig. 2.2 shows a 71.2% increase in cumulative debt across 13 major coal
mining companies in the United States from 2010 to 2012. Unfortunately as prices dropped soon
after, many of these companies were subsequently unable to service their high debt because of
the sharp decline in their revenues and stock prices. Although Chapter 11 bankruptcy does not
necessitate mine closures, current bankruptcy restructuring involves financial and operational
restructuring, such as asset sell-offs, cost cutting measures, and changes in ownership in order
to improve the company’s financial position.

The Challenges of the U.S. Coal Industry and Lessons for Europe
25
Case Study: Arch Coal
One example of a company that made the wrong decision to increase investments amidst the
structural decline is Arch Coal. In 2010, Arch Coal sold 162.8 million short tons of coal at an
average price of $19.58. Eighty-one percent of this total tonnage was shipped from the Powder
River Basin, and metallurgical coal accounted for only 3.4% of total shipments. Although debt
was still relatively high at $1.5 billion, the company generated ample cash to keep operations
manageable (9).
From 2010 to 2011, the company moved to double its assets, increasing its debt leverage nearly
four times over. Its acquisition of International Coal Group for $3.4 billion in June 2011, was
funded via fresh equity of $1.3 billion and an additional debt of $2.1 billion. The acquisition
helped the company to expand its metallurgical coal shipments significantly.
Almost immediately following the acquisition, coal prices fell across the board. Arch Coal
initially made efforts to prevent bankruptcy by attempting to sell off assets and exchange its
debt with securities for short-term bonds. The initial negotiations were unsuccessful as lenders
were unwilling to trade their debt for lower-return assets. Arch Coal filed for bankruptcy on
January 11, 2016. To date, the terms of the bankruptcy have included an agreement with the
majority of its senior lenders on financial restructuring that is expected to eliminate more than

The Challenges of the U.S. Coal Industry and Lessons for Europe
26
$4.5 billion in debt out of $6.5 billion from Arch’s balance sheet (10). Arch’s existing stock will
be canceled and senior lenders will receive the substantial majority of the new stock in the
reorganized company. Mining operations will continue as normal, but the company may close
its unprofitable Central Appalachian mines and focus on the Powder River Basin in Wyoming.
Case Study: Alpha Natural Resources Inc.
Alpha Natural Resources’ story also reflects the coal industry’s trend of bad investment
decisions taken at the wrong time. Founded in 2002 and publicly listed in 2005, Alpha Natural
Resources focuses on the production of metallurgical coal and low-sulfur thermal coal in eight
U.S. states.
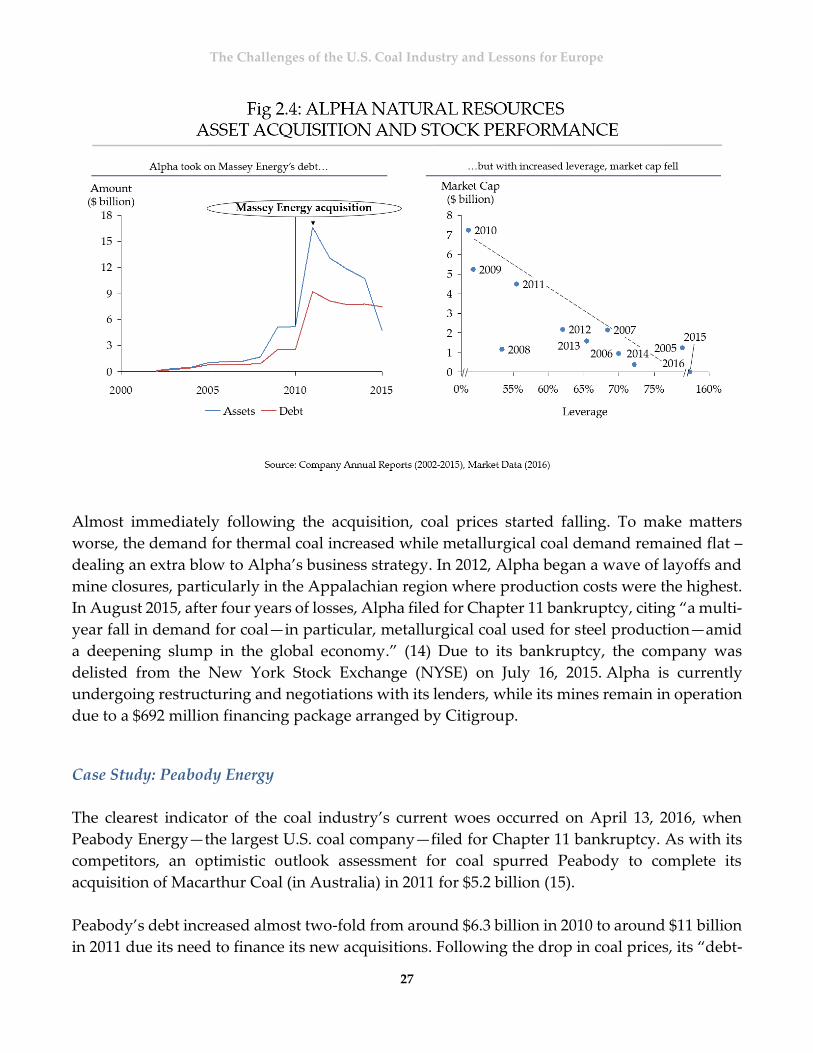
In 2011, Alpha Natural Resources acquired coal producer Massey Energy for $7.1 billion, making
it the second biggest coal miner by market capitalization (11) and one of the largest Appalachian
coal producers. Massey Energy had about 2.8 billion short tons of reserves, of which 1.3 billion
were comprised of metallurgical or coking coal. After the merger with Massey, the company
owned 150 coal mines, more than double from the original 65 mines at the end of 2007. The
merged company (54% owned by Alpha Natural Resources) became the leading producer of
metallurgical coal in the U.S. and had the second largest reserves of coal (5.1 billion short tons)
(12). Merging operations with Massey was estimated to reduce combined operating costs by
$150 million. However, the acquisition also increased Alpha’s debt by $3 billion as it took on
Massey Energy’s existing liabilities (13).
The Challenges of the U.S. Coal Industry and Lessons for Europe
27
Almost immediately following the acquisition, coal prices started falling. To make matters
worse, the demand for thermal coal increased while metallurgical coal demand remained flat –
dealing an extra blow to Alpha’s business strategy. In 2012, Alpha began a wave of layoffs and
mine closures, particularly in the Appalachian region where production costs were the highest.
In August 2015, after four years of losses, Alpha filed for Chapter 11 bankruptcy, citing “a multi-
year fall in demand for coal—in particular, metallurgical coal used for steel production—amid
a deepening slump in the global economy.” (14) Due to its bankruptcy, the company was
delisted from the New York Stock Exchange (NYSE) on July 16, 2015. Alpha is currently
undergoing restructuring and negotiations with its lenders, while its mines remain in operation
due to a $692 million financing package arranged by Citigroup.
Case Study: Peabody Energy
The clearest indicator of the coal industry’s current woes occurred on April 13, 2016, when
Peabody Energy—the largest U.S. coal company—filed for Chapter 11 bankruptcy. As with its
competitors, an optimistic outlook assessment for coal spurred Peabody to complete its
acquisition of Macarthur Coal (in Australia) in 2011 for $5.2 billion (15).
Peabody’s debt increased almost two-fold from around $6.3 billion in 2010 to around $11 billion
in 2011 due its need to finance its new acquisitions. Following the drop in coal prices, its “debt-

The Challenges of the U.S. Coal Industry and Lessons for Europe
28
laden capital structure became unsustainable as cash flows worsened and access to capital
markets evaporated.” It is expected that its shares will stop trading on the NYSE, but Peabody
will continue to operate its mines during the restructuring. The operations in Australia were not
included in the Chapter 11 filing.
Financial restructuring necessitates streamlining operations.
Although each company will emerge from its bankruptcy differently, a coal industry shakeout
would likely not result in the collapse of coal mines and the coal industry. The IEA estimates
that the United States will still get almost 30% of its energy generation mix from coal in 2030
(16), and many coal mines will remain operationally profitable. As companies seek to restructure
their debt, heavy organizational changes will be expected as new financial terms are being
negotiated with lenders. Furthermore, there is likely to be a larger number of small and unlisted
mining companies, as the mining industry becomes increasingly privatized alongside an
emergence of alternative sources of capital, especially from private equity.

The Challenges of the U.S. Coal Industry and Lessons for Europe
29
Part of the financial restructuring process necessitates changing company operations in order to
decrease cash burn and streamline operations. This process may involve layoffs, closing or
idling mines to reduce supply, and reducing exports. As companies cut costs in order to reduce
debt and liabilities, we can expect a higher number of mine sales and closures as well as more
layoffs and lower wages for workers.
Such an outcome will have resounding negative social effects for mining employees and
communities, many of which have already been economically devastated by the large number
of layoffs in recent years. Such impacts will be further discussed in Section III of the report. The
following are some examples of how companies have attempted to streamline operations and
cut costs.
Bankrupted companies’ shedding of liabilities has led to societal problems.
One result of bankruptcy filings that has incurred negative public consequences has been the
shedding of certain environmental and labor obligations. For example, the bankruptcy of Walter
Energy has had devastating effects on current and former employees. In late 2015, a federal
judge granted approval for the company to reject its labor agreements and end retiree benefits.
This has left many union employees and retirees facing an uncertain future, even after the
federal agency Pension Benefit Guarantee Corp. announced that it would pay retirement
The Challenges of the U.S. Coal Industry and Lessons for Europe
30
benefits for more than 2,700 current and future retirees of Walter Energy (17). Alpha Natural
Resources is also currently seeking permission to amend its retiree and labor obligations.
Coal companies also have liabilities tied to environmental claims that can be shed during a
bankruptcy, and this pushes the burden of reclamation and restoration to taxpayers and the
state (18).
For example, Arch Coal and Alpha Natural Resources have both assured that some, but not all,
of their reclamation obligations will be covered. In the case of Arch Coal, its lenders have agreed
to cover up to $75 million in cleanup and other regulatory obligations in connection with its
bankruptcy loan. However, around $410 million of its obligations still remain to be taken up by
Wyoming (19). Hence, these cases illustrate that states and taxpayers may end up with the
ultimate responsibility for retirees and the environmental clean-up.
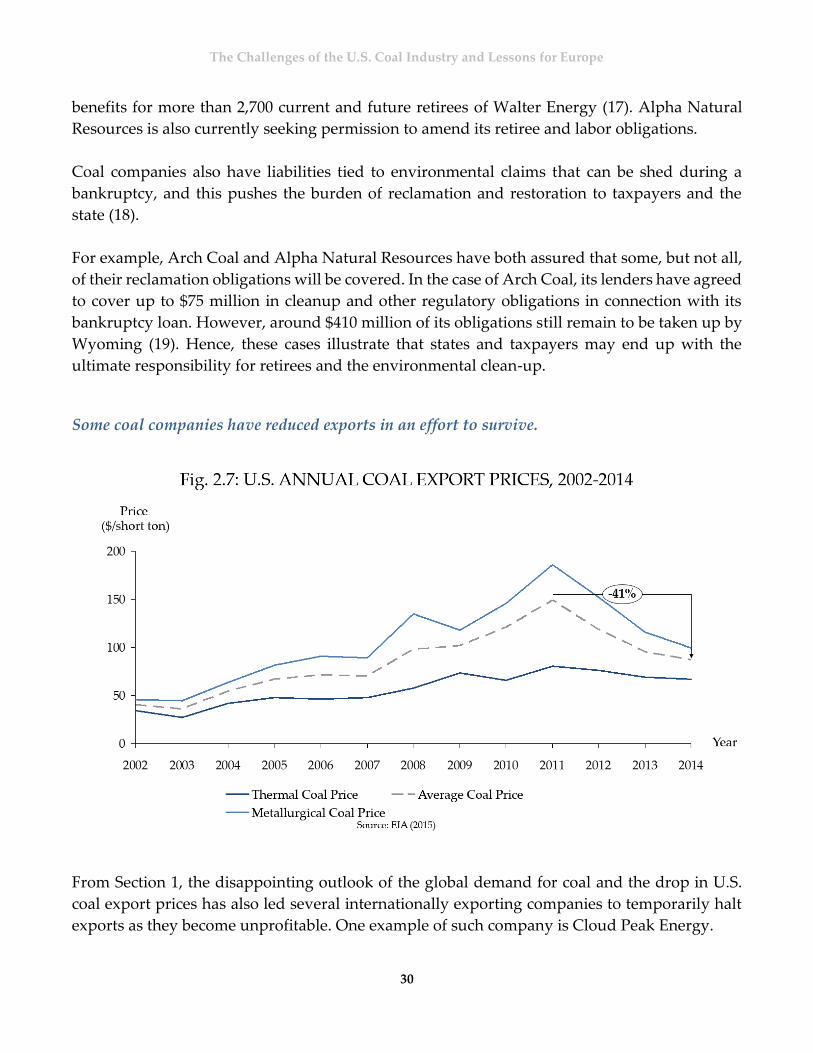
Some coal companies have reduced exports in an effort to survive.
From Section 1, the disappointing outlook of the global demand for coal and the drop in U.S.
coal export prices has also led several internationally exporting companies to temporarily halt
exports as they become unprofitable. One example of such company is Cloud Peak Energy.

The Challenges of the U.S. Coal Industry and Lessons for Europe
31
The company is considered the third largest U.S. coal producer, selling approximately 86 million
short tons annually. (20). It operates surface mines in the Powder River basin, making it one of
the lowest-cost producers in the United States. Originally using a take-or-pay contract with
Westshore Terminals Limited Partnership, Cloud Peak decided that the money it was losing by
shipping to Asia would be greater than what it would lose by paying Westshore not to ship it.
In October 2015, Cloud Peak announced that it would halt exports through Westshore Terminals
for the period 2016 to 2018, instead opting for an undisclosed payment and further undisclosed
quarterly payments throughout the period (21).

The Challenges of the U.S. Coal Industry and Lessons for Europe
32
2.2 DIVERSIFICATION AND DIVESTMENT FROM COAL
Although diversifying revenue streams can be a viable strategy, success often relies on
geographical advantages and good timing.
The second major trend is that of diversification. We investigated whether companies have
pursued diversification to stem off the coal industry decline, but few have done so. Some
companies have moved to diversify their operations away from coal and towards other
resources such as natural gas and coal mine methane in order to hedge their risks and bolster
revenues. Diversification of revenues has proven to be a relatively successful strategy for
companies struggling with decreasing sales from their core coal business.
Based on our research, the lower the reliance on coal revenues, the lower the fall in stock price
in the previous 12 months (April 2015 - April 2016) (22). However, this is a difficult strategy for
coal mining companies to adopt as they have historically only focused on one revenue stream.
Our analysis of thirteen public-listed companies’ annual reports shows that most (around eight)
did not attempt to diversify their revenue streams. In addition, the few companies that did
attempt to do so, such as CONSOL, already had natural gas assets when the coal sector started
to experience difficulties.
According to Fig. 2.8, while most companies saw a decrease in stock price following the decline
in coal prices in 2011, those with diversified revenue sources fared slightly better than those that
did not. The success was measured by the change in stock price over the last twelve months (22).

The Challenges of the U.S. Coal Industry and Lessons for Europe
33
Diversification has been difficult for a number of reasons. First, companies have to stick to their
core competencies. As Sergej Mahnovski, former Director of Utility of the Future for Con Edison
suggested, “Companies can typically only transition 1 degree outside of their core business model.”
Second, even if they do not diversify, they may still face external challenges as investors may
not believe in them. Investors often prefer to diversify their own portfolio of companies, rather
than staying with a company that is attempting to diversify outside of its core business, given
the various risks involved. The former CEO of utility company NRG, David Crane, suggested
this when he claimed that “Wall Street has difficulty digesting the idea of a conventional company
going green” (23).
Naturally, the relationship between stock prices and a company’s reliance on coal will vary
according to market conditions. For example, Cliffs Natural Resources, which sells both coal and
iron ore (24), would be negatively impacted if the iron ore market faltered. Conversely there
have been times when pure coal companies have benefited from focusing on certain core
profitable assets, a strategy discussed further in Section 2.3.

The Challenges of the U.S. Coal Industry and Lessons for Europe
34
Eight out of thirteen publicly listed companies (Peabody, Arch Coal, Cloud Peak Energy, Alpha
Natural Resources, Alliance Resource Partners, Westmoreland Coal Company, Armstrong
Energy and Walter Energy) control 58% (25) of U.S. production and have not exhibited any
substantial attempts to divest from coal or to make parallel investments in new activities (26).
BHP Billiton pursues mining activities around the globe (27), and coal only accounts for 14% of
its revenues (although we note that its coal mining activities are primarily taking place outside
of the United States.). NACCO is a holding company (28) which has a diverse portfolio of
businesses (such as kitchen appliances) and Cliffs Natural Resources operates primarily in the
iron-ore mining sector (24). Such companies are continuing to operate with a business-as-usual
approach, without significant efforts to further diversify or change their strategy.
Coal companies with diversified revenues do exist (Energy Future Holdings, NACCO
Industries, BHP Billiton, and Cliffs Natural Resources), but most of their diversification is the
result of a long-term strategy as opposed to a strategic reaction to current market conditions.
Before filing for bankruptcy in 2015 (29), the integrated utility Energy Future Holdings earned
revenues from power generation in addition to owning twelve lignite coal mines as a source of
fuel (30).
The Challenges of the U.S. Coal Industry and Lessons for Europe
35
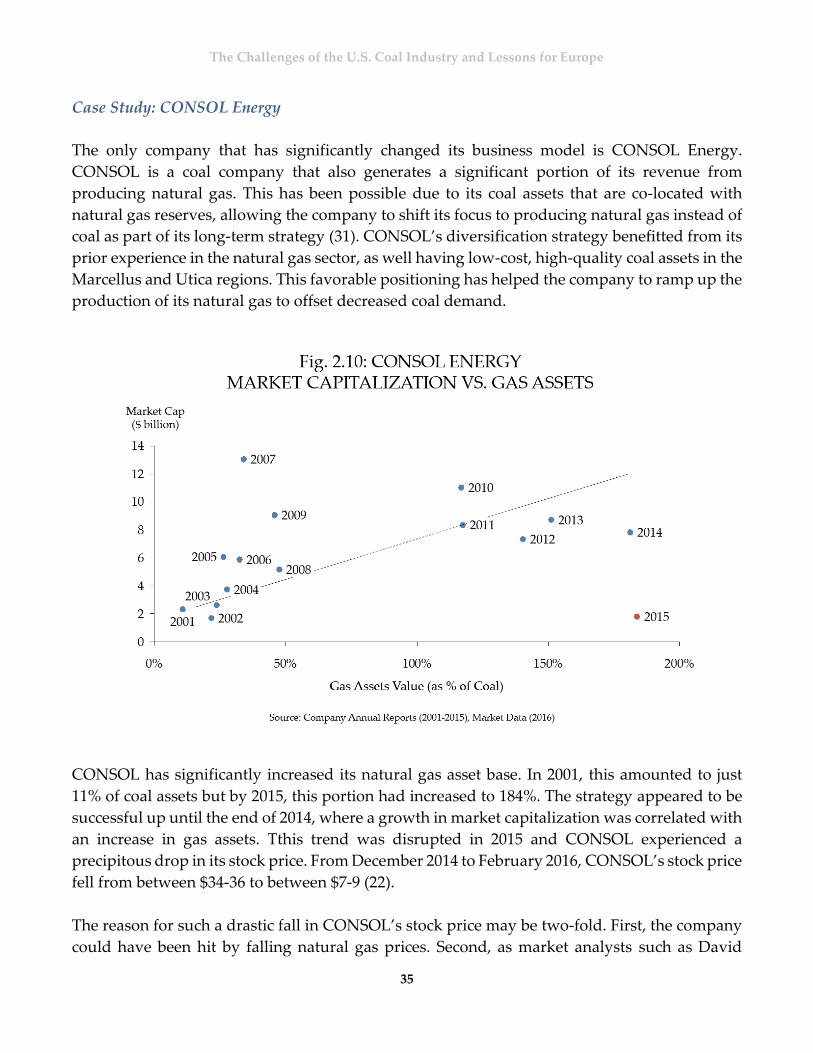
Case Study: CONSOL Energy
The only company that has significantly changed its business model is CONSOL Energy.
CONSOL is a coal company that also generates a significant portion of its revenue from
producing natural gas. This has been possible due to its coal assets that are co-located with
natural gas reserves, allowing the company to shift its focus to producing natural gas instead of
coal as part of its long-term strategy (31). CONSOL’s diversification strategy benefitted from its
prior experience in the natural gas sector, as well having low-cost, high-quality coal assets in the
Marcellus and Utica regions. This favorable positioning has helped the company to ramp up the
production of its natural gas to offset decreased coal demand.
CONSOL has significantly increased its natural gas asset base. In 2001, this amounted to just
11% of coal assets but by 2015, this portion had increased to 184%. The strategy appeared to be
successful up until the end of 2014, where a growth in market capitalization was correlated with
an increase in gas assets. Tthis trend was disrupted in 2015 and CONSOL experienced a
precipitous drop in its stock price. From December 2014 to February 2016, CONSOL’s stock price
fell from between $34-36 to between $7-9 (22).
The reason for such a drastic fall in CONSOL’s stock price may be two-fold. First, the company
could have been hit by falling natural gas prices. Second, as market analysts such as David

The Challenges of the U.S. Coal Industry and Lessons for Europe
36
Einhorn suggest, investors perceive CONSOL predominantly as a coal company, and therefore
attribute a risk profile that is more appropriate for a coal company than for a natural gas
company (32). Due to these reasons, there is a possibility that CONSOL’s stock performance will
deviate from that of the coal industry once the market and investors are comfortable with the
shifting focus of the company and acknowledge the 39% growth in its natural gas revenues from
2013 to 2014.
Coal mine methane production is not considered to be a viable investment opportunity.
According to industry trends, coal mine methane production closely matches coal production.
Data suggests that until now, coal mine methane has been treated as a by-product revenue, and
not necessarily as a separate revenue stream. There has been virtually no company involvement
in coal mine methane resource development in recent years.
Referring to chart below, its production has been falling since its peak in 2009, mirroring the
overall decline in coal production. (33). Major coal players do not seem to be considering
reversing this trend. This became apparent after evaluating recent annual reports and press
releases of coal companies, where coal mine methane has not been distinguished as a separate
line item. In many instances, coal mine methane is described merely as a safety liability, with no
reference to its revenue potential.

The Challenges of the U.S. Coal Industry and Lessons for Europe
37
2.3 FOCUS ON CORE PROFITABLE OPERATIONS
A conservative business strategy and focusing on operational efficiency may be the best path
forward, but does not ensure success in today’s troubled coal market.
Within the U.S. coal mining sector, a third theme that arose during our research is the
consolidation that has occurred within the sector. As discussed earlier, many coal companies are
experiencing financial distress and have undergone or are currently facing bankruptcy. Despite
the bleak outlook, other companies are taking this opportunity in the market downturn to
concentrate their coal positions and focus on core profitable operations.
The three types of focus strategies are: operational efficiency, geographic concentration, long-
term contracts.
A common method of concentration within the coal sector is the focus on operational efficiency
and reduction of operating costs. One such efficiency boosting measure is operational
refocusing: selling off metallurgical coal assets in favor of exclusively producing thermal coal,
or vice versa. This approach usually involves a company like Walter Energy (which has
historically produced both metallurgical coal and thermal coal) selling off their thermal coal
assets in favor of producing metallurgical coal exclusively. Unfortunately as discussed earlier in
the report, such a strategy has not prevented Walter Energy from bankruptcy after metallurgical
coal prices and demand dropped significantly.
Case Study: Alliance Resource Partners
A second potential approach is geographic concentration, where a company with national
operations consolidates their operations into one particular coal mining region and focuses on
mining the company’s most profitable reserves. An example of this approach is Alliance
Resource Partners, who originally mined coal in the Appalachian coal region, and acquired
assets in the Illinois Basin to become a national producer. In response to falling coal prices,
Alliance has focused on their Illinois Basin operations, as the Appalachian assets have become
less profitable.

The Challenges of the U.S. Coal Industry and Lessons for Europe
38
Case Study: Westmoreland
A third approach is adopting a cautious growth strategy while focusing on operational
efficiency and stable long-term contracts. Coal companies who have taken this approach, due to
their conservative business strategy, are better able to weather coal price shocks than their
highly-leveraged peers. An example of this approach is Westmoreland Coal (26), whose
successful avoidance of bankruptcy can be attributed to the conservative approach of its long-
term strategy. It has focused on selling high quality coal into niche markets strategically located
close to power plants and customers, thus reducing transportation costs. Westmoreland also
benefits from long-term, cost-protected “take-or-pay” contracts with those nearby customers,
further securing stable revenue streams.
In addition to its operational concentration, Westmoreland also shifted geographically early on,
selling off its east coast assets in 1995 in order to concentrate on lower-cost mines in Western
U.S., Canada, and the Powder River Basin. These tactics have enabled them to keep their
operating costs low enough to weather the recent downturn within the coal sector.

The Challenges of the U.S. Coal Industry and Lessons for Europe
39
These three approaches: eliminating non-core operations, geographical concentration (as done
by Alliance Resource Partners), and streamlining operations (as done by Westmoreland Coal),
have allowed certain coal companies to survive the bankruptcies that have plagued the rest of
the coal sector.
Nevertheless, these strategies have not entirely shielded these companies from the coal sector
shakeout. All of these companies have suffered steep drops in their stock prices (of more than
50%) in the past year. At best, the case studies demonstrate that even the best practices of
efficient coal companies cannot ensure success in this troubled coal market.

The Challenges of the U.S. Coal Industry and Lessons for Europe
40
SECTION III
SOCIETAL IMPACT
In addition to the economic challenges facing the coal industry, the social tide has shifted against coal, due to climate change and environmental and health concerns. While the coal mining industry continues to wield influence in U.S. politics, that influence is waning, especially in areas where natural gas production has taken off. Furthermore, at the regional and local level, there are major concerns among politicians and the general public regarding the economic and social implications of the loss of employment opportunities for industry workers. This section outlines both the changing U.S. political landscape as it relates to the coal industry, and the repercussions of coal industry’s decline on coal mine employees and their communities. It also provides an overview of policies designed to mitigate the impact of this decline.

The Challenges of the U.S. Coal Industry and Lessons for Europe
41
3.1 POLITICAL INFLUENCE
The coal-mining lobby remains politically relevant in the United States., but is no longer as
financially or politically influential as it used to be.
The U.S. coal mining industry’s collective lobbying and campaign contribution dollars
skyrocketed when President Obama came into office in 2008, reaching an apex of $16 million in
campaign contributions, and more than $18 million in lobbying expenditure during the first
term of his presidency. This dramatic increase in political spending signals opposition to the
Obama administration’s stricter environmental regulations, and also suggests a struggling
industry grasping for a lifeline. After 2012, spending fell as coal companies began to falter
financially.
Despite the increase, the coal industry spent, on average, only 15% relative to what the oil and
gas sector spent on political contributions since the Obama administration came to power in
2008 (34). Over the same period, the coal mining industry has lost political leverage as key
regions have benefited from the shale gas revolution. In the U.S., because of the Electoral

The Challenges of the U.S. Coal Industry and Lessons for Europe
42
College 3 system of elections, presidential contests are typically won based on how well a
candidate performs in ‘swing states’4. For this reason, swing states have a disproportionate
amount of political influence.5
Coal and natural gas production were roughly equivalent, on a Btu basis, both in the United
States and in swing states in 2008 (35). By 2014, natural gas production was more than 2.5 times
that of coal production in swing states, and exceeded coal production nationally by
approximately 36% (36).
Today, about 18% of U.S. coal is produced in swing states, similar to trends over the last 25 years
(35). But the percentage of natural gas produced in swing states grew to 29% in 2014, from 16%
in 2008 and 9% during the 1980s. These economic trends have diminished the coal industry’s
political influence in the United States.
3 The Electoral College is a process where voters select electors who then vote for the President of the United States
on behalf of the electorate. Most states in the U.S. have a “winner-take-all” system that awards all electors in a given
state to the winning presidential candidate.
4 In presidential politics of the United States, a swing state is a state in which no single candidate or party has
overwhelming support in securing that state's electoral college votes. Such states receive a large share of the
attention and campaigning of political parties in presidential elections, since winning these states is the best
opportunity for a party to gain electoral votes. 5Swing states include Pennsylvania, Ohio, Colorado, Florida, Michigan, Nevada, New Hampshire, New Mexico,
North Carolina, Virginia, and Wisconsin.

The Challenges of the U.S. Coal Industry and Lessons for Europe
43
U.S. public sentiment for coal is divided along party lines and geographic location.
The coal industry’s political spending is targeted, fostering public support among certain
political groups. The industry has supported the Republican Party in the last 13 election cycles
and enjoys significantly more support from Republicans than from Democrats (34). In 2014, 96%
of campaign contributions from the industry were directed to the Republican Party.
Democratic states—as well as wealthier states—are more likely to support stricter
environmental regulations over continued coal production (37). When asked in a recent Gallup
poll if environmental protection or U.S. domestic energy development should be given priority,
Democratic respondents widely prioritized environmental concerns, while Republicans
prioritized domestic energy production.
While the industry mostly supports conservative coalitions and the Republican Party, it also
targets its campaign contributions to representatives from traditional coal mining regions, like
Kentucky and West Virginia (34). By strategically spending on the Republican Party, and on
elected officials from coal producing counties, the industry has managed to maintain some
influence in U.S. politics despite economic woes.
Since 2011, a majority of Americans have favored the development of alternative renewable
energy sources over the increased production of fossil fuels (38). Furthermore, most Americans

The Challenges of the U.S. Coal Industry and Lessons for Europe
44
are in favor of stricter regulations on greenhouse gas emissions from power plants, citing that
these regulations are “worth the cost” (39).
While public sentiment is moving away from coal and toward alternative energy, and as coal
companies are struggling to survive, coal miners and coal mining communities are finding
themselves in a difficult situation and in need of support.

The Challenges of the U.S. Coal Industry and Lessons for Europe
45
3.2 EMPLOYMENT
Bankruptcies and economic woes threaten employment opportunities in coal mining.
The loss of employment opportunities in mining and its associated industries has been a
longstanding problem for many communities in the United States. In the past several years, top-
producing U.S. coal companies, including Peabody, Arch Coal, and Alpha Natural Resources,
have filed for bankruptcy, deciding to restructure and cut costs—leading to a further decline in
coal miner employment. This trend is likely to continue as several other top coal producers face
potential bankruptcy in the coming years. Together, Peabody, Arch Coal, and Alpha Natural
Resources contribute more than 40% of total U.S. coal production (25). These companies have
all cut down the number of workers during the past three years, with more layoffs likely, given
Peabody’s bankruptcy filing in the first quarter of 2016.
Overall, the total number of employees at U.S. coal mines has been declining since 2011, reaching
a low of around 75,000 employees in 2014, a decrease of 7% from 2013 (40).
In areas where there are few alternatives for work, coal mining job losses can be particularly
difficult for workers, their families, and their communities.
The primary reasons can be summarized as follows:
Some coal communities are built around the coal industry and coal mining jobs, and
other industries have failed to develop (41).
Coal miners often lack the transferable skills and education that would make them
desirable employees in other industries (42).
Mining industry wages are significantly higher than wages for other low-skilled
work, and higher than the average wage in the United States. In 2014, according to
the National Mining Association, the average wage for all U.S. coal mine workers was
$82,000, while the average wage for all U.S. workers was approximately $50,000 (43).
The pre-tax wage for full-time work at minimum wage in the U.S. is $15,000.
Mine closures strip coal communities of vital tax revenues, including those from
income tax, corporate tax, and severance tax, which enable them to provide the social
services that are in greater demand after a negative shock to the local economy (44).
Negative impacts from job losses are particularly challenging in mining communities that are
traditionally low income, as is the case in Central Appalachia. On average, income in Central
Appalachia is 64% of the average U.S. family income, the percentage of people living in poverty

The Challenges of the U.S. Coal Industry and Lessons for Europe
46
is almost double that of the general U.S. population, as is the percentage of people living with a
disability (45).
McDowell County, West Virginia, demonstrates the perils of relying primarily on coal mining.
McDowell County was a traditional coal mining community in southern West Virginia that
thrived in the middle of the twentieth century. In the 1930s, it was the top producer of coal in
West Virginia, and for years the region led the U.S.’s production of the renowned Pocahontas
Smokeless Coal (46).
For years, the county’s production averaged from 20 to 26 million short tons of smokeless coal
a year, and attracted the highest prices in the market (46). By 1932, McDowell County had
produced 530 million short tons of coal, and had further reserves of almost 5 billion short tons
(46). Once the top coal-producing county in the United States, in 2014 the county produced just
3 million short tons of coal (40). More than one-third of county residents live below the poverty
line (47). The county claims the highest drug overdose death rate in West Virginia, along with
very high rankings in binge drinking and suicide (45).
“Locals reminisce about how there were once three movie theaters in the county and the population swelled
to more than 100,000. It was a dependence that would prove unsustainable. By the 1980s, a bust was well
underway throughout the region’s coal hills. Mining mechanization eroded jobs, and the steel industry
— coal’s main buyer — was in sharp decline.” – Al Jazeera America Report (47)

The Challenges of the U.S. Coal Industry and Lessons for Europe
47
The impact of the loss of jobs in coal mining has been devastating for the region. According to
locals and local officials, the county desperately needs more housing, better roads, more jobs, a
rehab center, and a stable food bank (47). Although McDowell County thrived for decades in the
mid-century, it has struggled for many more decades, and has never recovered from the loss of
coal jobs during the U.S. steel industry’s downturn and beyond. Federal and local efforts to
revive the area have had little effect. McDowell County proves that economic development for
coal-mining communities is vital, and incredibly challenging.
Job losses in Central Appalachia have been disproportionately steep due to lower productivity
and higher costs compared to other coal producing regions.
Central Appalachia has been particularly affected. For decades, the coal communities of the
Appalachian region have struggled amid declining domestic coal consumption, and today the
trend is worsening. Of the roughly 17,000 U.S. coal-mining jobs lost in the past five years, 83%
were in the Central Appalachian region, whereas other coal producing regions have experienced
relatively stable employment.

The Challenges of the U.S. Coal Industry and Lessons for Europe
48
From 2013 to 2014, approximately 5,500 coal-mining jobs were lost across the United States. Of
those, around 4,100 were lost in Central Appalachia, and another 1,100 from the rest of
Appalachia (48). More than 50% of job losses took place in West Virginia and Kentucky.
The primary reason that Central Appalachia has been hit so hard relative to other coal producing
regions is a lack of productivity relative to other basins and the costs associated with needing
more workers per level of output. In Central Appalachia, one labor hour produces
approximately 2 to 3 short tons of coal, while coal miners in the Powder River Basin can produce
30 to 40 short tons of coal in one labor hour.

The Challenges of the U.S. Coal Industry and Lessons for Europe
49
This discrepancy is directly related to the type of coal mines operated in each region. In the
Powder River Basin, all coal mines are surface mines, which render coal cheap and easy to
produce. In Central Appalachia, operations are split more evenly between surface and
underground mines. Underground mines have been closing in recent years, as it becomes more
challenging and costly to mine for smaller amounts of coal.
The Challenges of the U.S. Coal Industry and Lessons for Europe
50
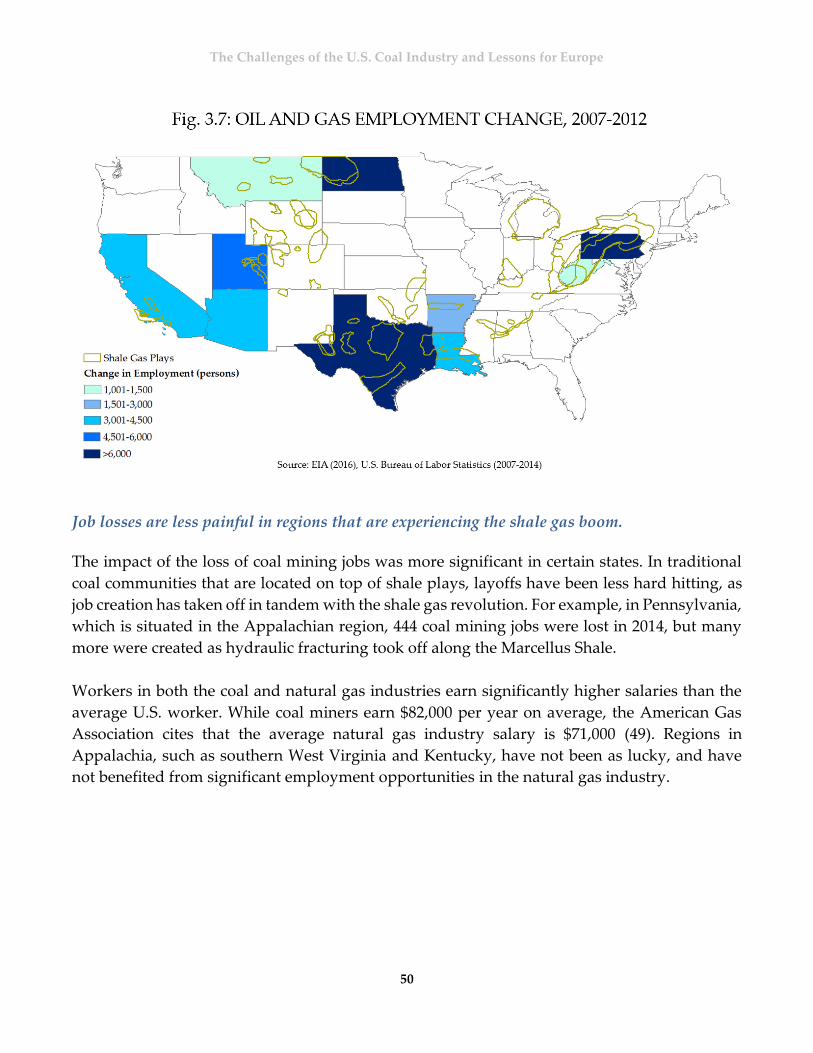
Job losses are less painful in regions that are experiencing the shale gas boom.
The impact of the loss of coal mining jobs was more significant in certain states. In traditional
coal communities that are located on top of shale plays, layoffs have been less hard hitting, as
job creation has taken off in tandem with the shale gas revolution. For example, in Pennsylvania,
which is situated in the Appalachian region, 444 coal mining jobs were lost in 2014, but many
more were created as hydraulic fracturing took off along the Marcellus Shale.
Workers in both the coal and natural gas industries earn significantly higher salaries than the
average U.S. worker. While coal miners earn $82,000 per year on average, the American Gas
Association cites that the average natural gas industry salary is $71,000 (49). Regions in
Appalachia, such as southern West Virginia and Kentucky, have not been as lucky, and have
not benefited from significant employment opportunities in the natural gas industry.

The Challenges of the U.S. Coal Industry and Lessons for Europe
51
3.3 OPPORTUNITIES FOR THE FUTURE
Through this research, strategies have been identified to counter the negative impact of job
losses in the coal mining industry. Strategies outline below include investing in new sector job
training, focusing on new industry development, and the implementation and use of severance
taxes and permanent funds.
Invest in new sector job training and incentivize new industry development.
The coal industry in the United States is a difficult sector for job creation. In addition to the
financial troubles that plague the industry, coal today is produced with more mechanized
processes and utilizes the fewest union workers in decades (48). According to an analysis by the
University of Massachusetts Political Economy and Research Institute, coal ranks poorly in job
creation potential when compared to most other infrastructure industries. Fortunately, there are
alternatives.
In areas where communities are traditionally dependent on coal mines for income, there is a
need for training in other sectors that can provide well-paying jobs, as well as for incentives to
develop new industry. Coal mining workers make up a very small percentage of the total labor
force in the United States, but layoffs can nonetheless gravely affect whole communities and
regions. Fortunately there are growth industries that provide well-paid jobs and which are less
capital intensive than the coal industry. According to research conducted at the University of
Massachusetts Political Economy and Research Institute, infrastructure investments in the
natural gas sector as well as physical infrastructure investments in train transit, roads and
bridges, and water can lead to approximately three times the level of job creation over
investments in the coal industry for the same level of spending (50), (51).

The Challenges of the U.S. Coal Industry and Lessons for Europe
52
These jobs are generally a good fit for coal mine workers, because pay for construction and
energy sector work tends to be relatively high, and there is a need for manual labor in line with
coal mining workers’ experience.
Renewable energy is another popular area for development and retraining. The solar industry
in particular boasts extraordinary job growth patterns and decent wages. In 2015, the solar
industry employed about three times the number of workers as the coal industry, and the gap
will likely continue to grow (52).
Where appropriate, retraining in solar makes sense, because of the long-term growth potential
of the industry and because wages are high. The median hourly wage for solar workers is more
than $10 more than the average U.S. hourly wage (52). Additionally, solar jobs are local with
80% of solar installations are performed by in-state companies (52).
Redirect severance taxes back to coal communities and create permanent funds.
Severance taxes are those that tax the extraction and production of non-renewable natural
resources such as coal. In the United States., more than 36 states have enacted severance taxes,
although not all severance tax revenues are directed back to the communities that are involved
in extraction (53). One approach to revitalizing an area is to redirect revenues from severance
The Challenges of the U.S. Coal Industry and Lessons for Europe
53
taxes back to the communities that are engaged in extractive industry. This is what Kentucky
decided to do in 1992, after 30 years of distributing the revenues statewide. The money earned
from direct severance taxes can be significant. In Kentucky in 2013, the tax per ton of coal
extracted was $65, which raised $298 million in revenue for the local community, a significant
sum for the region (53).
Because coal severance tax revenues are reliant on coal production, and decline over time in the
case of industry downturns, some states have created permanent funds. Permanent funds are a
protected percentage of funds collected from severance taxes that are invested for future
economic development. By creating permanent funds, coal communities can protect themselves
against future negative economic shocks. In the United States, Alaska, Montana, Wyoming, and
New Mexico have long-standing funds, and two other states recently created their own (44).
New and ambitious federal programs have been proposed to support coal industry employees
and communities, but have only been partially funded.
The Federal POWER + Plan is a proposal put forth in President Obama’s national budgets. The
plan provides funds to federal agencies and departments, including the Department of Labor,
the Dislocated Workers National Reserve, the Appalachian Regional Commission, and the
Environmental Protection Agency’s Brownfields Program, in order to revitalize U.S. coal
communities. The plan provides dedicated new resources for economic diversification, job
creation, job training, and other employment services for workers and communities impacted
by layoffs at coalmines and coal-fired power plants.
The program includes investments in the health and retirement security of mineworkers and
their families, and the accelerated cleanup of hazardous abandoned coal mine lands.
As part of the plan, new tax incentives have also been proposed to support continued
technological development and the deployment of carbon capture, utilization, and sequestration
technologies, including a refundable sequestration tax credit of $50 per metric ton of CO2
permanently sequestered and not beneficially reused (e.g., for enhanced oil recovery) or $10 per
metric ton for CO2 that is permanently sequestered and beneficially reused. The credit would be
allowed for a maximum of 20 years of production. The plan has yet to be fully funded.
The Federal POWER Initiative, on the other hand, has been funded, and is being called a
stepping stone to the POWER + Plan, given the immediacy of the economic need in coal country.
The POWER Initiative is a multi-agency plan that targets federal resources to help communities
and regions that have been affected by job losses in coal mining, coal power plant operations,
and coal-related supply chain industries due to the changing economics of America's energy
The Challenges of the U.S. Coal Industry and Lessons for Europe
54
production. The plan aims to cultivate economic diversity, enhance job training and re-
employment opportunities, create jobs in existing or new industries, and attract new sources of
investment.
Economic and workforce development components of the POWER+ Plan have been
implemented using existing funds, including: $45 million for POWER implementation grants
in 2016, with grants expected to range between $0.5 and $1.5 million, as well as POWER
technical assistance (TA) grants to communities and regions for economic development
planning, assessment, and capacity-building activities in Appalachia; $1.2 million is available
for these grants in 2016.
Regional efforts are also essential to economic revival.
Regional efforts such as Shaping Our Appalachian Region (SOAR), in Kentucky, a bipartisan
collaboration that encourages government partnership with the private sector and civil society
to help communities diversify their economies, have also attempted to address labor challenges.
SOAR is also in its beginning stages, and utilizes POWER Initiative resources to fund its work.
Reconnect McDowell in McDowell, West Virginia, is an example of another local organization
attempting to improve outcomes for the local community.
Overall, there are clear impacts on society that needs to be considered, but because these public
sector efforts are so new, it is not yet possible to assess their potential impact.

The Challenges of the U.S. Coal Industry and Lessons for Europe
55
SECTION IV
LESSONS FOR EUROPE
This section outlines how the U.S. and European markets are becoming increasingly similar and discusses the applicability of lessons from the U.S. coal transition for European countries.

The Challenges of the U.S. Coal Industry and Lessons for Europe
56
4.1 OVERVIEW
U.S and European energy markets are becoming more similar.
The U.S. and European energy landscapes were quite different until recent years. While market
forces have primarily shaped the U.S. energy landscape, Europe’s has been more policy-driven,
historically.
Strong environmental policies such as the EU Emissions Trading System (54) coupled with
ambitious renewable energy policies and a high dependence on expensive energy imports used
to set Europe apart from the United States. Importantly, the U.S. shale gas revolution created a
substantial gap between the prices of natural gas in the two regions.
The shale gas revolution has been the primary driver of the coal substitution phenomenon in
the United States. Due to technical, political and environmental factors, a similar shale gas boom
has not taken off in Europe and it is unlikely that domestic shale gas resources will play a
significant role in European natural gas markets in the near future.
More recently, however, Europe has adopted a new natural gas strategy, developing its gas
pipeline system and increasing the deployment of LNG terminals (55). As a result of increased

The Challenges of the U.S. Coal Industry and Lessons for Europe
57
supply and heightened competition among producers in recent years, natural gas prices in the
United States and in Europe have converged. In this way, natural gas prices have created
conditions that made coal more comparable between the United States and Europe.
Meanwhile, the United States has become more closely aligned with the policy positions of
Europe as it has taken steps to adopt a more ambitious climate change agenda and
corresponding emission reduction instruments, such as the CPP.
Although they differ in their approach, both the EU and the United States have achieved
emission reductions in recent years and maintain ambitious targets for the future. While the EU
has a comprehensive legislative framework of common targets in combination with a Union-
wide cap and trade system (EU ETS), the United States has diverse local, state and federal-level
regulations with varying levels of ambition. These regulations include state-wide emission
trading schemes such as the Regional Greenhouse Gas Initiative in the Northeast and the
California Cap and Trade program in the West, as well as emission limits and technology
requirements.
Internationally, both the EU and the United States are Parties to the United Nations Framework
Convention on Climate Change (UNFCCC) and although the United States has not signed any
new agreements that include binding emission reductions, the recent bilateral agreements
achieved with major developing countries such as China and Brazil show continued
commitment to GHG emission reductions. As such, the impact of more ambitious climate
regulation, insofar as it affects the current economics and future prospects of coal, will, ceteris
paribus, be very similar on both sides of the Atlantic.
The ability of the EU to achieve its climate commitments will likely ride on the success of the EU
ETS. Since its trial period, which ended in 2008, the EU ETS has struggled with a considerable
over-supply of allowances that has kept the price on carbon low and damaged the credibility of
and interest in the system. A combination of poor economic outlooks, cheap carbon offsets, and
a dramatic rise in renewable energy capacity, followed by inadequate policy responses, has
almost completely eroded the effectiveness of this system. Whereas carbon allowances had
traded at around 30 Euros in 2008, by 2013 they were worth just 5 Euros. The financial penalties
for utilities’ use of coal have thus become less onerous, further enhancing coal’s competitiveness
vis-a-vis gas during that period.
In light of the low cost of carbon in recent years, the EU has agreed to implement drastic
regulatory and market adjustment mechanisms by 2018 that will result in carbon prices
sufficiently high to achieve a targeted reduction of GHG emissions. The exact price of a carbon
allowance will depend mostly on fossil fuel prices in Europe, but are likely to level out around
30 Euros per ton and therefore negatively impact the European coal sector.

The Challenges of the U.S. Coal Industry and Lessons for Europe
58
The Renewable Energy Directive (RED) is another major European policy instrument, as it
establishes an overarching policy for the production and promotion of energy from renewable
sources in the EU. It requires the EU to fulfill at least 20% of its total energy needs with
renewables by 2020 to be achieved through the attainment of individual national targets that
take into account each country’s starting point and overall potential for renewables.
These ambitious policies have significantly advanced the deployment of renewables in Europe.
Electricity produced from renewable sources increased by 171% between 1990 and 2013 at an
average annual rate of 4.4%. Since 2005, the rate has been considerably higher, at 7.5% per year
following European directives and the significant and rapid decline in the cost of renewable
energy technologies. While this move has been largely policy-driven, much like in the U.S., some
mature renewable energy technologies, such as on-shore wind, have already become
competitive with coal and natural gas on an LCOE basis.
Similarly, the market for distributed generation and storage is, much like in the United States,
seeing the proliferation of small-scale and modular devices designed to provide electricity in
locations close to consumers. Rapid growth of distributed generation in combination with
rapidly expanding renewable energy capacity in countries like Germany have already caused
concerns for utilities who fear being relegated to suppliers of last resort.
Unlike in the United States., the coal sector in Europe tends to be closely tied with government.
One of the most striking examples of state intervention in the coal-mining sector is found in
Poland. Coal mining in Poland has become a difficult and highly politicized topic due to: state
control over the majority of coal mining assets, the location of the majority of coal mines in one
region (Silesia), and the relative high number of people employed in this sector.
As of 2015, 171,000 people were employed in the mining sector (56). This means there were
approximately 445 coal miners for every 100,000 Polish citizens, six times more than in Germany
(77). Despite the size of the sector, employment in coal mining has fallen in Poland. In 1989 when
Poland started its transformation towards a free-market economy there were 416,000 workers
employed in the coal mining sector and a total of 70 coal mines. Today there are 30.

The Challenges of the U.S. Coal Industry and Lessons for Europe
59
Coal mining is supported by society and unemployment prevails after mine closures.
Because states own many coal assets and there is strong public approval for the practice of coal
mining, eliminating coal mining jobs is not an easy task. According to polling agency CBOS (one
of the most renowned in Poland), 80% of Poles highly approve of coal miners (57).
Coal has become a highly politicized topic due to its regional concentration. Silesia, which is one
of the wealthiest regions in Poland (58) is tied with coal mining operations. Currently, in this
region, 60 out of 167 counties engage in coal mining and, according to the data, these counties
have suffered from coal mine closures (59).
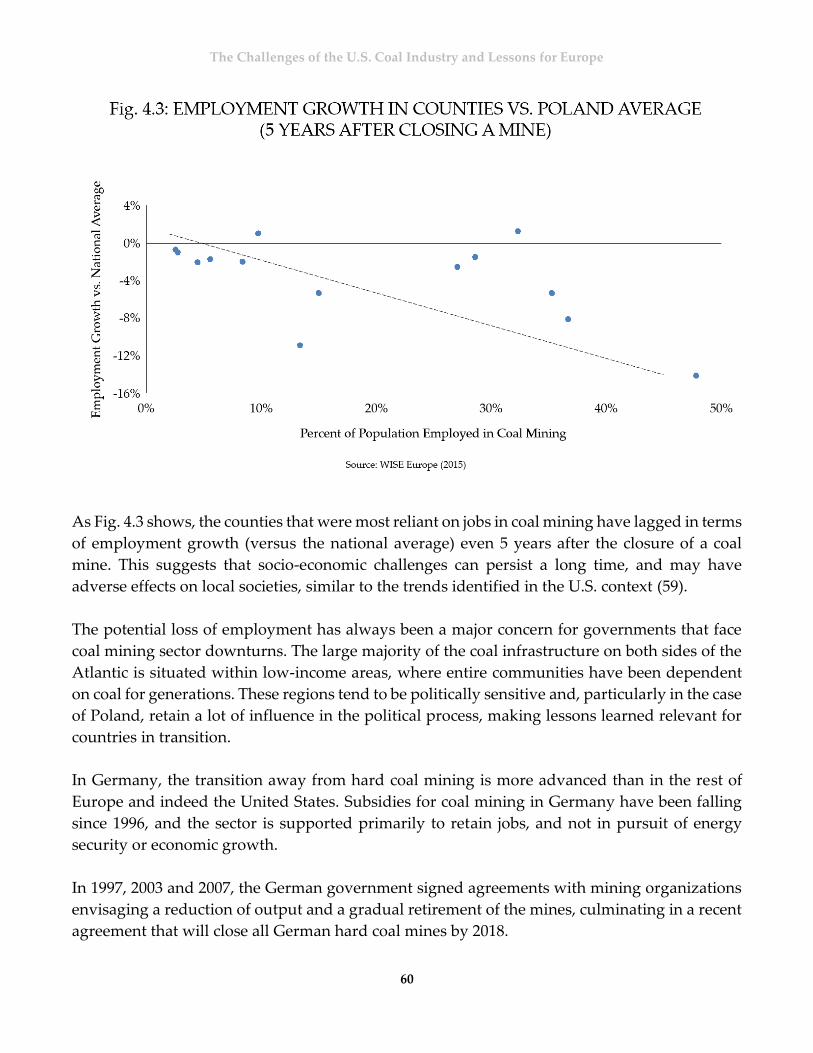
The Challenges of the U.S. Coal Industry and Lessons for Europe
60
As Fig. 4.3 shows, the counties that were most reliant on jobs in coal mining have lagged in terms
of employment growth (versus the national average) even 5 years after the closure of a coal
mine. This suggests that socio-economic challenges can persist a long time, and may have
adverse effects on local societies, similar to the trends identified in the U.S. context (59).
The potential loss of employment has always been a major concern for governments that face
coal mining sector downturns. The large majority of the coal infrastructure on both sides of the
Atlantic is situated within low-income areas, where entire communities have been dependent
on coal for generations. These regions tend to be politically sensitive and, particularly in the case
of Poland, retain a lot of influence in the political process, making lessons learned relevant for
countries in transition.
In Germany, the transition away from hard coal mining is more advanced than in the rest of
Europe and indeed the United States. Subsidies for coal mining in Germany have been falling
since 1996, and the sector is supported primarily to retain jobs, and not in pursuit of energy
security or economic growth.
In 1997, 2003 and 2007, the German government signed agreements with mining organizations
envisaging a reduction of output and a gradual retirement of the mines, culminating in a recent
agreement that will close all German hard coal mines by 2018.
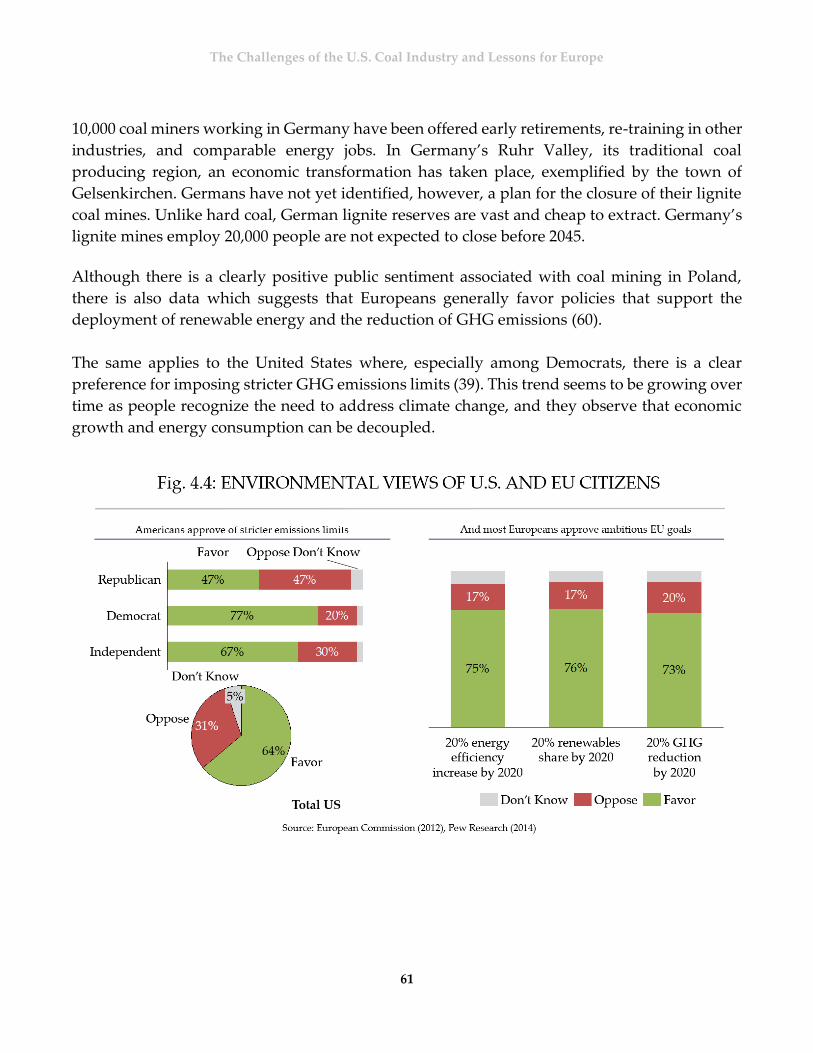
The Challenges of the U.S. Coal Industry and Lessons for Europe
61
10,000 coal miners working in Germany have been offered early retirements, re-training in other
industries, and comparable energy jobs. In Germany’s Ruhr Valley, its traditional coal
producing region, an economic transformation has taken place, exemplified by the town of
Gelsenkirchen. Germans have not yet identified, however, a plan for the closure of their lignite
coal mines. Unlike hard coal, German lignite reserves are vast and cheap to extract. Germany’s
lignite mines employ 20,000 people are not expected to close before 2045.
Although there is a clearly positive public sentiment associated with coal mining in Poland,
there is also data which suggests that Europeans generally favor policies that support the
deployment of renewable energy and the reduction of GHG emissions (60).
The same applies to the United States where, especially among Democrats, there is a clear
preference for imposing stricter GHG emissions limits (39). This trend seems to be growing over
time as people recognize the need to address climate change, and they observe that economic
growth and energy consumption can be decoupled.

The Challenges of the U.S. Coal Industry and Lessons for Europe
62
4.2 LESSONS FOR EUROPE
Low productivity is a key challenge plaguing European coal mining.
According to McKinsey & Company, one of the main issues associated with European coal
mining is the low productivity. Poland’s coal mining operations are 84% less productive than
American operations on average, but Poland is not the only country lagging behind the United
States. In 2012, the average productivity of Polish, British, German, and Spanish coal mines was
lower than the lowest 20 percent of coal mines in terms of productivity in the United States. (61).
This clearly signals that there is room for improvement.
There are several levers that can be pulled in order to improve productivity of coal mining and
they can be associated with two areas: concentration on profitable assets, and operational
excellence.
Westmoreland and Alliance Resource Partners provide examples of how concentration on
profitable assets can materialize, and that it is possible for coal mining companies to move to
different regions and to focus on their most profitable assets. The same can be done in Europe.
According to the presentation prepared in 2015 by the Polish Ministry of Economy, almost 54%
of coal reserves in Poland are not yet utilized and some of them (especially those in Zagłębie
Lubelskie) are characterized by more favorable geological conditions (62) than those that are
currently mined. Another opportunity for improving productivity of coal mining in Europe is
the deployment of the most modern mining technologies and the optimization of the labor force.

The Challenges of the U.S. Coal Industry and Lessons for Europe
63
According to McKinsey, the average number of hours worked in a year is 1,623 for Poland which
is much lower than in the United States where the number is well above 2,000 hours (61).
Additionally, there is a clear gap not only in the hours worked by miners but also in terms of
the days in operation. This can be solved by increasing the number of shifts and reducing the
number of days off for the whole crew.
Conservative investment profiles will help coal companies to remain on the market.
Low productivity is not the only challenge the sector faces. Coal mining has been struggling
financially both in the United States and Europe in recent years. As discussed in this report,
there have been several companies in the United States that were unable to avoid bankruptcy
despite their market position and production size. Overinvestment in coal assets during a period
of high coal prices hurt the financial standing of several companies when the coal prices fell.
For many American companies, more assets and more debt led to higher interest expense, which
became too large a burden when profitability suffered. This is why all of the companies with a
negative EBITDA (earnings before interest, tax, depreciation and amortization) to interest
expense ratio filed for bankruptcy.

The Challenges of the U.S. Coal Industry and Lessons for Europe
64
These lessons can serve as a warning for coal mining companies in Europe. Although
circumstances may differ, and there may be fewer acquisitions in the future, the financial
discipline of companies will be crucial.
As was discussed in the presentation of the Polish Ministry of Economy, coal companies have
continued to increase costs while revenues have been falling. Between 2004 and 2014 costs grew
from 157 to 309 PLN/ton while revenues grew from 188 to only 279 PLN/ton. This in turn led to
the replacement of an operating profit of 29 PLN/ton with an operating loss of 30 PLN/ton (62).
Although concentration on the most profitable resources and improved operational excellence
of the coal companies may be the most successful strategies for the coal mining sector in Europe,
there are also other opportunities that should be considered. One is diversification of revenues,
which may help mining companies to decrease their sales of coal. Unfortunately, this strategy
has had limited success to date in the U.S. and there are no viable examples that can be used as
a source of best practices.
CONSOL, which diversified its revenues into natural gas sales, had the preexisting advantage
of location (located in the heart of the Marcellus shale play) and developed expertise in natural
gas extraction well before the crisis hit the U.S. coal industry (31). Diversification into natural

The Challenges of the U.S. Coal Industry and Lessons for Europe
65
gas extraction may not be feasible for European companies due to the different regulatory
framework and the fact that shale gas resources have not yet been developed there (63).
Additionally, the case of Energy Future Holdings, which filed for bankruptcy, is an example
that shows that integrated utility service providers can fail (29) and merging utilities with coal
mining companies may not be successful.
European can find opportunities in transition.
U.S. coal mining is currently experiencing a very difficult period, resulting in many companies
going bankrupt. As a market driven industry, American coal mining is a good benchmark for
other regions and illuminates market trends that might exist in the case of limited government
intervention.
There are clearly significant differences between Europe and the United States, but there are also
common themes and converging market trends. Europe is becoming more like the United States,
thanks to higher natural gas import capabilities, and the United States is likewise becoming
more like Europe due to increased regulations targeting fossil fuel deployment. Therefore, there
are lessons to be drawn from the U.S. coal mining sector that are applicable to Europe. The
European coal mining sector would benefit from increasing its productivity and concentrating
on its most profitable assets. Operational excellence and financial responsibility will similarly
be keys for success for European coal mining companies.

The Challenges of the U.S. Coal Industry and Lessons for Europe
66
There may be difficult decisions to be made regarding closures of less profitable coal mines or
cost cutting. On the other hand, if these measures are not taken into consideration, and in the
instance of financial hardship, the burden of subsidizing coal companies that would otherwise
file for bankruptcy could be even higher than the costs of closing mines and cutting costs.
From 1990 to 2012, Poland spent $33.8 billion on subsidies and donations targeted at the coal
mining sector (59). The same number of public dollars could be used to build 3 to 4 nuclear
power plants (64), to fund over 3 universities with endowment equal to that of Columbia
University’s (65), or to create twice the number of jobs if the same money were channeled into
the solar industry (51). Moreover, this public spending can increase over time. According to the
projections of the Ministry of Economy, further coal mining sector losses in Poland may reach
an additional $6.5 billion through 2020 (62). Therefore, the key question for policymakers should
be whether or not these losses are justifiable for the society as a whole.
There is no question that coal will remain a major energy source in the coming years. Most of
the projections both for the United States and for Europe suggest this. Although coal’s share of
the energy mix will decrease, it is not expected to be entirely phased out. Therefore, the goal for
existing coal mining companies should be to focus on fostering operational excellence and
financial responsibility.
The Challenges of the U.S. Coal Industry and Lessons for Europe
67
For further exploration into this issue, policymakers might ask the following questions:
Could the Group of Experts on Coal Mine Methane leverage the expertise of the Group
of Experts on Cleaner Electricity Production from Fossil Fuels and work together to
address the challenges facing the coal industry?
How would a future carbon tax further reduce coal demand?
What policies might the next U.S. President enact to support former coal mining
communities, and how might those policies be implemented in UNECE member states?
How might the impact of coal mining job losses on communities be measured, and
similarly, what metrics can be used to track the effectiveness of policies that aim to
support ex-coal mine workers and their communities, including retraining for new
industry roles?
As the global temperature approaches the 20 C threshold, and minimizing further
environmental damage becomes the top priority in both Europe and the United States,
and as the level of environmental regulation rises to reflect this change focus, how would
the mining sector respond to a drastic decline in thermal coal profitability?

The Challenges of the U.S. Coal Industry and Lessons for Europe
68
BIBLIOGRAPHY 1. Lazard. Levelized Cost of Energy Analysis 9.0. s.l. : Lazard, 2015.
2. EPA. Fact Sheet: Clean Power Plan. EPA. [Online] 2016.
https://www.epa.gov/cleanpowerplan/fact-sheet-clean-power-plan-and-role-states.
3. EIA. Natural gas expected to surpass coal in mix of fuel used for U.S. power generation in
2016. EIA. [Online] March 2016. https://www.eia.gov/todayinenergy/detail.cfm?id=25392.
4. Winschel, Richard. US Coal – An Industry in Transition. s.l. : International Pittsburg Coal
Conference, 2015.
5. Aspen Environmental Group. Implications of Greater reliance on Natural Gas for Electricity
Generation. s.l. : Aspen Environmental Group, 2010.
6. IEA. Coal. IEA. [Online] 2016. http://www.iea.org/topics/coal/.
7. Smith, Rebecca. Utilities Give Coal the Heave-Ho. The Wall Street Journal. [Online] April 30,
2012. http://www.wsj.com/articles/SB10001424052702304868004577376311839047378.
8. EIA. Coal production and prices decline in 2015. EIA. [Online] 2016.
https://www.eia.gov/todayinenergy/detail.cfm?id=24472.
9. Sontakke, Mayur. Understanding Arch Coal's acquisition of International Coal Group.
Market Realist. [Online] December 3, 2014. http://marketrealist.com/2014/12/understanding-
arch-coals-acquisition-international-coal-group/.
10. PR Newswire. Arch Coal Reaches Agreement with Senior Lenders to Restructure Balance
Sheet and Reduce Debt. PR Newswire. [Online] January 11, 2016.
ttp://www.prnewswire.com/news-releases/arch-coal-reaches-agreement-with-senior-lenders-
to-restructure-balance-sheet-and-reduce-debt-300202032.html.
11. Erman, Michael. Alpha agrees to buy Massey Energy for about $7.1 billion. euters. [Online]
January 2011. http://www.reuters.com/article/us-alpha-massey-idUSTRE70S0PC20110130.
12. Massey Energy. Creating an Industry Leader. Massey Energy. [Online] January 2011.
http://files.shareholder.com/downloads/ALNR/1175105176x0x437764/ed10bfe3-c992-467f-
b84d-e9693bee0a3e/ANRInvestor_Deck_1-31-11_FINAL_SLIDES_ONLY_.pdf.
13. Klaus, Crifford. Alpha Natural Resources, a Onetime Coal Giant, Files for Bankruptcy
Protection. New York Times. [Online] August 2015.
http://www.nytimes.com/2015/08/04/business/energy-environment/alpha-natural-resources-a-
onetime-coal-giant-files-for-bankruptcy-.
14. Damon, Andre. Second-largest US coal producer files for bankruptcy. World Socialist
Website. [Online] August 2015. https://www.wsws.org/en/articles/2015/08/05/coal-a05.html.
15. Coal Titan Peabody Energy Files for Bankruptcy. Washington Post. [Online] April 2016.
https://www.washingtonpost.com/news/energy-environment/wp/2016/04/13/coal-titan-
peabody-energy-files-for-bankruptcy/.
16. IEA. World Energy Outlook 2015. s.l. : IEA, 2015.
The Challenges of the U.S. Coal Industry and Lessons for Europe
69
17. Birmingham Business Journal. Moving Walter Energy forward: What's next for the
Alabama coal giant? Birmingham Business Journal. [Online] January 20, 2016.
http://www.bizjournals.com/birmingham/news/2016/01/20/moving-walter-energy-forward-
whats-next-for-the.html.
18. chadbourne. The Coal Industry: Emerging Issues in Bankruptcy Cases. chadbourne. [Online]
September 2015.
http://www.chadbourne.com/Coal_Industry_Emerging_Issues_Bankruptcy_Cases_projectfina
nce.
19. Gallucci, Maria. When A Coal Company Goes Bankrupt, Who Is Left To Clean Up The
Mess? IBT. [Online] January 2016. http://www.ibtimes.com/when-coal-company-goes-
bankrupt-who-left-clean-mess-2264097.
20. Cload Peak Energy. Cloud Peak Energy Enters Amendment to Throughput Agreement
with Westshore Terminals to Address Depressed International Conditions. Cloud Peak Energy.
[Online] October 28, 2015. http://investor.cloudpeakenergy.com/press-
release/announcements/cloud-peak-energy-enters-amendment-throughput-agreement-
westshore-termin.
21. Cloud Peak paying to not export coal. Wyoming Business Report. [Online] November 2015.
http://wyomingbusinessreport.com/cloud-peak-paying-to-not-export-coal/.
22. Yahoo. Yahoo Finance. Yahoo. [Online] 2016. http://finance.yahoo.com/.
23. GreenTech Media. NRG CEO David Crane on splitting NRG into “green” and “brown”.
GreenTech Media. [Online] 2015. https://www.greentechmedia.com/articles/read/Solar-
Earnings-Roundup-Trina-SMA-Canadian-Yingli-NRG-and-Vivint-Solar.
24. Cliffs Natural Resources. Annual Report (10-K). s.l. : Cliffs Natural Resources, 2014.
25. EIA. Major U.S. Coal Producers in 2014. EIA. [Online] 2015.
https://www.eia.gov/coal/annual/pdf/table10.pdf.
26. Westmoreland Coal. Annual Report (10-K). s.l. : Westmoreland Coal, 2014.
27. BHP Billiton. Annual Report (10-K). s.l. : BHP Billiton, 2014.
28. NACCO Ind. Annual Report (10-K). s.l. : NACCO Ind., 2014.
29. Energy Future Holdings. Restructuring. Energy Future Holdings. [Online] 2015.
https://www.energyfutureholdings.com/restructuring/.
30. Energy Fuure Holdings. Annual Report (10-K). s.l. : Energy Future Holdings, 2014.
31. Consol Energy. Annual Report (10-K). s.l. : Consol Energy, 2014.
32. Einhorn, David. Frack Me. s.l. : Greenlight Capital, 2015.
33. EIA. Coalbed Methane Production. [Online] 2016.
https://www.eia.gov/dnav/ng/ng_prod_coalbed_s1_a.htm.
34. Center for Responsive Politics. Center for Responsive Politics. [Online] 2016. opensecrets.com.
35. CIBC Commodities. Energy and the U.S. Election: Electoral Impacts of Energy Trends. s.l. : CIBC
Commodities, 2012.
36. EIA. Natural Gas, Coal, and Crude Oil Annual Data. s.l. : EIA, 2016.
The Challenges of the U.S. Coal Industry and Lessons for Europe
70
37. Kennedy, Brian. Public support for environmental regulations varies by state. Pew Research
Center. [Online] February 25, 2016. http://www.pewresearch.org/fact-tank/2016/02/25/public-
support-for-environmental-regulations-varies-by-state/.
38. Pew Research. Public Puts Priority on Developing Alternative Energy Sources. Pew
Research. [Online] March 12, 2013. http://www.pewresearch.org/daily-number/public-puts-
priority-on-developing-alternative-energy-sources/.
39. Drake, Bruce. Obama vs. the Republicans on environmental issues: How the public views
them. Pew Research Center. [Online] November 13, 2014. http://www.pewresearch.org/fact-
tank/2014/11/13/obama-vs-the-republicans-on-environmental-issues-how-the-public-views-
them/.
40. EIA. Annual Coal Report. s.l. : EIA, 2016.
41. Konty Fry, Melissa. The Impact of Coal on the Kentucky State Budget. s.l. : Mountain
Association for Community Economic Development, 2009.
42. Kowalski, Kathleen M. The Evolving Mining Workforce: Training Issues. s.l. : National
Institute for Occupational Safety and Health Pittsburgh Research Laboratory, 2006.
43. NMA. Annual Coal Mining Wages vs. All Industries. s.l. : NMA, 2013.
44. MACED. Promoting Long-term Investments in Appalachian Kentucky: a Permanent Coal
Severance Tax Fund. s.l. : Mountain Association for Community Economic Development, 2012.
45. WV Department of Health and Human Resources Bureau. The McDowell County Behavioral
Health Epidemiological County Profile. s.l. : WV Department of Health and Human Resources
Bureau, 2014.
46. Chatman, Jay. McDowell County Coal and Rail. s.l. : Arcadia Publishing, 2014.
47. Johnson, Kimberly. As coal fades in West Virginia, drugs fill void. s.l. : Al Jazeera America,
2014.
48. EIA. Coal mining productivity & employees by state and mine type. EIA. [Online] 2016.
http://www.eia.gov/coal/data.cfm#production.
49. Ciaran, John. The Average Hourly Wages in the Natural Gas Field. Chron. [Online] 2016.
http://work.chron.com/average-hourly-wages-natural-gas-field-2815.html.
50. Heintz, James. How Infrastructure Investments Support the U.S. Economy: Employment,
Productivity and Growth. s.l. : Political Economy Research Institute, 2009.
51. Sightline. The Reality of Coal Mining Jobs. Sightline Institute. [Online] November 29, 2012.
http://www.sightline.org/2012/11/29/the-reality-of-coal-mining-jobs/.
52. The Solar Foundation. Fact Sheet. The Solar Foundation. [Online] 2015.
http://www.thesolarfoundation.org/wp-content/uploads/2016/01/2015Census-Factsheet-
FINAL1-12-16.pdf.
53. KCEP. Investing in a Future for Appalachian Kentucky: The Coal Severance Tax. s.l. : Kentucky
Center for Economic Policy, 2013.
54. European Commission. The EU Emissions Trading System (EU ETS). s.l. : European
Commission, 2013.
55. GIE. Knowledge Center: Figures. [Online] 2016. http://www.gie.eu/KC/generalfigures.html.

The Challenges of the U.S. Coal Industry and Lessons for Europe
71
56. Polityka Insight. Górnicy: Szanowani Jak Profesorzy. Polityka Insight. [Online] January 16,
2015. http://zasoby.politykainsight.pl/politykainsight.pl/public-analyses/150116-gornicy.html.
57. CBOS. Prestiż Zawodów. s.l. : CBOS, 2013.
58. GUS. Wstępne szacunki: produkt krajowy brutto według województw w 2014 r. s.l. : GUS, 2016.
59. Śniegocki, Aleksander. Polski Węgiel: Quo Vadis? Perspektywy Polskiego Górnictwa Węgla
Kamiennego do 2050 r. s.l. : WISE Europe, 2015.
60. European Commission. Eurobarometer. s.l. : European Commission, 2012.
61. McKinsey & Company. 5 Zadań dla Polski. s.l. : McKinsey & Company, 2015.
62. MG. Program Naprawczy Kompanii Węglowej. s.l. : Ministerstwo Gospodarki, 2015.
63. Boersma, Tim. Four Questions on Shale Gas Development in Europe and the U.S. Brookings.
[Online] November 18, 2013. http://www.brookings.edu/research/opinions/2013/11/15-shale-
gas-oil-boom-europe-boersma.
64. UCS. Nuclear Power Cost. s.l. : Union of Concerned Scientists, 2016.
65. Columbia University. Endowment Data. s.l. : Columbia University, 2016.
66. EIA. Natural gas expected to surpass coal in mix of fuel used for U.S. power generation in
2016, US Energy Information Administration. EIA. [Online] March 2016.
https://www.eia.gov/todayinenergy/detail.cfm?id=25392.
67. —. AEO2014 projects more coal-fired power plant retirements by 2016 than have been
scheduled. EIA. [Online] February 2014.
https://www.eia.gov/todayinenergy/detail.cfm?id=15031.
68. Sontakke, Mayur. Understanding consolidation in the US coal industry. Market Realist.
[Online] December 3, 2014. http://marketrealist.com/2014/12/understanding-consolidation-us-
coal-industry/.
69. Mooney, Chris. How coal titan Peabody, the world's largest, fell into bankruptcy. The
Washington Post. [Online] April 13, 2016. https://www.washingtonpost.com/news/energy-
environment/wp/2016/04/13/coal-titan-peabody-energy-files-for-bankruptcy/.
70. U.S. Courts. Chapter 11 - Bankruptcy Basics. U.S. Courts. [Online] 2016.
http://www.uscourts.gov/services-forms/bankruptcy/bankruptcy-basics/chapter-11-
bankruptcy-basics.
71. Christie, Jim. Bankrupt Walter Energy gets nod from judge to end labor pacts. Reuters.
[Online] December 29, 2015. http://www.reuters.com/article/us-walter-energy-bankruptcy-
idUSKBN0UC1O020151229.
72. Walter Energy. Annual Report (10-K). s.l. : Walter Energy, 2014.
73. Dugan, Andrew. Americans Choose the Environment Over Energy Development. Gallup.
[Online] April 13, 2015. http://www.gallup.com/poll/182402/americans-choose-environment-
energy-development.aspx?g_source=coal&g_medium=search&g_campaign=tiles.
74. Hillary Clinton. Hillary Clinton’s Plan for Revitalizing Coal Communities. Hillary Clinton.
[Online] 2016. https://www.hillaryclinton.com/briefing/factsheets/2015/11/12/clinton-plan-to-
revitalize-coal-communities/.
75. Peabody. Annual Report (10-K). s.l. : Peabody, 2014.

The Challenges of the U.S. Coal Industry and Lessons for Europe
72
76. —. Annual Report (10-K). s.l. : Peabody, 2013.
77. Arch Coal. Annual Report (10-K). s.l. : Arch Coal, 2013.
78. Cloud Peak Energy. Annual Report (10-K). s.l. : Cloud Peak Energy, 2013.
79. —. Annual Report (10-K). s.l. : Cloud Peak Energy, 2014.
80. Alpha Natural Resources. Annual Report (10-K). s.l. : Alpha Natural Resources, 2013.
81. —. Annual Report (10-K). s.l. : Alpha Natural Resources, 2014.
82. Alliance Resource. Annual Report (10-K). s.l. : Alliance Resource, 2013.
83. —. Annual Report (10-K). s.l. : Alliance Resource, 2014.
84. Westmoreland Coal. Annual Report (10-K). s.l. : Westmoreland Coal, 2013.
85. Consol Energy. Annual Report (10-K). s.l. : Consol Energy, 2013.
86. NACCO Ind. Annual Report (10-K). s.l. : NACCO Ind., 2013.
87. Energy Future Holdings. Annual Report (10-K). s.l. : Energy Future Holdings, 2013.
88. Armstrong Energy. Annual Report (10-K). s.l. : Armstrong Energy, 2013.
89. —. Annual Report (10-K). s.l. : Armstrong Energy, 2014.
90. Walter Energy. Annual Report (10-K). s.l. : Walter Energy, 2013.
91. BHP Billiton. Annual Report (10-K). s.l. : BHP Billiton, 2013.
92. Cliffs Natural Resources. Annual Report (10-K). s.l. : Cliffs Natural Resources, 2013.
93. Arch Coal. Annual Report (10-K). s.l. : Arch Coal, 2014.
94. NMA. Annual Coal Mining Wages v. All Industries, 2013. National Mining Association.
[Online] July 2014. http://www.nma.org/pdf/c_wages_state_industries.pdf.
95. EIA. Henry Hub Natural Gas Spot Price. EIA. [Online] 2016.
https://www.eia.gov/dnav/ng/hist/rngwhhdA.htm.
96. —. Short-Term Energy Outlook. [Online] May 10, 2016. [Cited: May 10, 2016.]
https://www.eia.gov/forecasts/steo/report/coal.cfm.