Embed Size (px)
Citation preview
RESEARCH ARTICLE
The challenges of reducing greenhouse gas emissions and airpollution through energy sources: evidence from a panelof developed countries
Ghulam Akhmat & Khalid Zaman & Tan Shukui &Faiza Sajjad & Muhammad Azhar Khan &
Muhammad Zahir Khan
Received: 28 January 2014 /Accepted: 20 February 2014 /Published online: 4 March 2014# Springer-Verlag Berlin Heidelberg 2014
Abstract The objective of the study is to investigate the long-run relationship between climatic factors (i.e., greenhouse gasemissions, agricultural methane emissions, and industrial ni-trous oxide emission), air pollution (i.e., carbon dioxide emis-sions), and energy sources (i.e., nuclear energy; oil, gas, andcoal energy; and fossil fuel energy) in the panel of 35 devel-oped countries (including EU-15, new EU member states,G-7, and other countries) over a period of 1975–2012. Inorder to achieve this objective, the present study uses sophis-ticated panel econometric techniques including panelcointegration, panel fully modified OLS (FMOLS), and dy-namic OLS (DOLS). The results show that there is a long-runrelationship between the variables. Nuclear energy reduces
greenhouse gases and carbon emissions; however, the otheremissions, i.e., agricultural methane emissions and industrialnitrous oxide, are still to increase during the study period.Electricity production from oil, gas, and coal sources increasesthe greenhouse gases and carbon emissions; however, theintensity to increase emissions is far less than the intensity toincrease emissions through fossil fuel. Policies that reduceemissions of greenhouse gases can simultaneously alter emis-sions of conventional pollutants that have deleterious effectson human health and the environment.
Keywords Greenhouse gases . Carbon dioxide emissions .
Methane emissions . Industrial nitrous oxide emissions .
Nuclear energy . Fossil fuel . Developed countries
Introduction
Among the many challenges the world is facing in the earlytwenty-first century, climate change remains one of the majorproblems. According to the IPCC (2007), the biophysicalchanges resulting from a global warming of more than 3 °Cwould trigger increasingly negative impacts in all climatesensitive sectors in the developing regions. Currently, nucleargeneration avoids the emission of over two billion tonnes ofcarbon dioxide each year. It is recognized as a crucial mitiga-tion technology, and many countries are planning to usenuclear generation to meet their emission reduction and ener-gy supply objectives (WNN 2013).
In the electricity sector, nuclear power has been assessed ashaving the greatest potential (i.e., 1.88 Gt CO2 equivalent) tomitigate greenhouse gas (GHG) emissions at the lowest cost,i.e., 50 % of the potential at negative costs due to co-benefitsfrom reduced air pollution, the other 50 % at less than $20/tCO2 equivalent. Nuclear energy could account for about 15 %
Responsible editor: Michael Matthies
G. Akhmat : T. Shukui (*)College of Public Administration, Huazhong University of Scienceand Technology (HUST), 1037, Luoyu Road, Wuhan, People’sRepublic of Chinae-mail: [email protected]
G. Akhmate-mail: [email protected]
K. Zaman : F. SajjadDepartment of Management Sciences, COMSATS Institute ofInformation Technology, Abbottabad, Pakistan
K. Zamane-mail: [email protected]
F. Sajjade-mail: [email protected]
M. A. KhanDepartment of Economics, University of Haripur, KhyberPakhtunkhwa, Pakistane-mail: [email protected]
M. Z. KhanIslamia University of Bahawalpur, Bahawalpur, Pakistan
Environ Sci Pollut Res (2014) 21:7425–7435DOI 10.1007/s11356-014-2693-2
of the total GHG reduction in electricity generation by 2050(IAEA 2012). Modern industrial agriculture of the “GreenRevolution” contributes a great deal to climate change. It isthe main source of the potent greenhouse gases nitrous oxideand methane; it is heavily dependent on the use of fossil fuelsand contributes to the loss of soil carbon to the atmosphere,especially through deforestation to make more land availablefor crops and plantations (Goldsmith 2004).
Climate protection issues and the Kyoto Protocol of 12December 1997 have profoundly affected European energypolicy. The European Union signed the protocol and has alsoratified it. In accordance with the protocol, the EuropeanUnion-15 (EU-15) has undertaken to reduce emissions of thesix chief greenhouse gases by a total of 8 % in the period from1990 to 2008/2012. In 1998, as part of the concluded burden-sharing agreement, this undertaking was divided very uneven-ly among the member states. Eight of the 10 states thatacceded to the European Union (EU) on 1 May 2004 havealso given an undertaking to lower their GHG emissions inline with the Kyoto Protocol. The reduction commitmentsamount to 6 % for two and 8 % for six of these states, eachrelative to the base period (OECD/IEA 2005). Around 11% ofthe greenhouse gases emitted worldwide each year comesfrom within the EU. The EU’s share of global emissions isfalling as Europe reduces its own emissions and as those fromother parts of the world, especially the major emerging econ-omies, continues to grow (EUROPA 2014).
There is an ample and robust scientific evidence that atpresent rates, Europe’s emissions to the atmosphere pose asignificant threat to human health, ecosystems, and the globalclimate, though in a less visible and immediate way. Scientiststheorize that an increase in the greenhouse gases translatedinto increased temperatures around the globe, which wouldresult in many disastrous environmental effects (Natural Gas2011). According to Pongsoi and Wongwises (2013, p. 586),
The search for energy sets nuclear power as the highestpriority for generating electricity. The need to delayglobal warming initiated a nuclear power plant using anuclear reactor as its source of thermal energy to gener-ate pollution-free electrical currents.
Rao et al. (2013) address the current policies on air pollu-tion, climate change, and access to clean cooking fuels whichmay effectively reduce both outdoor and household air pollu-tion and improve human health. The results are presented for2030 for a set of policy scenarios on air pollution, climatechange, and energy access and include spatially explicit emis-sions of air pollutants, ambient concentrations of PM2.5, andhealth impacts in terms of disability adjusted life years fromboth ambient and household air pollution. The results stressthe importance of enforcing current worldwide air qualitylegislation in addressing the impacts of outdoor air pollution.Hong et al. (2013) used multi-criteria decision-making
analysis (MCDMA) to assess the potential negative economic,environmental, and social impacts to determine most holisti-cally minimize adverse future outcomes. The results indicatethat the nuclear-free pathway has the highest overall potentialfor adverse outcomes (score=2.49 out of 3), and the 35 %nuclear power supply option yielding the lowest negativeimpact score (0.74) without weightings. Akhmet et al.(2014) examine the relationship between energy consumptionand environmental pollutants in selected SAARC countriesover the period of 1975–2011. The results indicate that energyconsumption acts as an important driver to increase environ-mental pollutants in SAARC countries. Variance decomposi-tion analysis shows that among all the environmental indica-tors, CO2 in Bangladesh and Nepal exerts the largest contri-bution to changes in electric power consumption. Sablier andGarrigues (2013) opine that the study of the effects of atmo-spheric pollution on architectural and artistic works, especiallyon those of great historical and cultural importance, has be-come more widespread in the scientific community in the lastfew years. Viable airborne organisms are not necessarily airpollutants; however, they should at least be considered asfactors affecting air quality.
Bird et al. (2014) assess the public opinion regardingnuclear power in the context of climate change and documentwhether or not the nuclear meltdown at the FukushimaDaiichipower plant in Japan changed these views. For this purpose,online questionnaires were administered during March 2010and February 2012. The comparative analysis reveals thatfewer Australians in 2012 viewed nuclear power as a satisfac-tory option for electricity production than in 2010. Moreover,fewer Australians in 2012 were willing to accept the buildingof nuclear power stations even if this would help tackleclimate change. Khan et al. (2013) investigate the causalrelationship between greenhouse gas emissions, economicgrowth per unit of energy use, and energy consumption inPakistan over a 36-year time period, i.e., between 1975 and2011. The results suggest that energy consumption acts as animportant driver for an increase in greenhouse gas emissionsin Pakistan. In addition, causality runs from energy consump-tion to greenhouse gas emissions but not vice versa. Followedto the previous study, Khan et al. (2014) re-examine the long-run relationship between energy consumption and greenhousegas emission in the world’s largest regions over a period of1975 to 2011. The results confirm that there is a long-runrelationship between greenhouse gas emissions (i.e., agricul-tural methane emission, agricultural nitrous oxide emission,and carbon dioxide emission) and energy consumption. Inaddition, Granger causality indicates that energy consumptionGranger causes greenhouse gas emission but not vice versa.Varotsos et al. (2013) investigate the local and regional oxi-dants concentration at Athens, Greece, obtained at an urbanand a rural station during 2001–2011 and 2007–2011, respec-tively. The progressive increase of the daytime and nighttime
7426 Environ Sci Pollut Res (2014) 21:7425–7435
average of [NO2]/[Ox] versus [NOx] is observed showing alarger proportion of Ox in the form of NO2 when the level ofNOx increases.
Li and Chen (2013) presented the comprehensive review ofenergy consumption as well as GHG emissions for Macao,China. The results show that theMacao’s energy consumptionand its related GHG emissions were 32,700 terajoules (Tj) and3.70E+06 t CO2 e. in 2010 increased by 31.10 and 100.34 %over those of 2000, respectively. The results further indicatethat electricity is the biggest contributor to GHG emissionsand induced a large amount of GHG emissions in other places.Mudakkar et al. (2013) investigate the causal relationshipbetween energy sources, economic growth, industrialization,environmental degradation, and resource depletion in Pakistanover a period of 1975–2011. The results indicate the unidirec-tional causality running from nuclear energy to industrialGDP, nuclear energy to water resources, and nuclear energyto carbon dioxide emissions but not vice versa. Similarly,electric power consumption Granger causes agriculture GDPbut not other way around; further, there is a bidirectionalcausality running between electric power consumption topopulation density in Pakistan. Fossil fuel Granger causesindustrial GDP, and there is a bidirectional causality runningbetween fossil fuel and population density. Sario et al. (2013)concluded that due to climate change, air pollution patterns arechanging in several urbanized areas of the world, with asignificant effect on respiratory health both independentlyand synergistically with weather conditions; climate scenariosshow Europe as one of the most vulnerable regions. Jumaet al. (2014) investigate the effect of population growth,economic development, and unplanned catchment manage-ment on water quality of Lake Victoria between 1990 and2012. The use of old dilapidated and inappropriate technolo-gies, poor maintenance of treatment plants, lack of wastetreatment, and disposal mechanisms has resulted in the dete-rioration of water quality of the lake.
Lim and Lam (2014) adopted to-date data from GreenTechMalaysia in order to present the Clean Development Mecha-nism (CDM) projects in the energy sector. The results con-clude that CDM appears to be a catalyst to reduce the cost ofrenewable energy projects in Malaysia. Carbon credit gainedfrom developed countries enhances financial states of thenation and potentially pushes forward renewable energy in-dustries. Akhmet and Zaman (2013) investigate the causalrelationship among nuclear energy consumption, commercialenergy consumption, and economic growth in selected SouthAsian countries over the period of 1975 to 2010. The resultsindicate that nuclear energy consumption Granger causeseconomic growth in Nepal and Pakistan. The nature of cau-sality between nuclear energy consumption and economicgrowth and commercial energy consumption and economicgrowth is in favor of the neutrality hypothesis in most of thecountries. Calbick and Gunton (2014) assessed the reasons for
observed differences in greenhouse gas (GHG) emissionsamong high-income OECD countries. The results show thatenergy prices, economic output per capita, and environmentalgovernance are the most important factors for explainingdifferences in OECD per capita GHG emissions. Combined,these three factors explain about 81 % of the variation ob-served in OECD per capita GHG emissions. Individually,energy prices explain about 55 % of the variation in per capitaGHG emissions, while economic output per capita explainsabout 19 % and environmental governance about 7 %. Zamanet al. (2013a) investigate the influence of agricultural technol-ogies on carbon emissions in Pakistan by using annual datafrom 1975 to 2010. The results show that agricultural tech-nologies are closely associated with economic growth andcarbon emissions in Pakistan. Variance decomposition analy-sis shows that among all the agricultural technologies,granting subsidies to the agriculture sector have exerted thelargest contribution to changes in carbon emissions. In anotherstudy, Zaman et al. (2013b) empirically examine the impact ofcarbon dioxide emission and arable land on specific growthfactors in Pakistan over a period of 1975–2009. The resultsconcluded that economic growth and industrialization bothhave significant contributors to stimulate carbon emissions inPakistan’s economy. Tsai (2014) examines the relationshipbetween energy consumption and CO2 emissions in Taiwanduring 2000–2009. The results indicate that the total amountof electricity generation from wind and photovoltaic powersignificantly increased from 1,503 MWh in 2000 to794,668 MWh in 2009. The energy intensity also is revealedto be on a decreasing trend during the period.
The above discussion confirms the strong relationship be-tween greenhouse gas emission, air pollution, and energysources. The present study takes an incentive to explore thelong-run relationship between the climatic factors, air pollu-tion, and energy sources in the panel of developed countries.The study is divided into the following sections: “Introduc-tion”, “Data source and methodological framework”, “Re-sults”, and “Conclusion”.
Data source and methodological framework
The data set for developed economies is collected fromWorldDevelopment Indicators published by World Bank (2013).The dependent and independent variables used in this studyare listed in Table 1. Energy sources contain fossil fuel,nuclear energy, and electricity production from oil, gas, andcoal sources are used as a dependent variable, while climaticfactors (i.e., greenhouse gas emissions, agricultural methaneemissions, and industrial nitrous oxide emission) and air pol-lution (i.e., carbon dioxide emissions) served as explanatoryvariables in this study.
Environ Sci Pollut Res (2014) 21:7425–7435 7427

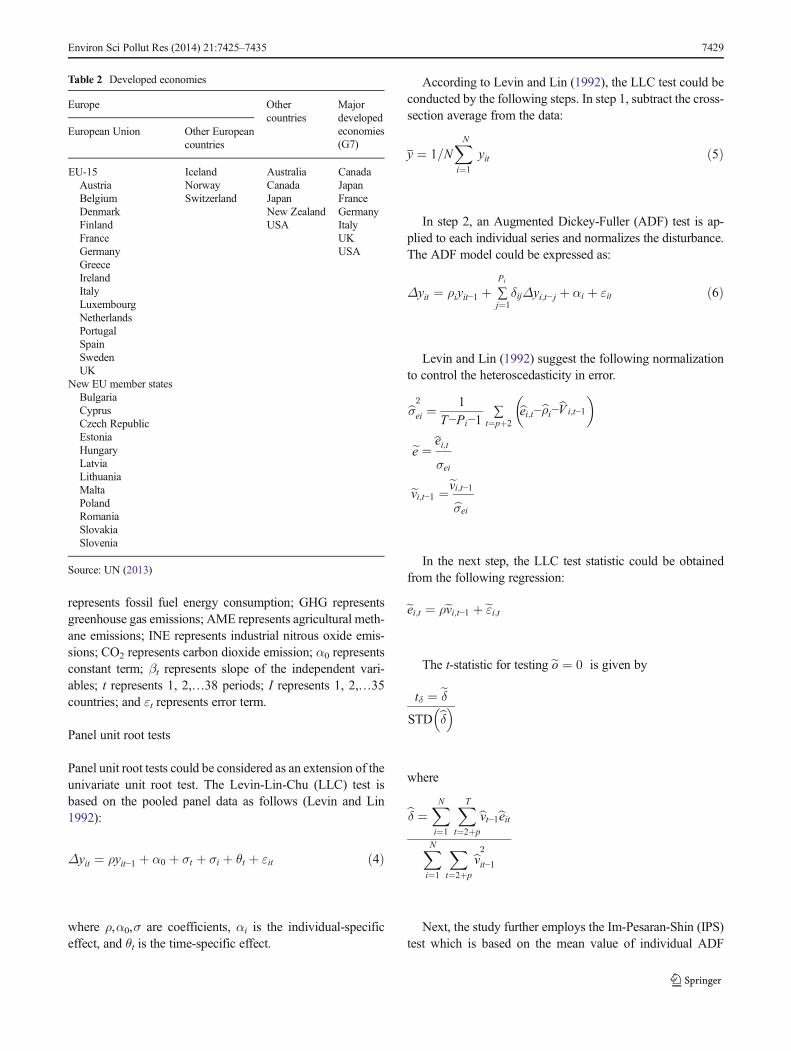
There is a lack of panel cointegration to explain the rela-tionship among climatic factors; energy sources and air pol-lution in the panel of 35 developed countries consist of EU-15,new EU member states, other countries, and G7 countries.Table 2 shows the list of the developed economies being usedin this study.
Panel econometric model
This study uses panel cointegration analysis to test this rela-tionship over a period of 1975–2012. The model used to testthe relationship between energy sources, climatic factors, andair pollution are as follows:
ln ENRGMIXð Þ ¼ f ln CLIMFACTð Þ; ln AIRPOLð Þ½ �
where ENRGMIX represents energy mix variables,CLIMFACT represents climatic factors, and AIRPOL repre-sents air pollution.
The general representation of the equation mentionedabove is as follows:
Model 1: Nuclear energy, greenhouse gas emissions, and airpollution
ln NUCLEARð Þt ¼ α0 þ α1ln GHGð Þ þ α2ln AMEð Þtþ α3ln INEð Þt þ α4ln CO2ð Þ þ εt
ð1Þ
Model 2: Oil, gas, and coal sources of energy; greenhousegas emissions; and air pollution
ln OGCð Þt ¼ α0 þ α1ln GHGð Þ þ α2ln AMEð Þtþ α3ln INEð Þt þ α4ln CO2ð Þ þ εt
ð2Þ
Model 3: Fossil fuel, greenhouse gas emissions, and airpollution
ln FOSSILð Þt ¼ α0 þ α1ln GHGð Þ þ α2ln AMEð Þtþ α3ln INEð Þt þ α4ln CO2ð Þ þ εt
ð3Þ
where NUCLEAR represents nuclear energy; OGC representselectricity production from oil, gas, and coal sources; FOSSIL
Table 1 List of variables
Variables Measurement Description Data source
Dependent variable: energy mix
Electricity production from nuclearsources (NUCLEAR)
Kilowatt hour (kWh) Nuclear power refers to electricityproduced by nuclear power plants
World Bank (2013)
Electricity production from oil,gas, and coal sources (OGC)
Percentage of total Oil refers to crude oil and petroleumproducts. Gas refers to natural gasbut excludes natural gas liquids. Coalrefers to all coal and brown coal, bothprimary (including hard coal andlignite-brown coal) and derived fuels(including patent fuel, coke oven coke,gas coke, coke oven gas, and blastfurnace gas)
World Bank (2013)
Fossil fuel energy consumption (FOSSIL) Percentage of total Fossil fuel comprises coal, oil, petroleum,and natural gas products
World Bank (2013)
Independent variables
Greenhouse gas net emissions (GHG) Million ton of carbondioxide equivalent
Changes in atmospheric levels of all greenhousegases attributable to forest and land-usechange activities
World Bank (2013)
Agricultural methane emissions (AME) Thousand metric tonsof carbon dioxideequivalent
Emissions from animals, animal waste, riceproduction, agricultural waste burning(nonenergy and on-site), and savannahburning
World Bank (2013)
Industrial nitrous oxide emissions (INE) Thousand metric tonsof carbon dioxideequivalent
Emissions produced during the manufacturingof adipic acid and nitric acid
World Bank (2013)
Carbon dioxide emissions fromelectricity and heat production,total (CO2)
Million metric tons Sum of emissions from main activity producerelectricity generation, combined heat andpower generation, and heat plants
World Bank (2013)
7428 Environ Sci Pollut Res (2014) 21:7425–7435
represents fossil fuel energy consumption; GHG representsgreenhouse gas emissions; AME represents agricultural meth-ane emissions; INE represents industrial nitrous oxide emis-sions; CO2 represents carbon dioxide emission; α0 representsconstant term; βt represents slope of the independent vari-ables; t represents 1, 2,…38 periods; I represents 1, 2,…35countries; and εt represents error term.
Panel unit root tests
Panel unit root tests could be considered as an extension of theunivariate unit root test. The Levin-Lin-Chu (LLC) test isbased on the pooled panel data as follows (Levin and Lin1992):
Δyit ¼ ρyit−1 þ α0 þ σt þ σi þ θt þ εit ð4Þ
where ρ,α0,σ are coefficients, αi is the individual-specificeffect, and θt is the time-specific effect.
According to Levin and Lin (1992), the LLC test could beconducted by the following steps. In step 1, subtract the cross-section average from the data:
y ¼ 1=NXi¼1
N
yit ð5Þ
In step 2, an Augmented Dickey-Fuller (ADF) test is ap-plied to each individual series and normalizes the disturbance.The ADF model could be expressed as:
Δyit ¼ ρiyit−1 þ ∑j¼1
Pi
δijΔyi;t− j þ αi þ εit ð6Þ
Levin and Lin (1992) suggest the following normalizationto control the heteroscedasticity in error.
bσ2
ei ¼1
T−Pi−1∑
t¼pþ2bei;t−bρi−bV i;t−1
� �
ee ¼ bei;tσei
evi;t−1 ¼evi;t−1bσei
In the next step, the LLC test statistic could be obtainedfrom the following regression:
eei;t ¼ ρevi;t−1 þ eεi;t
The t-statistic for testing eo ¼ 0 is given by
tδ ¼ eδSTD bδ� �
where
bδ ¼Xi¼1
N Xt¼2þp
T bvt−1beitXi¼1
N Xt¼2þp
bv2it−1
Next, the study further employs the Im-Pesaran-Shin (IPS)test which is based on the mean value of individual ADF
Table 2 Developed economies
Europe Othercountries
Majordevelopedeconomies(G7)
European Union Other Europeancountries
EU-15AustriaBelgiumDenmarkFinlandFranceGermanyGreeceIrelandItalyLuxembourgNetherlandsPortugalSpainSwedenUK
IcelandNorwaySwitzerland
AustraliaCanadaJapanNew ZealandUSA
CanadaJapanFranceGermanyItalyUKUSA
New EU member statesBulgariaCyprusCzech RepublicEstoniaHungaryLatviaLithuaniaMaltaPolandRomaniaSlovakiaSlovenia
Source: UN (2013)
Environ Sci Pollut Res (2014) 21:7425–7435 7429
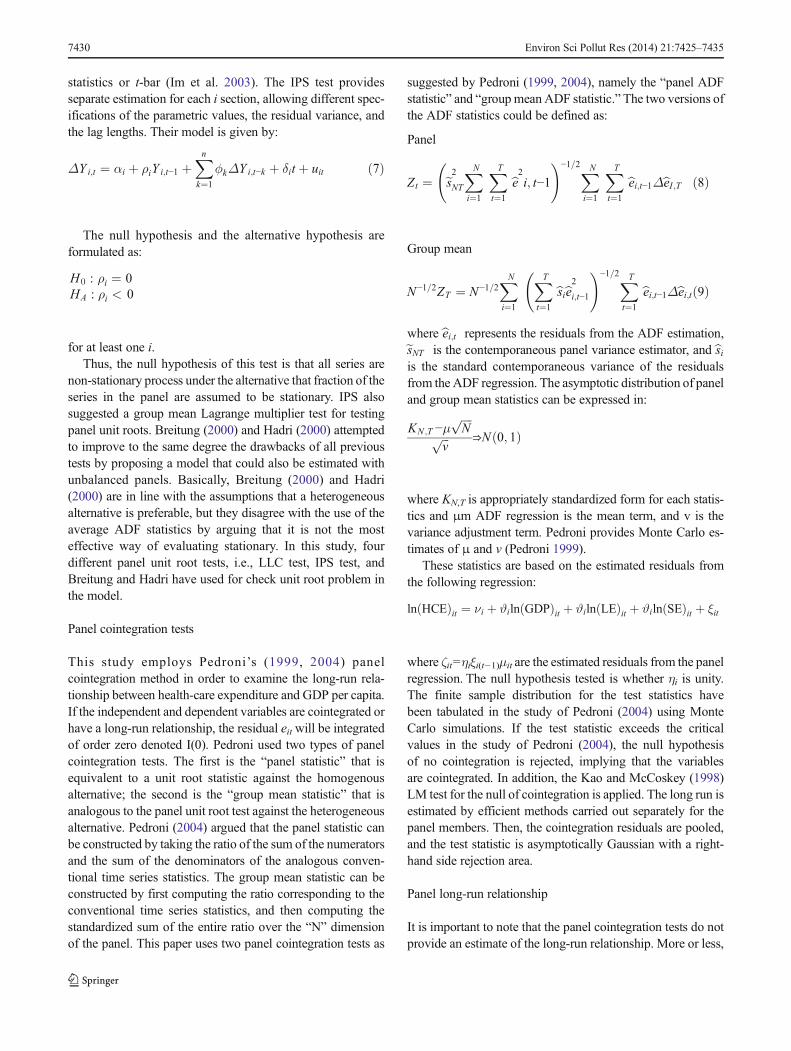
statistics or t-bar (Im et al. 2003). The IPS test providesseparate estimation for each i section, allowing different spec-ifications of the parametric values, the residual variance, andthe lag lengths. Their model is given by:
ΔY i;t ¼ αi þ ρiY i;t−1 þXk¼1
n
ϕkΔY i;t−k þ δit þ uit ð7Þ
The null hypothesis and the alternative hypothesis areformulated as:
H0 : ρi ¼ 0HA : ρi < 0
for at least one i.Thus, the null hypothesis of this test is that all series are
non-stationary process under the alternative that fraction of theseries in the panel are assumed to be stationary. IPS alsosuggested a group mean Lagrange multiplier test for testingpanel unit roots. Breitung (2000) and Hadri (2000) attemptedto improve to the same degree the drawbacks of all previoustests by proposing a model that could also be estimated withunbalanced panels. Basically, Breitung (2000) and Hadri(2000) are in line with the assumptions that a heterogeneousalternative is preferable, but they disagree with the use of theaverage ADF statistics by arguing that it is not the mosteffective way of evaluating stationary. In this study, fourdifferent panel unit root tests, i.e., LLC test, IPS test, andBreitung and Hadri have used for check unit root problem inthe model.
Panel cointegration tests
This study employs Pedroni’s (1999, 2004) panelcointegration method in order to examine the long-run rela-tionship between health-care expenditure and GDP per capita.If the independent and dependent variables are cointegrated orhave a long-run relationship, the residual eit will be integratedof order zero denoted I(0). Pedroni used two types of panelcointegration tests. The first is the “panel statistic” that isequivalent to a unit root statistic against the homogenousalternative; the second is the “group mean statistic” that isanalogous to the panel unit root test against the heterogeneousalternative. Pedroni (2004) argued that the panel statistic canbe constructed by taking the ratio of the sum of the numeratorsand the sum of the denominators of the analogous conven-tional time series statistics. The group mean statistic can beconstructed by first computing the ratio corresponding to theconventional time series statistics, and then computing thestandardized sum of the entire ratio over the “N” dimensionof the panel. This paper uses two panel cointegration tests as
suggested by Pedroni (1999, 2004), namely the “panel ADFstatistic” and “groupmeanADF statistic.” The two versions ofthe ADF statistics could be defined as:
Panel
Zt ¼ es2NTXi¼1
N Xt¼1
T be2i; t−1 !−1=2X
i¼1
N Xt¼1
T bei;t−1ΔbeI ;T ð8Þ
Group mean
N−1=2ZT ¼ N−1=2Xi¼1
N Xt¼1
T bsibe2i;t−1 !−1=2X
t¼1
T bei;t−1Δbei;tð9Þwhere bei;t represents the residuals from the ADF estimation,esNT is the contemporaneous panel variance estimator, and bsiis the standard contemporaneous variance of the residualsfrom the ADF regression. The asymptotic distribution of paneland group mean statistics can be expressed in:
KN ;T −μffiffiffiffiN
pffiffiffiv
p ⇒N 0; 1ð Þ
where KN,T is appropriately standardized form for each statis-tics and μm ADF regression is the mean term, and v is thevariance adjustment term. Pedroni provides Monte Carlo es-timates of μ and v (Pedroni 1999).
These statistics are based on the estimated residuals fromthe following regression:
ln HCEð Þit ¼ νi þ ϑiln GDPð Þit þ ϑiln LEð Þit þ ϑiln SEð Þit þ ξit
where ζit=ηiξi(t−1)μit are the estimated residuals from the panelregression. The null hypothesis tested is whether ηi is unity.The finite sample distribution for the test statistics havebeen tabulated in the study of Pedroni (2004) using MonteCarlo simulations. If the test statistic exceeds the criticalvalues in the study of Pedroni (2004), the null hypothesisof no cointegration is rejected, implying that the variablesare cointegrated. In addition, the Kao and McCoskey (1998)LM test for the null of cointegration is applied. The long run isestimated by efficient methods carried out separately for thepanel members. Then, the cointegration residuals are pooled,and the test statistic is asymptotically Gaussian with a right-hand side rejection area.
Panel long-run relationship
It is important to note that the panel cointegration tests do notprovide an estimate of the long-run relationship. More or less,
7430 Environ Sci Pollut Res (2014) 21:7425–7435

the cointegration vector should be common for the panelmembers, as fundamental economic principles are involved.Also, hypothesis testing is a critical issue. In fact, the asymp-totic distribution of the OLS estimator depends on nuisanceparameters. In a panel environment, this problem seems to bemore serious, as the bias can accumulate with the size of thecross-section. To overcome these deficits, efficient methodslike fully modified (FMOLS) and dynamic OLS (DOLS) arerequired. As these techniques control for potentialendogeneity of the repressors and serial correlation, asymp-totically unbiased estimates of the long run can be obtained.The methods are asymptotically equivalent (Banerjee 1999).Hence, their relative merits boil down to a comparison in finitesamples. In the FMOLS case, nonparametric techniques areused to transform the residuals from the cointegration regres-sion and get rid of nuisance parameters (Phillips 1995;Pedroni 2001). In the time series model,
yit ¼ αi þ βixit þ uitxit ¼ xit−1 þ εit;ϖit ¼ uit; εitð Þ0 ð10Þ
The asymptotic distribution of the OLS estimator is condi-tioned to the long-run covariance matrix of the joint residualprocess. The FMOLS estimator for the ith panel member isgiven by
bβ*¼ Xi0Xið Þ−1 X i
0yi*−Tbδ� �
ð11Þ
where y* is the transformed endogenous variable and δ is aparameter for autocorrelation adjustment. Appropriate correc-tion factors are based on certain sub-matrices of the joint long-run covariance matrix.
In the DOLS framework, the long-run regression is aug-mented by lead and lagged differences of the explanatoryvariables to control for endogenous feedback (Saikkonen1991). Lead and lagged differences of the dependent variablecan be included to account for serial correlation (see Stock andWatson 1993). In particular, the equation
yit ¼ αi þ βixit þΣp2j¼p−1δ jΔyit þΣq2
j¼q−1λ jΔxit− j þ uit
ð12Þ
is run for the ith panel member, where the appropriate choiceof leads and lags is based on data-dependent criteria(Westerlund 2003). Standard errors are computed using thelong-run variance of the cointegration residuals. In a panelsetting, the cointegration relationship is homogeneous. Het-erogeneity is limited to fixed effects, time trends, and short run
dynamics. The panel FMOLS estimator is the average of theindividual parameters (see Pedroni 2001).
Results
The study confirms the panel unit root problem of eachstudied variable by Levin et al. (2002), Im et al. (2003),Breitung (2000), and Hadri (2000). The results are reportedin Table 3, where they are divided into four panels. Panel Aconsists of results from the study of Levin et al. (2002), panelB consists of the results from the test of Im et al. (2003), panelC consists of results from the study of Breitung (2000) andpanel four from the test of Hadri (2000). The results from allthree tests, with or without linear trends, suggest that allstudied variables have a panel unit root problem.
The results indicate that CO2 is stationary at level as perLLC test; however, in remaining the other three statistics, itshows non-stationary at level. Similarly, in Breitung test,NUCLEAR shows stationary at level; however, in remainingthe other three statistics, it shows non-stationary at level, buttaking first difference, it would become stationary. The overall
Table 3 Panel unit root test
LLC Breitung IPS Hadri
Level
NUCLEAR p>0.05 p<0.05 p>0.05 p>0.05
OGC p>0.05 p>0.05 p>0.05 p>0.05
FOSSIL p>0.05 p>0.05 p>0.05 p>0.05
GHG p>0.05 p>0.05 p>0.05 p>0.05
AME p>0.05 p>0.05 p>0.05 p<0.05
INE p>0.05 p>0.05 p<0.05 p>0.05
CO2 p<0.05 p>0.05 p>0.05 p>0.05
First difference
NUCLEAR p<0.05 p>0.05 p<0.05 p<0.05
OGC p<0.05 p<0.05 p<0.05 p<0.05
FOSSIL p<0.05 p<0.05 p<0.05 p<0.05
GHG p<0.05 p<0.05 p<0.05 p<0.05
AME p<0.05 p<0.05 p<0.05 p<0.05
INE p<0.05 p<0.05 p<0.05 p<0.05
CO2 p<0.05 p<0.05 p>0.05 p<0.05
The other statistics are described in detail in Breitung (2000) and Hadri(2000). The statistics are asymptotically distributed as standard normalwith a left-hand side rejection area, except of the Hadri test, which isright-sided
LLC Levin, Lin, Chu; IPS Im, Pesaran, Shin
p>0.05 indicates the probability value of the coefficient which exceed the5 % level of significance; therefore, it is considered non-stationary atlevel, i.e., I(0); p<0.05 indicates the probability value of the coefficientwhich are less than the 5 % level of significance; therefore, it is consid-ered stationary series after taking the first difference, i.e., I(1)
Environ Sci Pollut Res (2014) 21:7425–7435 7431
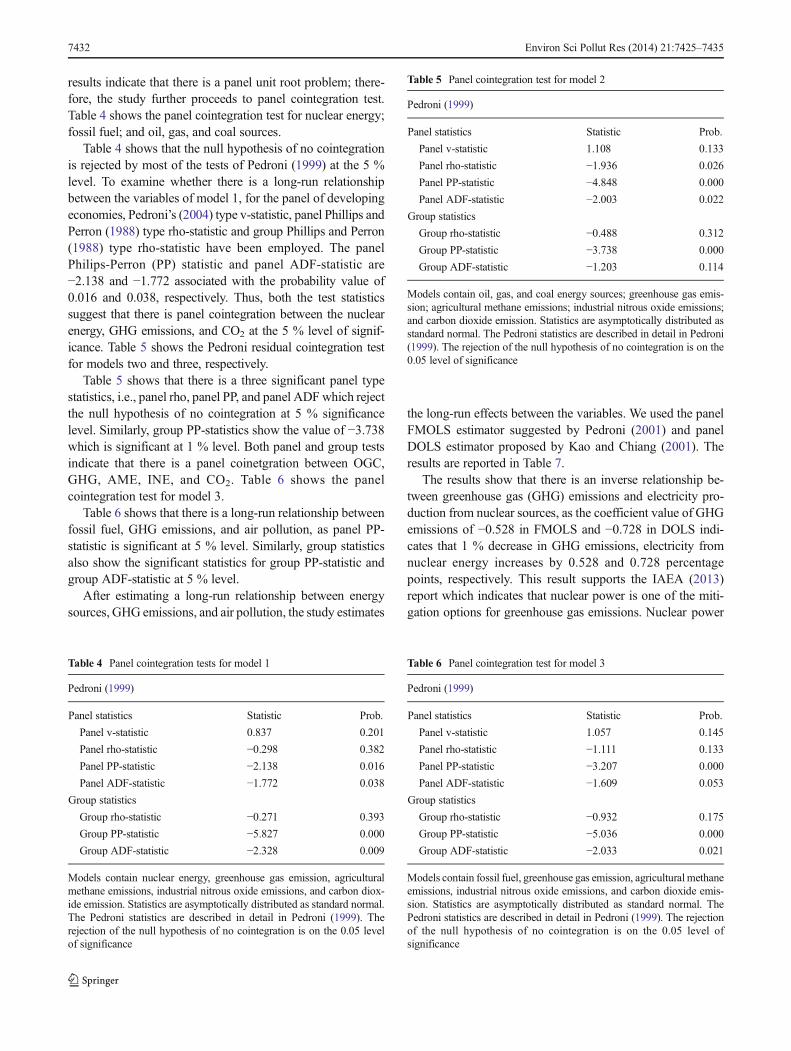
results indicate that there is a panel unit root problem; there-fore, the study further proceeds to panel cointegration test.Table 4 shows the panel cointegration test for nuclear energy;fossil fuel; and oil, gas, and coal sources.
Table 4 shows that the null hypothesis of no cointegrationis rejected by most of the tests of Pedroni (1999) at the 5 %level. To examine whether there is a long-run relationshipbetween the variables of model 1, for the panel of developingeconomies, Pedroni’s (2004) type v-statistic, panel Phillips andPerron (1988) type rho-statistic and group Phillips and Perron(1988) type rho-statistic have been employed. The panelPhilips-Perron (PP) statistic and panel ADF-statistic are−2.138 and −1.772 associated with the probability value of0.016 and 0.038, respectively. Thus, both the test statisticssuggest that there is panel cointegration between the nuclearenergy, GHG emissions, and CO2 at the 5 % level of signif-icance. Table 5 shows the Pedroni residual cointegration testfor models two and three, respectively.
Table 5 shows that there is a three significant panel typestatistics, i.e., panel rho, panel PP, and panel ADFwhich rejectthe null hypothesis of no cointegration at 5 % significancelevel. Similarly, group PP-statistics show the value of −3.738which is significant at 1 % level. Both panel and group testsindicate that there is a panel coinetgration between OGC,GHG, AME, INE, and CO2. Table 6 shows the panelcointegration test for model 3.
Table 6 shows that there is a long-run relationship betweenfossil fuel, GHG emissions, and air pollution, as panel PP-statistic is significant at 5 % level. Similarly, group statisticsalso show the significant statistics for group PP-statistic andgroup ADF-statistic at 5 % level.
After estimating a long-run relationship between energysources, GHG emissions, and air pollution, the study estimates
the long-run effects between the variables. We used the panelFMOLS estimator suggested by Pedroni (2001) and panelDOLS estimator proposed by Kao and Chiang (2001). Theresults are reported in Table 7.
The results show that there is an inverse relationship be-tween greenhouse gas (GHG) emissions and electricity pro-duction from nuclear sources, as the coefficient value of GHGemissions of −0.528 in FMOLS and −0.728 in DOLS indi-cates that 1 % decrease in GHG emissions, electricity fromnuclear energy increases by 0.528 and 0.728 percentagepoints, respectively. This result supports the IAEA (2013)report which indicates that nuclear power is one of the miti-gation options for greenhouse gas emissions. Nuclear power
Table 4 Panel cointegration tests for model 1
Pedroni (1999)
Panel statistics Statistic Prob.
Panel v-statistic 0.837 0.201
Panel rho-statistic −0.298 0.382
Panel PP-statistic −2.138 0.016
Panel ADF-statistic −1.772 0.038
Group statistics
Group rho-statistic −0.271 0.393
Group PP-statistic −5.827 0.000
Group ADF-statistic −2.328 0.009
Models contain nuclear energy, greenhouse gas emission, agriculturalmethane emissions, industrial nitrous oxide emissions, and carbon diox-ide emission. Statistics are asymptotically distributed as standard normal.The Pedroni statistics are described in detail in Pedroni (1999). Therejection of the null hypothesis of no cointegration is on the 0.05 levelof significance
Table 5 Panel cointegration test for model 2
Pedroni (1999)
Panel statistics Statistic Prob.
Panel v-statistic 1.108 0.133
Panel rho-statistic −1.936 0.026
Panel PP-statistic −4.848 0.000
Panel ADF-statistic −2.003 0.022
Group statistics
Group rho-statistic −0.488 0.312
Group PP-statistic −3.738 0.000
Group ADF-statistic −1.203 0.114
Models contain oil, gas, and coal energy sources; greenhouse gas emis-sion; agricultural methane emissions; industrial nitrous oxide emissions;and carbon dioxide emission. Statistics are asymptotically distributed asstandard normal. The Pedroni statistics are described in detail in Pedroni(1999). The rejection of the null hypothesis of no cointegration is on the0.05 level of significance
Table 6 Panel cointegration test for model 3
Pedroni (1999)
Panel statistics Statistic Prob.
Panel v-statistic 1.057 0.145
Panel rho-statistic −1.111 0.133
Panel PP-statistic −3.207 0.000
Panel ADF-statistic −1.609 0.053
Group statistics
Group rho-statistic −0.932 0.175
Group PP-statistic −5.036 0.000
Group ADF-statistic −2.033 0.021
Models contain fossil fuel, greenhouse gas emission, agricultural methaneemissions, industrial nitrous oxide emissions, and carbon dioxide emis-sion. Statistics are asymptotically distributed as standard normal. ThePedroni statistics are described in detail in Pedroni (1999). The rejectionof the null hypothesis of no cointegration is on the 0.05 level ofsignificance
7432 Environ Sci Pollut Res (2014) 21:7425–7435

plants produce virtually no greenhouse gas emissions or airpollutants during their operation and only very low emissionsover their full life cycle (IAEA 2012). In addition, the resultsindicate that there is a positive relationship between agricul-tural methane emissions (AME), industrial nitrous oxide emis-sions (INE), and nuclear energy; however, the intensity ofincreasing AME and INE is greater in DOLS estimator. Al-though agriculture accounts for only 9 % of greenhouse gasemissions, it is the main source of methane (CH4) and nitrousoxide (N2O) emissions. On the other hand, conversion ofagricultural land to forest offers considerable potential toabsorb CO2 from the atmosphere (EUROPA 2000). The re-sults confirm that an increase nuclear energy production leadsto reduce air pollution in the developed economies, as thisrelationship is less elastic, i.e., −0.826 % in FMOLS, whilemore elastic relationship, i.e., −1.128 % in DOLS estimator.
In the second model, there is a significant and positiverelationship among energy production from oil, gas, and coal(OGC); greenhouse gas emissions; agricultural methane emis-sions; and carbon dioxide emissions. If there is 1 % increase inGHG emissions, OGC increases by 0.665 % in FMOLSestimator and 0.712 percentage points in DOLS estimator.Similarly, AME increase OGC by 0.825 % and 0.525 percent-age point in FMOLS and DOLS estimators. The results indi-cate that there is a little change in OGC which brings greaterchange in carbon dioxide emissions, as the coefficient valueindicates 0.325 % in FMOLS and 0.558 percentage points inDOLS estimator. Combustion of natural gas—used in thegeneration of electricity, industrial boilers, and other applica-tions—emits lower levels of NOx, CO2, and particulate emis-sions and virtually no SO2 andmercury emissions. Natural gasis used in place of, or in addition to, other fossil fuels,
including coal, oil, or petroleum coke, which emit significant-ly higher levels of these pollutants (Natural Gas 2011).
At last, in the third model, there is a positive relationshipbetween fossil fuel energy, greenhouse gas emissions, andair pollution; however, the intensity to effect climatic factorsand air pollution is different in nature, as there is one-to-onecorresponding relationship between GHG emissions andfossil fuel; there is more elastic relationship between fossilfuel and carbon emissions as the coefficient value indi-cates1.212 percentage point. Agricultural methane emissionsand industrial nitrous oxide emissions have a less elasticrelationship with the fossil fuel. The results indicate thatfossil fuel power plants are major contributors to air pollu-tion. According to IAEA (2013), there is a significant re-duction of exposure to air pollution can be achieved bylowering the concentrations of several of the most commonair pollutants emitted during the combustion of fossil fuels.
Conclusion
Climate change increasingly is important as federal, state, andlocal policymakers consider energy supply and greenhousegas mitigation. Given those concerns and the need for baseload electricity production, policymakers and energy industryleaders are evaluating an expanded role for nuclear power(NEI 2013). This study takes an initiative to explore thelong-run relationship between climatic factors, air pollution,and energy sources in the panel of developed countries. Theresults highlight the importance of nuclear power to limitfuture greenhouse gas emissions; however, there is a need toreduce other emissions, i.e., agricultural methane emissions
Table 7 Panel estimation of the cointegration vector
Method Ln (GHG) Ln (AME) Ln (INE) Ln (CO2) R square
Model 1: nuclear energy, greenhouse gas emissions, and air pollutionDependent variable: Ln (NUCLEAR)
FM (Pedroni 1999) −0.528* (−4.525) 0.212** (2.825) −0.028 (−1.256) −0.826* (−5.589) 0.758
DOLS (Mark and Sul 2002) −0.785* (−5.669) 0.418** (2.998) 0.125*** (2.001) −1.128* (−6.258) 0.882
Model 2: oil, gas, and coal; greenhouse gas emissions; and air pollutionDependent variable: Ln (OGC)
FM (Pedroni 1999) 0.665* (4.669) 0.825* (5.369) 0.199 (1.302) 0.325** (2.636) 0.639
DOLS (Mark and Sul 2002) 0.712* (5.252) 0.525* (4.012) 0.259 (1.369) 0.558* (3.963) 0.725
Model 3: fossil fuel, greenhouse gas emissions, and air pollutionDependent variable: Ln (FOSSIL)
FM (Pedroni 1999) 0.743* (6.669) 0.101 (1.029) 0.599* (4.032) 1.212* (6.693) 0.885
DOLS (Mark and Sul 2002) 1.001* (11.963) 0.528* (4.320) 0.126 (1.696) 0.885* (5.201) 0.912
t values are in parentheses
* indicate 1 % significance level
** indicate 5 % significance level
*** indicate 10 % significance level
Environ Sci Pollut Res (2014) 21:7425–7435 7433
and industrial nitrous oxide emissions, which exhibit theinclination of pollutants while using nuclear energy.
The following conclusions have been emerged with thisexercise, i.e.,
& Nuclear power has the potential to continue to play asignificant role in the effort to limit future GHG emissionswhile meeting global energy needs (IAEA 2012).
& Atmospheric concentrations of some of the gases thatproduce the greenhouse effect are increasing due to humanactivity and most of the world’s climate scientists considerthat this is a significant part of the cause of observedclimate change (WNN 2013).
& To mitigate global warming in the future, there is a need toreduce the radiative forcing that is causing the warming.At present, about half of the anthropogenic greenhouseradiative forcing is caused by carbon dioxide and anotherhalf by methane, nitrous oxide, and halocarbons. In addi-tion, particles of black carbon (or soot) released to theatmosphere when fossil fuels or biomass is burned canalso cause warming by absorbing sunlight. Efforts shouldbe made to reduce the emissions of all these agents(Miralda-Escudé 2004).
& To address both global energy demand increase and climate-related concerns, energy portfolios should be diversified toinclude more low carbon dioxide emitting sources, such asnuclear, solar, wind, and hydro (The National 2013).
& Natural gas is an extremely important source of energy forreducing pollution and maintaining a clean and healthyenvironment. In addition to being a domestically abundantand secure source of energy, the use of natural gas also offersa number of environmental benefits over other sources ofenergy, particularly other fossil fuels (Natural Gas 2011).
& Electricity generation is one of the major contributors toglobal greenhouse gas emissions. Transitioning theworld’s energy economy to a lower carbon future requiredsignificant investment in a variety of cleaner technologies,including renewables and nuclear power. In the short term,improving the efficiency of fossil fuel combustion inenergy generation can provide an important contribution(Hardisty et al. 2012).
& Coal-based technology has the potential to make sig-nificant CO2 emission reductions which are compati-ble with a low emissions future. In the short to medi-um term, this requires market and regulatory frame-works that encourage investments in the latest tech-nologies that improved the efficiency of coal-firedelectricity generation and thus reduce specific CO2
emissions. Collaborative action by governments andthe industry is required now to encourage worldwidecoordinated research, development, and demonstrationof clean coal technologies such as carbon capture andstorage, which will in the longer term deliver near-
zero CO2 emissions from the use of coal (OECD/IEA2005).
According to Khan et al. (2013, p. 166),
…consuming energy by industries is becoming moreincreasing by every coming day, but it signifies the factthat emissions caused by consuming the energy is caus-ing harm to the society by enlarge, and it reaches to theconclusion where we are heading toward a systematicfatal disorder of our society.
Emissions to the atmosphere cause a variety of negativeimpacts on climate and air quality. Pollution does not com-prise a single chemical substance, but consists of a cocktail ofmany pollutants originating from a wide range of humanactivities and natural sources that can be controlled to differentextents at different costs. Thus, cost-effective response strate-gies need to consider cause-effect relationships for multiplepollutants and multiple effects and how they are interconnect-ed with each other (EC4MACS 2013).
Acknowledgments This work was financially supported by the Na-tional 985 Project of Non-traditional Security at Huazhong University ofScience and Technology, PR of China. The authors are thankful to theanonymous reviewers for their comments and suggestions. Any remain-ing errors are the authors own responsibility.
References
Akhmet G, Zaman K (2013) Nuclear energy consumption, commercialenergy consumption and economic growth in South Asia: bootstrappanel causality test. Renew Sustain Energy Rev 25:552–559
Akhmet G, Zaman K, Shukui T, Irfan D, Khan MM (2014) Does energyconsumption contribute to environmental pollutants? Evidence fromSAARC countries. Environ Sci Pollut Res. doi:10.1007/s11356-014-2528-1
Banerjee A (1999) Panel data unit roots and cointegration: an overview.Oxf Bull Econ Stat S1(61):607–629
Bird DK, Haynes K, Honert RV, McAneney J, Poortinga W (2014)Nuclear power in Australia: a comparative analysis of public opin-ion regarding climate change and the Fukushima disaster. EnergyPolicy 65:644–653
Breitung J (2000) The local power of some unit root tests for panel data.In: Baltagi B (ed) Advances in Econometrics 15. Non-stationarypanels, panel cointegration, and dynamic panels. JAI, Amsterdam,pp 161–178
Calbick KS, Gunton T (2014). Differences among OECD countries’GHG emissions: causes and policy implications. Energy Pol, (inpress)
EC4MACS (2013) Greenhouse gases and air pollutants in the EuropeanUnion: Baseline projections up to 2030. EC4MACS InterimAssessment, European Consortium for Modelling Air pollutionand Climate Strategies. http://gains.iiasa.ac.at/reports/EC4MACS_IR_11.pdf. Accessed 23 Jan 2014.
EUROPA (2000) Agriculture and climate change. The EuropeanCommission. http://ec.europa.eu/agriculture/envir/report/en/clima_en/report_en.htm. Accessed 17 Aug 2013.
7434 Environ Sci Pollut Res (2014) 21:7425–7435

EUROPA (2014) EU greenhouse gas emissions and targets. TheEuropean Commission. http://ec.europa.eu/clima/policies/g-gas/index_en.htm. Accessed on 25 Jan 2014.
Goldsmith E (2004) Feeding the world under climate change. Sci Soc 24:34–36
Hadri K (2000) Testing for stationarity in heterogeneous panel data. EconJ 3(2):148–161
Hardisty PA, Clark TS, Hynes RG (2012) Life cycle greenhouse gasemissions from electricity generation: a comparative analysis ofAustralian energy sources. Energies 5:872–897. doi:10.3390/en5040872
Hong S, Bradshaw CJA, Brook BW (2013) Evaluating options for thefuture energy mix of Japan after the Fukushima nuclear crisis.Energy Policy 56:418–424
IAEA (2012) Climate change and nuclear power—2012. InternationalAtomic Energy Agency (IAEA), Vienna
IAEA (2013) Nuclear energy’s role in mitigating climate change and airpollution. IAEA Bulletin 54–1, March 2013. http://www.iaea.org/Publications/Magazines/Bulletin/Bull541/54104710506.pdf.Accessed on 17 Sep 2013.
Im KS, Pesaran MH, Shin Y (2003) Testing for unit roots in heteroge-neous panels. J Econ 115(1):53–74
IPCC (2007) Climate Change 2007: Impacts, adaptation and vulnerabil-ity. Contribution of Working Group II to the Fourth AssessmentReport of the Intergovernmental Panel on Climate Change (Parry,M.L., Canziani, O.F., Palutikof, J.P., van der Linden, P.J. andHanson, C.E., eds.). http://www.ipcc.ch/ipccreports/ar4-wg2.htm.Accessed on 3 Oct 2013.
Juma DW, Wang H, Li F (2014) Impacts of population growth andeconomic development on water quality of a lake: case study ofLake Victoria Kenya water. Environ SciPollut Res. doi:10.1007/s11356-014-2524-5
Kao C, Chiang M (2001) On the estimation and inference of acointegrated regression in panel data. Adv Econ 15:179–222
Kao C, McCoskey S (1998) A residual-based test of the null ofcointegration in panel data. Econ Rev 17(1):57–84
Khan MA, Khan MZ, Zaman K, Khan MM, Zahoor H (2013) Causallinks between greenhouse gas emissions, economic growth andenergy consumption in Pakistan: a fatal disorder of society. RenewSustain Energy Rev 25:166–176
KhanMA,KhanMZ, ZamanK, Naz L (2014) Global estimates of energyconsumption and greenhouse gas emissions. Renew Sustain EnergyRev 29:336–344
Levin A, Lin CF (1992) Unit root tests in panel data: asymptoticand finite-sample integrated systems. Econometrica 61(4):783–820
Levin A, Lin CF, Chu CS (2002) Unit root tests in panel data: asymptoticand finite-sample properties. J Econ 108(1):1–24
Li JS, Chen GQ (2013) Energy and greenhouse gas emissions review forMacao. Renew Sustain Energy Rev 22:23–32
Lim X, Lam W (2014) Review on Clean Development Mechanism(CDM) implementation in Malaysia. Renew Sustain Energy Rev29:276–285
Mark NC, Sul D (2002) Cointegration vector estimation by panelDOLS and long-run money demand, NBER TechnicalWorking Paper 287
Miralda-Escudé J (2004) Lecture 9: Solutions to global warming.Introduction to the Science of Climate Change. http://www.am.ub.edu/~jmiralda/fsgw/lect9.html. Accessed on 23 Jun 2013.
Mudakkar SR, Zaman K, Khan MM, Ahmad M (2013) Energy foreconomic growth, industrialization, environment and natural re-sources: living with just enough. Renew Sustain Energy Rev 25:580–595
Natural Gas (2011) Natural gas and the environment. http://www.naturalgas.org/environment/naturalgas.asp. Accessed 17 Oct 2013.
NEI (2013) Climate Change Initiatives. Nuclear Energy Institute,Washington, DC. http://www.nei.org/Issues-Policy/Protecting-the-Environment/Climate-Change-Initiatives. Accessed 27 Dec 2013.
OECD/IEA (2005) Reducing greenhouse gas emissions: the potential ofcoal. International Energy Agency (IEA), Paris
Pedroni P (1999) Critical values for cointegration tests in heterogeneouspanels with multiple regressors. Oxf Bull Econ Stat 61:653–670
Pedroni P (2001) Fully modified OLS for heterogeneous cointegratedpanel. Adv Econ 15:93–130
Pedroni P (2004) Panel cointegration: asymptotic and finite sampleproperties of pooled time series tests with an application to thePPP hypothesis. Econ Theory 20:597–625
Phillips PCB (1995) Fully modified least squares and vectorautoregression. Econometrica 63:1023–1078
Phillips PCB, Perron P (1988) Testing for unit roots in time seriesregression. Biometrika 75:335–346
Pongsoi P, Wongwises S (2013) A review on nuclear power plant sce-nario in Thailand. Renew Sustain Energy Rev 24:586–592
Rao S, Pachauri S, Dentener F, Kinney P, Klimont Z, Riahi K, SchoeppW(2013) Better air for better health: forging synergies in policies forenergy access, climate change and air pollution. Glob EnvironChang 23(5):1122–1130
Sablier M, Garrigues P (2013) Cultural heritage and its environment: anissue of interest for environmental science and pollution research.Environmental Sciences and Pollution Research. doi:10.1007/s11356-013-2458-3
Saikkonen P (1991) Asymptotically efficient estimation of cointegrationregressions. Econ Theory 7:1–21
SarioMD, Katsouyanni K,Michelozzi P (2013) Climate change, extremeweather events, air pollution and respiratory health in Europe. EurRespir J. doi:10.1183/09031936.00074712
Stock J, Watson MW (1993) A simple estimator of cointegrating vectorsin higher order integrated systems. Econometrica 61(4):783–820
The National (2013) Nuclear energy’s benefits becoming more obvious,says UAE. The National News, Abu Dhabi, UAE. http://www.thenational.ae/uae/environment/nuclear-energys-benefits-becoming-more-obvious-says-uae#ixzz2rbCBuCYS. Accessed 2 Jan 2014.
Tsai WT (2014) An analysis of shifting to a low-carbon society throughenergy policies and promotion measures in Taiwan. Energy SourcesB: Econ Plan Policy 9(4):391–397
UN (2013) Country classification: data sources, country classificationsand aggregation methodology. Statistical annex. http://www.un.org/en/development/desa/policy/wesp/wesp_current/2013country_class.pdf. Accessed 17 Sep 2013.
Varotsos CA, Ondov JM, Efstathiou MN, Cracknell AP (2013) The localand regional atmospheric oxidants at Athens (Greece). Environ SciPollut Res. doi:10.1007/s11356-013-2387-1
Westerlund J (2003) A panel data test of the bank lending channel inSweden.Working Papers 2003:16. Department of Economics, LundUniversity
WNN (2013) Nuclear Energy and Climate Change.World Nuclear News,2013, UK. http://www.world-nuclear.org/Features/Climate-Change/Climate-Change-and-Nuclear-Energy/. Accessed 22 Jan 2014.
World Bank (2013) World development indicator data base. World Bank,Washington, DC
Zaman K, Khan MM, Ahmad M, Khilji BA (2013a) The relationshipbetween agricultural technologies and carbon emissions in Pakistan:peril and promise. Econ Model 29(5):1632–1639
Zaman K, Shah IA, Jadood S, Ahmad M (2013b) Measuring the impactof carbon dioxide emission and arable land on specific growthfactors in Pakistan. Int J Ecol Econ Stat (IJEES) 29(2):74–86
Environ Sci Pollut Res (2014) 21:7425–7435 7435