Embed Size (px)
Citation preview

January 14, 2016
The Challenge of Measuring Thermoelectric Materials and Devices Electrical and Thermal Performance
Jean-Pierre Fleurial Jet Propulsion Laboratory/California Institute of Technology
Pasadena, California, USA
NISTWorkshop on Quantification of Uncertainties in Materials Science
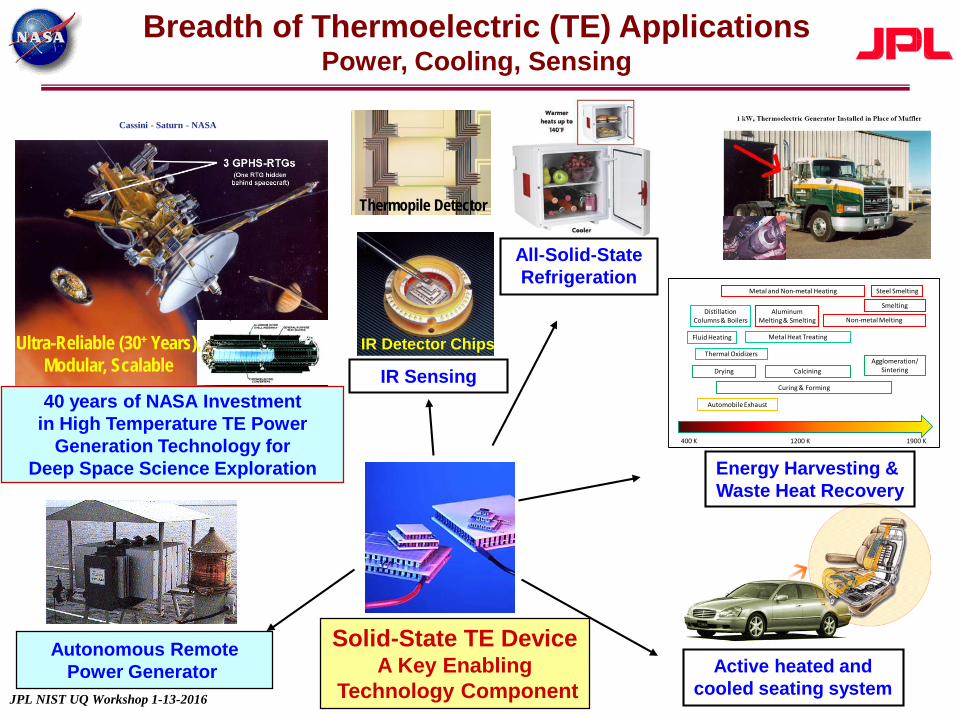
Breadth of Thermoelectric (TE) ApplicationsPower, Cooling, Sensing
Cassini - Saturn - NASA
Solid-State TE DeviceA Key Enabling
Technology Component
Autonomous RemotePower Generator
40 years of NASA Investmentin High Temperature TE Power
Generation Technology forDeep Space Science Exploration
IR Detector Chips
Active heated andcooled seating system
All-Solid-State Refrigeration
IR Sensing
Ultra-Reliable (30+ Years), Modular, Scalable
Energy Harvesting & Waste Heat Recovery
Fluid Heating
Curing & Forming
Drying
Non-metal MeltingDistillation
Columns & Boilers
Steel SmeltingMetal and Non-metal Heating
AluminumMelting & Smelting
Smelting
Agglomeration/Sintering
Metal Heat Treating
Thermal Oxidizers
Calcining
400 K 1900 K1200 K
Automobile Exhaust
JPL NIST UQ Workshop 1-13-2016
Thermopile Detector

Thermoelectric Transport
JPL NIST UQ Workshop 1-13-2016
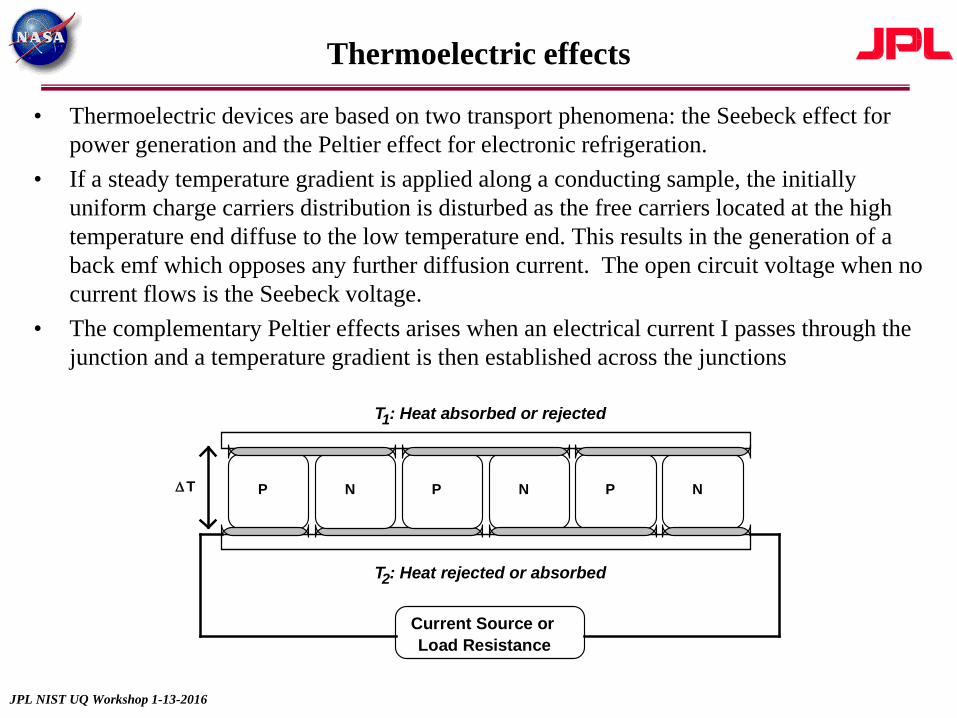
Thermoelectric effects
• Thermoelectric devices are based on two transport phenomena: the Seebeck effect for power generation and the Peltier effect for electronic refrigeration.
• If a steady temperature gradient is applied along a conducting sample, the initially uniform charge carriers distribution is disturbed as the free carriers located at the high temperature end diffuse to the low temperature end. This results in the generation of a back emf which opposes any further diffusion current. The open circuit voltage when no current flows is the Seebeck voltage.
• The complementary Peltier effects arises when an electrical current I passes through the junction and a temperature gradient is then established across the junctions
P P PN N N
Current Source or
T : Heat rejected or absorbed
T : Heat absorbed or rejected
T∆
Load Resistance
1
2
JPL NIST UQ Workshop 1-13-2016

Thermoelectric Property Definition Under Condition Type
Electrical Conductivity i = σE Direct
Thermal Conductivity i = 0 Direct
Seebeck Coefficient i = 0 Cross
Peltier Coefficient Q = Πi Cross
Thermoelectric Transport Coefficients
• Electrical (σ) and thermal (λ) conductivities are direct effects connecting electrical and heat current with the related force
• The Seebeck (S) and Peltier (Π) coefficients are cross effects connecting respectively an electrical response to a thermal force and a heat current to an electrical force
TQ ∇−= λ
0=∇TTSE ∇=
0=∇T
JPL NIST UQ Workshop 1-13-2016
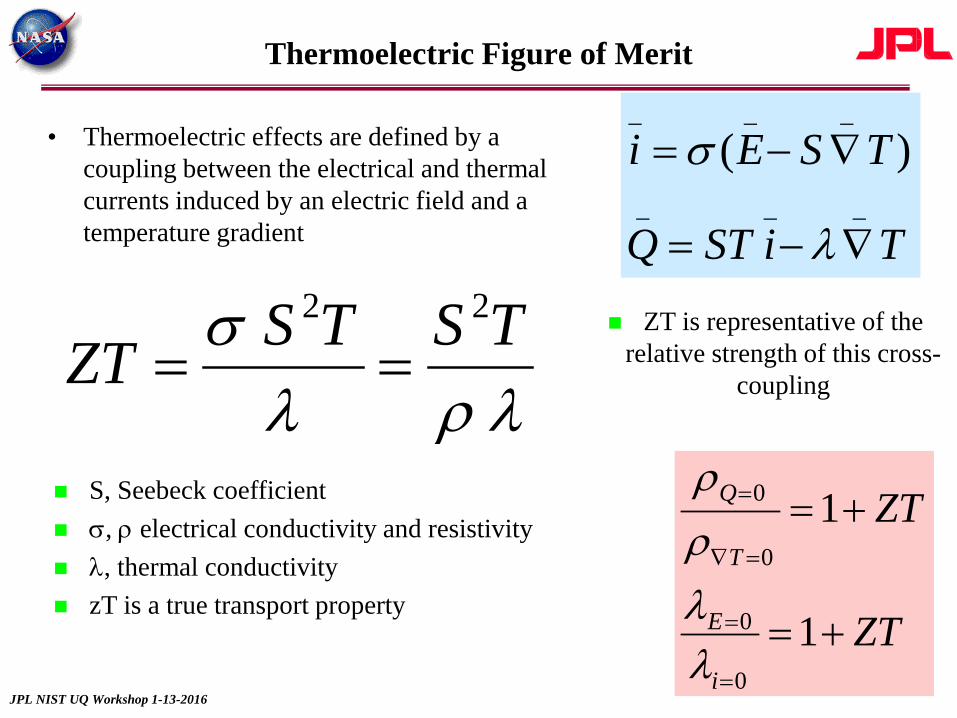
Thermoelectric Figure of Merit
• Thermoelectric effects are defined by a coupling between the electrical and thermal currents induced by an electric field and a temperature gradient TiSTQ
TSEi___
___)(
∇−=
∇−=
λ
σ
ZT
ZT
i
E
T
Q
+=
+=
=
=
=∇
=
1
1
0
0
0
0
λλρρ
λρλσ
22 TSTSZT ==
ZT is representative of the relative strength of this cross-
coupling
S, Seebeck coefficient σ, ρ electrical conductivity and resistivity λ, thermal conductivity zT is a true transport property
JPL NIST UQ Workshop 1-13-2016
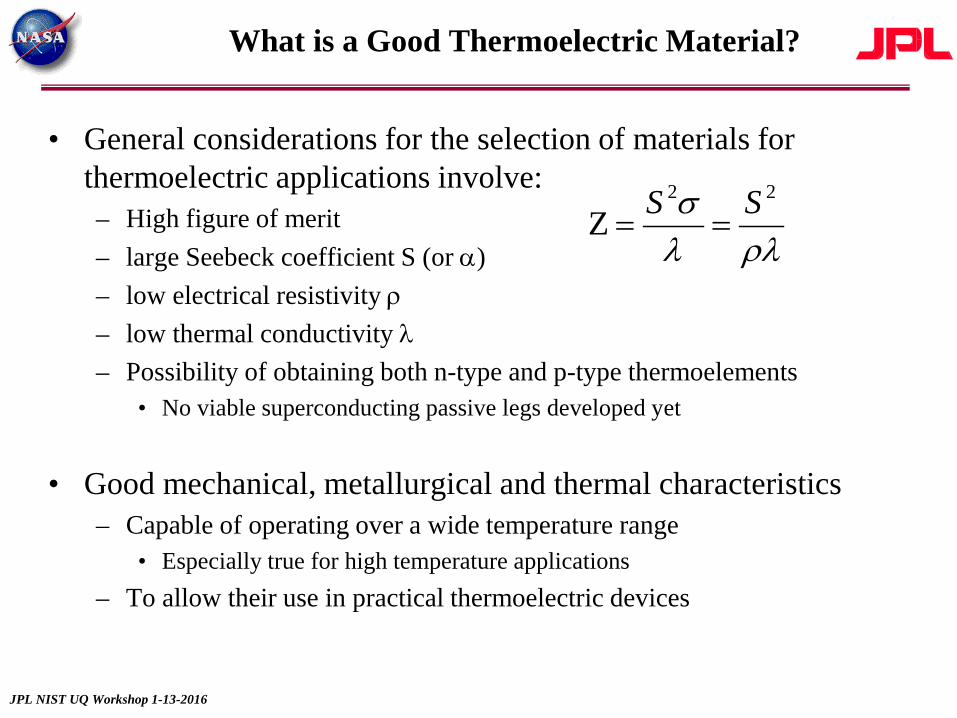
What is a Good Thermoelectric Material?
• General considerations for the selection of materials for thermoelectric applications involve:– High figure of merit – large Seebeck coefficient S (or α)– low electrical resistivity ρ– low thermal conductivity λ– Possibility of obtaining both n-type and p-type thermoelements
• No viable superconducting passive legs developed yet
• Good mechanical, metallurgical and thermal characteristics– Capable of operating over a wide temperature range
• Especially true for high temperature applications– To allow their use in practical thermoelectric devices
ρλλσ 22
Z SS==
JPL NIST UQ Workshop 1-13-2016

General Thermoelectric Properties of Metals,Semiconductors and Insulators at 300K
• The Seebeck coefficient is much too low in metals• The electrical conductivity is much too low in insulators• Only semiconductors possess the right combination of high
power factor PF = S2σ and relatively low thermal conductivity λ
– Degenerate semiconductors and semi-metals are most attractive
Metals Semiconductors InsulatorsS ~ 5 µVK-1 S ~ 200 µVK-1 S ~1000 µVK-1σ ~ 108 Ω-1m-1 σ ~ 105 Ω-1m-1 σ ~ 10-10 Ω-1m-1
λtot = λL+λel ~ λel λtot = λL+λel; λel < λL λtot = λL+λel ~ λL~ 10-1000 Wm -1K -1 ~ 1-100 Wm -1K -1 ~ 0.1-1 Wm -1K -1ZT ~ 10-3 ZT ~ 0.1 – 2.0 ZT ~ 10 -14
JPL NIST UQ Workshop 1-13-2016

Good Thermoelectrics – Implications for Transport Property Measurements
• Good TE materials have:– Thermal conductivity like glass– Large thermopower values – order of magnitude higher than Type K
TC• Strong voltage response to changes in temperatures• Strong Peltier effect means strong temperature response to changes in
applied current– Good electrical conductivities – only 10-50 times higher than metals
The larger the zT, the higher the potential for erroneous measurements• However need to recognize that for a given material electrical
properties typically vary in tandem (high resistivity and high Seebeck vs. low resistivity and low Seebeck )
JPL NIST UQ Workshop 1-13-2016
Power Generation and Cooling
JPL NIST UQ Workshop 1-13-2016
JPL NIST UQ Workshop 1-13-2016
Thermoelectric Cooling
P PPN NN
Cold Side: Active Cooling
Hot Side:Heat Rejection
Current+-2
11
1
2
max
max
maxmax
cold
cold
hot
coldhot
cold
ZTT
ZTTTZT
TTT
PQCOP
=∆
++
−+
−==
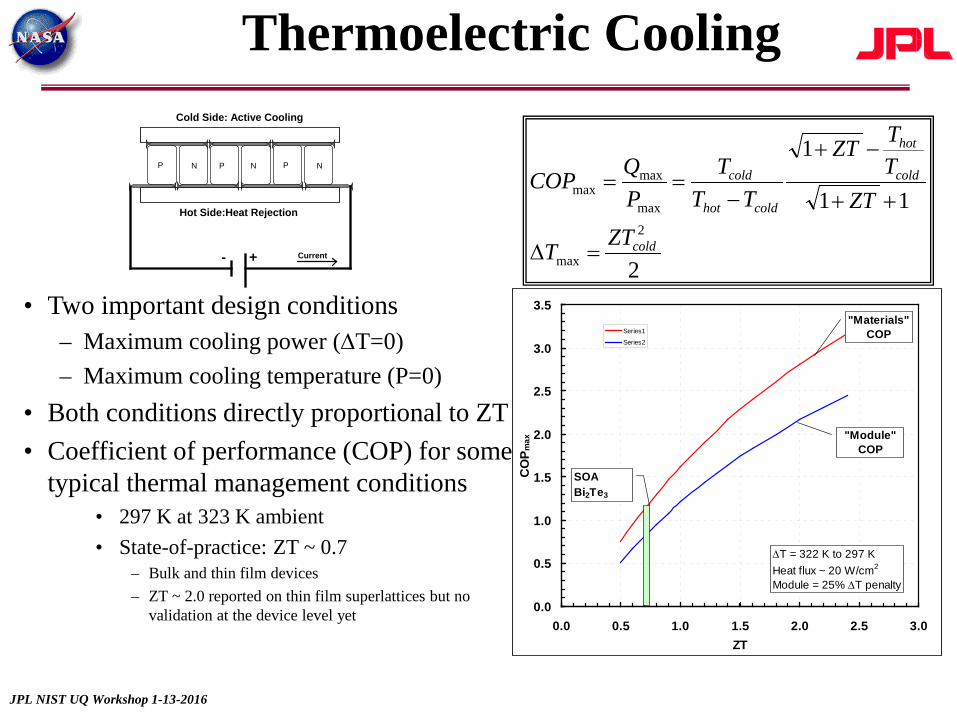
• Two important design conditions– Maximum cooling power (∆T=0)– Maximum cooling temperature (P=0)
• Both conditions directly proportional to ZT• Coefficient of performance (COP) for some
typical thermal management conditions• 297 K at 323 K ambient• State-of-practice: ZT ~ 0.7
– Bulk and thin film devices– ZT ~ 2.0 reported on thin film superlattices but no
validation at the device level yet 0.0
0.5
1.0
1.5
2.0
2.5
3.0
3.5
0.0 0.5 1.0 1.5 2.0 2.5 3.0ZT
CO
P max
Series1
Series2
SOA Bi2Te3
"Materials" COP
"Module" COP
∆T = 322 K to 297 KHeat flux ~ 20 W/cm2
Module = 25% ∆T penalty

Thermoelectric Power Generation
Cold-shoe Cold-shoe
Heat Sink
p-type material n- type material
Hot-junction (Thot)
Cold-junction(Tcold)
---
---
---
Load
λρλσ
22 TSTSZT ==
Thermoelectric effects are defined by a coupling
between the electrical and thermal currents induced by
an electric field and a temperature gradient
max
1
11 ++
−+−=
hot
coldhot
coldhot
TTZT
ZTT
TTη ConversionEfficiency
Carnot TE Materials
Dimensionless Thermoelectric Figure of Merit, ZTThermoelectric CoupleSeebeck coefficient SElectrical conductivity σElectrical resistivity ρThermal conductivity λAbsolute temperature T
Conversion efficiency is a direct function of ZT and ∆T
0
5
10
15
20
25
30
35
400 500 600 700 800 900 1000 1100 1200 1300
Ther
mal
/Ele
ctric
Con
vers
ion
Effic
ienc
y (%
)
Hot Side Temperature (K)
Tcold = 373 K
ZTave = 1
ZTave = 2
ZTave = 0.5
ZTave = 4
Heat Source
JPL NIST UQ Workshop 1-13-2016
Power generation
(across 1275 to 300 K)State-Of-Practice materials:
ZTaverage ~ 0.5
State-Of-the-Art materials: ZTaverage ~ 1.1
Best SOA materials: ZTpeak ~ 1.5 to 2.0
Good Thermoelectric Devices – Implications for Characterization and Validation of TE Materials Performance
• Good TE Devices have:– Good TE materials– Low electrical and thermal interface resistances– Effective thermal coupling to hot side and cold side external interfaces
Good TE device performance characterization should be capable of validating TE materials performance
• Moreover:• TE devices are often used in long life applications where a high
level of performance prediction reliability is essential• Prediction reliability depends most on individual property spread
in values and associated uncertainties
JPL NIST UQ Workshop 1-13-2016

Measuring Thermoelectric Transport Properties
JPL NIST UQ Workshop 1-13-2016
*Used recent paper by Borup et al., “Measuring Thermoelectric Transport Properties of Materials” Energy Environ. Sci., 2015, 8, 423
Seebeck Coefficient Measurement
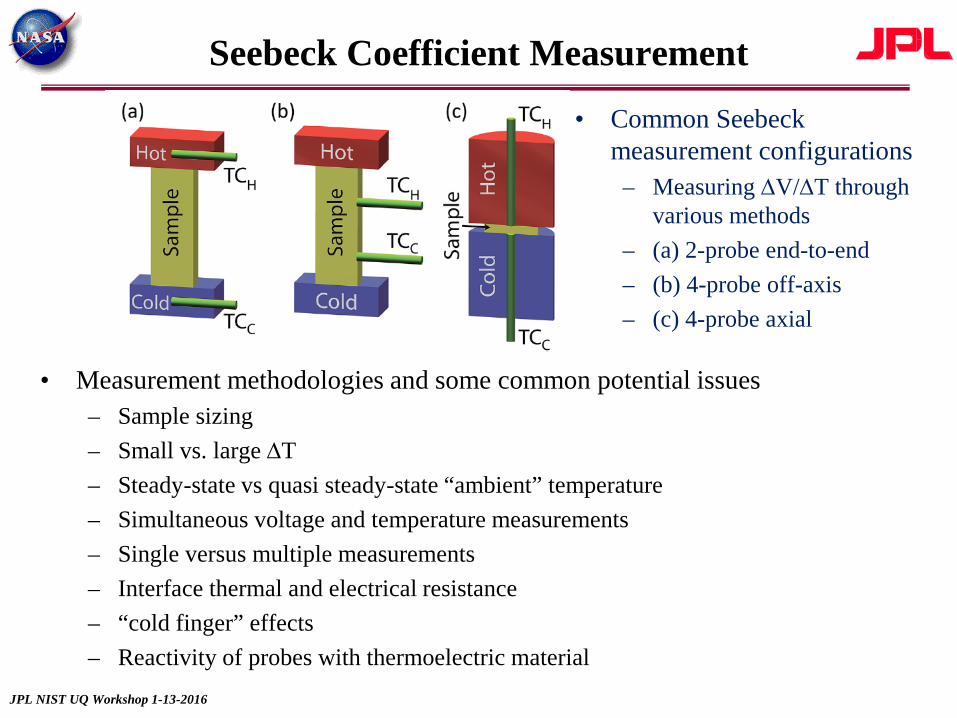
• Measurement methodologies and some common potential issues– Sample sizing– Small vs. large ∆T– Steady-state vs quasi steady-state “ambient” temperature– Simultaneous voltage and temperature measurements– Single versus multiple measurements– Interface thermal and electrical resistance– “cold finger” effects– Reactivity of probes with thermoelectric material
JPL NIST UQ Workshop 1-13-2016
• Common Seebeckmeasurement configurations
– Measuring ∆V/∆T through various methods
– (a) 2-probe end-to-end– (b) 4-probe off-axis– (c) 4-probe axial

Electrical Resistivity/Hall Effect Measurement
• Measurement methodologies and some common potential issues– Available sample shape: bar/cylinder versus plate/disk
• Commonality with other property measurements – Sample dimensions and dimensional uniformity (major source of error)– Simultaneous current application (pulse DC vs. AC) and voltage measurements
• Minimize/eliminate extraneous Seebeck voltage effects– Uniformity of current flow– Location and contact resistance of probes– Reactivity of probes with thermoelectric material– Temperature measurement and steady-state vs quasi steady-state “ambient conditions”
JPL NIST UQ Workshop 1-13-2016
• Common resistivity measurement configurations– Measuring R*A/l through various methods– (a) 4-probe resistivity only bar shape– (b and c) 6 and 5-probe resistivity and Hall effect– (d) 4-probe Van der Pauw for resistivity (and
Hall effect)

Thermal Conductivity Measurement
• Measurement methodologies and some common potential issues– Available sample shape: bar/cylinder versus plate/disk
• Plate/disk shape is compatible with other property measurements (Seebeck (c), Van der Pauw)• Bar-shape can be used with Seebeck (a,b) and resistivity (a)
– Sample dimensions and dimensional uniformity– Temperature measurements (Sample temperature for flash diffusivity)– Heat losses for calculating Q into sample
• Radiation losses (especially for the direct methods at higher temperatures)• Cold fingers for direct measurements
– Heat capacity calculation or direct measurement required for diffusivity method • Calculation requires use of a known standard (C) and surface emissivity coating of unknown• “Stand-alone” measurement is difficult, especially at high temperatures
JPL NIST UQ Workshop 1-13-2016
• Common measurement configurations– Measuring Q/∆T*(l/A) through various methods– (a) Flash diffusivity (necessitates Cp measurement)– (b) Direct steady-state measurement– (c) Direct pulsed heat measurement– (d) (not shown) comparative measurement
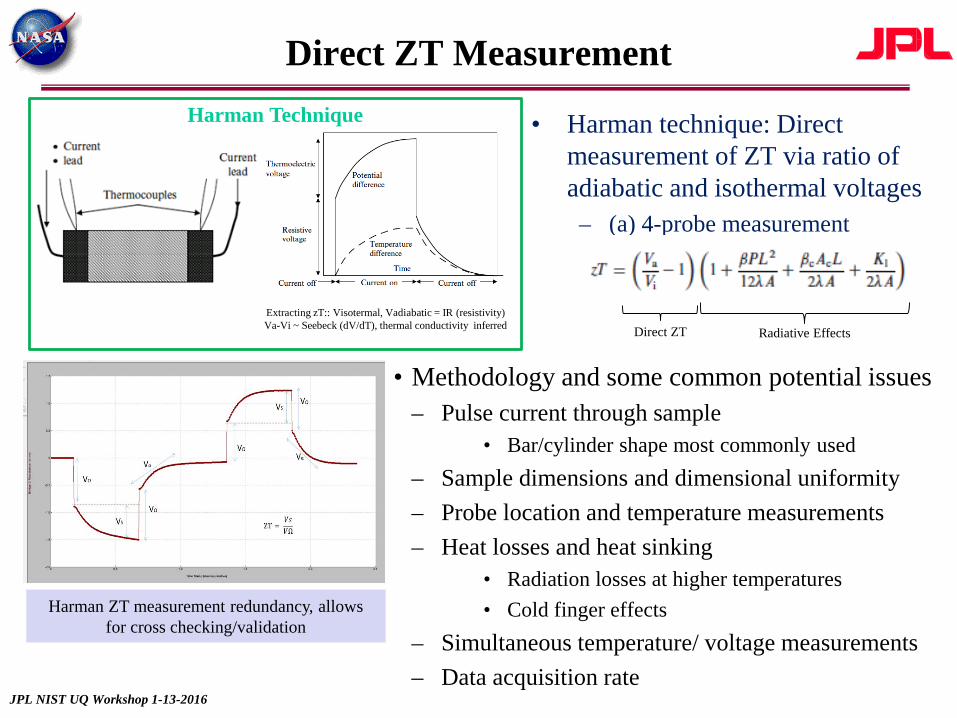
Direct ZT Measurement
• Methodology and some common potential issues– Pulse current through sample
• Bar/cylinder shape most commonly used– Sample dimensions and dimensional uniformity– Probe location and temperature measurements– Heat losses and heat sinking
• Radiation losses at higher temperatures• Cold finger effects
– Simultaneous temperature/ voltage measurements– Data acquisition rate
JPL NIST UQ Workshop 1-13-2016
• Harman technique: Direct measurement of ZT via ratio of adiabatic and isothermal voltages
– (a) 4-probe measurement
Extracting zT:: Visotermal, Vadiabatic = IR (resistivity)Va-Vi ~ Seebeck (dV/dT), thermal conductivity inferred
Harman Technique
Radiative EffectsDirect ZT
Harman ZT measurement redundancy, allows for cross checking/validation

Thermoelectric Devices for Characterization and Validation of TE Material Properties
JPL NIST UQ Workshop 1-13-2016
*Used recent paper by Borup et al., “Measuring Thermoelectric Transport Properties of Materials” Energy Environ. Sci., 2015, 8, 423
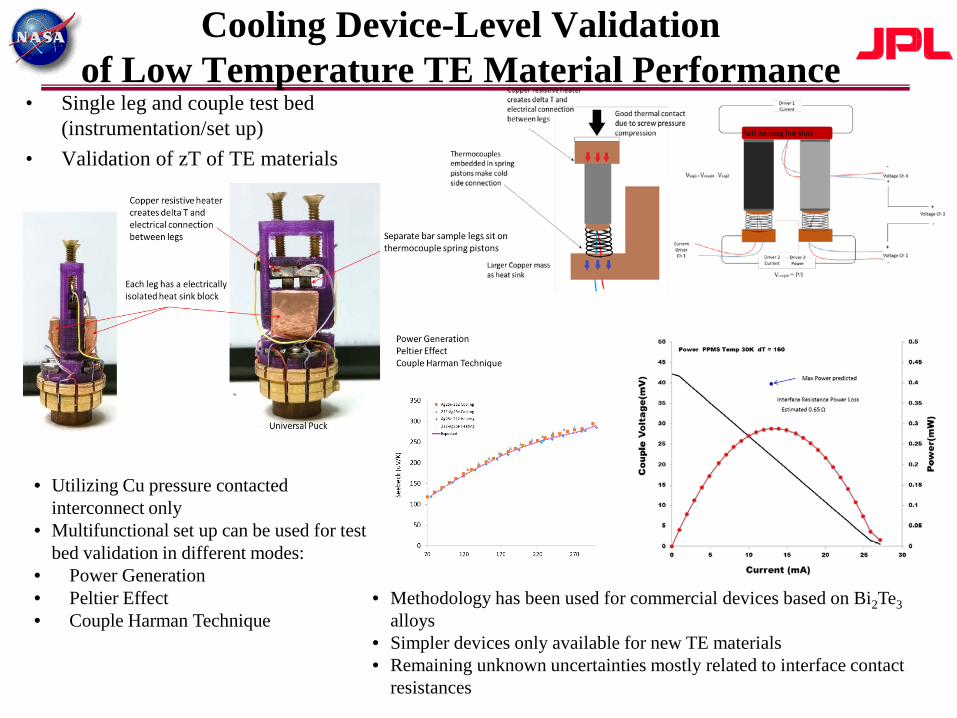
Cooling Device-Level Validation of Low Temperature TE Material Performance
• Single leg and couple test bed (instrumentation/set up)
• Validation of zT of TE materials
• Utilizing Cu pressure contacted interconnect only
• Multifunctional set up can be used for test bed validation in different modes:
• Power Generation • Peltier Effect• Couple Harman Technique
Self-heating hot shoe
• Methodology has been used for commercial devices based on Bi2Te3alloys
• Simpler devices only available for new TE materials• Remaining unknown uncertainties mostly related to interface contact
resistances

Power Generation Device-Level Validation of High Temperature TE Material Performance
• Various methods exist or under development to provide rapid validation of TE material performance– End-to-end single TE device leg performance under large ∆T
• Open circuit voltage for validating Seebeck• Under varying current loads for resistance of TE material and
interfaces– Full couple under large ∆T
• ZT measured with differential Harman method• Calculated TE transport properties• Good agreement with materials property measurements• Some limitations related to heat losses, thermal and electrical
contact resistances
JPL NIST UQ Workshop 1-13-2016
*Schematic taken from Kraemer and Chen, Rev. Sci. Instruments, 85, 045107 (2014)
∆V, ∆T
Summary
• The TE R&D community has very significantly grown over the past 20 years, and has somewhat been struggling in how materials and device performance are being reported and cross-checked
• Lots of potential for measurement errors in electric and thermal measurements– Across a wide range of operating temperatures– Typically across significant temperature differentials and/or temperature
gradients• Increased availability of “COTS” materials testing equipment – more
difficult to “educate” the TE community on measurement uncertainties and error pitfalls
• Need for cross-checking measurements using multiple techniques, including device level methods
• In addition to obfuscating the pace of materials R&D progress, UQ in thermoelectrics has some significant implications on the generation of high reliability system performance predictions
JPL NIST UQ Workshop 1-13-2016

Acknowlegments
• Part of this work was performed at the Jet Propulsion Laboratory, California Institute of Technology under contract with the National Aeronautics and Space Administration
JPL NIST UQ Workshop 1-13-2016