Embed Size (px)
Citation preview
The challenge of globalization for Finland and its regions: The new economic geographyperspective
Prepared within the framework of study Finland in the Global Economy, Prime Minister’s Office, Helsinki
Gianmarco I.P. Ottaviano, Dino Pinelli

Plan of the presentation
Background and objectivesPart A - Theoretical framework and existing empiricalevidence– ‘new economic geography’ (NEG)– [existing empirical evidence]– welfare implications
Part B - Empirical analysis of Finland– methodology– results
Conclusion– globalization, Finland and its regions– globalization, Finland and the world
2

BACKGROUND AND OBJECTIVES
Globalization is creating a unique global market forgoods, factors and ideas. Central question is:
Objectives– to tackle this question from a NEG perspective– to compare NEG predictions with empirical evidence– to draw implications for Finland
How will this process change the position of Finland and its regions
within the global economy?
3
PART A - THEORETICAL FRAMEWORKPrelude
4
Places differ in terms of natural resources, access tonatural means of communication, climatic condition
First Nature
This is not sufficient to explain observed dramaticdifferences in economic development
Other forces are necessary, that are inherent to the functioning of economic interactions and that are ableto generate uneven development even across ex-ante identical places
Second Nature
A. New Economic Geography (NEG)
Various ‘second nature’ forces have beenstudied by economists, geographers and regional scientistsNEG focuses on the interactions among firms and workers taking place in the market Intense scale returns and market power generate self-sustaining process of agglomeration
5
A. Insights of NEG
1. Location decision2. Circular causation3. Micro-structure
industry characteristicsaccessibility and competitioncountriesregionsglobalization
6
A1. Location decision
The location decision of a firm affects otherfirms profits and overall welfareNo quid-pro-quo is paid for these impacts– NEG ‘pecuniary’ externalities: through market-
interactions when firms have market power– ‘technological’ externalities: through non-market
interactions
7
Localized externalitiesFirm’s location decisions jointly generate localizedexternalities that determine regional attractiveness
8
A2. Circular causation
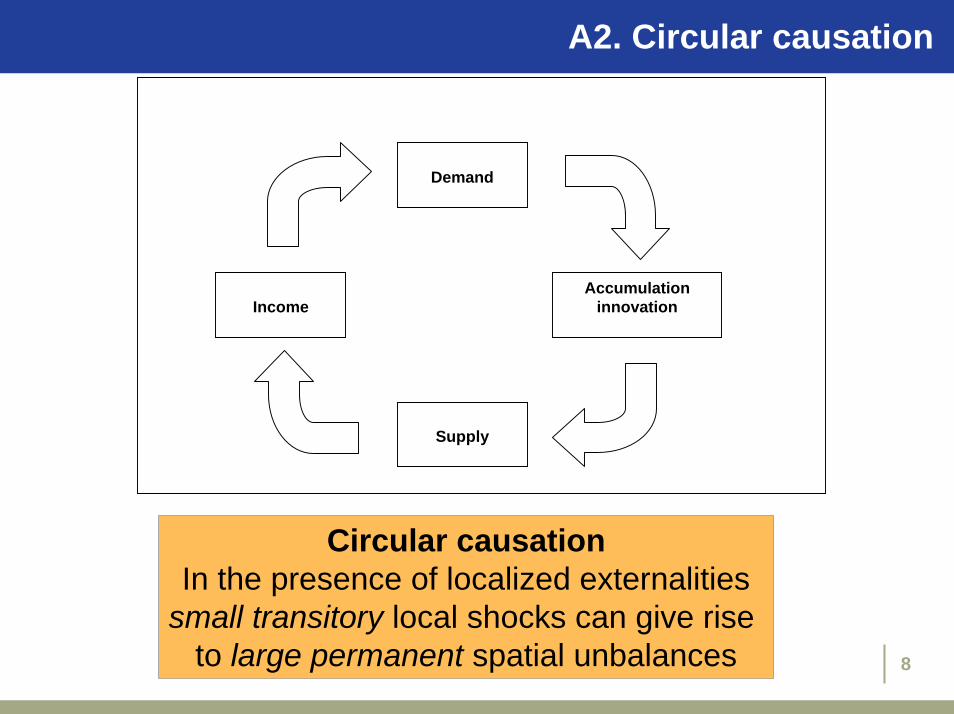
Demand
Accumulationinnovation
Supply
Income
Circular causationIn the presence of localized externalities
small transitory local shocks can give rise to large permanent spatial unbalances

A3. Micro-structure:1/7 NEG features
General equilibrium modeling:Location and prices are simultaneously determined
Solid micro-economic foundations:Evolution of the spatial landscape related to key micro-economic parameters
Result A.1: Positive externalities are stronger in sectors withpronounced scale economies and strong market
power.These sectors are more clustered.
9

A3. Micro-structure: 2/7 Market potential
Market potential measures the location appeal of a region A in terms of customer and supplier proximity
Nominal Market Potential (NMP): weighted nominal average expenditures across all regions that plant can tap if located in A– It measures customer proximity– It predicts the sales of the firm
Real Market Potential (RMP): weighted real average expenditures across all regions that plant can tap if located in A– It measures customer and competitor proximity – It predicts the profits of the firm
10
A3. Micro-structure: 3/7 Role of market potential
Since firms can freely pick plants location, they will beattracted by high RMP (ie, profits) areas In the long run competition will bring profits back to the same normal level everywhereRMP differences will eventually vanish as NMP differentials are capitalized in local price differences
11
Result A.2:The sales and profits an average firm can make if
located in a certain area are measured by the area’s NMP and RMP.
Differences in RMP predict future evolution of the economic landscape.
A3. Micro-structure: 4/7 Example
Start with two identical regions, ‘home’ and ‘foreign’– in terms of expenditures, population, number of plants
Positive shock to expenditure in the ‘home’ regionIts NMP (ie, the sales) and RMP (ie, the profits) increase
as access to local customers is costless, but access to foreign customers is costly
As profits rise, supply expands (ie, plants and population grow) until profits are back to the normallevel everywhere
12

A3. Micro-structure: 5/7 Dynamics
In the transition– the home region grows faster as higher profits increase the
returns to investment in both physical and human capital and the returns to innovation
In the end– the larger region hosts more plants (and people) and, on
average, these are larger, more productive, more profitable– because of imperfect competition the final supply gap is
higher than the initial expenditure gap (‘home market effect’)
13
Result A.3:Markets with higher NMP host more people and firms. These are larger, more productive and more profitable
than firms in lower NMP
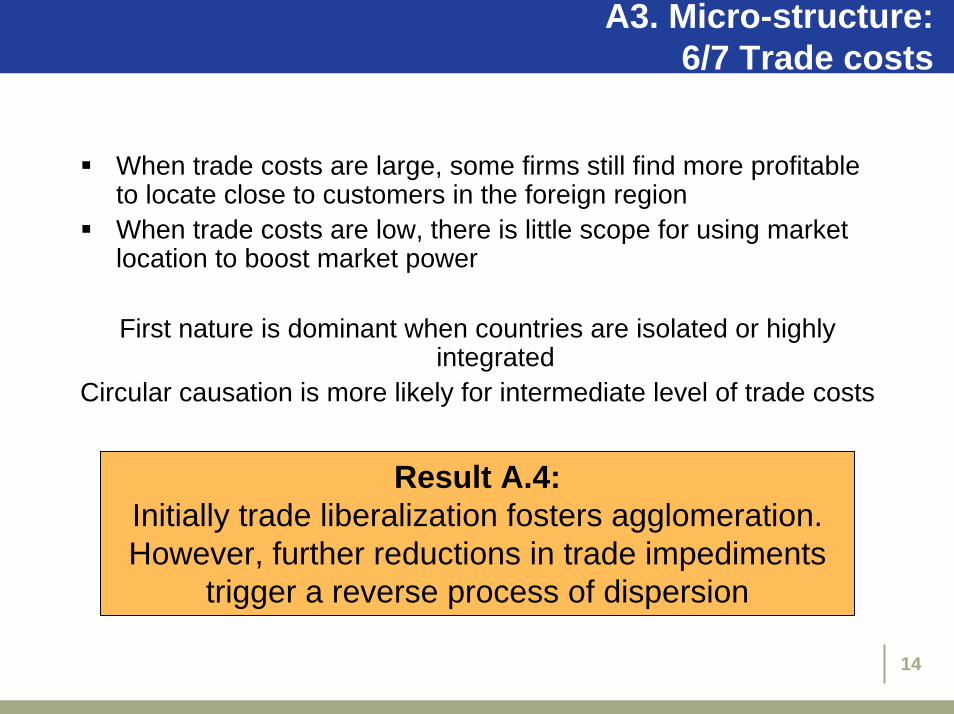
A3. Micro-structure: 6/7 Trade costs
When trade costs are large, some firms still find more profitableto locate close to customers in the foreign regionWhen trade costs are low, there is little scope for using market location to boost market power
First nature is dominant when countries are isolated or highlyintegrated
Circular causation is more likely for intermediate level of trade costs
Result A.4:Initially trade liberalization fosters agglomeration.However, further reductions in trade impediments
trigger a reverse process of dispersion
14
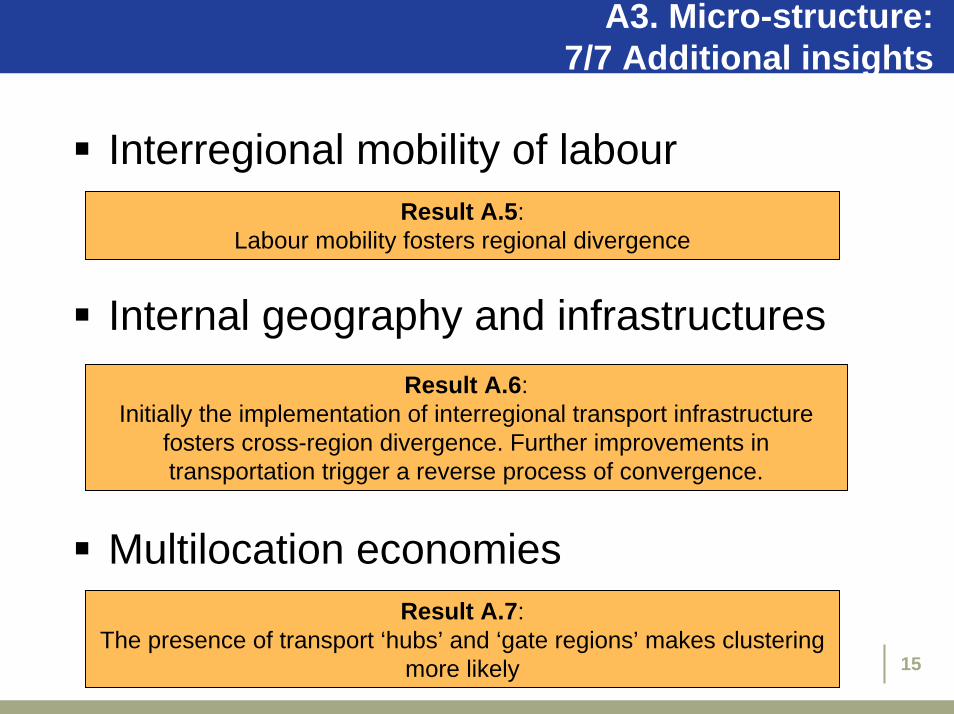
A3. Micro-structure: 7/7 Additional insights
Internal geography and infrastructures
Multilocation economies
Interregional mobility of labour
15
Result A.5: Labour mobility fosters regional divergence
Result A.6: Initially the implementation of interregional transport infrastructure
fosters cross-region divergence. Further improvements in transportation trigger a reverse process of convergence.
Result A.7: The presence of transport ‘hubs’ and ‘gate regions’ makes clustering
more likely
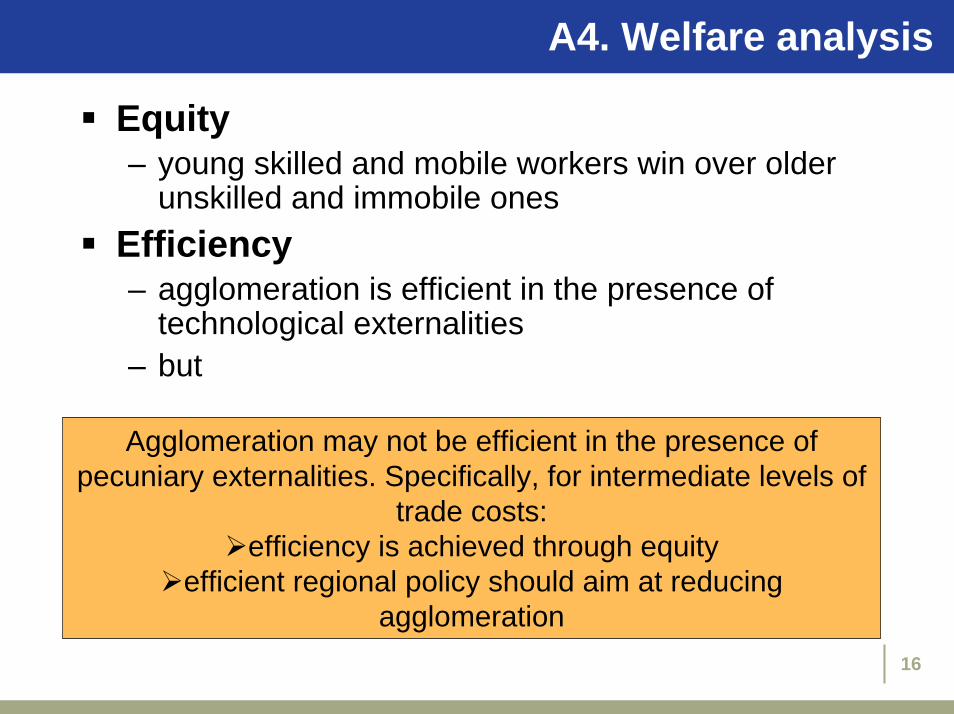
A4. Welfare analysis
Equity– young skilled and mobile workers win over older
unskilled and immobile onesEfficiency– agglomeration is efficient in the presence of
technological externalities– but
16
Agglomeration may not be efficient in the presence of pecuniary externalities. Specifically, for intermediate levels of
trade costs: efficiency is achieved through equity
efficient regional policy should aim at reducingagglomeration

PART B – EVIDENCE ON FINLAND
Methodology and dataDescriptive analysisEconometric results
Summary resultNEG implications matter
17

B1. Methodology:1/8 Price and quantity effects
NMP captures customer/supplier proximity and measures expected salesRMP captures customer/supplier and competitors proximity and measures expected profitsCross-location RMP differentials will eventually vanish in the long run – as firms move to high RMP areas and NMP differentials are
capitalised in local price differences Similarly, real wage differences (ie, RMP) shouldeventually vanish in the long run– as nominal wage differentials (ie, NMP) are capitalised in local
price differences
18

B1. Methodology:2/8 NEG predictions
Expected effects on factor prices– Higher NMP should be associated with
higher profits and higher nominal wages, and higher local prices in the long-run
Expected effects on factor quantities– Positive shocks to NMP should attract both
firms and workers
19
20
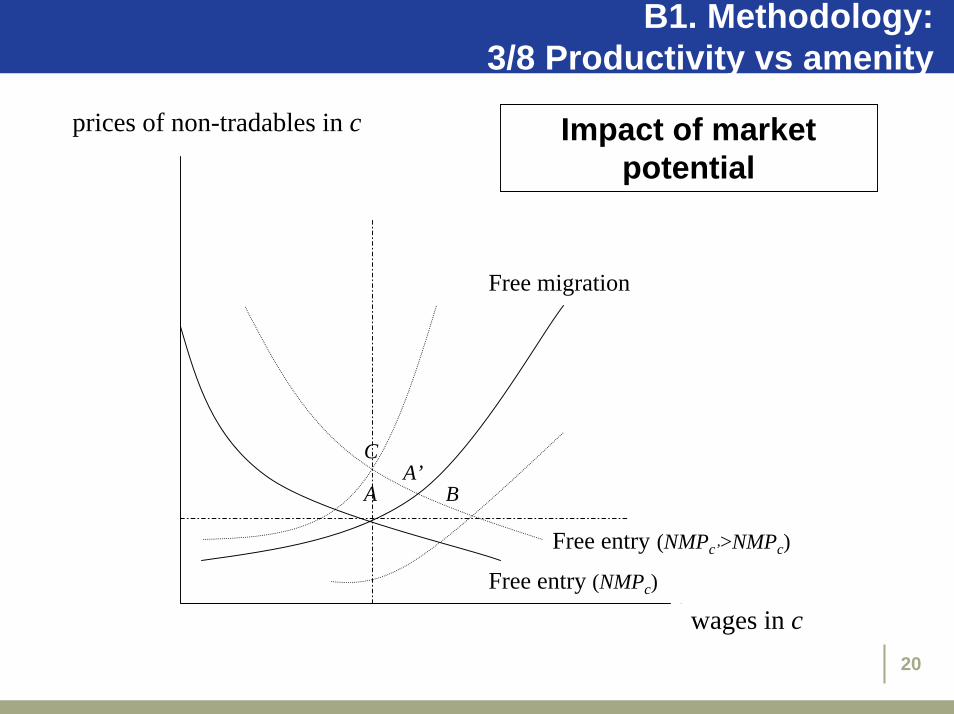
B1. Methodology:3/8 Productivity vs amenity
wc
rc
Free migration
Free entry (NMPc)
Free entry (NMPc’>NMPc)
AA’
B
C
prices of non-tradables in c
wages in c
Impact of market potential
B1. Methodology:4/8 Indicators of regional performance
Three indicators of regional performance– income per capita growth (taxable and primary) – population growth (adjusted and unadjusted for
natality and mortality)– house prices growth
21

B1. Methodology:5/8 Identification
Population/local price variation
Positive Negative
Positive Higher productivity
Lower quality of life
Negative Higher quality of life
Lower productivity
Income/ wage variation
22
23
B1. Methodology:6/8 Explanatory variables: growth theory
Controlling for convergenceProximate sources of growth– human capital
% of population with tertiary education– knowledge capital
R&D expenditure, number of patents (in per capita terms)
Wider influences– policies
unemployment ratecentral government expenditure and central government grants tomunicipalities (in per capita terms)
– international openness and infrastructuresdistances from airports, ports and Russian border
– industrial structure% of employment in agriculture/manufacturing% of employment in ICT
B1. Methodology:7/8 Explanatory variables: first and second nature
First nature– natural communications
distance from ports
– climate and natural conditions% of land covered by lakesaverage annual temperature
Second nature– pecuniary externalities
market potential
– technological externalitiesdensity of the population
24
B1. Methodology:8/8 Period of analysis
Period of analysis: 1977-2002Two sub-periods:– Pre-recession: 1977-1990
(1987-1990 for house prices)– Post-recession: 1994-2002
25
26
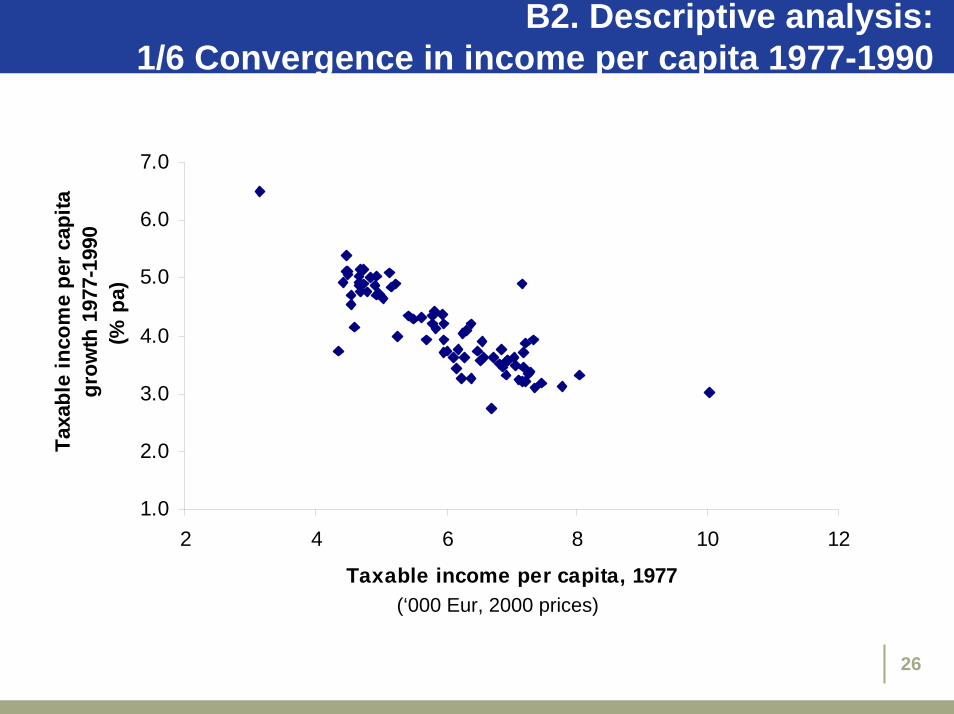
B2. Descriptive analysis:1/6 Convergence in income per capita 1977-1990
1.0
2.0
3.0
4.0
5.0
6.0
7.0
2 4 6 8 10 12
Taxable income per capita, 1977
Taxa
ble
inco
me
per c
apita
g
row
th 1
977-
1990
(% p
a)
(‘000 Eur, 2000 prices)
27
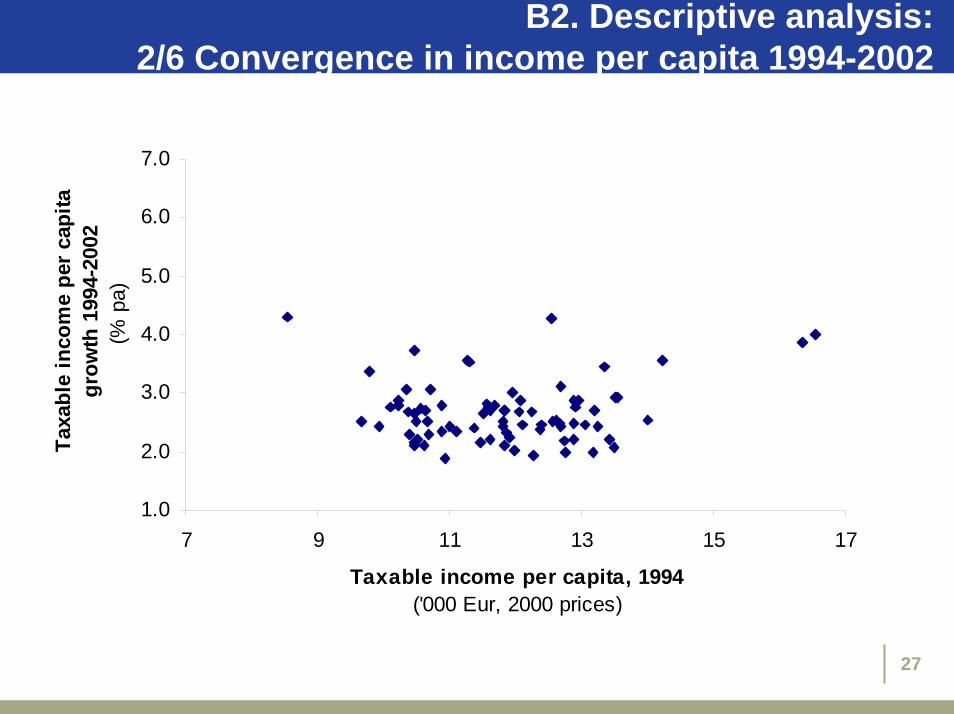
B2. Descriptive analysis:2/6 Convergence in income per capita 1994-2002
1.0
2.0
3.0
4.0
5.0
6.0
7.0
7 9 11 13 15 17
Taxable income per capita, 1994('000 Eur, 2000 prices)
Taxa
ble
inco
me
per c
apita
g
row
th 1
994-
2002
(% p
a)
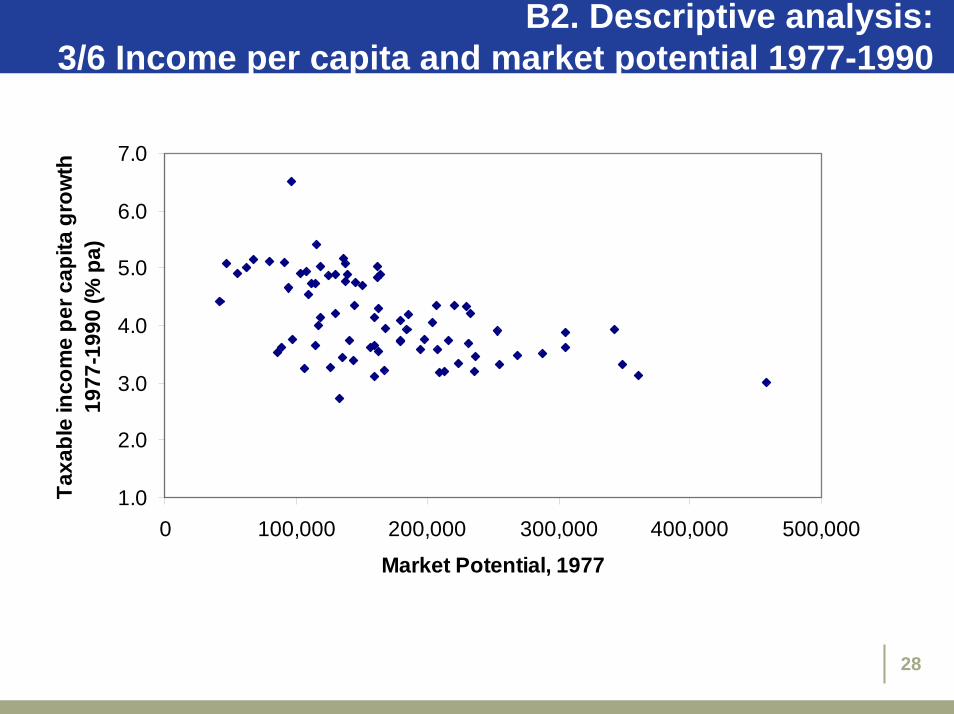
B2. Descriptive analysis:3/6 Income per capita and market potential 1977-1990
1.0
2.0
3.0
4.0
5.0
6.0
7.0
0 100,000 200,000 300,000 400,000 500,000
Market Potential, 1977
Taxa
ble
inco
me
per c
apita
gro
wth
19
77-1
990
(% p
a)
28
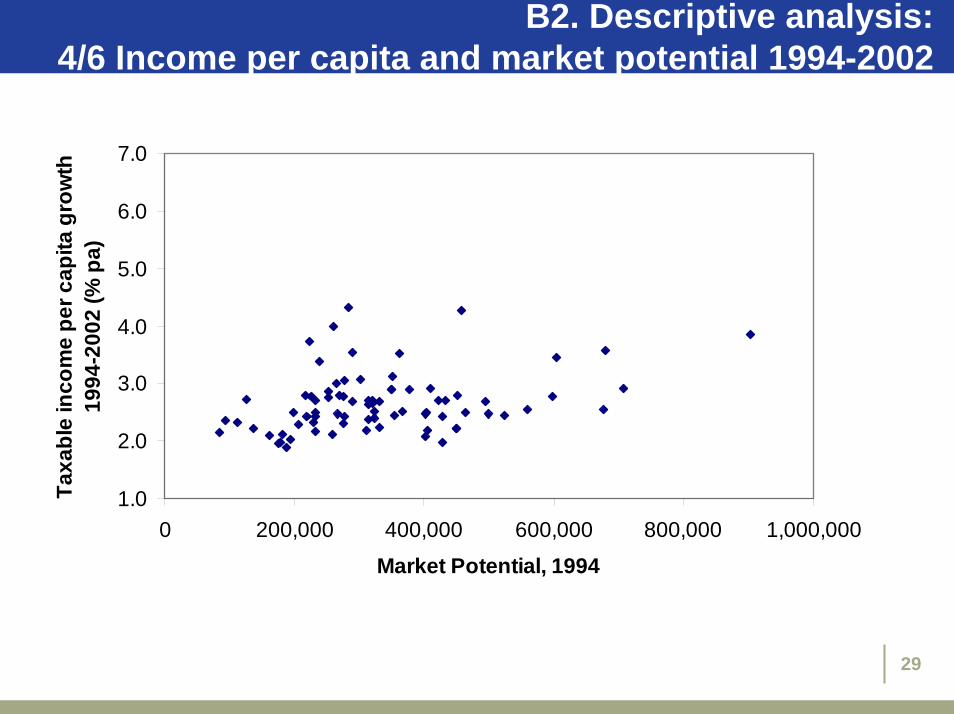
B2. Descriptive analysis:4/6 Income per capita and market potential 1994-2002
1.0
2.0
3.0
4.0
5.0
6.0
7.0
0 200,000 400,000 600,000 800,000 1,000,000
Market Potential, 1994
Taxa
ble
inco
me
per c
apita
gro
wth
19
94-2
002
(% p
a)
29
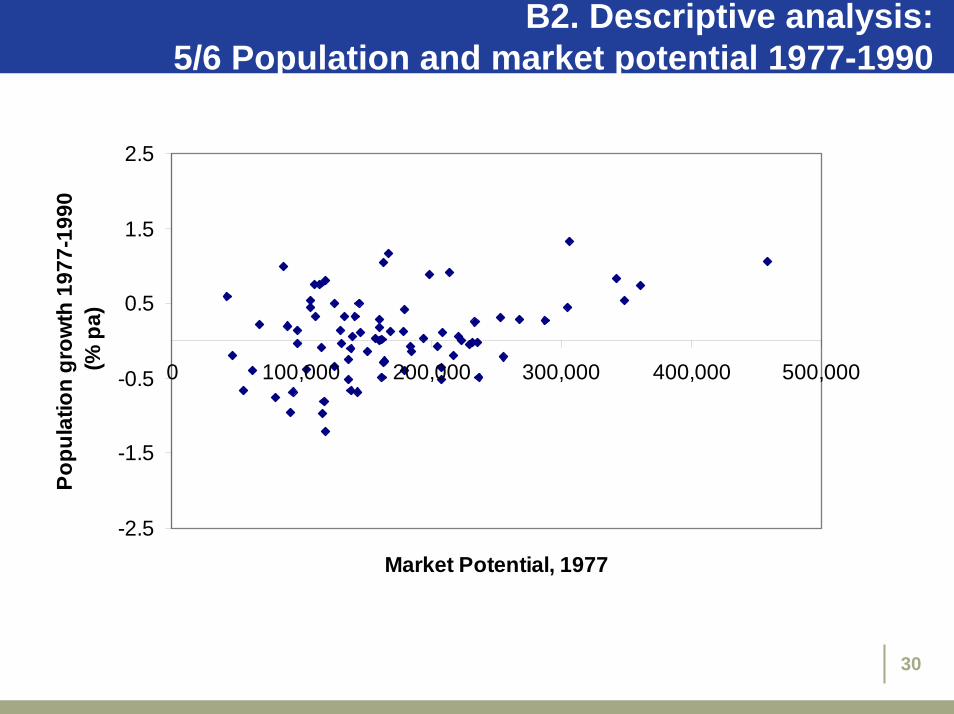
B2. Descriptive analysis:5/6 Population and market potential 1977-1990
-2.5
-1.5
-0.5
0.5
1.5
2.5
0 100,000 200,000 300,000 400,000 500,000
Market Potential, 1977
Popu
latio
n gr
owth
197
7-19
90
(% p
a)
30
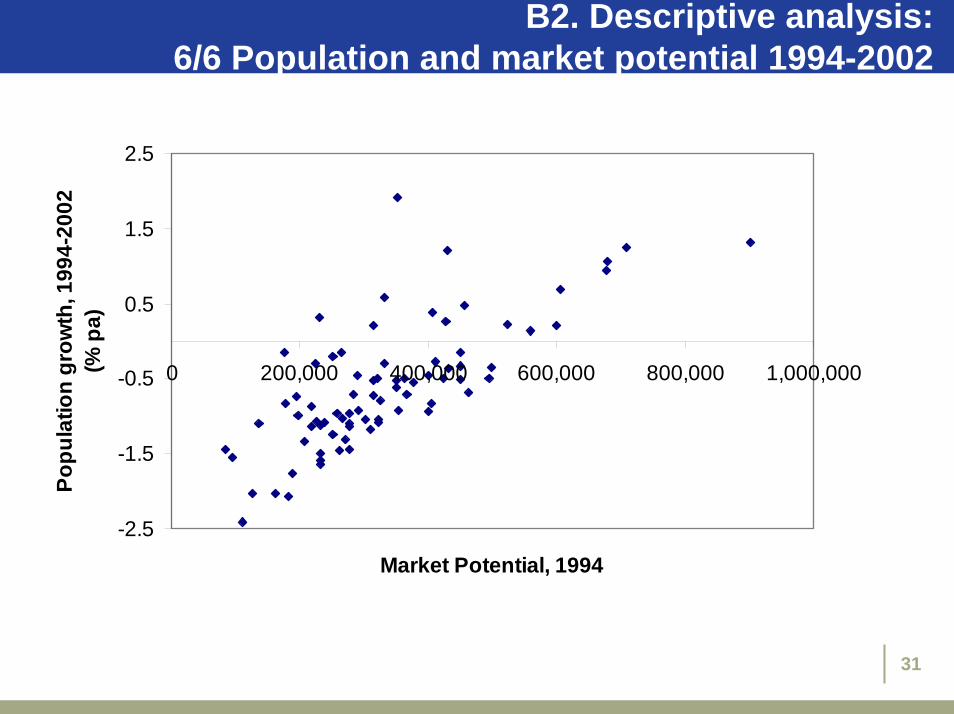
B2. Descriptive analysis:6/6 Population and market potential 1994-2002
-2.5
-1.5
-0.5
0.5
1.5
2.5
0 200,000 400,000 600,000 800,000 1,000,000
Market Potential, 1994
Popu
latio
n gr
owth
, 199
4-20
02
(% p
a)
31

B3. Econometric results:1/3 Legenda
LEGENDA:
(P+) = positive impact on productivity
(P-) = negative impact on productivity
(C+) = positive impact on quality of life
(C-) = negative impact on quality of life
(conv) = regional convergence
(div) = regional divergence
-- = no significant impact.
32
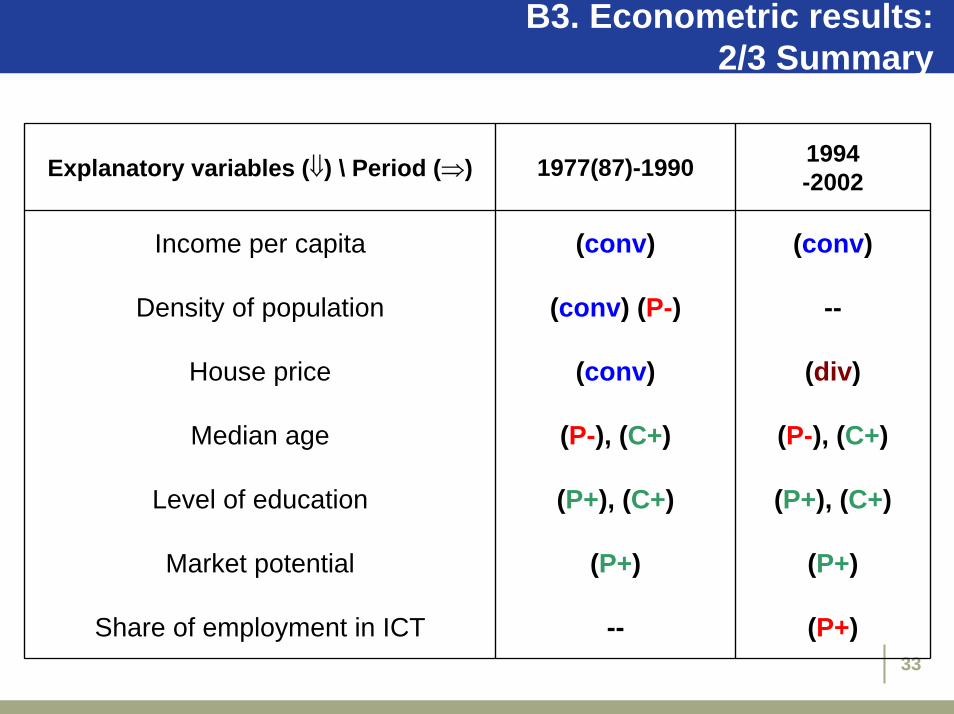
B3. Econometric results:2/3 Summary
33
Explanatory variables (⇓) \ Period (⇒) 1977(87)-1990 1994-2002
Income per capita (conv) (conv)
Density of population (conv) (P-) --
House price (conv) (div)
Median age (P-), (C+) (P-), (C+)
Level of education (P+), (C+) (P+), (C+)
Market potential (P+) (P+)
Share of employment in ICT -- (P+)
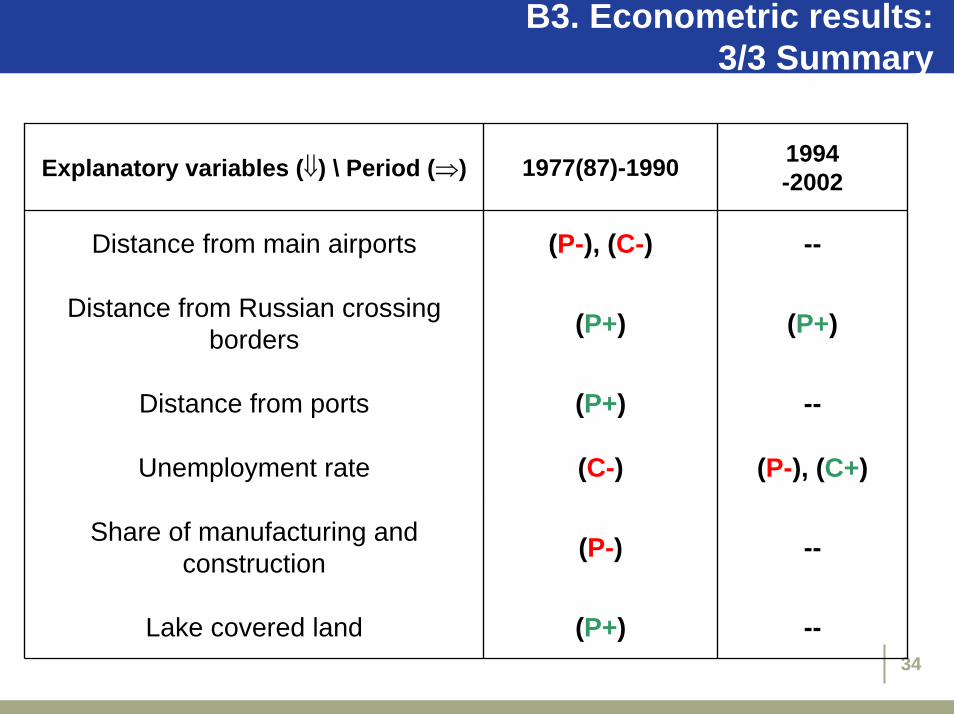
B3. Econometric results:3/3 Summary
34
Explanatory variables (⇓) \ Period (⇒) 1977(87)-1990 1994-2002
Distance from main airports (P-), (C-) --
Distance from Russian crossing borders (P+) (P+)
Distance from ports (P+) --
Unemployment rate (C-) (P-), (C+)
Share of manufacturing and construction (P-) --
Lake covered land (P+) --
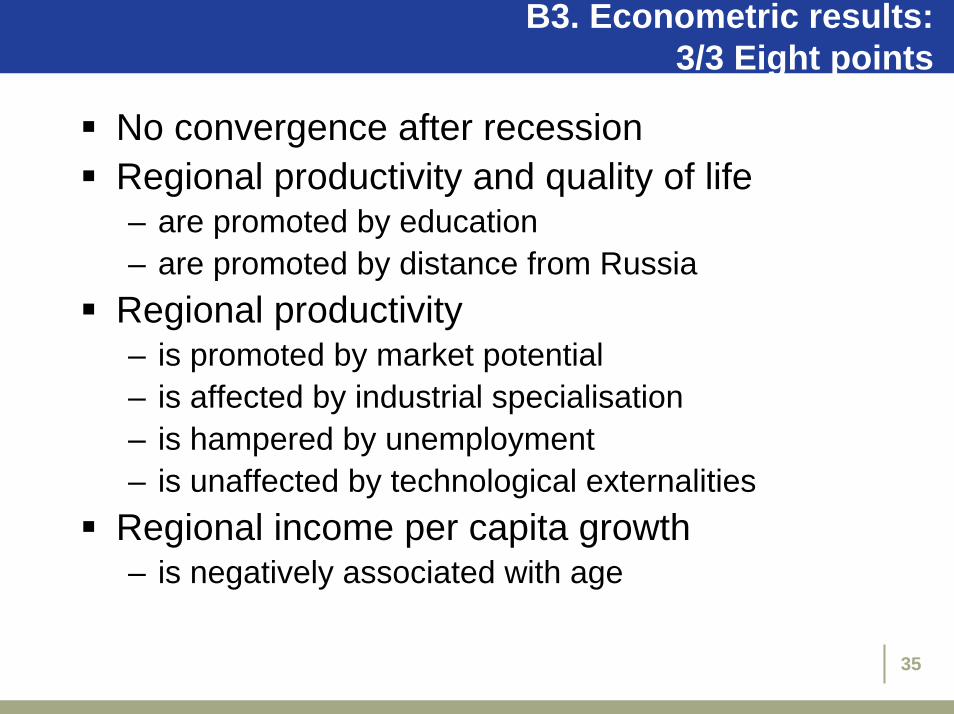
B3. Econometric results:3/3 Eight points
No convergence after recessionRegional productivity and quality of life– are promoted by education– are promoted by distance from Russia
Regional productivity– is promoted by market potential– is affected by industrial specialisation– is hampered by unemployment– is unaffected by technological externalities
Regional income per capita growth– is negatively associated with age
35

Conclusion:1/3 Regional advantage
Successful regions are characterized by highly educated people, firms
that are active in dynamic sectors, good access to national and
international markets
36
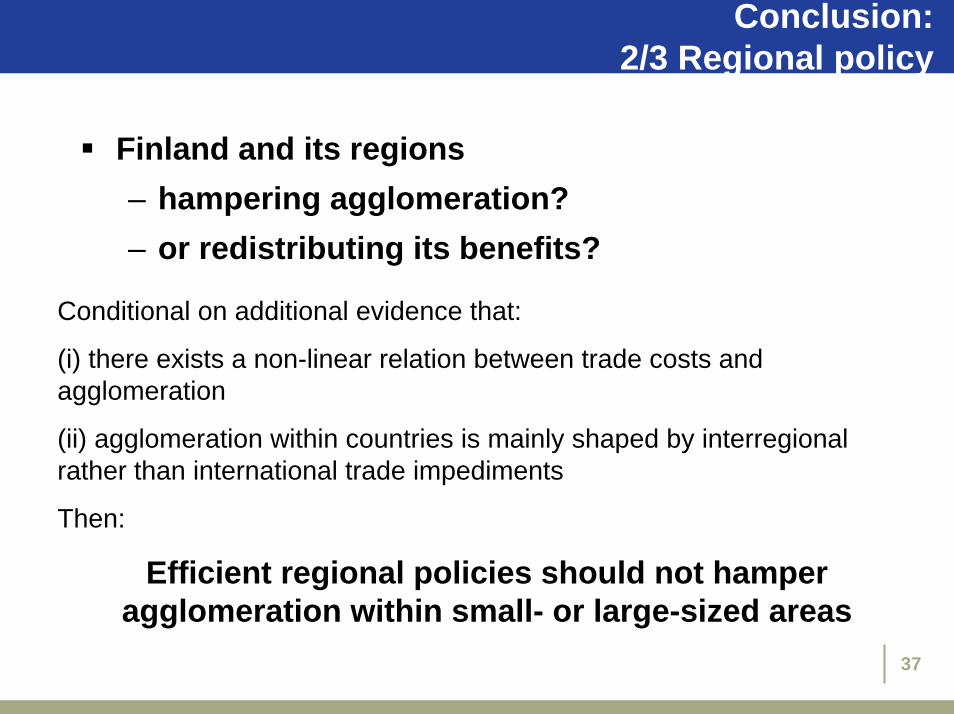
Conclusion:2/3 Regional policy
Finland and its regions– hampering agglomeration?– or redistributing its benefits?
37
Conditional on additional evidence that:
(i) there exists a non-linear relation between trade costs and agglomeration
(ii) agglomeration within countries is mainly shaped by interregional rather than international trade impediments
Then:
Efficient regional policies should not hamper agglomeration within small- or large-sized areas

Conclusion:3/3 Globalization
Finland and the world– cons: peripherality and unemployment– pros: technology and education
38