Embed Size (px)
Citation preview
The CFOs View of Accounts Payable: Cash is King
February 2009
Andrew Bartolini, Christopher J. Dwyer
The CFOs View of Accounts Payable: Cash is King Page 2
© 2009 Aberdeen Group. Telephone: 617 854 5200
Executive Summary Research Benchmark
Aberdeen’s Research Benchmarks provide an in-depth and comprehensive look into process, procedure, methodologies, and technologies with best practice identification and actionable recommendations
Against the backdrop of the current economic crisis, finance executives are concerned about their short- and mid-term financing, as well as their ability to manage risk and execute business strategies. These executives have intensified their focus on working capital, especially improving cash positions. The age-old adage - cash is king - has never been more true.
The typical A/P department is uniquely positioned to support a firm's cash management objectives, including extending Days Payable Outstanding (DPO) but also capturing early payment and volume discounts while avoiding late payment fees and providing support to ensure orders and payments are compliant to contracts.
Best-in-Class Performance
"We have cut back on personnel in most areas of the company. We have seen our inventory turnover extended and receivables extended. We are tightening our credit policies as to take fewer chances. We are actually taking discount on the payables side where appropriate. Our cash balance has decreased as business is down but greater controls with lean manufacturing and an acute awareness by all employees of the current situation has gone a long way."
~ Finance Director Publishing Company, Canada
Aberdeen evaluated over 160 enterprises between January and February of 2009 and distinguished Best-in-Class enterprises by the following key performance criterion: the overall cost to process a single invoice (from receipt through settlement). Best-in-Class enterprises in this study are notable for their superior performance and higher levels of electronic invoices. The Best-in-Class also report:
• Invoice processing costs that are, on average, 84% below their peers
• Invoice processing cycle times that are, on average, 59% faster than their peers
Competitive Maturity Assessment Research results show that the firms enjoying Best-in-Class performance shared several common characteristics across their A/P operations:
• 69% possess enterprise-level visibility into A/P processes
• 75% report robust audit controls
• 62% utilize online or web-based reporting tools
Required Actions In addition to the specific recommendations in Chapter Three, to achieve Best in Class performance, enterprises must:
• Move toward a fully automated environment that integrates e-payables solutions with existing procurement and financial systems
• Establish a linkage between A/P goals and objectives and the broader goals of the finance
• Develop disbursement strategies in concert with treasury and finance teams that seek to optimize working capital
www.aberdeen.com Fax: 617 723 7897

The CFOs View of Accounts Payable: Cash is King Page 3
© 2009 Aberdeen Group. Telephone: 617 854 5200 www.aberdeen.com Fax: 617 723 7897
Table of Contents Executive Summary....................................................................................................... 2
Best-in-Class Performance..................................................................................... 2 Competitive Maturity Assessment....................................................................... 2 Required Actions...................................................................................................... 2
Chapter One: Benchmarking the Best-in-Class ..................................................... 5 Survival of the Fittest............................................................................................... 5 The Chief Financial Officer's Agenda................................................................... 6 The Maturity Class Framework............................................................................ 9 The Best-in-Class PACE Model ..........................................................................10
Chapter Two: Benchmarking Requirements for Success ..................................12 Competitive Assessment......................................................................................12 Competitive Framework Analysis ......................................................................13 The Missing Link: Process Automation.............................................................15
Chapter Three: Required Actions .........................................................................19 Laggard Steps to Success......................................................................................19 Industry Average Steps to Success ....................................................................20 Best-in-Class Steps to Success ............................................................................20
Appendix A: Research Methodology.....................................................................22 Appendix B: Related Aberdeen Research............................................................24
Figures Figure 1: Accounts Payable Reporting Lines........................................................... 5 Figure 2: Accounts Payable - Increasingly Strategic .............................................. 6 Figure 3: "High" Priorities for 2009 .......................................................................... 7 Figure 4: Accounts Payable Strategic Planning........................................................ 8 Figure 5: CFO's Preferred Strategy to Reduce Processing Costs ..................... 8 Figure 6: Accounts Payable Department Structure .............................................. 9 Figure 7: Invoice Processing Cost Components..................................................10 Figure 8: Electronic versus Manual Invoice Processing Costs ..........................15 Figure 9: Electronic Invoices and Payments ..........................................................16 Figure 10: Exception Rates........................................................................................17 Figure 11: The CFO's Satisfaction with A/P..........................................................17
Tables Table 1: Top Performers Earn Best-in-Class Status.............................................. 9 Table 2: The Best-in-Class PACE Framework .....................................................11 Table 3: The Competitive Framework...................................................................13 Table 4: Poor Collaboration and the Impact on A/P Stakeholders.................14 Table 5: Cycle Time Performance, Best-in-Class versus All Others ..............16 Table 6: The PACE Framework Key ......................................................................23
The CFOs View of Accounts Payable: Cash is King Page 4
© 2009 Aberdeen Group. Telephone: 617 854 5200 www.aberdeen.com Fax: 617 723 7897
Table 7: The Competitive Framework Key ..........................................................23 Table 8: The Relationship Between PACE and the Competitive Framework.........................................................................................................................................23

The CFOs View of Accounts Payable: Cash is King Page 5
© 2009 Aberdeen Group. Telephone: 617 854 5200
Chapter One: Benchmarking the Best-in-Class
Survival of the Fittest Fast Facts
√ Cost containment (73%) and cash management (70%) top the CFO's agenda for 2009
√ 56% of CFO's consider A/P as more strategic than it was two years ago
Charles Darwin celebrated his bicentenary birthday this month, turning 200 years old. Later this year we will mark the 150th anniversary of his most famous work, The Origin of the Species, where he introduced his theory of natural selection, perhaps the foundational principle of all life sciences today. It was, however, a contemporary of Darwin’s, the British economist, Herbert Spencer, who first coined the phrase ‘survival of the fittest’ to summarize Darwin’s revolutionary thesis.
As an economist, Spencer applied this concept to the business world surmising that only the companies that were most adept at competing for and garnering the limited resources in a given environment would survive. With bedrock institutions and entire industries now poised on the brink of collapse and the likelihood of a quick rebound fading fast, profitability now stands as a secondary concern to basic survival for many CFOs. In this context, it is incumbent upon CFOs to pull any and all business levers that can drive productivity and savings. But whether it is the opportunities that lie in organizational change or the necessity that drives the basest survival instincts, those business leaders who not only rise to meet today’s daunting challenges but use these challenges as a driving force to impact their enterprise today will be better positioned for long-term survival…. and long-term success.
"Our top priority for 2009? Survival."
~ Finance Director, Mid-sized Hospitality Company
Natural Order of A/P It is the natural order of accounts payable departments that they report into the finance organization of their enterprise; three-quarters of all A/P departments fall directly under the purview of the CFO (Figure 1).
Figure 1: Accounts Payable Reporting Lines
75%
8%
7%
7% 3% Finance (CFO, TreasurerController)
CEO, President or otherbusiness executive
Procurement (VP ofProcurement, CPO)
Operations (COO or VPShared Services)
Individual line of businessmanager (i.e. GeneralManager)
"[This year] we laid off poor performers, delayed hiring and are stretching payables to 45 - 60 days."
~ President, Small Financial Services Company
Source: Aberdeen Group, February 2009
www.aberdeen.com Fax: 617 723 7897
The CFOs View of Accounts Payable: Cash is King Page 6
© 2009 Aberdeen Group. Telephone: 617 854 5200
And yet, in our discussions with A/P managers, controllers and directors of shared services departments, the amount of time, support and overall level of interest the CFO provides to A/P operations is extremely limited. This should not be a surprise because, frankly, there are larger departments within the enterprise that have similar reporting relationships and face similar challenges in gaining the mind-share of their CFO, whose role has increased exponentially over the past decade. No longer "just" another CPA and former accounting partner, today’s CFO must master the business as he / she masters the numbers.
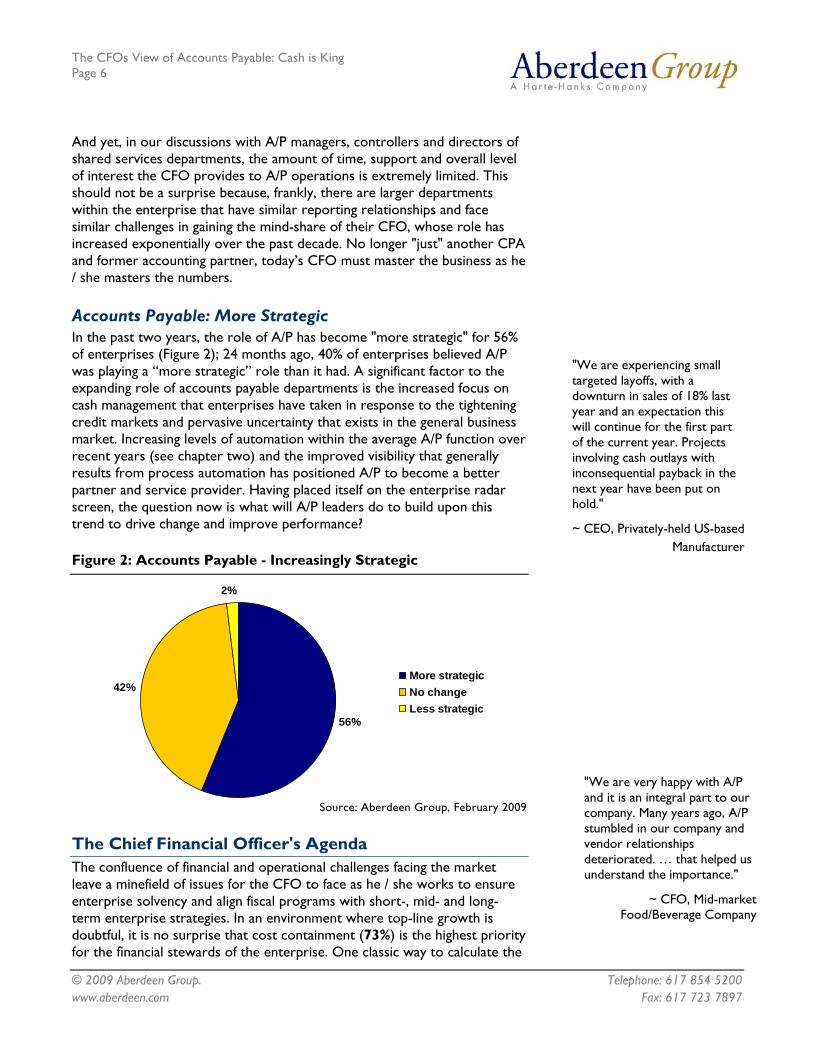
Accounts Payable: More Strategic In the past two years, the role of A/P has become "more strategic" for 56% of enterprises (Figure 2); 24 months ago, 40% of enterprises believed A/P was playing a “more strategic” role than it had. A significant factor to the expanding role of accounts payable departments is the increased focus on cash management that enterprises have taken in response to the tightening credit markets and pervasive uncertainty that exists in the general business market. Increasing levels of automation within the average A/P function over recent years (see chapter two) and the improved visibility that generally results from process automation has positioned A/P to become a better partner and service provider. Having placed itself on the enterprise radar screen, the question now is what will A/P leaders do to build upon this trend to drive change and improve performance?
"We are experiencing small targeted layoffs, with a downturn in sales of 18% last year and an expectation this will continue for the first part of the current year. Projects involving cash outlays with inconsequential payback in the next year have been put on hold."
~ CEO, Privately-held US-based Manufacturer
Figure 2: Accounts Payable - Increasingly Strategic
56%
42%
2%
More strategicNo changeLess strategic
Source: Aberdeen Group, February 2009
"We are very happy with A/P and it is an integral part to our company. Many years ago, A/P stumbled in our company and vendor relationships deteriorated. … that helped us understand the importance."
~ CFO, Mid-market Food/Beverage Company
The Chief Financial Officer's Agenda The confluence of financial and operational challenges facing the market leave a minefield of issues for the CFO to face as he / she works to ensure enterprise solvency and align fiscal programs with short-, mid- and long-term enterprise strategies. In an environment where top-line growth is doubtful, it is no surprise that cost containment (73%) is the highest priority for the financial stewards of the enterprise. One classic way to calculate the
www.aberdeen.com Fax: 617 723 7897

The CFOs View of Accounts Payable: Cash is King Page 7
© 2009 Aberdeen Group. Telephone: 617 854 5200
market value of a company is to look at the present value of future cash flows. This means that costs “contained” or dollars saved make a positive contribution to operating income and therefore company value.
Cash management (70%) is of similar importance for the CFO because, in a business environment with very tight credit, cash is truly king. Both savings and cash on hand provide greater assurances to CFOs, investors, employees, customers, and supply chain partners of on-going solvency and an ability to perform against current and future contracts.
Figure 3: "High" Priorities for 2009
43%
53%
70%
73%
Mitigate risk
Forecast financialperformance
Optimize workingcapital (cash
mgmt.)
Reduce costs
Source: Aberdeen Group, February 2009
Accounts Payable: More Strategic? It is difficult to imagine a business function becoming more strategic to the enterprise without a plan in place to achieve that goal. Yet roughly half of all A/P departments lack a formal strategic plan. "You can't collaborate without a strategy," said one SVP of Operational Excellence, who utilized a three-year strategic plan to identify more than $3 billion in cost savings. For most enterprise level departments, having a plan is but a small first step. However what is in the plan and how it is executed is ultimately what determines performance success. Contrary to their desire to become more strategic, the majority (the aggregated 68% identified by the red circles in Figure 4 below) of A/P leaders do not link their goals to those of the larger enterprise. As a result, they merely continue to contribute to their own irrelevance to the corporate agenda.
www.aberdeen.com Fax: 617 723 7897

The CFOs View of Accounts Payable: Cash is King Page 8
© 2009 Aberdeen Group. Telephone: 617 854 5200
Figure 4: Accounts Payable Strategic Planning
48%
18%14% 14%
6%
Do not performstrategicplanning
Single yearstrategic plan; integrated withthe enterprise
Single yearstrategic plan;not integrated
with theenterprise
Multi-yearstrategic plan;integrated withthe enterprise
Multi-yearstrategic plan;not integrated
with theenterprise
Source: Aberdeen Group, February 2009
Improving A/P Performance When given the choice of levers that could be utilized to reduce invoice processing costs, CFO's favor technology over process and people investments by a two-to-one and four-to-one margin respectively (Figure 5).
Figure 5: CFO's Preferred Strategy to Reduce Processing Costs
14%
29%57%
People training /Outsourcing
Processimprovement
E-Payables (A/Pautomation) solutions
Source: Aberdeen Group, February 2009
And they’re justifiably turning to technology solutions because of the quantifiable benefit to their business. CFOs that currently utilize e-payables solutions see benefits across a number of areas; 79% have seen some expense cost reduction and 77% have seen benefits in lowering payroll costs. Additionally CFOs believe that they have seen benefits in reducing errors (73% of CFOs) and improving pay performance (72% of CFOs). These factors strongly contribute to the CFOs preference for automation as a primary strategy to their lower invoice processing costs.
www.aberdeen.com Fax: 617 723 7897

The CFOs View of Accounts Payable: Cash is King Page 9
© 2009 Aberdeen Group. Telephone: 617 854 5200
Intelligent Designs One element that holds significant promise for A/P transformation is the organizational design or structure of the average department (Figure 6). While many departments utilize processes that have not advanced significantly in the past generation, the centralization of staff in regional offices or shared service centers enable teams to develop a foundation upon which a departmental and process overhaul can take shape. A centralized or shared services approach will help ensure that A/P tasks are streamlined and standardized, best practices are documented and shared, and A/P technology budgets are consolidated
Figure 6: Accounts Payable Department Structure
2%
3%
6%
13%
36%
40%
Decentralized withinmajor business units
Off-shore (in-house)function
Fully decentralizedreceipt, reconciliation,
and payment
Decentralized receipt andreconciliation (with
centralized payment)
Centralized on a regionalbasis
Shared service center
Source: Aberdeen Group February 2009
The Maturity Class Framework Aberdeen evaluated over 160 business leaders in January and February of 2009 and distinguished Best-in-Class enterprises by the average cost to process an invoice.
Table 1: Top Performers Earn Best-in-Class Status
Definition of Maturity Class Mean Class Performance
Best-in-Class: Top 20% of aggregate performance scorers
$1.66 cost to process an invoice
Industry Average: Middle 50% of aggregate
performance scorers
$12.62 cost to process an invoice
"A/P are his (the CFO's) eyes to controlling spend. Unnecessary items are brought to his attention."
~ A/P Manager Large Enterprise
www.aberdeen.com Fax: 617 723 7897

The CFOs View of Accounts Payable: Cash is King Page 10
© 2009 Aberdeen Group. Telephone: 617 854 5200
Definition of Maturity Class Mean Class Performance
Laggard: Bottom 30%
of aggregate performance scorers
Over $40 cost to process an invoice or "don't know the cost"
Source: Aberdeen Group, February 2009
Cost Components When benchmarking A/P department operations for the purposes of building a business case for transformation or driving a process improvement initiative, it is beneficial to understand how other groups approach this process. Aberdeen requested that each participant in this research effort list all of the factors that were included in the estimated cost to process an invoice. These factors generally included the people, operating, and administrative expenses associated with the accounts payable function and are shown in Figure 7 below. By taking the annual volume of invoices processed and dividing by the sum of annualized cost components, an invoice processing cost can be calculated.
Figure 7: Invoice Processing Cost Components
42%
44%
49%
70%
98%
Other payroll
Document handling /storage costs
Depreciation/amortizationon investments
Operating expenses
A/P Payroll
Source: Aberdeen Group, February 2009
The Best-in-Class PACE Model Aberdeen has shown that there is a clear relationship between the pressures companies identify and the actions they take, and their subsequent competitive performance. All participants should examine their prioritized Pressures, Actions, Capabilities, and Enablers (PACE) selections
www.aberdeen.com Fax: 617 723 7897

The CFOs View of Accounts Payable: Cash is King Page 11
© 2009 Aberdeen Group. Telephone: 617 854 5200 www.aberdeen.com Fax: 617 723 7897
and determine whether there are valuable perspectives to be gleaned by comparison with the PACE priorities of Best-in-Class companies (Table 2).
Table 2: The Best-in-Class PACE Framework
Pressures Actions Capabilities Enablers Pressure to optimize working capital
Standardize A/P processes Perform spend analysis of invoices Benchmark performance against peers
Centralized or shared services structure Tight internal payment controls Ability to quickly retrieve payment information for audits Robust audit controls
Spend analysis (for invoices) Electronic payment system(s) SOX compliance tracking and reporting Automated receipt management Imaging and workflow solution Automated disbursement tool Commercial cards
Source: Aberdeen Group, February 2009
Aberdeen Insight - Darwin Awards
While many barriers to a larger A/P transformation exist within the larger enterprise, occasionally A/P is its own worst enemy as the sampling of comments from a few recent conversations with A/P leaders shows:
"We have yet to implement an A/P ‘solution’ that has provided an acceptable ROI. The time and money spent on platforms, programs, training, systems integration, program troubleshooting, etc... far exceeds any cost and/or efficiency gains." – Partner, US-based Distribution/Logistics Company
"AP is seen as a tactical function. We lack standardized processes, so performance is based entirely on which staffer is involved. Our attempts to automate invoice to PO matching have failed and need to be started over. " CIO, Transportation Services Company
"A/P’s importance is low due to the low volume and value of the transactions processed through accounts payable with regard to overall company expenditures and payments." Finance Director, European-based Services Firm
“Our ability to realize benefits from automation and leverage systems has been greatly reduced by our entrenched management and inadequate staff expertise” Finance Director, Large Financial Services Company
In the next chapter, we will see what the Best-in-Class performers are doing to achieve their performance levels.
The CFOs View of Accounts Payable: Cash is King Page 12
© 2009 Aberdeen Group. Telephone: 617 854 5200
Chapter Two: Benchmarking Requirements for Success
Fast Facts
√ 69% of the Best-in-Class have enterprise-level visibility in A/P processes
√ The Best-in-Class process their invoices, on average, 59% faster
At the financial and operational hub of the enterprise sits its Chief Financial Officer (CFO), the person responsible for the finance and accounting operations of the enterprise. The role of the modern CFO has expanded beyond the traditional finance arena to often include strategic planning, human capital management, and operations among other responsibilities. Across the board, the CFOs and finance leaders who participated in this research effort are focused on two areas in 2009: cost containment and cash management.
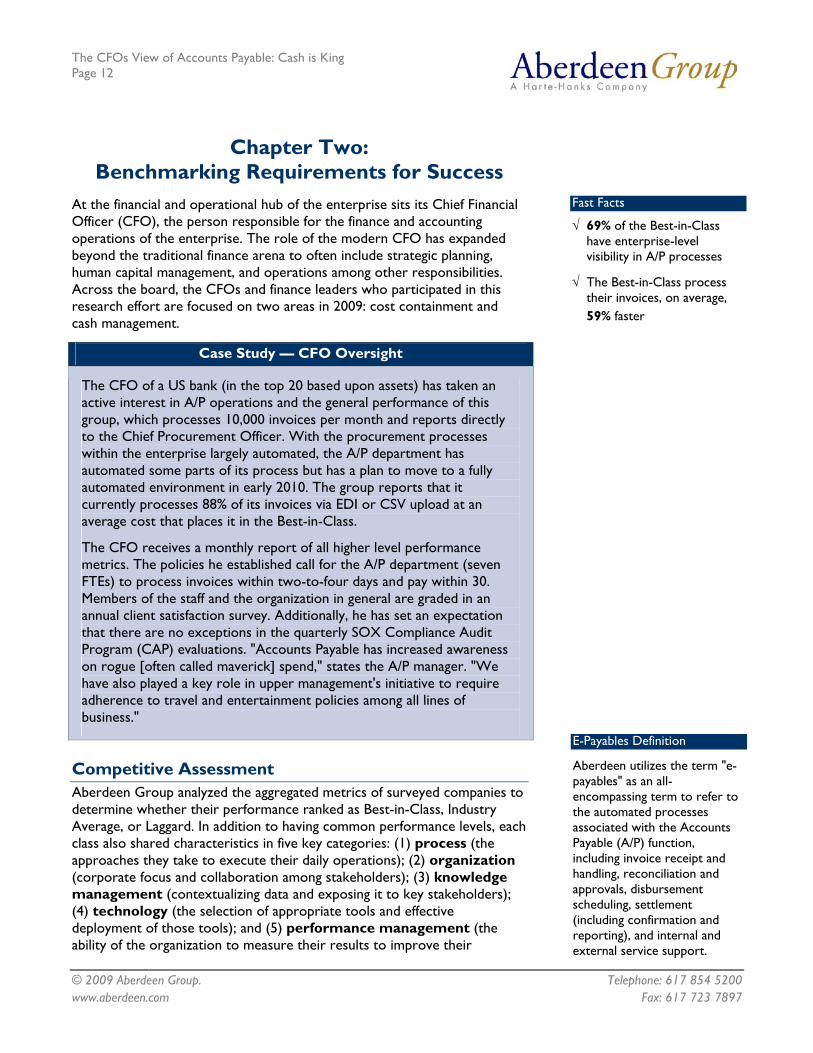
Case Study — CFO Oversight
The CFO of a US bank (in the top 20 based upon assets) has taken an active interest in A/P operations and the general performance of this group, which processes 10,000 invoices per month and reports directly to the Chief Procurement Officer. With the procurement processes within the enterprise largely automated, the A/P department has automated some parts of its process but has a plan to move to a fully automated environment in early 2010. The group reports that it currently processes 88% of its invoices via EDI or CSV upload at an average cost that places it in the Best-in-Class.
The CFO receives a monthly report of all higher level performance metrics. The policies he established call for the A/P department (seven FTEs) to process invoices within two-to-four days and pay within 30. Members of the staff and the organization in general are graded in an annual client satisfaction survey. Additionally, he has set an expectation that there are no exceptions in the quarterly SOX Compliance Audit Program (CAP) evaluations. "Accounts Payable has increased awareness on rogue [often called maverick] spend," states the A/P manager. "We have also played a key role in upper management's initiative to require adherence to travel and entertainment policies among all lines of business."
Competitive Assessment Aberdeen Group analyzed the aggregated metrics of surveyed companies to determine whether their performance ranked as Best-in-Class, Industry Average, or Laggard. In addition to having common performance levels, each class also shared characteristics in five key categories: (1) process (the approaches they take to execute their daily operations); (2) organization (corporate focus and collaboration among stakeholders); (3) knowledge management (contextualizing data and exposing it to key stakeholders); (4) technology (the selection of appropriate tools and effective deployment of those tools); and (5) performance management (the ability of the organization to measure their results to improve their
E-Payables Definition
Aberdeen utilizes the term "e-payables" as an all-encompassing term to refer to the automated processes associated with the Accounts Payable (A/P) function, including invoice receipt and handling, reconciliation and approvals, disbursement scheduling, settlement (including confirmation and reporting), and internal and external service support.
www.aberdeen.com Fax: 617 723 7897

The CFOs View of Accounts Payable: Cash is King Page 13
© 2009 Aberdeen Group. Telephone: 617 854 5200 www.aberdeen.com Fax: 617 723 7897
business). These characteristics (identified in Table 3) serve as a guideline for best practices, and correlate directly with Best-in-Class performance across the key metrics.
Table 3: The Competitive Framework
Best-in-Class Average Laggards Enterprise-level visibility into A/P processes
Process 69%
"We have created more transparency into the end to end procurement to payment cycle. This has allowed AP to continue to perform at a consistent level for the business with less headcount. We have also been able to raise the level of skills within the AP department to support the business in a more analytical capacity versus merely processing transactions."
~ Director of Finance, Pharmaceutical Manufacturer
49% 42%
Cross-functional coordination (collaboration) between key internal stakeholders (procurement, finance, IT, treasury)
69% 53% 51%
Supplier base segmented for electronic invoicing Organization
42% 32% 20%
Robust audit controls
75% 65% 48%
Clearly defined performance metrics, incentives and penalties
Knowledge
58% 30% 20%
A/P technologies / enablers currently in use:
Technology
62% online, web-based reporting 43% automated imaging and workflow solution 30% supplier / payment network
34% online, web-based reporting 31% automated imaging and workflow solution 22% supplier / payment network
18% online, web-based reporting 29% automated imaging and workflow solution 30% supplier / payment network
Ability to measure process cycle time Performance
67% 46% 29%
Source: Aberdeen Group, February 2009
Competitive Framework Analysis “A/P automation allowed us to reduce our staff by 50% in three years.”
~ Daniela Howell, Worldwide Logistics Corp.
Aberdeen's analysis of the Competitive Framework reveals that Best-in-Class enterprises leverage a range of solutions and strategies for success across the scope of process, organization, knowledge management, technology, and performance monitoring, all in an effort to drive A/P success. These strategies and solutions have four primary components: visibility, collaboration, control, and automation and help the Best-in-Class maintain significantly lower invoice processing costs than their competitors
The CFOs View of Accounts Payable: Cash is King Page 14
© 2009 Aberdeen Group. Telephone: 617 854 5200
Process: The Visibility Factor Process visibility is a baseline requirement for most major functions within the enterprise and is used to provide a holistic view of operations and establish standards upon which strategies for transformation and performance improvement are based. For the typical accounts payable department, enterprise-level visibility remains the exception. This lack of visibility translates into a series of negative factors including:
• Higher transaction costs
• Longer processing cycle times
• Increased financial risk
• Greater inquiry response times
• Greater inability to closely monitor billing discrepancies and overpayments, as well as a failure to recognize unclaimed discounts
Organization: Collaboration for Adaptation "My top priorities for 2009 are working capital management and cash collection."
~ Sergio Mateo, CFO, Idom, Barcelona, Spain
Although the average accounts payable department operates as a centralized function, many groups finds themselves estranged from the larger business process and ill-equipped to engage internal partners who have a vested interest in a high-performing department. An opaque view into invoice and payment processing constrains partners like Treasury and Procurement from fulfilling its larger goals and objectives (Table 1).
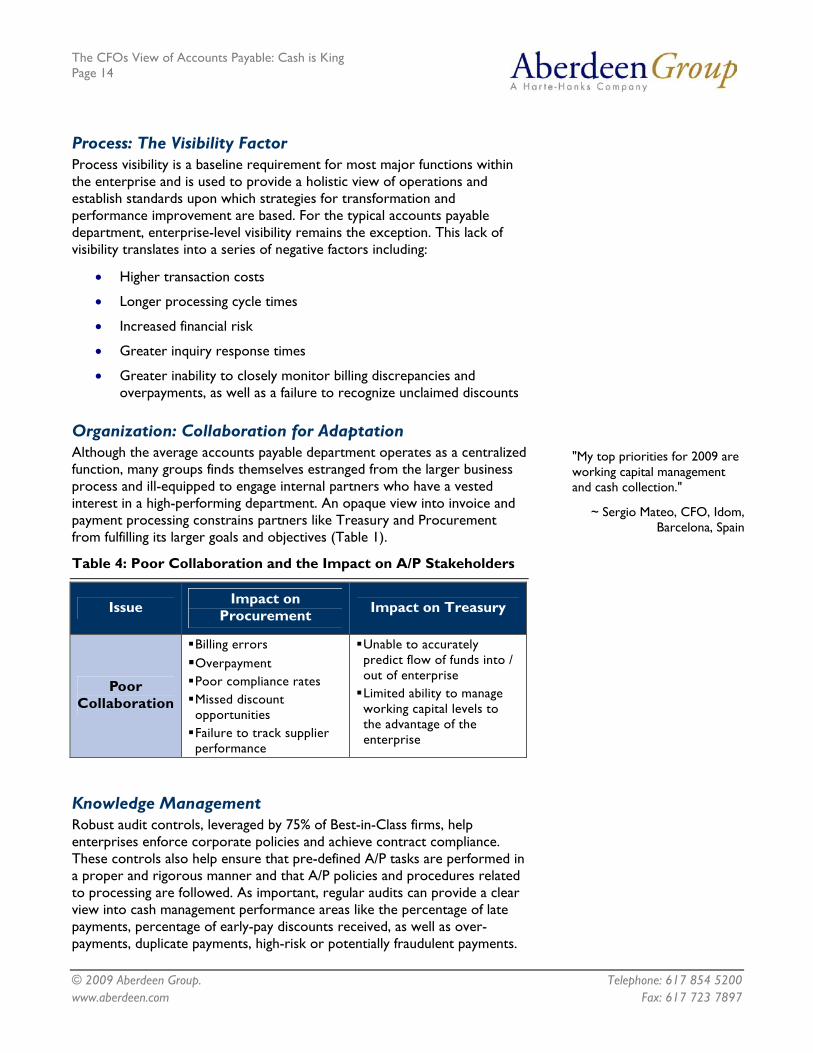
Table 4: Poor Collaboration and the Impact on A/P Stakeholders
Issue Impact on Procurement Impact on Treasury
Poor Collaboration
Billing errors Overpayment Poor compliance rates Missed discount opportunities Failure to track supplier performance
Unable to accurately predict flow of funds into / out of enterprise Limited ability to manage working capital levels to the advantage of the enterprise
Knowledge Management Robust audit controls, leveraged by 75% of Best-in-Class firms, help enterprises enforce corporate policies and achieve contract compliance. These controls also help ensure that pre-defined A/P tasks are performed in a proper and rigorous manner and that A/P policies and procedures related to processing are followed. As important, regular audits can provide a clear view into cash management performance areas like the percentage of late payments, percentage of early-pay discounts received, as well as over-payments, duplicate payments, high-risk or potentially fraudulent payments.
www.aberdeen.com Fax: 617 723 7897

The CFOs View of Accounts Payable: Cash is King Page 15
© 2009 Aberdeen Group. Telephone: 617 854 5200
The Missing Link: Process Automation The financial operations of a Fortune 1,000 enterprise are sophisticated, adaptive, largely modernized, and fully automated. Yet, the average accounts payable department stands in stark contrast operating in an environment consumed by paper where process and data visibility are the exceptions, not the rule. In a period where CFOs must leave no stone unturned in the defense of their bottom-lines, accounts payable transformation programs that can yield a positive return in year one should be explored.
Automation Trends and Impact Process automation continues to advance in the larger marketplace as 40% of A/P departments now report comprehensive A/P automation (22% with a single solution to manage the entire function; 18% with integrated solutions across the function) in place compared to the less than one-third of enterprises who reported this full/complete level of automation in Aberdeen’s E-Payables: Advancing A/P Automation report published in March, 2007. Enterprises currently leveraging electronic means of processing invoices have seen significant reductions in costs, as indicated in Figure 8. The managers who automate the key A/P processes also report that improved cash flow visibility and reduced time to process invoices.
Figure 8: Electronic versus Manual Invoice Processing Costs
$10.44$12.28
$17.45 $17.98
PO Non-PO
Electronic Manual
Source: Aberdeen Group, February 2009
As seen in Figure 9, Best-in-Class enterprises leverage e-payables solutions to a greater degree and impact a significantly higher percentage of invoices and payments. This strategy is a significant contributor to the Best-in-Class invoice processing cost advantage of 83% compared to their peers. Yet, opportunity for near-term process efficiencies the Best-in-Class also have significant opportunity to increase the percentage of electronic invoices (currently 51%) and payments (currently 43%) managed.
www.aberdeen.com Fax: 617 723 7897

The CFOs View of Accounts Payable: Cash is King Page 16
© 2009 Aberdeen Group. Telephone: 617 854 5200
Figure 9: Electronic Invoices and Payments
34%
27%
43%
51%
Payments settled inelectronic format
Invoices received inelectronic format
Best-in-ClassAll Others
Source: Aberdeen Group, February 2009
Speed Saves "We have not automated completely, but our workflow [solution] has improved the process significantly. It has decreased the phone calls, ensured more timely payments, and improved our month end accruals significantly."
~ Heidi Lester, Finance Manager, Financial Services
Industry
The amount of paper clogging the accounts payable pipeline, creates an environment where accounts payable staffers are mired at the transaction level and have fewer opportunities to focus on higher value activities like engaging with treasury to share current payment strategies and ensure or define that future activity is aligned with enterprise cash management strategies. As shown in Table 4, top-performing organization, driven in large part by the higher volume of electronic activity, have significantly shorter cycle times than all other enterprises.
Table 5: Cycle Time Performance, Best-in-Class versus All Others
Cycle Time (from invoice receipt to payment scheduled) Best-in-Class All Others
Overall invoice average 5.8 days 14.1 days
Non-exceptions 6.0 11.2 days
9.4 days 16.6 daysExceptions
Source: Aberdeen Group, February 2009
Don't Accept the Exceptions Processing exceptions can prove to be a drain on time and resources within the A/P department. A high exception rate often signals poor processing performance, insufficient standardization and a lack of understanding of the importance of A/P as a cash management function. As shown in Figure 11, top-performing enterprises have effectively cut the average exception rate in half.
www.aberdeen.com Fax: 617 723 7897

The CFOs View of Accounts Payable: Cash is King Page 17
© 2009 Aberdeen Group. Telephone: 617 854 5200
Figure 10: Exception Rates
10%
5%
All Others Best-in-Class Source: Aberdeen Group, February 2009
Not all A/P policy overrides and exemptions are necessary; with some enterprises handling invoices worth tens of thousands of dollars, a simple exclusion to A/P policy can boost costs and extend cycle times.
The CFO’s Grade Accounts payable teams have an extraordinary opportunity to demonstrate the value their processes and expertise can deliver. Aberdeen research confirms that today’s CFO priorities are strongly aligned to the responsibilities of accounts payable teams.
Figure 11: The CFO's Satisfaction with A/P
3.07
2.92
3.6
3.18
3.38
3.41
3.19
3.45
3.69
3.77
3.84
3.92
4.0
4.07
0 0.5 1 1.5 2 2.5 3 3.5 4 4.5
Building vendorrelationships
Compliance
Prompt response toinquiries
Efficiency
Quality
Overall serviceprovided by A/P
Cost
All Others Best-in-Class
Source: Aberdeen Group, February 2009
www.aberdeen.com Fax: 617 723 7897

The CFOs View of Accounts Payable: Cash is King Page 18
© 2009 Aberdeen Group. Telephone: 617 854 5200 www.aberdeen.com Fax: 617 723 7897
Best-in-Class organizations, which are more likely to approach all elements of the A/P process in a holistic manner, are driving greater value across and rising in stature within the enterprise. Figure 11 details the advantage that these A/P leaders hold in the levels of satisfaction (rated on a scale of one-to-five) their financial leaders have with their performance. With an invoice processing cost advantage of 83% over their peers, it is no surprise that the Best-in-Class get strong marks in cost performance; but, these top performers also rising to meet the needs of its internal customers and stakeholders and receive high marks in overall performance, and the efficiency and quality of operations, all clear results of the strategies they employ (which are addressed throughout this chapter).
Aberdeen Insight - A Case for A/P
In 2004, Aberdeen research on E-Payables introduced the typical A/P department as a quintessential back-office function that lacked alignment with both process partners and general business operations, according to findings from the September 2008 report, E-Payables Benchmark: A/P Strategies for Success. While most departments had centralized operations, they remained awash in paper, spending more than $34, on average, to process an invoice, and were frustrated by both a lack of process standards and a lack of visibility into key operations.
The concept of A/P transformation was just beginning to take shape and process automation, where it did exist, was generally fragmented and rudimentary. More than four years later, the A/P function is coming of age. And, like a large group of boisterous teenagers, A/P departments continue to develop at unique and varied paces. A few Best-in-Class models warrant 'teen idol' status while the vast majority of departments lack polish and betray a rapidly changing, but still awkward appearance.
Over the longer term, momentum for A/P transformation continues to accelerate, but, we see some speed bumps in the marketplace over the near-term, specifically the global recession and the market turmoil that really kicked in last September
The CFOs View of Accounts Payable: Cash is King Page 19
© 2009 Aberdeen Group. Telephone: 617 854 5200
Chapter Three: Required Actions
Fast Facts
√ The Best-in-Class receive electronic invoices 90% more often
√ The Best-in-Class make electronic payment 25% more often
√
In 2009, cash management and cost containment are at the top of the CFOs agenda. To help spur performance and keep their A/P teams focused on the larger enterprise objectives, Aberdeen recommends the following smart strategies for CFOs to pursue with their A/P operations:
Laggard Steps to Success • Link A/P leadership with treasury for cash management
planning. It is incumbent upon enterprises to ensure that they have visibility and control over their cash outlays, including those committed through A/P. A/P commitments are especially critical as they are payments made to commercial partners for products and services that are necessary for operations. Involving A/P leadership with the treasury department’s cash management planning activities (in place at 69% of Best-in-Class enterprises) increases the likelihood that payments are scheduled to ensure the optimization of working capital, ensures that additional fees for late payments are avoided and even presents opportunities to capitalize on discounts for early payments.
• Set aggressive goals to convert a significant percentage of manual payments to electronic. The Best-in-Class make electronic payments at a rate that is nearly double their peers. Manual payment processes consistently inflate the costs attributed to A/P. Additionally, electronic payments represent a more secure method of ensuring payment while also allowing for a more controlled way of meeting deadlines and capitalizing on timing-based discounts. Conducting more payments electronically also reduces the administrative workload of A/P personnel, enabling them to direct more of their efforts to tasks such as invoice processing and reconciliation and managing vendor relationships through any potential disputes.
• Schedule regular meetings with A/P leadership and your team, and automate reporting and formalize collaboration. Accounts payable, although considered a back-office function by some, impacts multiple groups within the enterprise including procurement, treasury, controller’s office and up to the CFO. It is critical to identify the role of A/P, the strategies employed to improve operations and the performance outcomes in order to understand the different ways that your group must work with and be impacted by A/P. Automating reporting facilitates efficiencies in information exchange and enhances visibility into the A/P function. These reports which the Best-in-Class are 1.4 times more likely to utilize, can also serve as the foundation for collaboration
www.aberdeen.com Fax: 617 723 7897
The CFOs View of Accounts Payable: Cash is King Page 20
© 2009 Aberdeen Group. Telephone: 617 854 5200 www.aberdeen.com Fax: 617 723 7897
to ensure that all impacted functions are aligned with A/P strategies and performance initiatives
Industry Average Steps to Success • Collaborate with internal and external stakeholders to
develop a portfolio strategy for e-payables including payments and enablement. Collaboration sets the stage for continuous improvement – the Best-in-Class A/P teams emphasize this as a strategy for success and are 32% more likely to have strong working bonds with their functional peers. As deficiencies are identified, they can be prioritized by internal and external stakeholders to address the most significant. Payments and enablement are especially critical areas since they affect cash management strategies for the enterprise and the ability to more effectively and efficiently receive payment for the supplier. Such issues as errors, late payments and disputes can be resolved earlier in the process, resulting in lower costs, greater efficiencies and improved relationships.
• Establish a well-defined exception process. In an effort to standardize processes and improve control over the A/P process, enterprises must establish well-defined criteria for the handling and processing of exceptions. While some level of exceptions will always exist within any A/P department, a blanket acceptance policy for any request for exception is not an effective way to manage the most costly invoices. Instead, a policy that highlights the specific criteria for approving exceptions and sets expectations for processing times and additional escalation should be clearly outlined and communicated to all vendors and business stakeholders. The Best-in-Class are more likely to have a defined exception policy, and report, on average, half the percentage of exceptions that their peers report there should also not be.
Best-in-Class Steps to Success • Document and leverage best practices. While performance
improvements are beneficial to an enterprise, the true value lies in the ability to sustain and repeat success. To ensure that enablement results can be duplicated it is vital that best practices be reviewed and recorded. Such a practice provides a proven road map for other A/P managers to follow to improve and / or sustain enablement capabilities with suppliers.
• Establish robust fraud prevention practices. While often unintentional, fraud throughout the A/P process is a viable threat to the financial security of an enterprise. Manual processing of invoices and payments provide ample opportunities for incorrect pricing to be accepted purchase orders and invoices, higher-than-required payments to be processed and even duplicate payments to be made

The CFOs View of Accounts Payable: Cash is King Page 21
© 2009 Aberdeen Group. Telephone: 617 854 5200
on the same invoice. Automation mitigates much of this risk by minimizing or removing the human element of data input and keying-in of invoice information. Pricing and overpayments can be caught and / or prevented, saving the enterprise millions of dollars in cash and associated time to resolve these discrepancies.
• Leverage A/P measurements beyond the walls of A/P. Standard metrics for A/P performance include invoice processing costs, cycle times and Days Payables Outstanding. However, A/P activities also impact other groups within the enterprise such as procurement, treasury and accounting. Invoiced purchases can be leveraged by procurement to gain visibility into contract compliance when these transactions are compared to contracts for pricing discrepancies or whether contracted suppliers were even used. Treasury can benefit from understanding the cash ramifications of altering payment schedules or missing deadlines. Accounting can utilize accurate, timely A/P information to ensure financial reports accurately reflect the enterprise's position and provide clarity to stakeholders.
Aberdeen Insight - Making the Case for A/P Transformation
The discussions held with CFOs and other finance leaders highlighted an increased focus on optimizing working capital while controlling costs in the current business cycle. A clear majority of respondents in this research effort understand and acknowledge the critical role that A/P can play in these areas (67% see A/P positively impacting cost reduction; 68% see A/P positively impacting working capital optimization). In fact, across all of the top priorities on the CFO's agenda for 2009, A/P was consistently viewed as a solid or significant contributor. And yet, the level of manual and paper driven work performed in the A/P halls is extraordinarily high, presenting an opportunity for influential near-term improvement.
CFOs need only perform a back of the envelope calculation utilizing the data found in Figure 8 and Figure 9 which contrasts the average costs of electronic and manual invoices and the percentage of electronic versus paper invoice and payments in the marketplace. While slight variations in the values exist across distinct research efforts, the cost difference between the two methods has consistently hovered in the 40% to 50% range. These numbers suggest that an investment in A/P automation presents a compelling opportunity for the CFO.
www.aberdeen.com Fax: 617 723 7897
The CFOs View of Accounts Payable: Cash is King Page 22
© 2009 Aberdeen Group. Telephone: 617 854 5200
Appendix A: Research Methodology
Study Focus
Responding A/P executives completed an online survey that included questions designed to determine the following:
√ The maturity and scope of their Accounts Payable (A/P) departments
√ The role of people, process, and technology in their course of business operations
√ The degree to which A/P’s role has changed over the past few years
√ How A/P supports enterprise financial and operational performance goals
√ Leading strategies that A/P departments are employing to drive efficiencies and create value
√ The benefits, if any, that have been derived from these strategies to date
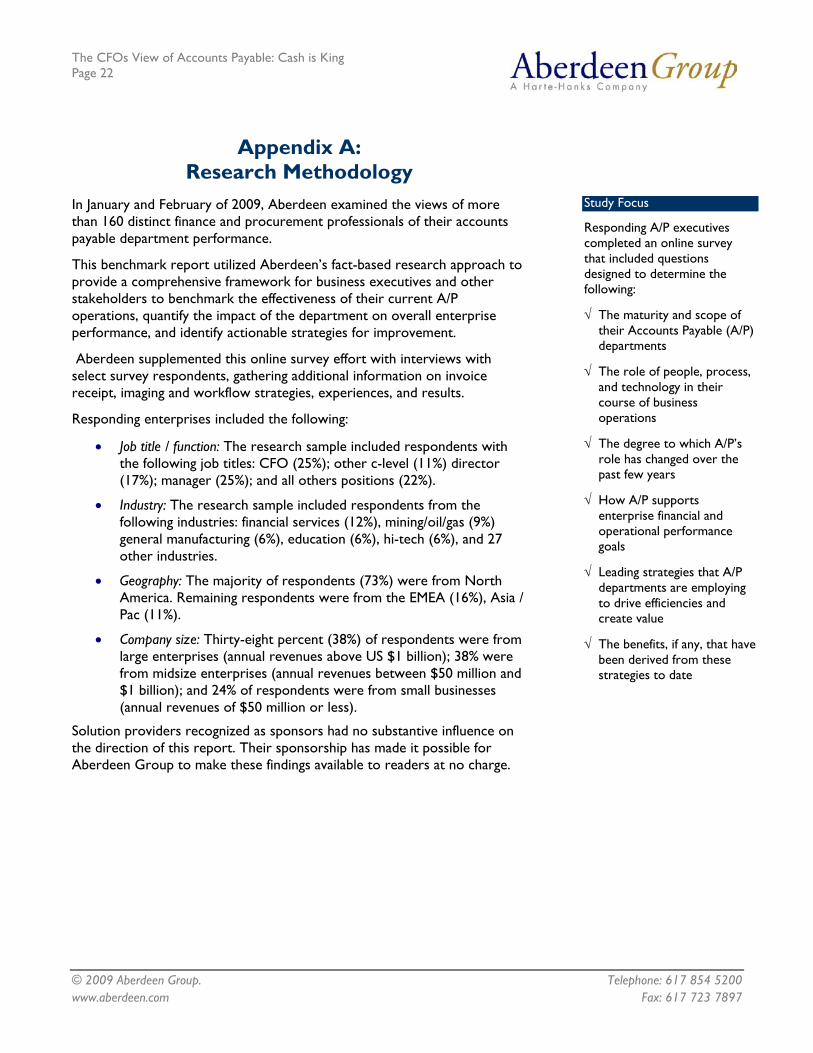
In January and February of 2009, Aberdeen examined the views of more than 160 distinct finance and procurement professionals of their accounts payable department performance.
This benchmark report utilized Aberdeen’s fact-based research approach to provide a comprehensive framework for business executives and other stakeholders to benchmark the effectiveness of their current A/P operations, quantify the impact of the department on overall enterprise performance, and identify actionable strategies for improvement.
Aberdeen supplemented this online survey effort with interviews with select survey respondents, gathering additional information on invoice receipt, imaging and workflow strategies, experiences, and results.
Responding enterprises included the following:
• Job title / function: The research sample included respondents with the following job titles: CFO (25%); other c-level (11%) director (17%); manager (25%); and all others positions (22%).
• Industry: The research sample included respondents from the following industries: financial services (12%), mining/oil/gas (9%) general manufacturing (6%), education (6%), hi-tech (6%), and 27 other industries.
• Geography: The majority of respondents (73%) were from North America. Remaining respondents were from the EMEA (16%), Asia / Pac (11%).
• Company size: Thirty-eight percent (38%) of respondents were from large enterprises (annual revenues above US $1 billion); 38% were from midsize enterprises (annual revenues between $50 million and $1 billion); and 24% of respondents were from small businesses (annual revenues of $50 million or less).
Solution providers recognized as sponsors had no substantive influence on the direction of this report. Their sponsorship has made it possible for Aberdeen Group to make these findings available to readers at no charge.
www.aberdeen.com Fax: 617 723 7897

The CFOs View of Accounts Payable: Cash is King Page 23
© 2009 Aberdeen Group. Telephone: 617 854 5200
Table 6: The PACE Framework Key
Overview Aberdeen applies a methodology to benchmark research that evaluates the business pressures, actions, capabilities, and enablers (PACE) that indicate corporate behavior in specific business processes. These terms are defined as follows: Pressures — external forces that impact an organization’s market position, competitiveness, or business operations (e.g., economic, political and regulatory, technology, changing customer preferences, competitive) Actions — the strategic approaches that an organization takes in response to industry pressures (e.g., align the corporate business model to leverage industry opportunities, such as product / service strategy, target markets, financial strategy, go-to-market, and sales strategy) Capabilities — the business process competencies required to execute corporate strategy (e.g., skilled people, brand, market positioning, viable products / services, ecosystem partners, financing) Enablers — the key functionality of technology solutions required to support the organization’s enabling business practices (e.g., development platform, applications, network connectivity, user interface, training and support, partner interfaces, data cleansing, and management)
Source: Aberdeen Group, February 2009
Table 7: The Competitive Framework Key
Overview The Aberdeen Competitive Framework defines enterprises as falling into one of the following three levels of practices and performance: Best-in-Class (20%) — Practices that are the best currently being employed and are significantly superior to the Industry Average, and result in the top industry performance. Industry Average (50%) — Practices that represent the average or norm, and result in average industry performance. Laggards (30%) — Practices that are significantly behind the average of the industry, and result in below average performance.
In the following categories: Process — What is the scope of process standardization? What is the efficiency and effectiveness of this process? Organization — How is your company currently organized to manage and optimize this particular process? Knowledge — What visibility do you have into key data and intelligence required to manage this process? Technology — What level of automation have you used to support this process? How is this automation integrated and aligned? Performance — What do you measure? How frequently? What’s your actual performance?
Source: Aberdeen Group, February 2009
Table 8: The Relationship Between PACE and the Competitive Framework
PACE and the Competitive Framework – How They Interact Aberdeen research indicates that companies that identify the most influential pressures and take the most transformational and effective actions are most likely to achieve superior performance. The level of competitive performance that a company achieves is strongly determined by the PACE choices that they make and how well they execute those decisions
Source: Aberdeen Group, February 2009
www.aberdeen.com Fax: 617 723 7897
The CFOs View of Accounts Payable: Cash is King Page 24
© 2009 Aberdeen Group. Telephone: 617 854 5200 www.aberdeen.com Fax: 617 723 7897
Appendix B: Related Aberdeen Research
Related Aberdeen research that forms a companion or reference to this report includes:
• E-Payables Benchmark: A/P Strategies for Success (September 2008)
• E-Payables Solution Selection (September 2007)
• The E-Payables Benchmark Series: Electronic Payments and Fraud Prevention (June 2008)
• The E-Payables Benchmark Series: Imaging and Workflow (March 2008)
• E-Payables: Advancing Accounts Payable Automation (March 2007)
• Supplier Enablement: Converging Procurement and Accounts Payable (April 2008)
• Accounts Payable Transformation (December 2007)
• Global Trade Compliance Priorities (March 2008)
• The 2008 State of the Market in Supply Chain Finance (January 2008)
Information on these and any other Aberdeen publications can be found at www.aberdeen.com.
Author: Andrew Bartolini, Vice President & Group Director, Global Supply Management, [email protected] J Dwyer, Researcher, Global Supply Management, [email protected]
Since 1988, Aberdeen's research has been helping corporations worldwide become Best-in-Class. Having benchmarked the performance of more than 644,000 companies, Aberdeen is uniquely positioned to provide organizations with the facts that matter — the facts that enable companies to get ahead and drive results. That's why our research is relied on by more than 2.2 million readers in over 40 countries, 90% of the Fortune 1,000, and 93% of the Technology 500.
As a Harte-Hanks Company, Aberdeen plays a key role of putting content in context for the global direct and targeted marketing company. Aberdeen's analytical and independent view of the "customer optimization" process of Harte-Hanks (Information – Opportunity – Insight – Engagement – Interaction) extends the client value and accentuates the strategic role Harte-Hanks brings to the market. For additional information, visit Aberdeen http://www.aberdeen.com or call (617) 723-7890, or to learn more about Harte-Hanks, call (800) 456-9748 or go to http://www.harte-hanks.com
This document is the result of primary research performed by Aberdeen Group. Aberdeen Group's methodologies provide for objective fact-based research and represent the best analysis available at the time of publication. Unless otherwise noted, the entire contents of this publication are copyrighted by Aberdeen Group, Inc. and may not be reproduced, distributed, archived, or transmitted in any form or by any means without prior written consent by Aberdeen Group, Inc.