Embed Size (px)
Citation preview

FRBNY Economic Policy Review / July 2009 1
The Case for TIPS: An Examination of the Costs and Benefits
1. Introduction
lightly more than a decade has passed since the inaugural issuance of inflation-indexed debt by the U.S. Treasury
Department. Eleven years and thirty issues later, we are at a good vantage point from which to evaluate the successes and failures of the Treasury Inflation-Protected Securities (TIPS) program.
From a purely financial perspective, a number of recent studies have suggested that the program has been a disappointment. After calculating the direct costs of TIPS issuance relative to issuance of nominal Treasury securities, the studies show that the first ten years of the TIPS program have cost the Treasury billions of dollars (Sack and Elsasser 2004; Roush 2008).
Importantly, these studies rely entirely on ex post analysis. In other words, the studies ask, Given the actual inflation outcome, did the costs of TIPS issuances exceed the costs of nominal Treasury issuances of similar durations? This approach depends on the actual inflation outcome, which may differ from expectations at the time the TIPS investment was made because investors do not have perfect foresight of inflation. If investors underpredict actual inflation when purchasing TIPS at auction, then these positive forecast errors would increase the payments that the Treasury has to make to
William C. Dudley, president and chief executive officer of the Federal Reserve Bank of New York, was executive vice president and head of the Bank’s Markets Group at the time this article was written; Jennifer Roush is chief of the Monetary and Financial Market Analysis Section of the Board of Governors of the Federal Reserve System; Michelle Steinberg Ezer is a senior trader/analyst in the Markets Group.Correspondence: <[email protected]> <[email protected]>
The authors thank James Clouse, Joshua Frost, Joseph Gagnon, Kenneth Garbade, Warren Hrung, Lorie Logan, Simon Potter, Anthony Rodrigues, Brian Sack, and Jonathan Wright for thoughtful comments and Brian Sack for the data in Chart 5. The views expressed are those of the authors and do not necessarily reflect the position of the Federal Reserve Board, the Federal Reserve Bank of New York, or the Federal Reserve System.
• Some studies suggest that the issuance of Treasury Inflation-Protected Securities (TIPS)—inflation-indexed debt—has not been as cost-effective for the Treasury as the issuance of nominal securities.
• The studies base their conclusions on ex post analysis, that is, they look back from the actual inflation outcome to determine whether TIPS issuance costs exceeded the costs of nominal Treasury issuances of similar durations.
• This article argues that the ex post approach has drawbacks when it comes to assessing the costs and benefits of TIPS over the long run; instead, an ex ante approach is recommended.
• A comprehensive analysis of TIPS should also consider the program’s other, more difficult-to-quantify, benefits—especially when cost analysis shows that TIPS are only marginally more expensive or about as expensive as nominal issuances.
• The ex ante costs of TIPS issuance are found to be about equal to the costs of nominal Treasury issuance; moreover, TIPS provide meaningful benefits to investors and policymakers.
William C. Dudley, Jennifer Roush, and Michelle Steinberg Ezer
S
2 The Case for TIPS
TIPS holders to compensate them for realized inflation.1, 2
Upside inflation surprises tend to increase the ex post cost of issuing TIPS compared with nominal Treasuries.
While inflation forecast errors are relevant for calculating the actual costs incurred over the first ten years of the TIPS program, we believe they are irrelevant in assessing the expected benefits or costs of the program over the long run—a theme we explore in this article. In other words, current ex post analysis suffers from the problem of small sample size, particularly since most of the issues have overlapping lifetimes and therefore are not necessarily independent of each other. In the long run, investors learn from their mistakes, and inflation shocks tend to average out. When investors make a particular forecast error, they adapt their future expectations accordingly
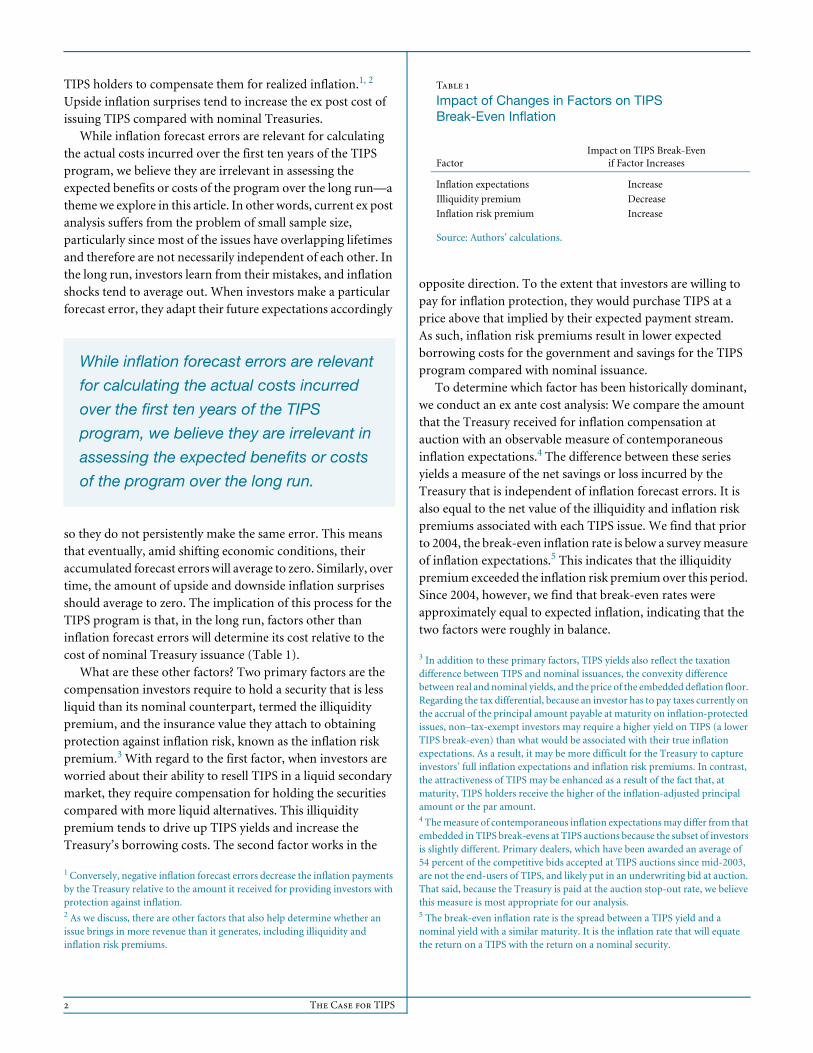
so they do not persistently make the same error. This means that eventually, amid shifting economic conditions, their accumulated forecast errors will average to zero. Similarly, over time, the amount of upside and downside inflation surprises should average to zero. The implication of this process for the TIPS program is that, in the long run, factors other than inflation forecast errors will determine its cost relative to the cost of nominal Treasury issuance (Table 1).
What are these other factors? Two primary factors are the compensation investors require to hold a security that is less liquid than its nominal counterpart, termed the illiquidity premium, and the insurance value they attach to obtaining protection against inflation risk, known as the inflation risk premium.3 With regard to the first factor, when investors are worried about their ability to resell TIPS in a liquid secondary market, they require compensation for holding the securities compared with more liquid alternatives. This illiquidity premium tends to drive up TIPS yields and increase the Treasury’s borrowing costs. The second factor works in the
1 Conversely, negative inflation forecast errors decrease the inflation payments by the Treasury relative to the amount it received for providing investors with protection against inflation. 2 As we discuss, there are other factors that also help determine whether an issue brings in more revenue than it generates, including illiquidity and inflation risk premiums.
opposite direction. To the extent that investors are willing to pay for inflation protection, they would purchase TIPS at a price above that implied by their expected payment stream. As such, inflation risk premiums result in lower expected borrowing costs for the government and savings for the TIPS program compared with nominal issuance.
To determine which factor has been historically dominant, we conduct an ex ante cost analysis: We compare the amount that the Treasury received for inflation compensation at auction with an observable measure of contemporaneous inflation expectations.4 The difference between these series yields a measure of the net savings or loss incurred by the Treasury that is independent of inflation forecast errors. It is also equal to the net value of the illiquidity and inflation risk premiums associated with each TIPS issue. We find that prior to 2004, the break-even inflation rate is below a survey measure of inflation expectations.5 This indicates that the illiquidity premium exceeded the inflation risk premium over this period. Since 2004, however, we find that break-even rates were approximately equal to expected inflation, indicating that the two factors were roughly in balance.
3 In addition to these primary factors, TIPS yields also reflect the taxation difference between TIPS and nominal issuances, the convexity difference between real and nominal yields, and the price of the embedded deflation floor. Regarding the tax differential, because an investor has to pay taxes currently on the accrual of the principal amount payable at maturity on inflation-protected issues, non–tax-exempt investors may require a higher yield on TIPS (a lower TIPS break-even) than what would be associated with their true inflation expectations. As a result, it may be more difficult for the Treasury to capture investors’ full inflation expectations and inflation risk premiums. In contrast, the attractiveness of TIPS may be enhanced as a result of the fact that, at maturity, TIPS holders receive the higher of the inflation-adjusted principal amount or the par amount. 4 The measure of contemporaneous inflation expectations may differ from that embedded in TIPS break-evens at TIPS auctions because the subset of investors is slightly different. Primary dealers, which have been awarded an average of 54 percent of the competitive bids accepted at TIPS auctions since mid-2003, are not the end-users of TIPS, and likely put in an underwriting bid at auction. That said, because the Treasury is paid at the auction stop-out rate, we believe this measure is most appropriate for our analysis.5 The break-even inflation rate is the spread between a TIPS yield and a nominal yield with a similar maturity. It is the inflation rate that will equate the return on a TIPS with the return on a nominal security.
While inflation forecast errors are relevant
for calculating the actual costs incurred
over the first ten years of the TIPS
program, we believe they are irrelevant in
assessing the expected benefits or costs
of the program over the long run.
Table 1
Impact of Changes in Factors on TIPS Break-Even Inflation
FactorImpact on TIPS Break-Even
if Factor Increases
Inflation expectations Increase
Illiquidity premium Decrease
Inflation risk premium Increase
Source: Authors’ calculations.

FRBNY Economic Policy Review / July 2009 3
There are two possible reasons for the change in fortune for TIPS issued after 2004. Over time, as the TIPS market developed, the illiquidity risk premium shrank and/or inflation risk premiums increased. Evaluating the two components independently, we conclude that a decline in the illiquidity premium is the more convincing explanation. In particular, our review of the evidence shows a downward secular trend in the TIPS illiquidity premium. In contrast, the inflation risk premiums appear to have remained relatively low and stable in recent years.
These findings have important implications for assessing the benefits and costs of future TIPS issuances. The TIPS illiquidity that persisted during the first several years of the program and that appears to explain much of the cost of past issuances no longer seems to be an important factor.6 As a result, as long as the illiquidity premium and inflation premiums do not shift in systematic ways, future TIPS issuances should be much more cost-effective for the Treasury.
A second theme of this article is that relative cost calculations, on either an ex ante or ex post basis, are just one aspect of a comprehensive analysis of the costs and benefits of the TIPS program. We believe that TIPS issuance provides the taxpayer with other benefits that should be taken into account when evaluating the program—especially when cost analysis
shows that TIPS are either only marginally more expensive or about as expensive to issue as nominals. Some of these benefits, such as a broadening of the Treasury’s investor base and a diversification of its funding sources, were cited by Treasury Deputy Assistant Secretary for Federal Finance Timothy S. Bitsberger as a way for the Treasury to “reduce our borrowing costs over time.”7 As such, some of the difficult-to-measure benefits of the TIPS program are consistent with the Treasury’s current debt management objectives. In a November 2001 speech, Under Secretary of the Treasury for Domestic Finance Peter Fisher emphasized that “The debt management strategy of Treasury has been to strive to be regular and predictable in the issuance of debt while minimizing borrowing costs over
6 Roush (2008) finds that outstanding TIPS issuances under the counterfactual assumption that there was no illiquidity premium imply significant cost savings. 7 See Bitsberger (2002).
many years and interest rate cycles.”8 This strategy has meant issuing and paying down debt in a manner that promotes market liquidity and obtains financing across the yield curve.
To assess the net benefits and costs of the TIPS program more fully, we discuss other benefits that we believe are central to a complete evaluation of the program. Although these benefits are not easily measured, they may be considerable. For example, we describe how the program provides important advantages for investors with real saving objectives as well as valuable information for policymakers whose directive is to contain inflation.
The remainder of this article is organized as follows. The next section examines the ex ante costs of TIPS issuance. Measures of illiquidity and inflation risk premiums embedded in TIPS are reviewed in Section 3. In Section 4, we discuss other economic benefits of inflation-indexed debt that are not captured in relative cost measures. Section 5 summarizes our main conclusions.
2. Ex Ante Cost Analysis
Studies that have evaluated the issuance costs of TIPS compared with nominal Treasuries have typically compared ex post costs. These studies usually show that TIPS issuance has resulted in a higher net cost to the Treasury. For example, Sack and Elsasser (2004) find a net cost to the Treasury from the start of the program through early 2004 of slightly less than $3 billion. Roush (2008) finds that total ex post costs of TIPS through March 2007 were in the range of $5 billion to $8 billion.9
A problem with current ex post analysis, however, is that it
depends upon the performance of inflation over a relatively short period of time. If inflation proves to be meaningfully different than what was expected at the time of TIPS issuance, then this difference—the “inflation surprise”—affects the costs of TIPS relative to nominal Treasuries. For instance, if inflation turns out to be higher than expected, then TIPS issuance becomes more expensive relative to nominal Treasury issuance. If inflation turns out to be lower, however, an ex post analysis would show higher savings (lower costs) from the TIPS program.
The importance of the inflation surprise in determining ex post costs can be seen in other developed countries with
8 See Fisher (2001). See Gensler (1998) and Stigum and Crescenzi (2007) for an overview of Treasury debt management. 9 To put the range in perspective, we note that the average annual increase in publicly held outstanding Treasury marketable debt since 2002 is approxi-mately $227 billion. Furthermore, $5 billion to $8 billion represents 0.1 to 0.2 percent of total outstanding Treasury marketable debt held by the public as of June 2008.
As long as the illiquidity premium and
inflation premiums do not shift in
systematic ways, future TIPS issuances
should be much more cost-effective
for the Treasury.

4 The Case for TIPS
similar programs of inflation-linked sovereign debt issuance. In fact, several other developed countries’ inflation surprises have resulted in lower costs of inflation-linked debt issuance compared with the costs of nominal debt issuance. For example, in its 2000-01 Annual Review, the United Kingdom Debt Management Office notes that the “significant reduction in the cost of funding [from the inflation-linked debt program] … has partly been due to the reduction of inflation risk but more importantly because of the fact market expectations of inflation have exceeded the inflation outturn (‘outcome’) for much of the last twenty years.”10 Similarly, a 2006 ex post cost
study by the Agency France Trésor finds that its inflation-linked debt program saved the government ¤120 million between 1998 and 2004.11 In that study, the authors observe that any analysis of this type is difficult because it does not include some of the hard-to-measure benefits of the program, such as the diversification of the government’s debt portfolio, and it only applies in retrospect. In other words, if actual inflation turns out to be higher than expected, the inflation-linked program could instead appear costly.
Over the long run, however, inflation surprises should not matter. This is because investors are likely to learn from their mistakes and not repeat their forecast errors indefinitely. If investors incorporate all known information into their predictions, inflation surprises should be unbiased, with as many downward surprises in inflation performance as upward surprises.
When considering the performance of TIPS over the expected life of the program, we believe this longer term perspective is most relevant. If an experiment were to be run thousands of times drawing from the underlying distribution of possible inflation outcomes, would the Treasury’s costs have been lower, on average, with TIPS or with nominal Treasuries?
10 United Kingdom Debt Management Office (2001, p. 39).11 Coeuré and Sagnes (2005).
Alternatively, we can ask whether the Treasury obtained the financing it needed at a low cost on an ex ante basis—that is, independent of inflation forecast errors.
To answer this question, we apply a concept that TIPS analysts call the break-even inflation rate. Essentially, this is a value that makes the marginal investor indifferent between buying TIPS or nominal securities. It includes investors’ expectations about the amount of inflation they will be compensated for as well as any premium they are willing to pay for protection against inflation. It also includes the component of the TIPS yield that investors require as compensation for any deficiency in TIPS market liquidity relative to market liquidity for nominal Treasury securities.
We conduct an ex ante analysis by comparing the auction break-even rate with a measure of inflation expectations.12 Ideally, we would like to use a measure of inflation expected by TIPS investors at the time of the auction. Unfortunately, such a measure is not available. Instead, as an approximation, we use real-time estimates of expected inflation from the Survey of Professional Forecasters (SPF), conducted by the Federal Reserve Bank of Philadelphia.13 Although the survey’s median estimate of the CPI inflation rate over the next ten years is available only quarterly,14 it is unlikely that inflation expectations are very volatile at a high frequency, leading us to expect that the SPF measure may be a reasonable gauge of market expectations.15
Chart 1 compares the auction break-even rate at the ten-year maturity point with the SPF long-run estimate of CPI inflation. It shows that during the early years of the TIPS
12 We apply the same methodology as Roush (2008) to calculate the auction break-even rate. In particular, we estimate the break-even rate received at auction to be the implied inflation rate that equates the price of the TIPS at auction to a hypothetical on-the-run nominal security with the same real payment stream as the TIPS issue. For further details on the calculation, see Roush (2008).13 The SPF is conducted on a quarterly basis. Survey respondents are professional economic forecasters in business and on Wall Street. 14 We use the median ten-year-ahead CPI inflation forecast, which represents the median expectations of respondents for the average annual headline CPI inflation rate over the next ten years. As such, this forecast is for a similar inflation index and an almost similar time period as a newly issued ten-year TIPS. The SPF forecast is based on the seasonally adjusted headline CPI; if it were based on a non–seasonally-adjusted CPI, there should be no difference between the two because they would be forecasts of average annual rates, and therefore assumptions about seasonality over the year would be irrelevant. The time period of the survey is slightly off, given that TIPS are linked to non–seasonally-adjusted CPI lagged by approximately 2.5 months.15 Although there are no direct measures of inflation expectations, we believe that the Survey of Professional Forecasters is a good proxy. An alternative survey is the University of Michigan’s Survey of Consumers, which is a median long-term (five-year) inflation expectations measure. The Michigan measure is based on the forecasts of consumers, as opposed to professional economists. A similar analysis using this measure shows a comparable pattern, where the early years of the TIPS program appear more costly.
A problem with current ex post analysis . . .
is that it depends upon the performance
of inflation over a relatively short period of
time. If inflation proves to be meaningfully
different than what was expected at the
time of TIPS issuance, then this difference—
the “inflation surprise”—affects the costs
of TIPS relative to nominal Treasuries.

FRBNY Economic Policy Review / July 2009 5
Sources: Federal Reserve Bank of Philadelphia, Survey of ProfessionalForecasters (SPF); Board of Governors of the Federal Reserve System.
Chart 1
Ten-Year TIPS Auction Break-Even Minus SPF Median Consumer Price Index over Next Ten Years
Basis points
Treasury first announcescommitment to program
-200
-150
-100
-50
0
50
100
08070605040302010099981997
program, the auction break-even inflation rate was lower than median inflation expectations of professional forecasters. This indicates that the ex ante cost of ten-year TIPS issuances was higher than the cost of nominal ten-year Treasury issuances.
As of June 2008, however, the break-even inflation rate at the ten-year maturity point was about 2.50 percent, which is equal to the most recent SPF long-run estimate of 2.50 percent CPI inflation. If we assume that the SPF fairly represents the expectations of investors, then the current constellation of data indicates that on an ex ante basis, it appears that the cost of issuing TIPS is currently about equal to the cost of issuing nominal Treasuries.16 From this perspective, there appears to be little net benefit or cost from TIPS in terms of expected financing expenses.
The break-even inflation rate obtained from a comparison of TIPS yields and nominal Treasury yields includes two other key elements beyond expectations about the future inflation rate: the inflation risk premium that investors pay for inflation protection and the illiquidity premium associated with TIPS compared with nominal Treasuries. If the insurance value of inflation protection exceeds the illiquidity premium, then the break-even rate will be greater than expected inflation and the ex ante cost of TIPS will be lower than it is for nominal Treasuries. If, however, the illiquidity premium is greater than
16 Although the sample size is limited, the median ten-year-ahead CPI inflation rate forecasted by the SPF has typically overpredicted actual ten-year CPI inflation for the forecasts made between 1979 and 1997. If, in a longer sample period, the SPF proves to always overpredict ten-year-ahead CPI inflation, then the ex ante cost estimates in our analysis may be overstated. That said, we believe that over a longer sample period, the forecast errors of the SPF should net out to zero.
the inflation risk premium, then the break-even rate will be below the expected rate of inflation and the ex ante cost of TIPS issuance will be greater. The fact that break-even rates were below expected inflation during the first several years of the program indicates that the illiquidity premium must have been a dominant influence on ex ante costs over this period.17 More recently, however, break-even rates and inflation expectations appear to be approximately equal, implying that the two factors more or less cancel each other out. This shift could be attributable to a decline in the illiquidity premium in TIPS yields and/or an increase in the inflation risk premium.
3. TIPS Illiquidity Premiums and Inflation Risk Premiums
There is no direct evidence on the illiquidity premiums in TIPS yields and on inflation risk premiums, so we rely on indirect evidence and model-based estimates. In this section, we consider several approaches to modeling both types of premiums as well as review observable evidence on changes in TIPS market liquidity.
3.1 Illiquidity Premiums
Over the past decade, TIPS issuance has grown nearly five times as quickly as nominal issuance, to where it now represents almost 10 percent of the Treasury’s marketable debt
portfolio.18 During this period, the TIPS investor base appears to have widened and, according to Federal Reserve 2004 data—information on market activity collected by the Federal Reserve
17 Roush (2008) finds that the illiquidity premium in TIPS accounts for most
of the ex post cost of TIPS during this period. 18 This estimate does not account for the current principal inflation accretion on TIPS issues. If that amount is included, the share increases to 11.9 percent (U.S. Treasury Department, Bureau of the Public Debt, Monthly Statement of the Public Debt of the United States, January 2008).
Over the past decade, TIPS issuance has
grown nearly five times as quickly as
nominal issuance, to where it now
represents almost 10 percent of the
Treasury’s marketable debt portfolio.

6 The Case for TIPS
Source: Board of Governors of the Federal Reserve System, FR 2004 reporting forms.
Note: Figures reflect interdealers and customers; interdealer volumes represent one side of a trade.
Chart 2
Average Daily Secondary-Market Trading Volume in TIPSTwelve-Week Moving Average
Billions of dollars
0
2
4
6
8
10
080706050403020100991998Sources: Investment Company Institute; U.S. Treasury Department.
Chart 3
Assets under Management in Inflation-Protected Bond Funds
Billions of dollars
0
10
20
30
40
50
60
70
80
90
0
100
200
300
400
500
600
700
800
900
07060504032002
Billions of dollars
Total assets undermanagement
Scale
Scale
TIPS outstanding(inflation-adjusted par)
from primary dealers in U.S. government securities—trading volume among primary dealers in the secondary market has increased ten-fold (Chart 2).19
While data on the distribution of TIPS holders are not available, there are some signs that TIPS market participation has increased and that the market has become less concen-trated. For example, in our conversations with TIPS investors about TIPS market liquidity, they noted the ability to execute trades with a larger number of primary dealers compared with five to ten years earlier. Similarly, a review of the Federal Reserve 2004 data reveals that primary dealer trading in TIPS has become somewhat less concentrated across institutions.20 For example, the top quintile (by volume) of primary dealers was responsible for an average of 68 percent of total TIPS volume in 2007, 10 percentage points lower than the 2001 average.21, 22 In addition, there has been a notable increase in the size of mutual funds that hold inflation-indexed securities. According to the Investment Company Institute, assets under management in inflation-protected mutual funds have grown 712 percent over the past five years (Chart 3).
19 The increase in average daily trading volumes exceeds the increase in TIPS outstanding over the same period. Over the past ten years, the inflation-adjusted par amount of TIPS outstanding has increased almost six-fold. 20 The TIPS traders and the representatives of one electronic brokerage firm with whom we spoke observed that a large majority of trading in TIPS occurs through the primary dealer community.21 By comparison, the nominal total transaction volume among the top quintile of primary dealers averaged 44 percent and 49 percent in 2007 and 2001, respectively.
TIPS traders and investors have reported increased confidence in the longevity of the program and the ability to execute transactions in the secondary market over the past ten years.23 Of note, volume in TIPS was sufficient to support the expansion of electronic trading platforms—such as BrokerTec, Bloomberg, and TradeWeb—to enable TIPS electronic trading in 2003, 2001, and 2003, respectively. Furthermore, a review of bid-ask spreads reveals that TIPS liquidity appears to have improved somewhat in longer term markets since 2003, and is roughly the same in the five- and ten-year sectors. For example, according to Fleming and Krishnan (2008),24 when there were bid and ask quotes in the interdealer broker market, bid-ask spreads averaged approximately 2/32s, 3/32s, and 7/32s in the five-, ten-, and twenty-year benchmark issues, respectively,
22 According to Federal Reserve 2004 data on primary dealers, the breakdown of total TIPS transaction volume between the interdealer market and the dealer-to-customer market has also changed since 2001. Trading between primary dealers and customers accounted for 78.4 percent of total primary dealer transaction volume in 2001. In 2007, this percentage declined to 73.4 percent, while interdealer trading increased. 23 Most notably, TIPS market participants cited the Treasury’s 2002 public affirmation of its commitment to the program (<http://treas.gov/press/releases/po3149.htm>), which it has reaffirmed in public statements as recently as the August 2008 refunding (<http://www.treas.gov/press/releases/hp1095.htm>). 24 Fleming and Krishnan note that a drawback of using the bid-ask spread to analyze TIPS market liquidity is that there is not always a two-sided market. For example, they estimate that between March 2005 and March 2008, there was a two-sided market in the on-the-run ten-year TIPS approximately 60 percent of the time in the interdealer broker market. As such, information on the extent to which there is a two-sided market complements the bid-ask spread when analyzing liquidity. Unfortunately, a longer time series of these data is not available.

FRBNY Economic Policy Review / July 2009 7
Chart 4
Illiquidity Premium in Ten-Year TIPS Yield
Percent
Source: D’Amico, Kim, and Wei (2008).
0
0.5
1.0
1.5
2.0
2.5
0807060504030201001999
between March 2005 and March 2008.25 Although figures are not directly comparable given the different data sources, Sack and Elsasser (2004) estimate bid-ask spreads of 2/32s for TIPS maturing between five and ten years and between 4/32s and
16/32s for TIPS maturities beyond ten years in 2003. Our discussions with TIPS market participants also suggest that secondary-market liquidity has improved over the past five years.
Even if TIPS liquidity has improved, it undoubtedly remains below that of on-the-run nominal securities. Daily trading volumes in on-the-run nominal securities far exceed those described for TIPS (Fleming and Mizrach 2008). The important question concerning future issuances is not whether TIPS liquidity has improved, but whether TIPS liquidity has
25 Bid-ask spreads are measured in 1/32s of a point, where a point roughly equals 1 percent of the security’s par value.
improved enough to shrink the illiquidity premium sufficiently to make TIPS issuance cost-effective from the perspective of the Treasury. More precisely, are investors currently demanding substantial compensation in order to hold TIPS relative to a more liquid security? The larger such premiums are going forward, the greater the costs to the Treasury of future issuances, all else equal.
D’Amico, Kim, and Wei (2008) estimate the illiquidity premium in TIPS yields compared with off-the-run nominal securities from a no-arbitrage latent-factor model of the real and nominal term structure. The authors derive this measure by comparing observed TIPS yields with predictions based on an affine model of nominal term structure and an estimated process for inflation.26
D’Amico, Kim, and Wei estimate that the liquidity premium in the ten-year TIPS yield was as large as 200 basis points in the early years of the program (Chart 4). Since then, however, the premium has trended down, and within the last six months has fluctuated below 50 basis points. The fact that the premium is positive for most of the sample indicates that TIPS have remained illiquid relative to off-the-run nominal securities, and thus even more so compared with their on-the-run counterparts. Nonetheless, the fact that the premium investors demand in compensation for this illiquidity has shrunk to lower levels in recent years suggests that TIPS market liquidity has improved enough to have a dramatic effect on the cost-effectiveness of TIPS issuance. Indeed, as we discuss
26 See the appendix for more details on the D’Amico, Kim, and Wei model.
The important question concerning future
issuances is not whether TIPS liquidity
has improved, but whether TIPS liquidity
has improved enough to shrink the
illiquidity premium sufficiently to make
TIPS issuance cost-effective from
the perspective of the Treasury.

8 The Case for TIPS
Source: Macroeconomic Advisers.
Chart 5
Sack Measure of the TIPS Liquidity Premium since 1999Five-Year Five-Year-Forward Rate
Percent
0
0.25
0.50
0.75
0706050403020100991998
below, it now compares favorably with estimates of the size of the inflation risk premium.
Sack (2007b) provides an alternative measure of the illiquidity premium in five-year-forward TIPS yields beginning in five years. His measure is derived from a regression of TIPS yields on a variety of macroeconomic variables as well as the secondary-market turnover in TIPS.27 Consistent with D’Amico, Kim, and Wei (2008), Sack finds that the TIPS yields in the early years of the program were above the level predicted by macroeconomic fundamentals alone, and interprets the part of the TIPS yield that is predicted by TIPS turnover as a proxy for the illiquidity premium. This measure, shown in Chart 5, also points to a notable improvement in TIPS liquidity during the 2001-04 period. Of note, the level of Sack’s illiquidity measure is different from the D’Amico, Kim, and Wei estimate because Sack measures the illiquidity premium indirectly through a multifactor regression.
3.2 Inflation Risk Premiums
The notable declines in estimates of the illiquidity premiums in TIPS yields in recent years suggest that it now costs the
27 In his regression, Sack includes a measure of the difference between the unemployment rate and the Non-Accelerating Inflation Rate of Unemployment, expected real GDP over the subsequent year, the spread between West Texas Intermediate (WTI) futures and spot prices, lagged WTI oil price inflation, the three-month moving average of correlation between daily changes in the stock market and break-even rates, and the squared difference between TIPS volume at each point in the sample with the end period volume.
Treasury relatively less to issue TIPS than nominal securities. This raises an important question about the size of the illiquidity premiums vis-à-vis the size of the inflation risk premiums.
To better estimate the size of the inflation risk premiums, we consider several models. A simple measure of the inflation risk premium can be calculated based on the term structure of forward inflation compensation rates at distant horizons, as described in Sack (2007a). The rationale is that most factors affecting movements in inflation tend to die out after a few years, so that investors are unlikely to expect inflation to be different at adjacent forward rates, for example, at nine and ten years ahead.28 Thus, the spread between one-year-forward inflation ending in nine and in ten years is likely to be driven mostly by inflation risk premiums.29
Chart 6 presents a time series of the inflation risk premium from nine to ten years ahead measured according to this approach.30 The estimates in the chart are based on smoothed
zero-coupon yield curves for real and nominal bonds (Gürkaynak, Sack, and Wright 2006, 2008). The inflation risk premium has varied between 0 and 25 basis points since 1999, with an average value of 11 basis points.
Another method for estimating the inflation term premium
embedded in nominal Treasury yields is the no-arbitrage model used by D’Amico, Kim, and Wei (2008). Chart 7 presents a time series of the inflation risk premium for ten-year zero-coupon inflation compensation from their model. This measure of the inflation risk premium varies between 40 and 120 basis points over the history of the TIPS program. The levels of the two measures of inflation risk premiums are not directly comparable because one is a short-term far forward rate and one is long-term spot rate. However, it is useful to note that the correlation between the two measures is positive and
28 This simplifying assumption ignores factors that affect the level of long-run inflation expectations. However, these factors are likely to occur infrequently. 29 Although this approach does not explicitly account for liquidity effects, the fact that the illiquidity premium at nine years is unlikely to be very different from the premium at ten years signifies that, in essence, liquidity effects are more or less excluded by taking the spread at these adjacent horizons. 30 We use a smoothed spline to abstract from small deviations in yields based on liquidity. Furthermore, we believe that any differences between our estimates, which are derived from a smoothed spline, and those derived from a bid, ask, or mid-spline would be small.
The notable declines in estimates of the
illiquidity premiums in TIPS yields in
recent years suggest that it now costs
the Treasury relatively less to issue TIPS
than nominal securities.

FRBNY Economic Policy Review / July 2009 9
Chart 6
Inflation Risk Premium at Ten Years from Term Structure of Forward Inflation Compensation
Basis points
Source: Gürkaynak, Sack, and Wright (2008).
-10
-5
0
5
10
15
20
25
0807060504030201001999
Chart 7
Ten-Year Risk Premium
Basis points
Source: D’Amico, Kim, and Wei (2008).
0
20
40
60
80
100
120
140
0807060504030201001999
statistically significant, albeit at only 0.28. More importantly, although the D’Amico, Kim, and Wei measure exhibits somewhat different variation, particularly in the first half of the sample, both series generally declined between 2004 and 2008, before picking up recently. This provides further evidence that the recent improvement in the cost of TIPS issuance was associated with a decline in TIPS illiquidity premiums rather than an increase in inflation risk premiums.
3.3 The Inflation Risk Premium Earned by the Treasury at Auction
We conclude this section by explicitly decomposing our ex ante cost analysis into the components associated with illiquidity in TIPS and inflation risk premiums. We again compare the break-even rate of inflation with a measure of expected inflation from the Survey of Professional Forecasters. However,

10 The Case for TIPS
Chart 8
Inflation Risk Premiums at Historical TIPS Auctions
Basis points
Source: Authors’ calculations, based on data from the U.S. Treasury Department and the Board of Governors of the Federal Reserve System.
-50
0
50
100
150
200
250
08070605040302010099981997
we now exclude the illiquidity premium in TIPS yields estimated in D’Amico, Kim, and Wei (2008) before computing the break-even rate.31 A comparison of this break-even rate with inflation expectations yields an estimate of the premium investors were willing to pay for inflation protection at previous TIPS auctions.
Chart 8 uses this method to present estimates of the inflation risk premium on TIPS auction days.32 The average risk premium over the sample is within the range of the other estimates, at 47 basis points. Furthermore, this measure of auction inflation risk premiums appears to have decreased over time. This may indicate that the initial purchasers of inflation-indexed bonds were also those investors who put the highest value on inflation protection.33 An alternative explanation is that as inflation has stayed low, inflation expectations have
31 D’Amico, Kim, and Wei calculate the liquidity component for five- and ten-year TIPS yields, which we use to adjust the auction prices of five- and ten-year TIPS issues. For twenty- and thirty-year TIPS issues, we assume that the liquidity component is equal to the component for a ten-year security, which in the event that these securities are less liquid than the ten-year note, understates this effect and thus underestimates the risk premium at this horizon. D’Amico, Kim, and Wei also do not calculate liquidity yield components before 1999, because there were too few TIPS issues to construct a zero-coupon yield curve. For auctions occurring between 1997 and 1999, we assume that the liquidity yield component is equal to its value at the start of 1999. 32 Note that the maturity of TIPS changes at each auction in the chart, complicating comparison with the time series of the inflation risk premiums. Put another way, the inflation risk premiums presented in the chart are not for a constant time horizon, but vary between five, ten, twenty, and thirty years, depending on the maturity of the TIPS being auctioned on a given date.
become better anchored. As this has occurred, the inflation risk premium that investors have been willing to pay for inflation protection has diminished somewhat over time.34
Table 2 presents the average inflation risk premium by maturity of the securities auctioned. Although the size of the premium does not appear to increase consistently with maturity, this result may be misleading as it is attributable, at least in part, to changing issuance patterns. For example, with the exception of the July 2002 TIPS, five-year TIPS have only been issued during the past three years—a period in which oil prices increased more than 175 percent. This could contribute to the high estimate of the inflation risk premium for five-year TIPS. In contrast to the relatively limited issuance of five-,
33 The fact that the inflation risk premiums by this measure are sometimes negative suggests possible measurement error in the estimation of inflation expectations. Furthermore, except for the two recent negative estimates of inflation risk premiums, the other negative estimates are not significantly different from zero.34 The -32.3 basis point estimate of the inflation risk premium at the April 2008 five-year TIPS auction may reflect market conditions at the time of the auction as opposed to the actual value investors placed on inflation protection. In particular, the historically low level of five-year TIPS yields (and the low expected coupon rate) reportedly may have deterred some investors from participating in the auction. Of note, the pre–auction-day yield of the five-year TIPS, at 0.53 percent, was the lowest pre–auction-day level compared with prior five-year TIPS auctions and was notably below the 1.79 percent average five-year TIPS yield since the Treasury brought back the five-year maturity point in 2004. In addition, part of the negative inflation risk premium may also reflect the flight-to-quality bid in the nominal market at the time. When we calculate the inflation risk premium that assumes that TIPS are as liquid as an on-the-run security (instead of an off-the-run security), the premium increases to -10.3 basis points.

FRBNY Economic Policy Review / July 2009 11
twenty-, and thirty-year TIPS, ten-year TIPS were issued throughout the sample and thus may provide the best overall estimate that is also maturity-constant. According to this estimate, a typical risk premium over this period has been about 40 basis points.
The fact that investors appear willing to pay about 40 basis
points for inflation protection indicates that the TIPS program
does satisfy a real demand that is not met by nominal
Treasuries. It also suggests a potential for significant gains to
the Treasury from enhanced secondary-market trading
liquidity. For example, if the TIPS market were as liquid as the
market for off-the-run Treasuries, the Treasury would have
realized a total cost savings from the TIPS program of
$22 billion to $32 billion.35, 36
35 We estimate the ex ante cost of the TIPS program as the present discounted value of the difference in the payment stream paid by the Treasury to TIPS holders from the expected payment embedded in TIPS prices, assuming that actual inflation equals the SPF measure of expected inflation and that no illiquidity premium exists.36 Similarly, if the TIPS market were as liquid as the market for on-the-run Treasuries, the Treasury would have realized a total cost savings from the TIPS program of $28 billion to $37 billion.
4. Other Benefits of Inflation-Indexed Debt
The Treasury’s ability to issue TIPS at lower inflation-adjusted yields because of a significant inflation risk premium is one of several benefits that inflation-linked debt issuance provides to investors and monetary policymakers. Other benefits of the TIPS program, although difficult to quantify, are potentially considerable. We now discuss how some of these benefits may make TIPS issuance more favorable to the Treasury and U.S. taxpayers than additional issuances of nominal securities.
4.1 Inflation Hedge for Households
Economist James Tobin made one of the most convincing arguments in favor of inflation-indexed debt on behalf of households with real saving objectives:
“… markets do not provide, at any price, a riskless way of accumulating purchasing power for the future, whether for old age, or for college education or for heirs…. Meanwhile we force savers to take risk, even if they would gladly pay for the privilege of avoiding it…. No private institution can fill this gap. No insurance company or pension fund could assume the risk of offering purchasing power escalation to its creditors without similarly (inflation) escalated securities in which to invest at least some of their funds.”37, 38
The key point of this argument is that even if nominal bond yields are high enough on average to compensate investors for the expected rate of inflation, an individual investor at any time may be overcompensated or undercompensated vis-à-vis the realized rate of inflation. By providing individuals with a way to insure against inflation risk, TIPS embed less risk than any other asset class. With virtually no credit risk or inflation risk, TIPS are one of the safest investments.39 Equities or other assets with uncertain nominal returns provide only an imperfect hedge depending on their correlation vis-à-vis inflation (Chu, Lee, and Pittman 1995).
37 Tobin (1963, pp. 204, 206).38 While investors could purchase short-term debt and renegotiate the interest rate every three months, they would be exposed to roll-over risk.39 There is some inflation basis risk in that TIPS are based on the non–seasonally-adjusted consumer price index, and a household’s expenditure basket might differ from the basket in the CPI. Also, pension and endowment liabilities may be more closely related to other inflation or wage measures than the CPI.
Table 2
Estimate of Inflation Risk Premium by Maturity of Issue
Maturity Premium (Basis Points)
Five-year 52.0
Ten-year 41.0
Twenty-year 37.5
Thirty-year 83.0
Source: Authors’ calculations.
The fact that investors appear willing to
pay about 40 basis points for inflation
protection indicates that the TIPS
program does satisfy a real demand
that is not met by nominal Treasuries.
It also suggests a potential for significant
gains to the Treasury from enhanced
secondary-market trading liquidity.

12 The Case for TIPS
This benefit has implications for individual investors as well as for the broader economy.40 By enabling investors to insure against inflation risk, the government allows them to choose the amount of inflation risk they hold, resulting in a more optimal allocation of risk among investors with different tolerances (Campbell and Shiller 1996). In addition, as Tobin (1963) argues, the existence of a risk-free inflation hedge may in turn encourage saving behavior by households.
4.2 Improved Monetary Policy
The existence of TIPS helps to improve the conduct of
monetary policy in a number of ways. Foremost, the program
provides up-to-date information about the evolution of
inflation expectations and real ex ante interest rates,41 which
are important inputs to monetary policy decisions. Because
increases in inflation expectations are often difficult to predict
and to reverse, up-to-date information from TIPS about
expectations may be important in helping monetary policy-
makers keep inflation expectations in check. This is critical
because inflation expectations are a major element influencing
the inflation process.42 In this role, TIPS are particularly useful
because survey measures of inflation expectations, such as
those from the University of Michigan and the Survey of
Professional Forecasters, are available only with a lag and are
updated much less frequently. Although inflation swaps
40 It should be noted that there are potential income distribution effects if TIPS are more expensive to issue than nominal securities and TIPS holders are not evenly distributed across income groups. We do not address these effects here, however. 41 Raw inflation compensation rates are not pure measures of inflation expectations because they contain inflation risk premiums and, potentially, distortions attributable to illiquidity. However, estimates of expected inflation can be derived using measures of these later components, as demonstrated by D’Amico, Kim, and Wei (2008). Furthermore, significant changes in TIPS liquidity tend to be slow compared with inflation expectations; as a result, over short periods of time, changes in inflation compensation rates can reflect a change in inflation expectations and/or inflation risk premiums.
provide an alternative market source of daily information on
inflation expectations, these securities are much less liquid than
TIPS (Beechey and Femia 2007).43 Moreover, it is unclear
whether the U.S. inflation swaps market would exist without
the TIPS market because TIPS provide a benchmark security
that can be used to hedge the inflation payments on swaps.
TIPS are also valuable in helping economists and policymakers understand the forces that influence inflation expectations. For example, minute-by-minute data on inflation compensation from financial markets provide a gauge of the effects of monetary policy actions and macroeconomic data releases on inflation expectations. In this way, TIPS help inform macroeconomic models that are important in the policymaking process.
4.3 Improved Fiscal Policy
TIPS may also offer incentives for improved fiscal policy. They provide an explicit incentive for the fiscal (as well as monetary) authorities to conduct policy with an eye toward the conse-quences for inflation. Recognition by the public that the government is accountable for higher inflation in the form of
higher inflation payments to TIPS holders may help hold down inflation expectations and cause inflation expectations to be more firmly anchored, that is, less responsive to inflation shocks.
Moreover, TIPS can help improve the management of the national debt. Because payments on TIPS are tied to realized inflation, the receipts and expenditures of the Treasury
42 If long-run inflation expectations become less anchored, shocks to inflation may result in a larger effect on inflation expectations and trend inflation. Consistent with this idea, Mishkin (2007) notes that “because long-run inflation expectations are a key driver of trend inflation, monetary authorities monitor long-run inflation expectations closely. If they find that they are losing credibility with the markets, so that inflation expectations begin to drift and rise above (or fall below) a desired level, they will take actions to restore their credibility.”43 Trading in CPI futures, which provides another financial market read on inflation expectations, was introduced on the Chicago Board of Exchange in March 2004; however, market liquidity had declined to nearly zero by the summer of 2005.
TIPS may also offer incentives for
improved fiscal policy. They provide
an explicit incentive for the fiscal (as well
as monetary) authorities to conduct policy
with an eye toward the consequences
for inflation.
The existence of TIPS helps to improve
the conduct of monetary policy in a
number of ways. Foremost, the program
provides up-to-date information about the
evolution of inflation expectations and real
ex ante interest rates, which are important
inputs to monetary policy decisions.

FRBNY Economic Policy Review / July 2009 13
Department are (all else equal) likely to be better matched—since tax receipts are also nominal and likely to rise and fall with shifts in the underlying inflation rate. Thus, TIPS issuance may help reduce the overall volatility of the Treasury’s financing needs.44 A reduction in volatility helps promote the
regularity and predictability of the issuance calendar, which increases the liquidity of outstanding Treasury securities and helps to foster demand at Treasury auctions.
In addition, as noted by Timothy S. Bitsberger, Treasury Deputy Assistant Secretary for Federal Finance, TIPS may give the Treasury access to a broader investor base,45 which may reduce the Treasury’s overall funding costs. Bitsberger further observes that “by diversifying our [the Treasury’s] borrowing, we reduce exposure to a single adverse shock and both lower and smooth our borrowing costs.” The comparison between the prevailing interest rates on TIPS and on nominal Treasuries provides insight into the relative costs associated with issuing the last dollar of debt. However, just as important is the answer to the question whether TIPS issuance, by displacing nominal Treasury issuance, reduces the level of interest rates that the Treasury pays on its nominal issuances. In principle, a substantial shift in the composition of Treasury issuance into TIPS from nominal Treasuries could lead to lower interest rates paid on the remaining nominal Treasury issuance. This would occur if TIPS were not perfect substitutes for nominal Treasury securities and if the demand for nominal Treasuries was downward-sloping—that is, not completely elastic.
The first condition almost certainly holds given the different attributes of TIPS and nominal Treasuries. If they were perfect
44 Since payments on nominal Treasury debt are tied to expected inflation at the time of the security’s auction, differences in Treasury assets and liabilities can arise from divergences between realized and expected inflation. 45 Presentation by Bitsberger to the Bond Market Association’s Inflation-Linked Securities Conference, June 26, 2003 (<http://treas.gov/press/releases/js505.htm>).
substitutes, there would not be a liquidity premium for nominal Treasuries relative to TIPS. The second condition seems likely to hold, as evidenced by a number of studies finding that an increase in the net amount of Treasury borrowing leads to higher expected borrowing costs for the Treasury.46
While it is very difficult to estimate the effect that additional supply would have on Treasury yields, a few studies have touched upon the subject. Fleming (2002) suggests that a $1 billion increase in issuance size for the most recently issued three- or six-month bill raises its yield, relative to neighboring bill yields, by approximately 0.35 basis point. At the longer end, Krishnamurthy (2002) finds that a $1 billion increase in bond supply would raise the bond yield, relative to the yield on the previously issued bond, by 0.2 basis point. These results suggest that by issuing securities in a segmented TIPS market, the Treasury may keep realized yields on bill and nominal coupon securities lower than they otherwise would have been.
5. Conclusion
This article offers an in-depth evaluation of the Treasury Inflation-Protected Securities program. Our investigation reaches several important conclusions.
First, a decision on whether the continued issuance of TIPS is beneficial to U.S. taxpayers should be based on a comparison of the ex ante costs of TIPS and nominal Treasury issuance and, especially when these costs are negligible, on a consideration of the more difficult-to-measure benefits TIPS issuance provides taxpayers and policymakers. This decision should not be based on an ex post cost analysis because such analysis depends on the realized inflation rate over a relatively short history, which is irrelevant in assessing the expected costs of TIPS issuance compared with nominal Treasury issuance on a prospective basis.
Second, on an ex ante basis, the cost of TIPS issuance is
about equal to or less than the cost of nominal Treasury
issuance. The reason is that the value of inflation protection—
the implicit premium that investors are willing to pay in terms
46 Tests of market segmentation of different types of Treasury debt have yielded mixed results (Fleming 2002; Krishnamurthy 2002; Laubach 2003). However, this work is generally limited to consideration of different maturities of nominal debt and does not consider segmentation of real versus nominal debt. That there might be more evidence for the latter is suggested by conventional wisdom that TIPS market participants tend to be buy-and-hold investors, including institutions such as pension funds. The Treasury auction allotment data consistently show that pension funds and investment funds have taken down an average of 30 percent of the amount issued at TIPS auctions since 2000. In contrast, these investors have taken down only 10 percent of the amount offered at nominal coupon auctions over the same period.
Because payments on TIPS are tied to
realized inflation, the receipts and
expenditures of the Treasury Department
are (all else equal) likely to be better
matched—since tax receipts are also
nominal and likely to rise and fall with
shifts in the underlying inflation rate. Thus,
TIPS issuance may help reduce the overall
volatility of the Treasury’s financing needs.
14 The Case for TIPS
of lower TIPS yields—is now greater than or equal to the yield
premiums investors demand for holding relatively illiquid
TIPS compared with nominal Treasuries.
Third, although the costs of TIPS issuance over the life of the program appear to have exceeded the costs of comparable nominal issuance, these costs were concentrated during the early years of the program, when the illiquidity premium associated with TIPS was large. That premium has shrunk significantly as the TIPS program has matured. Therefore, these early costs are “sunk” and should not be used to determine whether TIPS issuance is costly on an ongoing basis.
Fourth, TIPS issuance has other significant benefits that are not captured by an analysis of net issuance costs. These include
the value to investors of having a risk-free asset that offers protection against inflation, the value to the monetary authority of having a real-time guide to shifts in inflation expectations, and the fact that a TIPS program likely displaces nominal debt issuance to some degree, allowing for a reduction in the average cost of nominal issuance as that supply is reduced.
Finally, our analysis of the ex ante costs of the TIPS program and the more difficult-to-measure benefits suggests at least a modest net benefit to the Treasury. Because TIPS issuance appears to be attractive from the Treasury’s standpoint, a natural next step is answering the question, What is the optimal allocation of the Treasury’s liability portfolio between TIPS and nominal Treasury securities?

FRBNY Economic Policy Review / July 2009 15
We briefly describe how D’Amico, Kim, and Wei (2008) estimate the illiquidity premium in yields on Treasury Inflation-Protected Securities (TIPS). Their first step is to estimate yields on hypothetical real bonds that have the same liquidity as nominal Treasury securities, using a joint model of nominal yields and inflation. Intuitively, the authors are con-structing these yields by considering the time-series properties of nominal Treasury yields and inflation, but they do so in a coherent asset pricing framework that rules out the possibility that investors are leaving arbitrage opportunities unexploited.
Modern asset pricing theory starts from the premise that the absence of arbitrage implies the existence of a pricing kernel, , such that the price of any asset satisfies the relationship
. Because bond prices are not complicated by uncertain cash flows, the price of an n-period nominal zero-coupon bond is given just by . This imposes tight restrictions on the relationship between the time-series and cross-sectional properties of these bond prices. Following many researchers in the finance literature, D’Amico, Kim, and Wei assume that the pricing kernel, , depends on the short-term interest rate, , and prices of risk, . If investors were risk-neutral, then would be zero, but the authors make no such assumption. The short-term interest rate and prices of risk are assumed to be “affine” (linear plus a constant) functions of three unobserved factors, represented by ,
.
In turn, these factors are assumed to follow a vector autoregression of the form
.
This implies that the yield on an n-period zero-coupon bond is given by an affine function of the factors
,
where and are functions of the parameters of the model including , , , , , and . Finally, a novel feature of the D’Amico, Kim, and Wei study is its assumption that expected inflation is also an affine function of the same factors, ,
.
mt 1+
Pt Et Pt 1+ mt 1+( )=
Et mt 1+ mt 2+ …( …mt n+ )
mt 1+
ys t( ) λ t( )λ t( )
X t( )
ys t( ) δ 0 δ 1X t( )+=
λ t( ) v0 v1 X t( )+=
X t 1+( ) μ Φ X t( ) ε t 1+( )+ +=
yn t( ) an bn 'X t( )+=
a n( ) b n( )μ Φ δ0 δ 1 v0 v1
X t( )
π e t( ) φ 0 φ 1 X t( )+=
Because it jointly models the nominal term structure and inflation, the model can be used to price a hypothetical real bond, the yield on which also turns out to be an affine function of the factors
.
The model is estimated using data on nominal Treasury yields, CPI inflation, and survey forecasts of nominal short-term interest rates and inflation.47 The survey forecasts are treated as noisy measures of true expectations of future rates and inflation. In addition, substituting the parameter estimates into the last equation gives the estimated real yields.
Estimating the Illiquidity Premium in TIPS Yields
Because D’Amico, Kim, and Wei derive estimated real yields from the nominal off-the-run term structure rather than directly from TIPS themselves, the resulting estimated real yields implicitly embody the same liquidity characteristics as nominal off-the-run securities. Thus, by differencing these estimated real yields and observed TIPS yields, the authors obtain an estimate of the portion of observed real yields that owes to differences in nominal and real bond liquidity. A positive difference results when TIPS are less liquid than the nominal off-the-run securities, since in this case TIPS investors require a yield premium for holding the less liquid securities.
Chart 4 in the text shows that this difference series is indeed positive throughout its history. It also exhibits a secular decline, which is consistent with improved liquidity as one would expect from a developing financial market. It also shows a small amount of variation around its downward trend. This may reflect high-frequency changes in the liquidity premium, but it is probably also importantly influenced by model fitting error, as the model-implied nominal yields are close—but not identical—to the actual observed yields.
47 TIPS are not included directly in the version of the D’Amico, Kim, and Wei model discussed here because the sample of available TIPS is too short. Instead, the authors model inflation and use it to price synthetic real bonds. The authors also estimate a version of the model that incorporates TIPS; however, the shortness of the available TIPS sample means that their estimates are likely associated with greater estimation error.
ynreal t( ) an
real= bnreal X t( )+
Appendix: Estimation of the Illiquidity Premium

References
16 The Case for TIPS
Ang, A., G. Bekaert, and M. Wei. 2008. “The Term Structure of Real
Rates and Expected Inflation.” Journal of Finance 63, no. 2
(April): 797-849.
Beechey, M., and K. Femia. 2007. “Inflation Swaps Revisited.”
Unpublished paper, Board of Governors of the Federal
Reserve System.
Bitsberger, T. S. 2002. “Remarks of Treasury Deputy Assistant
Secretary for Federal Finance Timothy S. Bitsberger to the Fixed-
Income Summit, Palm Beach, Florida.” Press release, December 5.
Available at <http://treas.gov/press/releases/po3673.htm>.
Campbell, J. Y., and R. J. Shiller. 1996. “A Scorecard for Indexed
Government Debt.” NBER Working Paper no. 5587, May.
Chu, Q. C., C. F. Lee, and D. N. Pittman. 1995. “On the Inflation Risk
Premium.” Journal of Business Finance and Accounting 22,
no. 6 (September): 881-92.
Coeuré, B., and N. Sagnes. 2005. “Un bilan de l’émission des
obligations françaises indexes sur l’inflation.” Diagnostics
Prévisions et Analyses Économiques, no. 89, November: 1-7.
[No English version exists.]
D’Amico, S., D. H. Kim, and M. Wei. 2008. “Tips from TIPS:
The Informational Content of Treasury Inflation-Protected
Security Prices.” Board of Governors of the Federal Reserve System
Finance and Economics Discussion Series, no. 2008-30, June.
Fisher, P. R. 2001. “Under Secretary of the Treasury for Domestic
Finance Peter R. Fisher, Remarks at the November 2001 Quarterly
Refunding.” Press release, October 31. Available at <http://
www.treas.gov/press/releases/po749.htm>.
Fleming, M. 2002. “Are Larger Treasury Issues More Liquid? Evidence
from Bill Reopenings.” Journal of Money, Credit, and
Banking 34, no. 3, part 2 (August): 707-35.
———. 2003. “Measuring Treasury Market Liquidity.” Federal
Reserve Bank of New York Economic Policy Review 9, no. 3,
(September): 83-108.
Fleming, M., and N. Krishnan. 2008. “The Microstructure of the TIPS
Market.” Unpublished paper, Federal Reserve Bank of New York.
Fleming, M., and B. Mizrach. 2008. “The Microstructure of a U.S.
Treasury ECN: The BrokerTec Platform.” Unpublished paper,
Federal Reserve Bank of New York.
Gensler, G. 1998. “Treasury Assistant Secretary for Financial Markets
Gary Gensler Addresses the President’s Commission to Study
Capital Budgeting.” Press release, April 24. Available at <http://
www.ustreas.gov/press/releases/rr2493.htm>.
Gürkaynak, R. S., B. Sack, and J. H. Wright. 2006. “The U.S. Treasury
Yield Curve: 1961 to the Present.” Board of Governors of the
Federal Reserve System Finance and Economics Discussion
Series, no. 2006-28, October.
———. 2008. “The TIPS Yield Curve and Inflation Compensation.”
Unpublished paper, Board of Governors of the Federal Reserve
System.
Krishnamurthy, A. 2002. “The Bond/Old-Bond Spread.” Journal
of Financial Economics 66, no. 2-3 (November): 463-506.
Laubach, T. 2003. “New Evidence on the Interest Rate Effects of
Budget Deficits and Debt.” Board of Governors of the Federal
Reserve System Finance and Economics Discussion Series,
no. 2003-12, April.
Mishkin, F. S. 2007. “Inflation Dynamics.” NBER Working Paper
no. 13147, June.
Roush, J. E. 2008. “The ‘Growing Pains’ of TIPS Issuance.” Board
of Governors of the Federal Reserve System Finance and
Economics Discussion Series, no. 2008-08, February.
Sack, B. 2006. “Treasury Saves a Billion on January 2007 TIPS.”
Macroeconomic Advisers Monetary Policy Insights, Fixed
Income Focus, December 15.
———. 2007a. “How Low Is the Inflation Risk Premium?”
Macroeconomic Advisers Inflation-Linked Analytics, May 9.
———. 2007b. “Are Long-Term Real Yields Now Attractive?”
Macroeconomic Advisers Inflation-Linked Analytics, June 28.
Sack, B., and R. Elsasser. 2004. “Treasury Inflation-Indexed Debt:
A Review of the U.S. Experience.” Federal Reserve Bank of
New York Economic Policy Review 10, no. 1 (May): 47-63.

References (Continued)
FRBNY Economic Policy Review / July 2009 17
Stigum, M., and A. Crescenzi. 2007. Stigum’s Money Market. 4th ed.
New York: McGraw-Hill.
Tobin, J. 1963. “Essays on Principles of Debt Management.”
In Commission on Money and Credit, Fiscal and Debt
Management Policies. Englewood Cliffs, N.J.: Prentice-Hall.
Treasury Borrowing Advisory Committee. 2008. “Minutes of the
Meeting of the Treasury Borrowing Advisory Committee of the
Securities Industry and Financial Markets Association, July 29,
2008.” Available at <http://www.treas.gov/press/releases/
hp1095.htm>.
Tzucker, R., and M. Islam. 2005. “A Pension Reform Primer.” In
Barclays Capital Fixed Income Rates Strategy, November 22.
United Kingdom Debt Management Office. 2001. DMO Annual
Review 2000-01, September 7.
———. 2007. DMO Annual Review 2006-07, August 2.
The views expressed are those of the authors and do not necessarily reflect the position of the Federal Reserve Board, the Federal Reserve Bank of New York, or the Federal Reserve System.
The views expressed are those of the authors and do not necessarily reflect the position of the Federal Reserve Bank of New York, the Federal Reserve Board, or the Federal Reserve System. The Federal Reserve Bank of New York provides no warranty, express or implied, as to the accuracy, timeliness, completeness, merchantability, or fitness for any particular purpose of any information contained in documents produced and provided by the Federal Reserve Bank of New York in any form or manner whatsoever.