Embed Size (px)
Citation preview

HCUP Methods Series

Contact Information:
Healthcare Cost and Utilization Project (HCUP) Agency for Healthcare Research and Quality
540 Gaither Road Rockville, MD 20850
http://www.hcup-us.ahrq.gov
For Technical Assistance with HCUP Products:
Email: [email protected]
or
Phone: 1-866-290-HCUP
Recommended Citation: Kassed C, Kowlessar N, Pfunter A, Parlato J, Andrews RM. The Case for the POA Indicator: Update 2011. ONLINE November 1, 2011. U.S. Agency for Healthcare Research and Quality. Available: http://www.hcup-us.ahrq.gov/reports/methods/methods.jsp.

HCUP (11/01/2011) The Case for the POA Indicator: Update 2011
TABLE OF CONTENTS
EXECUTIVE SUMMARY .................................................................................................................... I INTRODUCTION ............................................................................................................................... 1
THE POA INDICATOR ...................................................................................................................... 1
CMS REQUIREMENTS FOR POA REPORTING ............................................................................. 2
COLLECTION OF POA INFORMATION BY STATEWIDE DATA ORGANIZATIONS .................... 2
POA IMPLEMENTATION IN SOFTWARE ........................................................................................ 4
LITERATURE SUMMARY: 2006 THROUGH 2011 .......................................................................... 6
The Value of POA in Hospital Quality Measurement ............................................................. 7 Use of POA to Assess Potential Hospital Reimbursement Policies ..................................... 10 Issues and Challenges of Accurate POA Coding ................................................................. 11
CONCLUSIONS .............................................................................................................................. 14
ACKNOWLEDGEMENTS ............................................................................................................... 15
REFERENCES ................................................................................................................................ 17
APPENDIX A: POA REPORTING OPTIONS AND FORMAT REQUIREMENTS ....................... A-1
APPENDIX B: SUMMARY OF POA DATA COLLECTION BY STATE, 2009 ............................ B-1

HCUP (11/01/2011) i The Case for the POA Indicator: Update 2011
EXECUTIVE SUMMARY
The present-on-admission (POA) indicator in hospital administrative data distinguishes medical conditions that are present when patients enter the hospital (i.e., comorbidities or pre-existing conditions) from those that first occur during the hospital stay (complications or in-hospital adverse events). This indicator improves the utility of administrative data for identifying patient safety events, improves risk-adjustment methodologies used for quality measurement, and enhances the measurement of hospital case-mix. Effective October 1, 2007, the hospital Uniform Bill (UB), the standard used for data requirements for hospital claims, includes a POA indicator for each diagnosis field. This report provides an update to a 2006 HCUP report on POA that was developed to assist the National Uniform Billing Committee (NUBC) in its deliberations on whether to add POA to the UB. In this update, we review developments related to POA over the last five years, including the addition of the POA indicator to the UB and CMS requirements for reporting it. We also describe other implementations of the POA indicator and provide an updated review of literature related to POA.
A present-on-admission diagnosis is defined as a condition that is present when the order for inpatient admission occurs, including conditions that develop during an outpatient encounter (such as an emergency department visit or outpatient surgery) (NUBC, 2010). Initially, POA reporting requirements applied only to inpatient stays at general acute care hospitals or other facilities required by law or regulation to report the data. However, beginning January 2011, the UB usage requirement for POA reporting was expanded to include hospital stays as mutually agreed for contracts with insurance programs. Hospitals and other required facilities use the standardized set of requirements and definitions to report the POA indicator provided in the Official UB-04 Data Specifications Manual and the ICD-9-CM Official Guidelines for Coding and Reporting. Presently there are five standardized POA reporting values for diagnosis codes: present on admission - Y; not present on admission - N; insufficient information - U; clinically undetermined - W; and exempt from POA reporting – 1 or blank (dependent upon the claim format used for data submission). The Centers for Medicare and Medicaid Services (CMS) required Inpatient Prospective Payment System (IPPS) hospitals to submit POA information on inpatient claims for both principal and secondary diagnoses beginning October 1, 2007. CMS uses POA indicator data to deny higher payments associated with complications or comorbidities that result from ten specified hospital-acquired conditions (HACs) that occurred during a hospital stay as of October 1, 2008 (CMS, 2011a). In July 2011, CMS expanded non-payment to the Medicaid program beyond the inpatient setting to outpatient visits but allowed states flexibility in how to verify Provider-Preventable Conditions (PPCs), whether through use of existing POA systems or another method.1
States were the pioneers in collecting POA information, with New York and California requiring hospitals to report the POA indicator in hospital discharge data in the mid 1990s. Thirty-eight of 44 statewide data organizations that participate in the Healthcare Cost and Utilization Project (HCUP Partners) collected POA data on some or all of their hospitalization records as of 2009, with 26 reporting the data to HCUP. The Adding Clinical Data Pilot project, funded by the Agency for Healthcare Research and Quality (AHRQ), assisted the Minnesota Hospital Association and Virginia Health Information in their collection and evaluation of POA information together with added laboratory data for hospital quality measurement (Rosenthal et al., 2010).
1 Reference to POA and Coding Systems are stated on page 32824 of the Federal Register: Centers for Medicare and Medicaid Services (CMS, 2011c). 42 Federal Register. 76(108): 32816-32838. June 6, 2011. (Search for at: http://www.gpoaccess.gov/fr/.)

HCUP (11/01/2011) ii The Case for the POA Indicator: Update 2011
AHRQ also developed a web-based POA Indicator Toolkit2
that uses products developed during the Pilot Projects as well as other resources such as training materials, coding and transmission standards, sample feedback reports to hospitals, and materials useful to support the business case for collecting POA.
The importance of POA has prompted integration into software algorithms for hospital claims and discharge data as seen with the Medicare-Severity Diagnostic Related Groups (MS-DRGs) and the AHRQ Quality Indicators (QIs). CMS incorporated the POA indicator in the MS-DRG version 26 grouping software (effective October 1, 2008) to support the new reimbursement policy related to HACs. AHRQ’s Quality Indicator software has also begun to include POA indicator information in its algorithms for identifying certain patient safety events and for risk adjustment of inpatient mortality. Both products yield different results when data with and without POA are used. For example, version 26 of the MS-DRG software will not group data to the same Major Diagnostic Category (MDC) and MS-DRG as data that contain POA. The AHRQ QI software version 4.1 will also yield differing results when used with and without the POA indicator. One example using 2007 California data and 2008 Maryland data from the HCUP State Inpatient Databases showed that the results differed when analyzed with and without POA by more than 10% for two IQIs: IQI 11 - Mortality Rate for abdominal aortic aneurysm (AAA) Repair (California and Maryland) and for IQI 12 - Mortality Rate for coronary artery bypass graft (CABG) (MD). For all other IQIs, the percentage difference in the risk-adjusted rate with POA and without POA was small. This report also summarizes literature between 2006 and 2011 focused on the use of POA, organized into three conceptual areas: the value of the POA indicator in hospital quality measurement, the use of POA to assess potential hospital reimbursement policies, and issues and challenges of accurate POA coding. Studies continue to demonstrate that the POA indicator is essential for accurate assessments of hospital quality when these evaluations are based on administrative data. However, because administrative data are increasingly being used for public reporting on hospital quality, researchers caution that using measures of quality without a POA indicator could inappropriately affect comparisons of institutions and determinations of pay-for-performance. Many studies have used POA information to investigate potential savings realized by modifying reimbursement of hospital stays that involve complications and hospital-acquired conditions. Pre-screening strategies, diligent documentation and improved guidelines for combination diagnosis codes are factors that can influence the accuracy of POA coding. Sufficient clinical detail and accurate coding are paramount for use of claims and administrative data to measure quality and identify patient safety events using POA. The accuracy of POA coding is increasingly the focus of quality studies that use administrative data, recognizing that without accurate reporting, the benefits of including POA cannot be achieved. Efforts to improve the accuracy of POA coding is likely to continue to be a focal point over the near term for researchers, hospitals, payers, and statewide data organizations interested in POA collection and use.
2 The POA Toolkit is available on the HCUP-US website at: http://www.hcup-us.ahrq.gov/datainnovations/clinicaldata/poatoolkit.jsp.

HCUP (11/01/2011) 1 The Case for the POA Indicator: Update 2011
INTRODUCTION
For two decades health care researchers have argued that differentiating between medical conditions that are present on admission (i.e., comorbidities or pre-existing conditions) and those that first occur during the hospital stay (i.e., complications or in-hospital adverse events) are essential in hospital administrative data. Being able to distinguish conditions that were, or were not, present on admission in administrative data improves the ability to identify patient safety events, improves risk-adjustment methodologies used for quality measurement, and enhances the measurement of hospital case-mix.
In 2006, the National Uniform Billing Committee was deliberating whether to add a data element to the Uniform Bill (UB), the standard used for data requirements on hospital claims, to capture the present-on-admission information. In response to a request for more information on the value of POA data, the Healthcare Cost and Utilization Project (HCUP) developed a report presenting evidence from studies on the case for and against inclusion of POA information in hospital administrative data (Coffey et al., 2006). During this same time, CMS was also developing its approach to implementing requirements of the Deficit Reduction Act of 2005, which required Medicare to collect POA-like information on their inpatient claims. In this update to the 2006 HCUP report on POA, we review developments related to POA over the last five years, including the addition of the POA indicator to the UB and CMS’ requirements for reporting it. We also describe other implementations of the POA indicator and provide an updated review of the literature related to POA.
THE POA INDICATOR
Effective October 1, 2007, the UB includes a POA indicator for each diagnosis field. A present-on-admission diagnosis is that which is present when the order for inpatient admission occurs (NUBC, 2010). Initially (until 2011), the POA indicator applied only to inpatient stays at general acute care hospitals or other facilities required by law or regulation to report the data. This included all claims involving Medicare inpatient admissions to Inpatient Prospective Payment System (IPPS) general acute care hospitals or other facilities and for hospital stays in states which require the reporting of POA. Recently, the UB general reporting requirements for the POA indicator were modified to include programs that did not have a law or regulation under which to report this data. Beginning January 2011, the use requirement for POA indicator reporting was expanded to include hospital stays as mutually agreed for contracts with insurance programs. This broadened the potential reporting to health programs beyond Medicare.3
There is a standardized set of requirements and definitions for hospitals to use when reporting the POA indicator. The values, definitions and coding guidance for reporting the POA indicator are provided in the Official UB-04 Data Specifications Manual and the ICD-9-CM Official Guidelines for Coding and Reporting. The values have been revised since the initial addition of the POA indicator to the UB. As of July 2011, there are five standardized values and definitions for reporting the POA indicator for diagnosis codes: present on admission - Y; not present on admission - N; insufficient information - U; clinically undetermined - W; and exempt from POA reporting – 1 or blank (dependent upon the claim format used for data submission). Additional
3 For a history of the POA indicator prior to 2007, please see Coffey R, Milenkovic M, Andrews RM. The Case for the Present-on-Admission (POA) Indicator. HCUP Methods Series Report # 2006-01. Online. June 26, 2006. U.S. Agency for Healthcare Research and Quality. 2006. (Available at: http://www.hcup-us.ahrq.gov/reports/methods/2006_1.pdf.)

HCUP (11/01/2011) 2 The Case for the POA Indicator: Update 2011
coding and specifications are available from the CMS Website, the Official UB-04 Data Specifications Manual 2011, ASC X12 Website, and Appendix A of this report.4 According to UB-04 data specifications, “Health plans that receive POA information on the claim should not reject the claim if their claims processing systems have no use for any of the POA information.” 5
CMS REQUIREMENTS FOR POA REPORTING
With the goal of decreasing costs and preventing adverse events, CMS promulgated regulations beginning October 1, 2007 requiring IPPS hospitals6
Beginning April 1, 2008, claims submitted to CMS that do not contain proper reporting of the POA indicator are returned (CMS, 2010a). CMS requires a POA indicator for the principal and secondary diagnoses. The POA indicator is only required for the external cause of injury code if the injury is reported as an “other diagnosis.”
to submit POA information on inpatient claims for both principal and secondary diagnoses. Beginning October 1, 2008, CMS uses the POA indicator data to deny the higher payment associated with a major complication/comorbidity (MCC) or complication/comorbidity (CC) diagnosis-related group (DRG) that results from specified HACs that occurred during a hospital stay. The aim was to financially incentivize hospitals to prevent HACs from occurring in their facilities. Ten categories of “no pay” conditions are specified in the IPPS Fiscal Year 2009 Final Rule for which incremental payment will be denied if the conditions were not reported as being present when a patient was admitted to the hospital. These same HAC categories are maintained in the IPPS FY2012 Final Rule although five new diagnoses have been added to the respective HAC categories.
Recently, CMS expanded non-payment to the Medicaid program for Provider-Preventable Conditions (PPC), including Health Care-Acquired Conditions (HCAC) and Other Provider - Preventable Conditions (OPPC) extending beyond inpatient to the outpatient setting. The final rule, effective July 1, 2011, requires providers to self-report HCACs through existing claim systems and allows states flexibility with how to verify PPCs, whether through existing POA systems or another method.7
COLLECTION OF POA INFORMATION BY STATEWIDE DATA ORGANIZATIONS
States were the pioneers in collecting POA information. New York and California were early adopters of reporting the POA indicator in hospital discharge data, having started collection in the 1990s. As of 2009, the latest year for which HCUP data are available, 38 of 44 statewide
4 Centers for Medicare and Medicaid Services. (CMS, 2011b). Coding. 2011. (Accessed November 1, 2011 at: http://www.cms.gov/HospitalAcqCond/05_Coding.asp#TopOfPage.); National Uniform Billing Committee (NUBC, 2011). Official UB-04 Data Specifications Manual 2012. Chicago, IL, American Hospital Association, 2011. 188-193. 5 As stated on page 190 of the Official UB-04 Data Specifications Manual 2012 (NUBC, 2011). 6 Payment for the operating costs of acute care hospital inpatient stays under Medicare Part A (Hospital Insurance) are based on prospectively set rates. Under this inpatient prospective payment system (IPPS), each medical case is categorized into a diagnosis-related group (DRG) with a payment weight assigned to it, based on the average resources used to treat Medicare patients in that DRG. 7 Reference to POA and Coding Systems are stated on page 32824 of the Federal Register: Centers for Medicare and Medicaid Services (CMS, 2011c). 42 Federal Register. 76(108): 32816-32838. June 6, 2011. (Search for at: http://www.gpoaccess.gov/fr/.)
HCUP (11/01/2011) 3 The Case for the POA Indicator: Update 2011
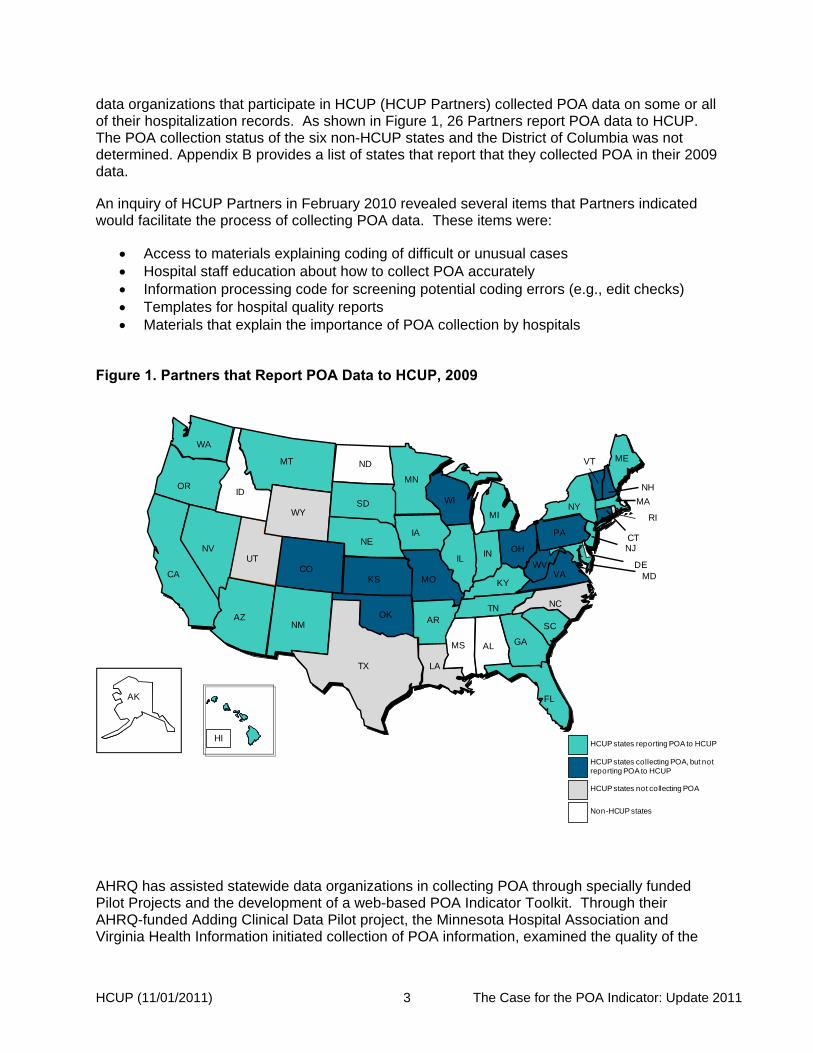
data organizations that participate in HCUP (HCUP Partners) collected POA data on some or all of their hospitalization records. As shown in Figure 1, 26 Partners report POA data to HCUP. The POA collection status of the six non-HCUP states and the District of Columbia was not determined. Appendix B provides a list of states that report that they collected POA in their 2009 data. An inquiry of HCUP Partners in February 2010 revealed several items that Partners indicated would facilitate the process of collecting POA data. These items were:
• Access to materials explaining coding of difficult or unusual cases • Hospital staff education about how to collect POA accurately • Information processing code for screening potential coding errors (e.g., edit checks) • Templates for hospital quality reports • Materials that explain the importance of POA collection by hospitals
Figure 1. Partners that Report POA Data to HCUP, 2009
HI
AKAK
AZ
CA
UT
CT
FL
GA
IA
IL
KS
MA
MDMO
NJ
NY
OR
PA
SC
TN
CO
WA
WI
VA
ME
MN
MI
NC
TX
KY
WV
RI
NE
VT
NV OH
SD
AR
IN
NH
MT
ID
WY
ND
NMOK
LA
MS AL
DE
HCUP states collecting POA, but not reporting POA to HCUP
HCUP states not collecting POA
Non-HCUP states
HCUP states reporting POA to HCUP
AHRQ has assisted statewide data organizations in collecting POA through specially funded Pilot Projects and the development of a web-based POA Indicator Toolkit. Through their AHRQ-funded Adding Clinical Data Pilot project, the Minnesota Hospital Association and Virginia Health Information initiated collection of POA information, examined the quality of the
HCUP (11/01/2011) 4 The Case for the POA Indicator: Update 2011
data submitted and used the information, in conjunction with added laboratory data, for hospital quality measurement (Rosenthal et al., 2010). AHRQ also developed a web-based POA Indicator Toolkit8
aimed at statewide data organizations that uses lessons learned and byproducts of the Minnesota and Virginia pilot projects as well as other resources. The POA Toolkit includes documents for making the business case for collecting POA, training materials, coding and transmission standards, and sample feedback reports to hospitals.
POA IMPLEMENTATION IN SOFTWARE Software for hospital claims and discharge data have begun to incorporate POA in algorithms to take advantage of this new information. Two examples are the Medicare-Severity Diagnostic Related Groups (MS-DRGs) and the AHRQ Quality Indicators (QIs). Obtaining the most accurate results from applying these software packages to administrative data requires accurate POA information. Starting with MS-DRG version 26 (effective October 1, 2008), CMS incorporated the POA indicator in the software to support the new reimbursement policy related to HACs. In addition to being a key component of Medicare reimbursement, MS-DRGs (and CMS DRGs before them) have been widely used for statistical reporting on hospital case mix using hospital claims and discharge data. Starting with the version 26 grouper, data sets without the POA indicator will not yield the same Major Diagnostic Category (MDC) and MS-DRGs as data that contain POA. Analysis of 2009 HCUP State Inpatient Databases indicates that about 2% of hospital records are “ungroupable” if POA is missing, compared to about 0.1% if it is present. Not having POA affects a relatively small percentage of discharges, but these discharges are related to inpatient stays that may have CMS-defined HACs. The AHRQ Quality Indicator software has also begun to include POA indicator information in its algorithms for identifying certain patient safety events and for risk adjustment of inpatient mortality. With version 4.1 of the AHRQ QIs, the software includes a sophisticated statistical approach for accounting for missing POA information9
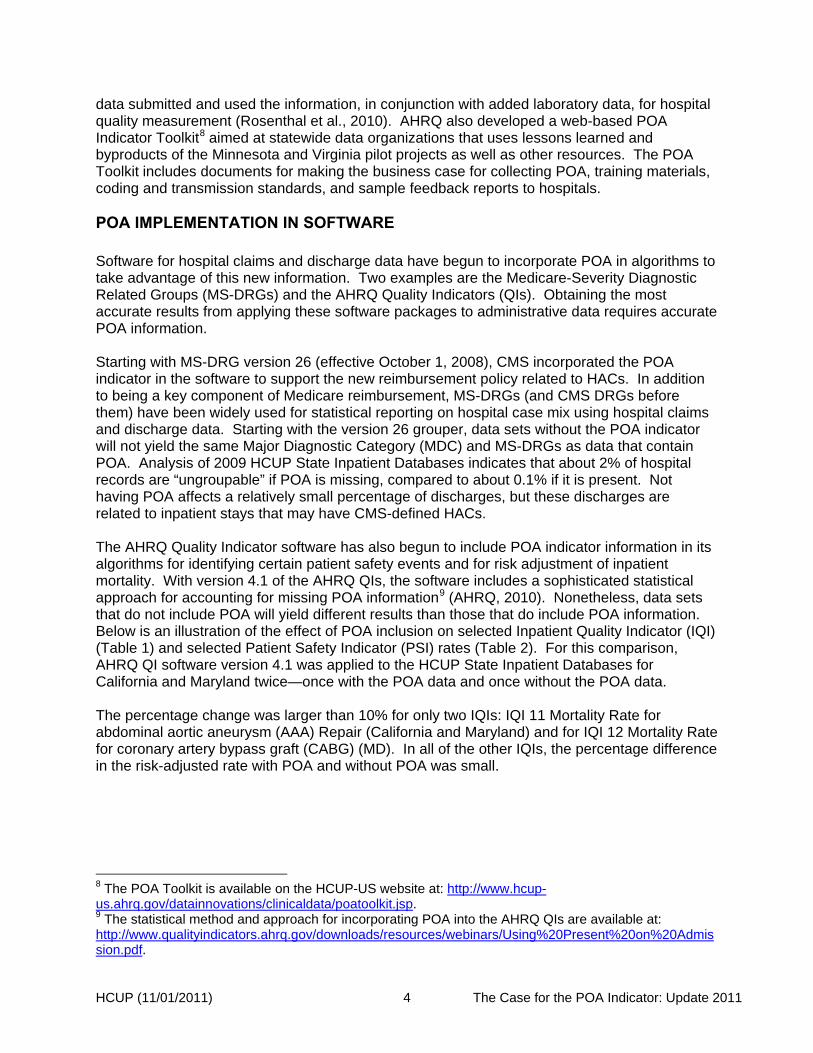
(AHRQ, 2010). Nonetheless, data sets that do not include POA will yield different results than those that do include POA information. Below is an illustration of the effect of POA inclusion on selected Inpatient Quality Indicator (IQI) (Table 1) and selected Patient Safety Indicator (PSI) rates (Table 2). For this comparison, AHRQ QI software version 4.1 was applied to the HCUP State Inpatient Databases for California and Maryland twice—once with the POA data and once without the POA data.
The percentage change was larger than 10% for only two IQIs: IQI 11 Mortality Rate for abdominal aortic aneurysm (AAA) Repair (California and Maryland) and for IQI 12 Mortality Rate for coronary artery bypass graft (CABG) (MD). In all of the other IQIs, the percentage difference in the risk-adjusted rate with POA and without POA was small.
8 The POA Toolkit is available on the HCUP-US website at: http://www.hcup-us.ahrq.gov/datainnovations/clinicaldata/poatoolkit.jsp. 9 The statistical method and approach for incorporating POA into the AHRQ QIs are available at: http://www.qualityindicators.ahrq.gov/downloads/resources/webinars/Using%20Present%20on%20Admission.pdf.

HCUP (11/01/2011) 5 The Case for the POA Indicator: Update 2011
Table 1. AHRQ Inpatient Quality Indicator Rates With and Without POA Indicator Data: California 2007 and Maryland 2008
IQI
2007 CA SID 2008 MD SID Risk Adj Rate
Risk Adj Rate
% Change
Risk Adj Rate
Risk Adj Rate
% Change
(W/ POA) (No POA)
(No POA v. POA)
(W/ POA) (No POA)
(No POA v. POA)
IQI 08 Esophageal Resection Mortality Rate 0.074458 0.070428 -5% 0.067436 0.062139 -8%
IQI 09 Pancreatic Resection Mortality Rate 0.049167 0.049809 1% 0.026816 0.025563 -5%
IQI 11 Abdominal Aortic Aneurysm Repair Mortality Rate 0.052195 0.059862 15% 0.034689 0.038457 11%
IQI 12 Coronary Artery Bypass Graft Mortality Rate 0.029376 0.028684 -2% 0.023422 0.020650 -12%
IQI 13 Craniotomy Mortality Rate 0.067629 0.067310 0% 0.039860 0.040909 3%
IQI 14 Hip Replacement Mortality Rate 0.001139 0.001127 -1% 0.001471 0.001416 -4%
IQI 15 Acute Myocardial Infarction Mortality Rate 0.074723 0.075595 1% 0.052285 0.052358 0%
IQI 16 Congestive Heart Failure Mortality Rate 0.035324 0.035995 2% 0.022015 0.023281 6%
IQI 17 Acute Stroke Mortality Rate 0.102445 0.101766 -1% 0.068757 0.069592 1%
IQI 18 Gastrointestinal Hemorrhage Mortality Rate 0.026204 0.026381 1% 0.017073 0.018096 6%
IQI 19 Hip Fracture Mortality Rate 0.028840 0.027958 -3% 0.022272 0.022718 2%
IQI 20 Pneumonia Mortality Rate 0.046705 0.047262 1% 0.027500 0.028463 4%
IQI 30 Percutaneous Transluminal Coronary Angioplasty Mortality Rate 0.016931 0.016738 -1% 0.013035 0.012878 -1%
IQI 31 Carotid Endarterectomy Mortality Rate 0.004302 0.004343 1% 0.007363 0.007505 2%
IQI 32 Acute Myocardial Infarction Mortality Rate (Without Transfers) 0.080642 0.081367 1% 0.054278 0.054752 1%
Table 2 shows that, on average, the risk-adjusted PSI rate without POA increased by 150% in CA and 200% in MD, but this varied greatly by individual indicator. For example, using California data the PSIs for pressure ulcer and for post-operative hip fracture were about 5 times (500%) higher without POA data than with POA data.
HCUP (11/01/2011) 6 The Case for the POA Indicator: Update 2011
Table 2. AHRQ Patient Safety Indicator Rates With and Without POA Indicator Data: California 2007 and Maryland 2008
PSI
2007 CA SID 2008 MD SID Risk Adj Rate
Risk Adj Rate
% Change
Risk Adj Rate
Risk Adj Rate
% Change
(W/ POA) (No POA)
(No POA v. POA)
(W/ POA) (No POA)
(No POA v. POA)
PSI 03 Pressure Ulcer 0.006034 0.038975 546% 0.00593 0.039967 574%
PSI 06 Iatrogenic Pneumothorax 0.000664 0.00091 37% 0.000699 0.000937 34%
PSI 07 CVC Bloodstream Infections 0.001783 0.002566 44% 0.000857 0.001317 54%
PSI 08 Postoperative Hip Fracture 0.000039 0.000237 507% 0.000034 0.00034 893%
PSI 09 Postoperative Hemorrhage or Hematoma 0.002399 0.002853 19% 0.00301 0.003751 25%
PSI 10
Postoperative Physiologic/Metabolic Derangement 0.000664 0.001913 188% 0.000379 0.001623 328%
PSI 11 Postoperative Respiratory Failure 0.010876 0.011874 9% 0.013612 0.014623 7%
PSI 12 Postoperative Pulmonary Embolism or DVT 0.00613 0.012881 110% 0.007858 0.016223 106%
PSI 13 Postoperative Sepsis 0.010091 0.012732 26% 0.022506 0.026429 17%
PSI 15 Accidental Puncture or Laceration 0.003268 0.003797 16% 0.00311 0.003866 24%
LITERATURE SUMMARY: 2006 THROUGH 2011
In this literature review, we present the summaries organized by topic area:
1) The value of the POA indicator in hospital quality measurement
2) Use of POA to assess potential hospital reimbursement policies
3) Issues and challenges of accurate POA coding
Information was gathered on the Internet through targeted searches using Google, the U.S. National Library of Medicine’s PubMed, and Harzing’s Publish or Perish software© (2010). The Websites of CMS, NUBC, the American Health Information Management Association (AHIMA), Centers for Disease Control and Prevention (CDC), and American Hospital Association (AHA) were reviewed for the most current guidance on POA coding requirements. The literature review examines the value of using the POA indicator, the financial and quality implications of including POA information in administrative data, and issues surrounding POA coding accuracy.

HCUP (11/01/2011) 7 The Case for the POA Indicator: Update 2011
Where feasible, searches were limited to the time period between June 2006 and July 2011.10
The Value of POA in Hospital Quality Measurement
Bibliographies in retrieved journal articles were also used to identify supplementary related literature and AHRQ staff provided additional leads about studies or articles of interest.
Studies continue to demonstrate that the POA indicator is essential for accurate assessments of hospital quality when assessments are based on administrative data. Because administrative data are increasingly being used for public reporting on hospital quality, authors caution that using measures of quality without a POA indicator could inappropriately affect comparisons of institutions and determinations of pay-for-performance.
• Analyses by Casey and colleagues (2011) evaluated POA coding for hospitalizations in 167 University HealthSystem Consortium hospitals and found that 70% of patients with sepsis/septicemia (S-S), 86% of patients with methicillin-resistant Staphylococcus aureus (MRSA), and 67% of patients with Clostridium difficile infection (CDI) had these conditions coded as POA. The study demonstrated high relative proportions of hospital admissions during 2009 for three serious conditions coded as POA. Results by payor group have shown that Medicare patients had a larger proportion of S-S and CDI admissions and statistically significant difference with MRSA admissions than was observed in the non-Medicare admissions (P < .001). The authors stressed the importance to better understand factors associated with these conditions given the enormous adverse impact on patient outcomes and the cost of health care and recommend that all health care organizations and providers work more closely to identify early and prevent such serious infections.
• Fry and colleagues (2006) demonstrated how valid risk-adjustment can be achieved by
enhancing administrative data with a present-on-admission code, admission laboratory data, and admission vital signs. Risk-adjustment models were presented for inpatient mortality rates following craniotomy and rates of postoperative sepsis after elective surgical procedures. Administrative claims data alone yielded a risk-adjustment model with 10 variables and a C-statistic of 0.891 for mortality after craniotomy, and a model with 18 variables and a C-statistic of 0.827 for postoperative sepsis. In contrast, the combination of administrative data and clinical data abstracted from medical records increased the number of variables in the craniotomy model to 21 with a C-statistic of 0.923, and the number of variables in the postoperative sepsis model to 29 with a C-statistic of 0.858. The authors have shown that present-on-admission coding combined with readily available laboratory data and vital signs can support accurate risk-adjustment for the assessment of surgical outcomes.
• In an analysis of various models of risk stratification for post-surgical complications and
mortality after selected operations, Fry and colleagues (2007) showed that including the POA indicator plus readily-available numerical laboratory data was associated with substantial improvements in all analytic measures of physiologic/metabolic derangement, respiratory failure, pulmonary embolism/deep vein thrombosis, and sepsis. Adding other difficult-to-obtain key clinical findings resulted in only small
10 For the literature prior to June 2006, please see Coffey R, Milenkovic M, Andrews RM. The Case for the Present-on-Admission (POA) Indicator. HCUP Methods Series Report # 2006-01. Online. June 26, 2006. U.S. Agency for Healthcare Research and Quality. 2006. (Available at: http://www.hcup-us.ahrq.gov/reports/methods/2006_1.pdf.)

HCUP (11/01/2011) 8 The Case for the POA Indicator: Update 2011
improvements in predictions of mortality.
• Using 2008 data from California’s acute care hospitals, Halpin and colleagues (2011) conducted a baseline study before hospital-acquired infection rates were required for reporting to the state. California's baseline data present a unique opportunity to assess the impact of mandatory and public reporting laws. The authors suggest that one way to motivate hospitals to improve patient safety is to publicly report their rates of hospital-acquired infections, as California is starting to do this year. Findings from the study reveal variability in many areas such as with methicillin-resistant Staphylococcus aureus (MRSA) where 70.1% of hospitals said that they were fully implementing evidence-based guidelines to fight infection by MRSA, but 22.8% of hospitals had not adopted any. The study findings should be of interest to Medicare policy makers who will implement the hospital-acquired infection performance measures in the Affordable Care Act, and to leaders in the thirty-eight states that have enacted legislation requiring reports of hospital-acquired infection rates.
• Mark and colleagues analyzed California data from 1996 to 2001 using the POA indicator for six post-surgical complications: pneumonia, septicemia, urinary tract infections, thrombophlebitis, fluid overload, and decubitus ulcers. The authors found no statistically significant relationship between nurse staffing and complications that arise during the hospital stay. The authors explained the results by suggesting that the availability of more registered nurses on staff may have led to earlier detection and prompt treatment of complications, rather than a reduction in complications. Medicare payment rules are likely to increase the demand for RNs to document patients’ clinical status on admission, and further studies of how nurse staffing levels have an impact on patient safety may be a critical area for research.
• In their analysis of nearly 61,000 discharges from the Mayo Clinic in Rochester, Naessens and colleagues (2007) found that 27% of discharges identified by PSI software were flagged as already present on admission. The results demonstrate that comparisons of patient safety among hospitals using administrative data should be made cautiously; for example, incentive programs based on these measures would be biased against institutions that admit patients who were poorly treated by other providers if POA conditions were not indicated.
• Stukenborg and colleagues (2007) replicated methods originally used by California in a comparison of hospital mortality rates for patients with acute myocardial infarction, then contrasted these with results obtained for the same hospitals by patient-level mortality risk-adjustment models using POA diagnoses. Models using POA diagnoses yielded significantly better discrimination between predicted survival and inpatient death than those that did not include the POA variable. Models with better statistical performance identified different hospitals as having better or worse than expected mortality than did those models that did not use POA variables.
• Bahl and colleagues (2008) evaluated the impact of POA values on AHRQ PSI rates for 35,000 adult discharges from the University of Michigan Health System in 2006. Of the 13 PSIs identified, rates for all but one were lower when POA values were used. The reduction in rates for five PSIs was statistically significant: decubitus ulcer, foreign body left in patient, selected infections due to medical care, post-operative physiologic and
HCUP (11/01/2011) 9 The Case for the POA Indicator: Update 2011
metabolic derangement, and post-operative pulmonary embolism or deep vein thrombosis.
• Analyses by Glance and colleagues (2008a) also found significant differences in risk-adjusted rates of adverse events for some of the AHRQ PSIs depending on whether the POA indicator was used. The positive predictive value of selected AHRQ PSIs applied to discharges was calculated for coronary artery bypass graft surgery in the 1998-2000 California State Inpatient Database (SID) (which includes POA codes), and the intra-class agreement (correlation coefficients) between hospital risk-adjusted PSI rates with and without the POA modifier was assessed. The authors found a false positive rate of 20% or greater for four PSIs when POA indicators were not used: decubitus ulcer, failure to rescue, post-operative physiologic and metabolic derangement, and post-operative pulmonary embolism or deep vein thrombosis.
• A study by Glance’s group (2008b) confirmed that inclusion of the POA indicator can change the quality ranking of hospitals classified as high-quality or low-quality using routine administrative data. These researchers evaluated the impact of the POA indicator on assessments of hospital quality that are based on AHRQ IQI mortality measures. Again using California SID data, they calculated risk-adjusted hospital mortality rates using either routine administrative data that included all ICD-9-CM diagnosis codes, or enhanced administrative data that included secondary diagnoses identified as present on admission by a POA indicator. Of the hospitals that had been classified as high-quality using routine administrative data, 28 to 94% were re-classified as intermediate- or low-quality for specific conditions when POA-enhanced administrative data were used. In addition, 25 to 76% of hospitals classified as low-quality using POA-enhanced administrative data were misclassified as intermediate-quality if only routine administrative data were used.
• Using data from the 2003 California and New York HCUP SID (both including POA indicators), Houchens and colleagues (2008) found that the validity of several PSIs was severely compromised in the absence of POA information. After excluding suspect records, nearly 93% of secondary diagnoses in both states were POA. Importantly, when POA information was incorporated, most cases of decubitus ulcer, post-operative hip fractures, and post-operative deep vein thrombosis or pulmonary embolism were no longer considered in-hospital patient safety events.
• Kim and colleagues (2010) showed that rates of post-surgical adverse events can be overstated when they are estimated using AHRQ PSI methodology without POA indicators. The study assessed rates of four PSIs – decubitus ulcer, infections due to medical care, postoperative respiratory failure, and postoperative pulmonary embolism or deep vein thrombosis – with and without adjustment for POA conditions among patients 65 and older in California acute care hospitals in 2004. After adjusting for POA conditions, the rates of these adverse events that occurred during the hospital stay decreased. The authors also found that patients admitted through the emergency department with chronic conditions were more likely to result in adverse events, regardless of adjustment for POA conditions.
• Moriarty and colleagues (2010) found that rates of the AHRQ failure to rescue (FTR) PSIs were biased when patients with problems at admission or pre-existing conditions
HCUP (11/01/2011) 10 The Case for the POA Indicator: Update 2011
were included in the calculations. They stress the importance of taking into account the timing of complications, whether they were pre-existing upon hospitals admission or not, and coding practices of institutions that can affect the use of quality measures. They also found substantial misidentification of patients with serious treatable complications, and significant differences in FTR rates between pre-existing versus hospital-acquired cases for AHRQ and National Quality Forum measures.
Use of POA to Assess Potential Hospital Reimbursement Policies Researchers have used POA information to investigate potential savings from different ways of modifying reimbursement of hospital stays that involve complications and hospital-acquired conditions.
• Zhan and colleagues (2007) used data from the 2003 California and New York HCUP SID to estimate the savings to Medicare of incorporating POA coding into the DRG-Prospective Payment System. Results suggested that Medicare could have realized considerable savings in 2003 had CMS paid claims based solely on diagnoses that were POA.
• Fuller and colleagues (2009) used Potentially Preventable Complication (PPC) methodology in an analysis of Maryland and California hospital data to estimate the incremental costs of various HACs and predict the associated total per patient cost burden. PPCs at the patient-level result in a substantial cost burden for many routinely-observed complications such as urinary tract infections and catheter-related blood stream infections. However, the authors contend that because of the current scope of the CMS definition of HACs, the non-payment policy may have a minimal impact on payments. These researchers suggest that robust incremental cost estimates for complications obtained by treating HACs as additive, categorical events, could be viable alternative methods for designing payment systems that would provide greater incentives to significantly reduce hospital complications.
• According to Brown and colleagues (2009), CMS non-payment rules may not be based on reasonably-achievable goals. For example, the authors predict that hospitals may begin to aggressively treat even inconsequential infections as they strive to eliminate all surgically-related infections – a goal that may not be attainable (Harbath et al., 2003; Laupland et al., 2006; Hawn et al., 2008). Although Medicare costs may be reduced, the lack of positive financial incentives may not promote cost-effective hospital care in the long term. The authors discuss the potential for Medicare databases to become less reliable if hospitals opt to report fewer complicated conditions and procedures. They expressed concerns that a trend of coding in-hospital complications as POA would lead to systematic underestimation of HACs.
• McNutt and colleagues (2010) estimated the potential reductions in CMS payments for each of the targeted HACs across 86 academic centers. The proportion of DRG assignments that would change and consequent payment differences were calculated based on scenarios in which the HAC was removed from the DRG calculation. The payment reductions based on POA status were also calculated. These researchers concluded that removing HACs from Medicare Severity-DRG assignment would result in significant cost savings for CMS through reduced payments to hospitals.
HCUP (11/01/2011) 11 The Case for the POA Indicator: Update 2011
• Using statewide data from New York, Saleh and colleagues (2010) calculated the cost impact of HACs identified through the presence of a POA indicator, and found that hospitals could experience cost savings by decreasing HACs. Discharges that included critical care stay cases were stratified by DRGs and categorized into cases with HACs, cases with POA comorbidities, and cases with no HACs or POA comorbidities. Among 22 DRGs examined, sepsis was the most common among single occurrence HACs as well as when two or more HACs occurred, and unsurprisingly, total costs and lengths of stay were consistently highest among discharges where a HAC occurred. The lowest level of resource use was associated with discharges where no complication occurred.
Issues and Challenges of Accurate POA Coding Pre-screening strategies, diligent documentation and improved guidelines for combination diagnosis codes are several factors that can influence the accuracy of POA coding. Sufficient clinical detail and accurate coding are paramount for use of claims and administrative data to measure quality and identify patient safety events using POA. Several authors have considered the issues surrounding accurate collection of POA.
• Goldman and colleagues (2011) studied the reliability of POA coding in 48 California acute care hospital during 2005 for three common and high mortality principal diagnoses and one principal procedure: acute myocardial infarction, community-acquired pneumonia, congestive heart failure, and percutaneous transluminal coronary angioplasty.11
• According to Armstrong and colleagues (2008), the Medicare payment provision to reject higher payment for State III or IV pressure ulcers through the use of the POA Indicator, require improved physician or provider determination and documentation. The authors stress the need for practice changes and education of the provider to do an accurate skin assessment. Identifying pre-existing wounds at the POA skin assessment represent a special challenge, since a deep tissue injury that occurred prior to admission might not be visible until a few days after admission. Several ideas and tools are suggested to assist providers in staging pressure ulcers including the use of new imaging techniques and thermographic cameras.
For each condition, the authors identified two highly influential mortality risk factors to randomly select medical records for chart review and blind reabstraction, focusing on acute care conditions that could either be comorbidities or complications of care to include more challenging cases. The POA coding reported in the discharge data agreed with the "gold standard" 74% of the time. The study found that the hospital’s coding of conditions present on admission tended to be more accurate for chronic conditions than for acute conditions and when capturing conditions that were clearly present on admission; but more variable in accuracy for conditions that were not evident as present on admission. No evidence was found of systematic undercoding of POA – there's was about an equal percentage of under- and over-coding of POA across the hospitals.
11 This study has been summarized in Goldman LE, Chu PW, Osmond D, Bindman A. The Accuracy of Present-on-Admission Reporting in Administrative Data. Health Services Research. Epub August 11, 2011. It can be accessed at: http://onlinelibrary.wiley.com/doi/10.1111/j.1475-6773.2011.01300.x/full.

HCUP (11/01/2011) 12 The Case for the POA Indicator: Update 2011
• Rangachari (2007) analyzed the occurrence of the value "uncertain"12
in the POA indicator field in New York state hospital discharge data for 2000 through 2004. Large, teaching, urban facilities located in regions around New York City consistently performed worse (had a higher number of “uncertain” codes) than small, rural, non-teaching facilities located in upstate New York. The authors suggest that tracking this as a measure of coding accuracy could also serve as an indicator of physician documentation efficacy.
• A study of two claims-based approaches to identify hospital-acquired venous thromboembolism (VTE) compared to clinically confirmed VTE events (confirmed by detailed chart review) by Leibson and colleagues (2008) showed that POA indicators provide high positive predictive value (PPV) relative to ICD-9-CM codes for VTE, but the overall number of hospital-acquired VTE events was underestimated by using POA indicators (low sensitivity). Although VTE is a relatively infrequent complication, the authors note that measures that miss hospital-acquired events could decrease the efficiency with which potential problems can be tracked.
• Ullman (2010) noted the importance of thorough evaluation and documentation of pre-existing conditions by hospitalists, beginning when a patient is admitted to the hospital, to help ensure that payments for comorbidities are received. Some conditions may necessitate hospitals to instill policies requiring additional tests upon admission, such as a urinalysis for patients admitted with a Foley catheter in place. Inattention to documentation at the time of inpatient admission could lead to hospitals losing payment if they do not record a condition as POA. A delicate balance exists between the extent of testing at the time of admission to capture all conditions POA versus inadequate testing that could lower accurate reimbursement for treatment must be determined by the attending physician.
• Pine and colleagues (2009a) developed 12 screens to test the accuracy of POA coding in New York State hospitals using claims data for 2003, 2004, and 2005. The screens were applied to secondary diagnoses for high-risk admissions, elective surgical admissions, and inpatient childbirth admissions, and the diagnoses were designated as present on admission, hospital-acquired, or unknown. Examples of screens applied to secondary diagnosis codes include those for chronic conditions (e.g., osteoporosis), conditions that are often hospital-acquired in high-risk admissions (e.g., transfusion reaction), and codes for obstetrical conditions that are almost always present on admission (e.g., multiple gestation). The authors assigned weighted scores (1 to 10) to 204 of the hospitals for each of the 12 screens and calculated a composite score for each hospital. The aggregate scores ranged from above 90 (39% of hospitals), down to 60 or lower (8% of hospitals). The distribution of scores indicated variation in coding practices and in the reliability of POA coding among hospitals. Inaccurate POA coding, the authors suggested, can skew analyses of risk-adjusted outcomes and hospital reimbursement designations.
12 Note that “uncertain” is not a designated POA indicator reporting option in the NUBC Official UB-04 Specifications Manual (NUBC, 2011). There are, however, codes for diagnoses that are “uncertain” (those without sufficient documentation to determine if the condition was present upon admission), and “clinically undetermined” (those that the provider cannot determine if they were present at the time of admission).
HCUP (11/01/2011) 13 The Case for the POA Indicator: Update 2011
• A study by the Office of Inspector General (OIG) (2010) revealed problems with the accuracy of POA coding as a result of missing documentation to support assignment of the diagnosis code for billing data. The study used five different screening methods to identify adverse events for a random sample of 278 Medicare hospitalizations that occurred during 2008 (including the examination of the POA indicator and nurse reviews of clinical information), followed by physician chart review to evaluate the frequency and accuracy of these events. The OIG found that the POA indicators in the billing data flagged the highest number of events, but a large portion of these events were considered not harmful to the patient or had resulted from a natural occurrence of disease. Many of these events were temporary results that typically occurred in caring for complicated conditions (e.g., anemia because of acute blood loss, potassium deficiency, and acute renal failure). Some were not documented in the medical record, a critical source of information for hospital billing data. The OIG’s study also revealed potential limitations of using diagnosis and POA indicators to identify HACs, including that POA indicators flagged only 4 of 11 identified HACs. Of the seven unidentified HACS, five were not listed as a reported diagnosis and therefore had no POA indicator, and two used a more generic diagnosis code not specific enough to apply the HAC definitions. Such underreporting did not affect Medicare reimbursement, but the OIG concluded that absence of this information inhibits quality of care monitoring.
• In a commentary on the addition of POA to the standard hospital claims record, Iezzoni (2007) speculated that implementation of accurate coding of secondary diagnoses may not reap the intended benefits for quality measurement because of its linkage to Medicare reimbursement. The author suggests extensive training and oversight in POA coding for hospital staff to ensure accurate coding and a re-evaluation of the balance between the need for quality of care reporting and incentives created by Medicare reimbursement policies. More importantly, Iezzoni noted the ability of reimbursement changes to shift coding practices, reinforcing the importance of reimbursement policies that do not penalize hospitals which treat more severe patients with higher-risk conditions and comorbidities.
• The lack of sufficient secondary diagnosis fields on reporting forms may lead to underreporting of secondary diagnoses that represent complications not present on admission. Naessens (2008) noted that the Mayo Clinic reports stage III and IV pressure ulcers acquired after admission in compliance with the Minnesota mandate to report the National Quality Forum list of serious adverse events, in addition to reporting “unstageable” pressure ulcers (i.e., those for which a stage cannot be determined). Of the last 16 reported patients with a pressure ulcer, only 25% were recorded with an ICD-9-CM pressure ulcer secondary diagnosis code. The Mayo Clinic’s administrative system allows for a maximum of 15 recorded diagnoses, and because patients who develop pressure ulcers often have multiple morbidities and longer lengths of stay, there may have been more than 15 diagnoses during the hospitalization. As a result, the coder may not have placed the pressure ulcer diagnosis high enough on the diagnoses list for it to be captured in the hospital’s administrative system, causing incomplete reporting of conditions that were not present-on-admission.
• Pine and colleagues (2009b) showed that modifying ICD-9-CM coding of secondary diagnoses to more completely describe patients’ clinical conditions improved risk adjustment of inpatient mortality rates. The authors analyzed risk-adjusted mortality rates for acute myocardial infarction (AMI), congestive heart failure (CHF), acute cerebrovascular accident (CVA), gastrointestinal (GI) hemorrhage, and pneumonia, as

HCUP (11/01/2011) 14 The Case for the POA Indicator: Update 2011
well as the procedures of abdominal aortic aneurysm (AAA) repair, coronary artery bypass graft surgery (CABG), and craniotomy. The use of a few underreported ICD-9-CM secondary diagnosis codes plus numerical laboratory results were cost-effective additions to administrative data and led to increased coding accuracy. The authors discussed the prognostic implications of abnormal clinical findings, noting that physician documentation of these inpatient records would improve the validity of risk-adjusted hospital mortality rates. A modification to ICD-9-CM coding and reporting guidelines to allow coding of the signs and symptoms of disease processes when they are POA was recommended.
• Comprehensive physician documentation of clinical findings is essential to optimal diagnostic coding. Ballentine (2009) outlined strategies for clinicians to learn and utilize specific terminology to improve clarity and accuracy in patient chart documentation, which would allow coders to easily extract necessary information from medical records. Specific strategies were suggested for institutions to support physician and coder training and education.
CONCLUSIONS Beginning in October 2007, the UB includes a POA indicator for each diagnosis field on the hospital claim. Since its addition to the UB, POA has been used by CMS in determining reimbursement for hospitalizations involving specific healthcare-acquired conditions, collected by an increasing number of statewide data organizations in the hospital administrative data on some or all patients in their state, and incorporated into case-mix and quality measurement software such as MS-DRGs and AHRQ Quality Indicators. Research continues to show the value of POA for more accurately measuring quality and has increasingly focused on examining its potential role in hospital reimbursement approaches. Studies have also begun to focus on issues related to the accuracy of POA coding in administrative data, recognizing that without accurate reporting, the benefits of including the POA indicator cannot be achieved. Efforts to improve the accuracy of POA coding is likely to be a focal point over the near term for researchers, hospitals, payers, and statewide data organizations interested in POA collection and use.
HCUP (11/01/2011) 15 The Case for the POA Indicator: Update 2011
ACKNOWLEDGEMENTS
Agency for Healthcare Research and Quality (AHRQ) gratefully acknowledges the experts who have provided valuable input to this report, particularly Katharine Levit and Jared Maeda from Thomson Reuters. About HCUP The Healthcare Cost and Utilization Project (HCUP) is a family of health care databases and related software tools and products developed through a Federal-State-Industry partnership and sponsored by the Agency for Healthcare Research and Quality (AHRQ). HCUP databases bring together the data collection efforts of state data organizations, hospital associations, private data organizations, and the Federal government to create a national information resource of encounter-level health care data. HCUP includes the largest collection of longitudinal hospital care data in the United States, with all-payer, encounter-level information beginning in 1988. These databases enable research on a broad range of health policy issues, including cost and quality of health services, medical practice patterns, access to health care programs, and outcomes of treatments at the national, state, and local market levels. HCUP would not be possible without the contributions of the following data collection Partners from across the United States: Alaska State Hospital & Nursing Association Arizona Department of Health Services Arkansas Department of Health California Office of Statewide Health Planning and Development Colorado Hospital Association Connecticut Hospital Association Florida Agency for Health Care Administration Georgia Hospital Association Hawaii Health Information Corporation Illinois Department of Public Health Indiana Hospital Association Iowa Hospital Association Kansas Hospital Association Kentucky Cabinet for Health and Family Services Louisiana Department of Health and Hospitals Maine Health Data Organization Maryland Health Services Cost Review Commission Massachusetts Division of Health Care Finance and Policy Michigan Health & Hospital Association Minnesota Hospital Association Missouri Hospital Industry Data Institute Montana MHA — An Association of Montana Health Care Providers Nebraska Hospital Association Nevada Department of Health and Human Services New Hampshire Department of Health & Human Services New Jersey Department of Health and Senior Services New Mexico Health Policy Commission New York State Department of Health North Carolina Department of Health and Human Services

HCUP (11/01/2011) 16 The Case for the POA Indicator: Update 2011
Ohio Hospital Association Oklahoma State Department of Health Oregon Association of Hospitals and Health Systems Pennsylvania Health Care Cost Containment Council Rhode Island Department of Health South Carolina State Budget & Control Board South Dakota Association of Healthcare Organizations Tennessee Hospital Association Texas Department of State Health Services Utah Department of Health Vermont Association of Hospitals and Health Systems Virginia Health Information Washington State Department of Health West Virginia Health Care Authority Wisconsin Department of Health Services Wyoming Hospital Association
HCUP (11/01/2011) 17 The Case for the POA Indicator: Update 2011
REFERENCES
Agency for Healthcare Research and Quality (AHRQ, 2010). AHRQ Quality Indicators: Estimating Risk-Adjustment Models Incorporating Data on Present on Admission. April 14, 2010. (Accessed November 1, 2011 at: http://www.qualityindicators.ahrq.gov/downloads/resources/webinars/Using%20Present%20on%20Admission.pdf.)
Armstrong DG, Ayello EA, Capitulo KL, Fowler E, Krasner DL, Levine JM, Sibbald RG, Smith AP. New opportunities to improve pressure ulcer prevention and treatment: implications of the CMS inpatient hospital care present on admission indicators/hospital-acquired conditions policy: a consensus paper from the International Expert Wound Care Advisory Panel. Advances in Skin & Wound Care. 2008; 21(10): 469-478.
Bahl V, Thompson MA, Kau TY, Hu HM, Campbell DA, Jr. Do the AHRQ patient safety indicators flag conditions that are present at the time of hospital admission? Medical Care. 2008; 46(5): 516-522.
Ballentine NH. Coding and documentation: Medicare severity diagnosis-related groups and present-on-admission documentation. Journal of Hospital Medicine. 2009; 4(2): 124-130.
Brown J, Doloresco F, Mylotte JM. "Never events": not every hospital-acquired infection is preventable. Clinical Infectious Diseases. 2009; 49(5): 743-746.
Casey DE, Chang K, Bustami R. Evaluation of Hospitalization for Infections That Are Present on Admission. American Journal of Medical Quality. 2011.
Centers for Medicare and Medicaid Services (CMS, 2010a). Reporting. December 3, 2010. (Accessed December 14, 2010 at: http://www.cms.gov/HospitalAcqCond/04_Reporting.asp#TopOfPage.)
Centers for Medicare and Medicaid Services (CMS, 2010b). ICD-9-CM Official Guidelines for Coding and Reporting. 2010. (Available at http://www.cdc.gov/nchs/data/icd9/icdguide10.pdf.)
Centers for Medicare and Medicaid Services (CMS, 2010c). Present on Admission (POA) Indicator Reporting by Acute Inpatient Prospective Payment System (IPPS) Hospitals. Medicare Learning Network. 2010. (Accessed February 10, 2011 at: http://www.cms.gov/MLNProducts/downloads/wPOAFactSheet.pdf.)
Centers for Medicare and Medicaid Services (CMS, 2010d). Version 5010 Implementation—Changes to Present on Admission (POA) Indicator ‘1’ and the K3. Medicare Learning Network. 2010. (Accessed August 18, 2011 at: http://www.cms.gov/MLNMattersArticles/downloads/MM7024.pdf.)
Centers for Medicare and Medicaid Services (CMS, 2011a). Hospital-Acquired Conditions. 2011. (Accessed November 1, 2011 at: https://www.cms.gov/HospitalAcqCond/06_Hospital-Acquired_Conditions.asp#TopOfPage.)

HCUP (11/01/2011) 18 The Case for the POA Indicator: Update 2011
Centers for Medicare and Medicaid Services. (CMS, 2011b). Coding. 2011. (Accessed November 1, 2011 at: http://www.cms.gov/HospitalAcqCond/05_Coding.asp#TopOfPage.)
Centers for Medicare and Medicaid Services (CMS, 2011c). 42 Federal Register. 76(108): 32816-32838. June 6, 2011. (Search for at: http://www.gpoaccess.gov/fr/.)
Centers for Medicare and Medicaid Services (CMS, 2011d). Electronic Billing and EDI Transactions. 5010 D.O. 2011. (Accessed August 18, 2011 at: http://www.cms.gov/ElectronicBillingEDITrans/18_5010D0.asp.)
Coffey R, Milenkovic M, Andrews RM. The Case for the Present-on-Admission (POA) Indicator. HCUP Methods Series Report # 2006-01. Online. June 26, 2006. U.S. Agency for Healthcare Research and Quality. 2006. (Available at: http://www.hcup-us.ahrq.gov/reports/methods/2006_1.pdf.)
Fry DE, Pine M, Jordan HS, Elixhauser A, Hoaglin DC, Jones B, Warner D, Meimban R. Combining administrative and clinical data to stratify surgical risk. Annals of Surgery. 2007; 246(5): 875-885.
Fry DE, Pine MB, Jordan HS, Hoaglin DC, Jones B, Meimban R. The hazards of using administrative data to measure surgical quality. Am Surg. 2006; 72(11): 1031-1037; discussion 1061-1039, 1133-1048.
Fuller RL, McCullough EC, Bao MZ, Averill RF. Estimating the costs of potentially preventable hospital acquired complications. Health Care Financing Review. 2009; 30(4): 17-32.
Glance LG, Li Y, Osler TM, Mukamel DB, Dick AW (2008a). Impact of date stamping on patient safety measurement in patients undergoing CABG: experience with the AHRQ Patient Safety Indicators. BMC Health Services Research. 2008; 8: 176.
Glance LG, Osler TM, Mukamel DB, Dick AW (2008b). Impact of the present-on-admission indicator on hospital quality measurement: experience with the Agency for Healthcare Research and Quality (AHRQ) Inpatient Quality Indicators. Medical Care. 2008; 46(2): 112-119.
Goldman L, Chu P, Prothro C, Osmond D, Bindman A. Accuracy of Condition Present on Admission, Do not Resuscitate, and E-Codes in California Patient Discharge Data. Office of Statewide Health Planning and Development, Healthcare Outcomes Center. 2011. (Accessed July 28, 2011 at: http://www.oshpd.ca.gov/HID/Products/PatDischargeData/ResearchReports/PDDValidation/PDD_Validation_Study.pdf.)
Halpin HA, Milstein A, Shortell SM, Vanneman M, Rosenberg J. Mandatory public reporting of hospital-acquired infection rates: a report from California. Health Affairs. 2011; 30(4): 723-729.
Harbarth S, Sax H, Gastmeier P. The preventable proportion of nosocomial infections: an overview of published reports. Journal of Hospital Infection. 2003; 54(4): 258-266; quiz 321.

HCUP (11/01/2011) 19 The Case for the POA Indicator: Update 2011
Harzing AW. Publish or Perish. 2010. Tarma Software Research. (Accessed December 1, 2010 at: http://www.harzing.com/pop.htm.)
Hawn MT, Itani KM, Gray SH, Vick CC, Henderson W, Houston TK. Association of timely administration of prophylactic antibiotics for major surgical procedures and surgical site infection. J Am Coll Surg. 2008; 206(5): 814-819; discussion 819-821.
Houchens RL, Elixhauser A, Romano PS. How often are potential patient safety events present on admission? Joint Commission Journal on Quality and Patient Safety. 2008; 34(3): 154-163.
Iezzoni LI. Finally present on admission but needs attention. Medical Care. 2007; 45(4): 280-282.
Kim H, Capezuti E, Kovner C, Zhao Z, Boockvar K. Prevalence and predictors of adverse events in older surgical patients: impact of the present on admission indicator. Gerontologist. 2010; 50(6): 810-820.
Laupland KB, Lee H, Gregson DB, Manns BJ. Cost of intensive care unit-acquired bloodstream infections. Journal of Hospital Infection. 2006; 63(2): 124-132.
Leibson CL, Needleman J, Buerhaus P, Heit JA, Melton LJ, 3rd, Naessens JM, Bailey KR, Petterson TM, Ransom JE, Harris MR. Identifying in-hospital venous thromboembolism (VTE): a comparison of claims-based approaches with the Rochester Epidemiology Project VTE cohort. Medical Care. 2008; 46(2): 127-132.
McNutt R, Johnson TJ, Odwazny R, Remmich Z, Skarupski K, Meurer S, Hohmann S, Harting B. Change in MS-DRG assignment and hospital reimbursement as a result of Centers for Medicare & Medicaid changes in payment for hospital-acquired conditions: is it coding or quality? Quality Management in Health Care. 2010; 19(1): 17-24.
Moriarty JP, Finnie DM, Johnson MG, Huddleston JM, Naessens JM. Do pre-existing complications affect the failure to rescue quality measures? Quality & Safety in Health Care. 2010; 19(1): 65-68.
Naessens JM. Identifying Adverse Events Not Present on Admission: Can We Do It? Perspectives on Safety. Agency for Healthcare Research and Quality. 2008. (Accessed November 1, 2011 at: http://psnet.ahrq.gov/resource.aspx?resourceID=266.)
Naessens JM, Campbell CR, Berg B, Williams AR, Culbertson R. Impact of diagnosis-timing indicators on measures of safety, comorbidity, and case mix groupings from administrative data sources. Medical Care. 2007; 45(8): 781-788.
National Uniform Billing Committee (NUBC, 2010). Official UB-04 Data Specifications Manual 2011. Chicago, IL, American Hospital Association, 2010. 186-192.
Office of Inspector General. Adverse Events in Hospitals: Methods for Identifying Events. Department of Health and Human Services. 2010. (Accessed February 23, 2011 at http://oig.hhs.gov/oei/reports/oei-06-08-00221.pdf.)
HCUP (11/01/2011) 20 The Case for the POA Indicator: Update 2011
Pine M, Fry DE, Jones B, Meimban R. Screening algorithms to assess the accuracy of present-on-admission coding. Perspectives in Health Information Management. 2009a; 6: 2.
Pine M, Jordan HS, Elixhauser A, Fry DE, Hoaglin DC, Jones B, Meimban R, Warner D, Gonzales J. Modifying ICD-9-CM coding of secondary diagnoses to improve risk-adjustment of inpatient mortality rates. Medical Decision Making. 2009b; 29(1): 69-81.
Rangachari P. Coding for quality measurement: the relationship between hospital structural characteristics and coding accuracy from the perspective of quality measurement. Perspectives in Health Information Management. 2007; 4: 3.
Rosenthal J, Hanlon C, Levit K, Holmquist L. Enhancing Clinical Information in Statewide Hospital Administrative Data: Project Summary and Lessons Learned. Online. January 25, 2010. U.S. Agency for Healthcare Research and Quality (AHRQ). 2010. (Available at: http://www.hcup-us.ahrq.gov/reports/methods/2010_01.pdf.)
Saleh SS, Callan M, Therriault M, Landor N. The cost impact of hospital-acquired conditions among critical care patients. Medical Care. 2010; 48(6): 518-526.
Stukenborg GJ, Wagner DP, Harrell FE, Oliver MN, Heim SW, Price AL, Han CK, Wolf AM, Connors AF. Which hospitals have significantly better or worse than expected mortality rates for acute myocardial infarction patients? Improved risk adjustment with present-at-admission diagnoses. Circulation. 2007; 116(25): 2960-2968.
Ullman K. Hospital-Acquired Conditions & The Hospitalist. The Hospitalist. 2010. (Accessed February 3, 2011 at: http://www.the-hospitalist.org/details/article/574151/Hospital-Acquired_Conditions__The_Hospitalist.html.)
Zhan C, Elixhauser A, Friedman B, Houchens R, Chiang YP. Modifying DRG-PPS to include only diagnoses present on admission: financial implications and challenges. Medical Care. 2007; 45(4): 288-291.
HCUP (11/01/2011) A-1 The Case for the POA Indicator: Update 2011
APPENDIX A: POA REPORTING OPTIONS AND FORMAT REQUIREMENTS
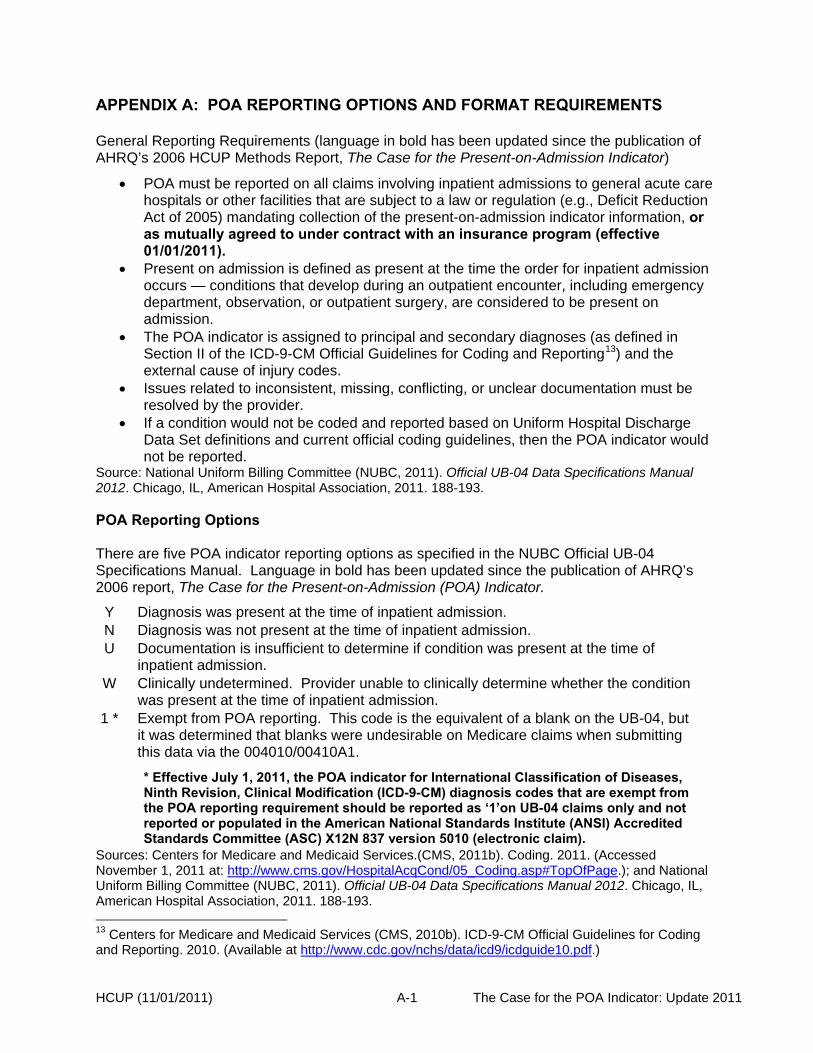
General Reporting Requirements (language in bold has been updated since the publication of AHRQ’s 2006 HCUP Methods Report, The Case for the Present-on-Admission Indicator)
• POA must be reported on all claims involving inpatient admissions to general acute care hospitals or other facilities that are subject to a law or regulation (e.g., Deficit Reduction Act of 2005) mandating collection of the present-on-admission indicator information, or as mutually agreed to under contract with an insurance program (effective 01/01/2011).
• Present on admission is defined as present at the time the order for inpatient admission occurs — conditions that develop during an outpatient encounter, including emergency department, observation, or outpatient surgery, are considered to be present on admission.
• The POA indicator is assigned to principal and secondary diagnoses (as defined in Section II of the ICD-9-CM Official Guidelines for Coding and Reporting13
• Issues related to inconsistent, missing, conflicting, or unclear documentation must be resolved by the provider.
) and the external cause of injury codes.
• If a condition would not be coded and reported based on Uniform Hospital Discharge Data Set definitions and current official coding guidelines, then the POA indicator would not be reported.
Source: National Uniform Billing Committee (NUBC, 2011). Official UB-04 Data Specifications Manual 2012. Chicago, IL, American Hospital Association, 2011. 188-193.
POA Reporting Options There are five POA indicator reporting options as specified in the NUBC Official UB-04 Specifications Manual. Language in bold has been updated since the publication of AHRQ’s 2006 report, The Case for the Present-on-Admission (POA) Indicator.
Y Diagnosis was present at the time of inpatient admission. N Diagnosis was not present at the time of inpatient admission. U Documentation is insufficient to determine if condition was present at the time of
inpatient admission. W Clinically undetermined. Provider unable to clinically determine whether the condition
was present at the time of inpatient admission. 1 * Exempt from POA reporting. This code is the equivalent of a blank on the UB-04, but
it was determined that blanks were undesirable on Medicare claims when submitting this data via the 004010/00410A1. * Effective July 1, 2011, the POA indicator for International Classification of Diseases, Ninth Revision, Clinical Modification (ICD-9-CM) diagnosis codes that are exempt from the POA reporting requirement should be reported as ‘1’on UB-04 claims only and not reported or populated in the American National Standards Institute (ANSI) Accredited Standards Committee (ASC) X12N 837 version 5010 (electronic claim).
Sources: Centers for Medicare and Medicaid Services.(CMS, 2011b). Coding. 2011. (Accessed November 1, 2011 at: http://www.cms.gov/HospitalAcqCond/05_Coding.asp#TopOfPage.); and National Uniform Billing Committee (NUBC, 2011). Official UB-04 Data Specifications Manual 2012. Chicago, IL, American Hospital Association, 2011. 188-193. 13 Centers for Medicare and Medicaid Services (CMS, 2010b). ICD-9-CM Official Guidelines for Coding and Reporting. 2010. (Available at http://www.cdc.gov/nchs/data/icd9/icdguide10.pdf.)

HCUP (11/01/2011) A-2 The Case for the POA Indicator: Update 2011
POA Submission Format Requirements Paper Claims For paper claims using the UB-04 form, the POA indicator is reported as the eighth digit of Field Locator (FL) 67, Principal Diagnosis, and the eighth digit of each of the Secondary Diagnosis fields, FL 67 A-Q. The applicable value for the POA indicator (Y, N, U, or W) for the principal and any secondary diagnoses is reported as the eighth digit; the field is left blank if the diagnosis is exempt from POA reporting.
Electronic Claims For reporting the POA indicator using the electronic claim format for ASC X12N 837 Institutional (837I), the POA indicator is submitted in segment K3 in the 2300 loop, data element K301. With implementation of 5010 standard required by January 1, 2012, the POA indicators will follow the diagnosis code in the 2300 HI segment; the K3 segment, required for reporting POA in the 4010A1, will no longer be used. Example 1. The POA indicators for an electronic claim example with one principal and five secondary diagnoses would be coded as POAYNUW1YZ using the following POA assignment:
POA “POA” is always required first, followed by a single indicator for every diagnosis reported on the claim.
Y The principal diagnosis is always the first indicator after “POA.” In this example, the principal diagnosis was present on admission.
N The first secondary diagnosis was not present on admission, designated by “N.” U It was unknown if the second secondary diagnosis was present on admission,
designated by “U.” W It is clinically undetermined if the third secondary diagnosis was present on
admission, designated by “W.” 1 The fourth secondary diagnosis was exempt from reporting for POA, designated
by “1” for the 4010A1. Hospitals using the 5010 format on and after January 1, 2011 will no longer use “1” for POA exempt codes; the field will be left blank.
Y The fifth secondary diagnosis was present on admission, designated by “Y.” Z The last secondary diagnosis indicator is followed by the letter “Z” to indicate the
end of the data element. Sources: Centers for Medicare and Medicaid Services (CMS, 2010c). Present on Admission (POA) Indicator Reporting by Acute Inpatient Prospective Payment System (IPPS) Hospitals. Medicare Learning Network. (Accessed February 10, 2011 at: http://www.cms.gov/MLNProducts/downloads/wPOAFactSheet.pdf.); Centers for Medicare and Medicaid Services (CMS, 2010d). Version 5010 Implementation—Changes to Present on Admission (POA) Indicator ‘1’ and the K3. Medicare Learning Network. 2010. (Accessed August 18, 2011 at: http://www.cms.gov/MLNMattersArticles/downloads/MM7024.pdf.); and Centers for Medicare and Medicaid Services (CMS, 2011d). Electronic Billing and EDI Transactions. 5010 D.O. 2011. (Accessed August 18, 2011 at: http://www.cms.gov/ElectronicBillingEDITrans/18_5010D0.asp.)
Conditions Exempt from POA Reporting
The American Health Information Management Association (AHIMA), American Hospital Association (AHA), and the National Center for Health Statistics have published a list of ICD-9-CM codes that are exempt from POA reporting. These are in Appendix I of the ICD-9-CM Official Guidelines for Coding and Reporting, available at http://www.cdc.gov/nchs/data/icd9/icdguide10.pdf.

HCUP (11/01/2011) B-1 The Case for the POA Indicator: Update 2011
APPENDIX B: SUMMARY OF POA DATA COLLECTION BY STATE, 2009
State
HCUP Partner collects POA
State
HCUP Partner collects POA
Total collecting POA 38 Montana X
Alabama a Nebraska X
Alaska a Nevada X
Arizona X New Hampshire X
Arkansas X New Jersey X
California X New Mexico X
Colorado X New York X
Connecticut X North Carolina
Delaware a North Dakota a
Florida X Ohio X
Georgia X Oklahoma X
Hawaii X Oregon X
Idaho a Pennsylvania X
Illinois X Rhode Island
Indiana X South Carolina X
Iowa X South Dakota X
Kansas X Tennessee X
Kentucky X Texas
Louisiana Utah
Maine X Vermont X
Maryland X Virginia X
Massachusetts X Washington X
Michigan X West Virginia X
Minnesota X Wisconsin X
Mississippi a Wyoming
Missouri X a Non-HCUP Partner; POA collection status is unknown
Source: 2010 survey of HCUP Partners and HCUP State Inpatient Databases (SID) Availability of Data Elements – 2009, available at: http://www.hcup-us.ahrq.gov/db/state/siddist/siddistvarnote2009.jsp.