Embed Size (px)
Citation preview
The Case For
Emerging Market
Private Equity
V.3 August 20091
IFC has a long-standing commitment to developing the private equity asset class in Emerging Markets.
We are now approaching ten years of experience with a Dedicated approach to investing in Funds and
we think other investors may benefit from sharing this experience.
Based on our experience and analysis of data from over 90 funds holding over 800 companies, we
make the following observations:
1) The returns on Emerging Market Private Equity are driven by Growth and Efficiency rather than
leverage or multiple expansion.
2) Economic forecasts suggest that the Emerging Markets will continue to grow for the foreseeable
future, supporting growth-based private equity.
3) Significant growth-oriented private equity opportunities are available beyond the small number
of countries in which most Emerging Market Private Equity investment is currently concentrated.
4) Many of the Risks of Emerging Market Private Equity are over-stated and we provide data which
places these risks in perspective.
Introduction
2
Presentation
We intend that this become a living document.
We have based the content of this presentation on conversations with investors about the
issues they have when they think about investing in Emerging Market Private Equity.
There will be other issues of interest beyond the ones presently covered, so we have used
power point to make the information available as it is easy to up-date and add new
information in response to requests.
We encourage you to ask us questions and, if we have the information with which to answer
or provide some insight, we will add it to the presentation posted on our website:
http://www.ifc.org/funds
If you find the information useful and use it in your own presentations, we would appreciate
an acknowledgement of IFC.
3
Acknowledgements
It is possible to present this information due to the cooperation and hard work of a large
number of people. We would particularly like to thank:
• The Managers of IFC invested funds who have been very generous in responding to our
requests for information.
• The Emerging Markets Private Equity Association (EMPEA) for providing market data and
insights.
• Cambridge Associates for providing benchmark data.
• Markus Taussig, a doctoral student at Harvard, for gathering and analyzing the data.
4
Private Equity in
Emerging Markets is Driven by
Growth & Efficiency
5
IRR Equity
Cash out by Dividend ,
Stock Purchase etc
P/E at Entry P/E at ExitRevenue
Growth p.a
Margin Improves from
5% to x%
Holding Period Years
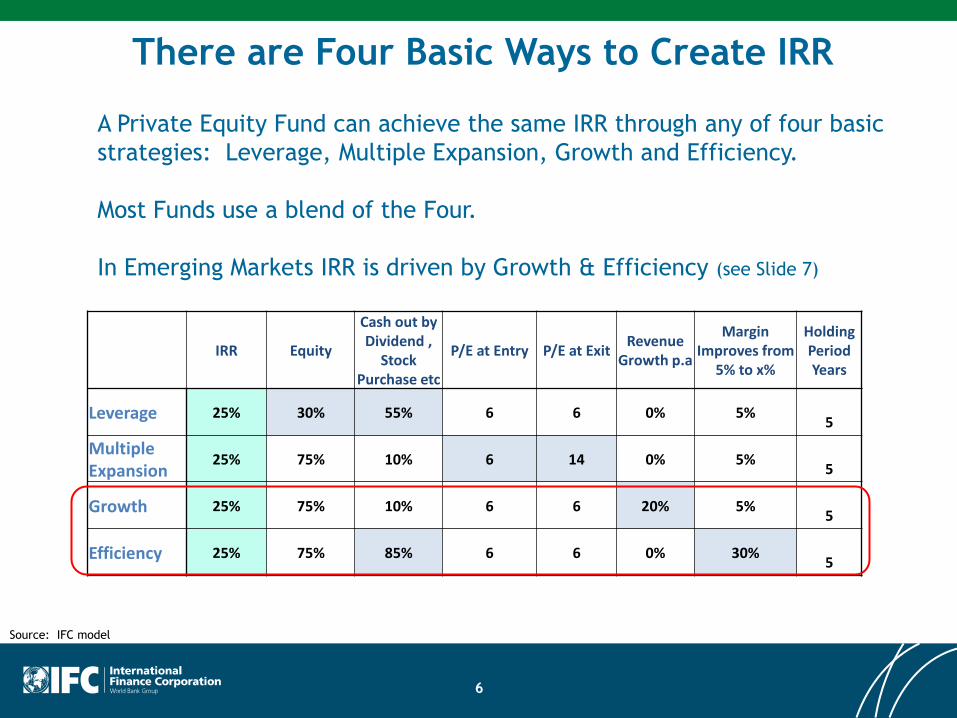
Leverage 25% 30% 55% 6 6 0% 5%5
MultipleExpansion
25% 75% 10% 6 14 0% 5%5
Growth 25% 75% 10% 6 6 20% 5%5
Efficiency 25% 75% 85% 6 6 0% 30%5
There are Four Basic Ways to Create IRR
A Private Equity Fund can achieve the same IRR through any of four basic
strategies: Leverage, Multiple Expansion, Growth and Efficiency.
Most Funds use a blend of the Four.
In Emerging Markets IRR is driven by Growth & Efficiency (see Slide 7)
Source: IFC model
6
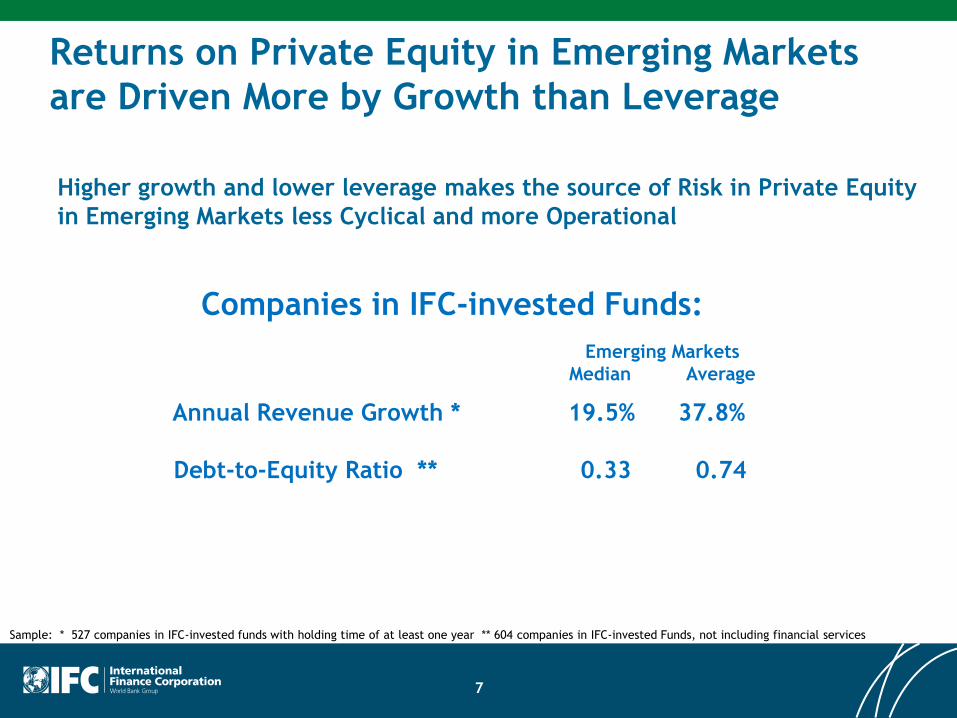
Returns on Private Equity in Emerging Markets
are Driven More by Growth than Leverage
Annual Revenue Growth * 19.5% 37.8%
Debt-to-Equity Ratio ** 0.33 0.74
Sample: * 527 companies in IFC-invested funds with holding time of at least one year ** 604 companies in IFC-invested Funds, not including financial services
Higher growth and lower leverage makes the source of Risk in Private Equity
in Emerging Markets less Cyclical and more Operational
Emerging Markets
Median Average
Companies in IFC-invested Funds:
7
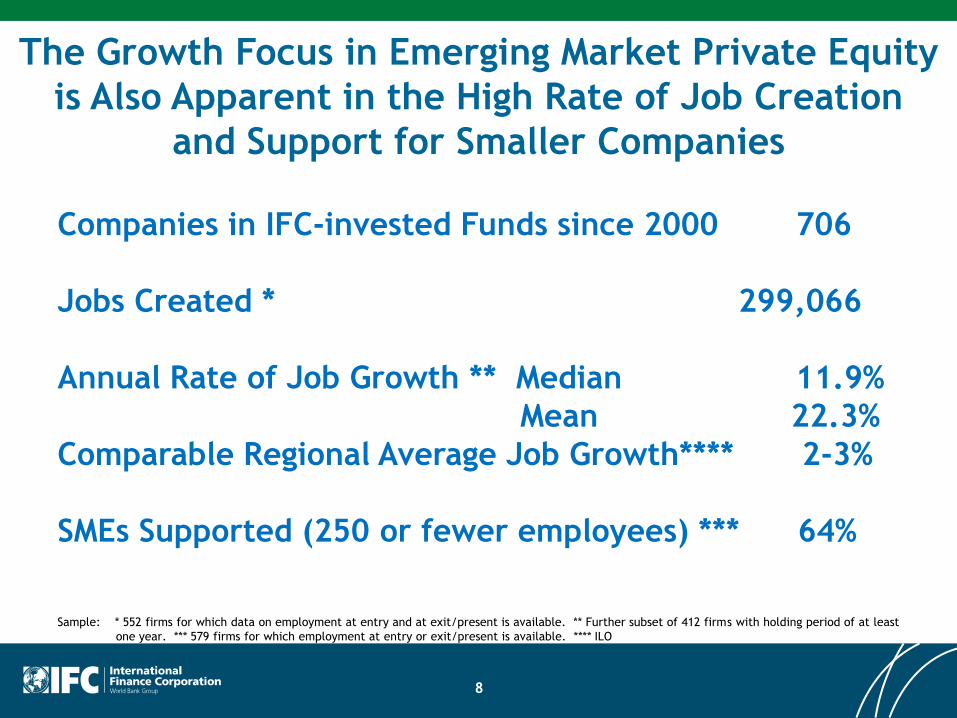
The Growth Focus in Emerging Market Private Equity
is Also Apparent in the High Rate of Job Creation
and Support for Smaller Companies
Companies in IFC-invested Funds since 2000 706
Jobs Created * 299,066
Annual Rate of Job Growth ** Median 11.9%
Mean 22.3%
Comparable Regional Average Job Growth**** 2-3%
SMEs Supported (250 or fewer employees) *** 64%
Sample: * 552 firms for which data on employment at entry and at exit/present is available. ** Further subset of 412 firms with holding period of at least
one year. *** 579 firms for which employment at entry or exit/present is available. **** ILO
8
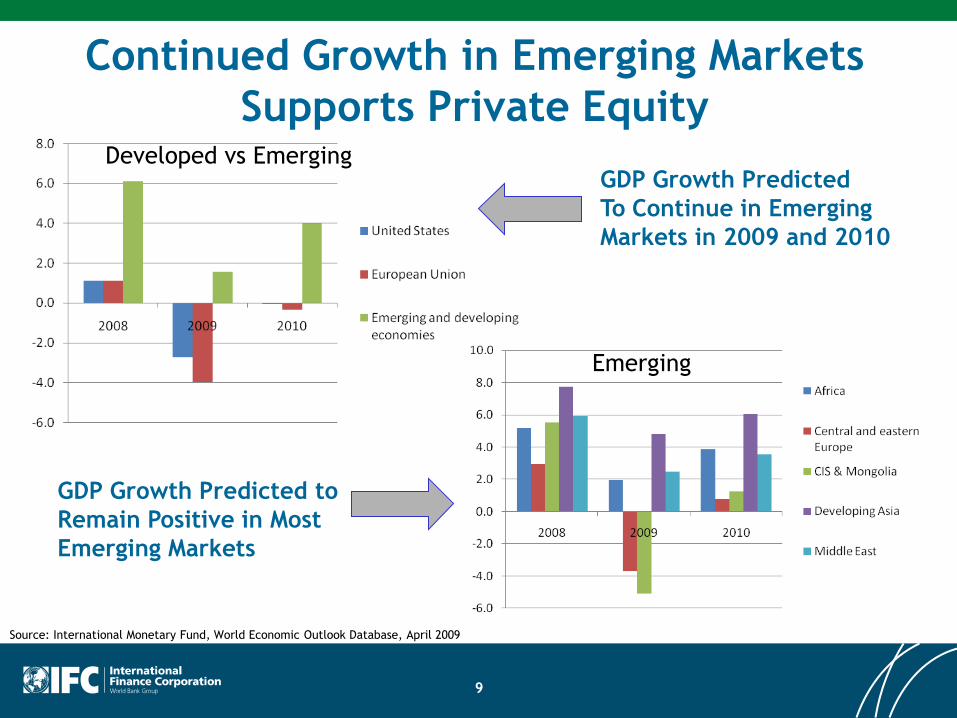
Continued Growth in Emerging Markets
Supports Private Equity
GDP Growth Predicted to
Remain Positive in Most
Emerging Markets
Source: International Monetary Fund, World Economic Outlook Database, April 2009
Developed vs Emerging
Emerging
GDP Growth Predicted
To Continue in Emerging
Markets in 2009 and 2010
9
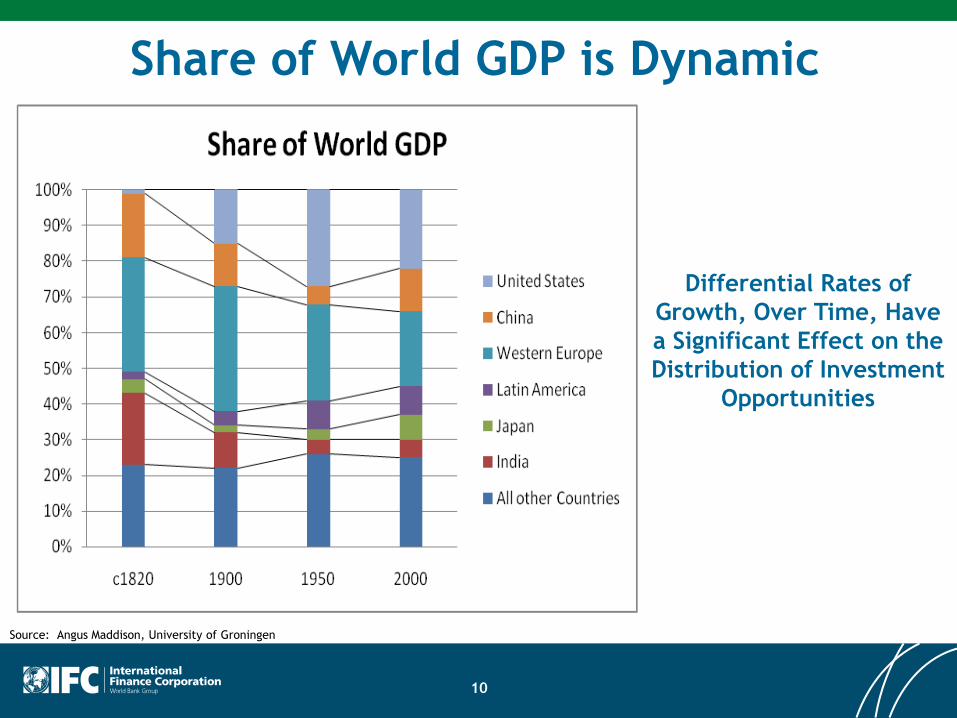
Share of World GDP is Dynamic
Source: Angus Maddison, University of Groningen
Differential Rates of
Growth, Over Time, Have
a Significant Effect on the
Distribution of Investment
Opportunities
10

The Opportunity is Larger
Than You Think
11
• Since 2000 the number of countries in which there is a meaningful
volume of deal flow suited to Private Equity (equity with real influence)
has increased considerably.
• Having adequate deal flow to support local country-based teams improves
the quality of the opportunity as deal origination, structuring and providing
advice to the companies, can be done in close proximity and in real time by
people embedded in the local market.
Both the Breadth and the Quality of the
Emerging Market Private Equity Opportunity
Have Improved Since 2000
12
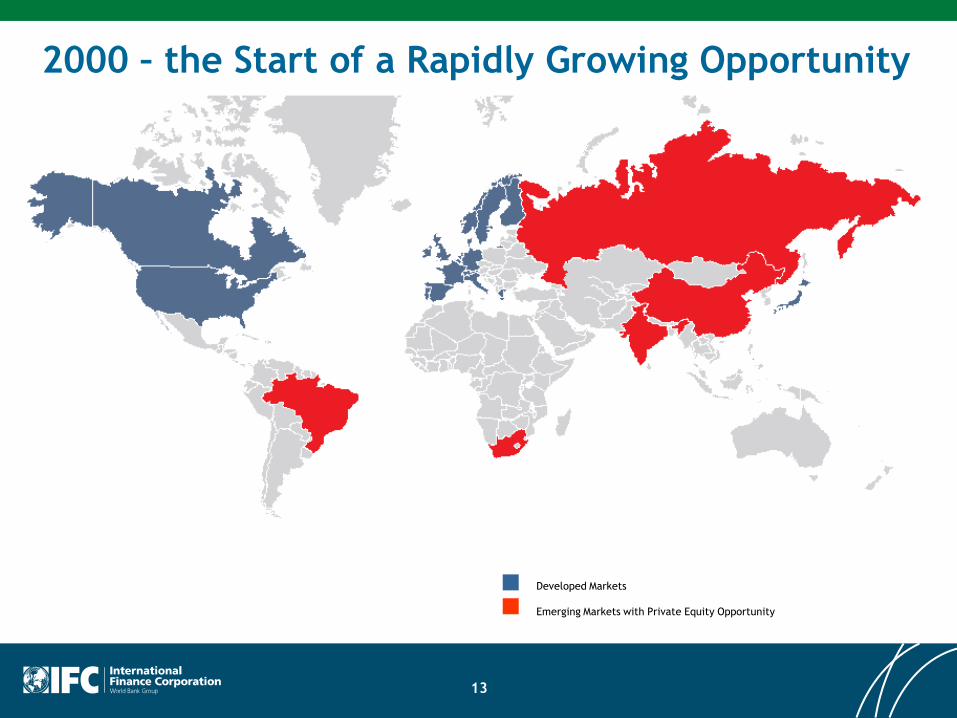
2000 – the Start of a Rapidly Growing Opportunity
Developed Markets
Emerging Markets with Private Equity Opportunity
13
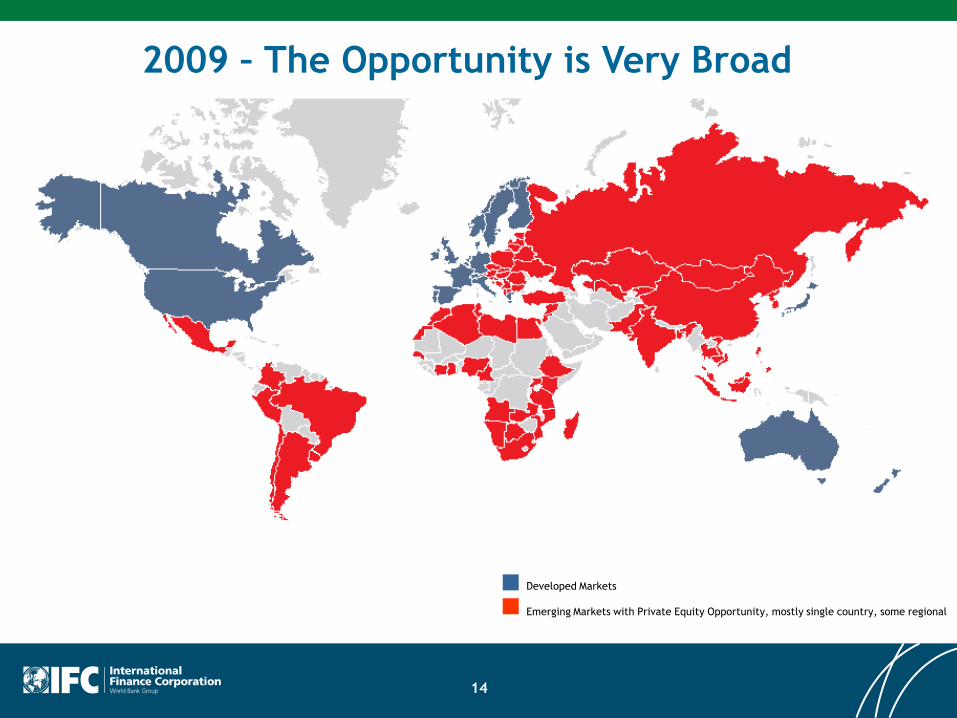
2009 – The Opportunity is Very Broad
Developed Markets
Emerging Markets with Private Equity Opportunity, mostly single country, some regional
14
What Has Driven the Growth of the
PE Opportunity?
* The move to market-based economies since the 1990s is increasing
entrepreneurial activity and the number of businesses of interest
to Private Equity (see slide 16).
•The opening of trade and capital flows since 2000 increases both
opportunities to expand and competitive pressure, leading to more
business owners seeing third party capital as a solution (see slide17).
•The close identification of family status and wealth with direct
ownership of a company reduces as portfolio wealth becomes an
option and is seen to work, reducing reluctance to allow in third
party equity.
Private equity requires (i) interesting businesses in which to invest,
and (ii) access to equity stakes with influence over the business.
Three trends have increased both the number of businesses and the ability
to acquire influence.
15
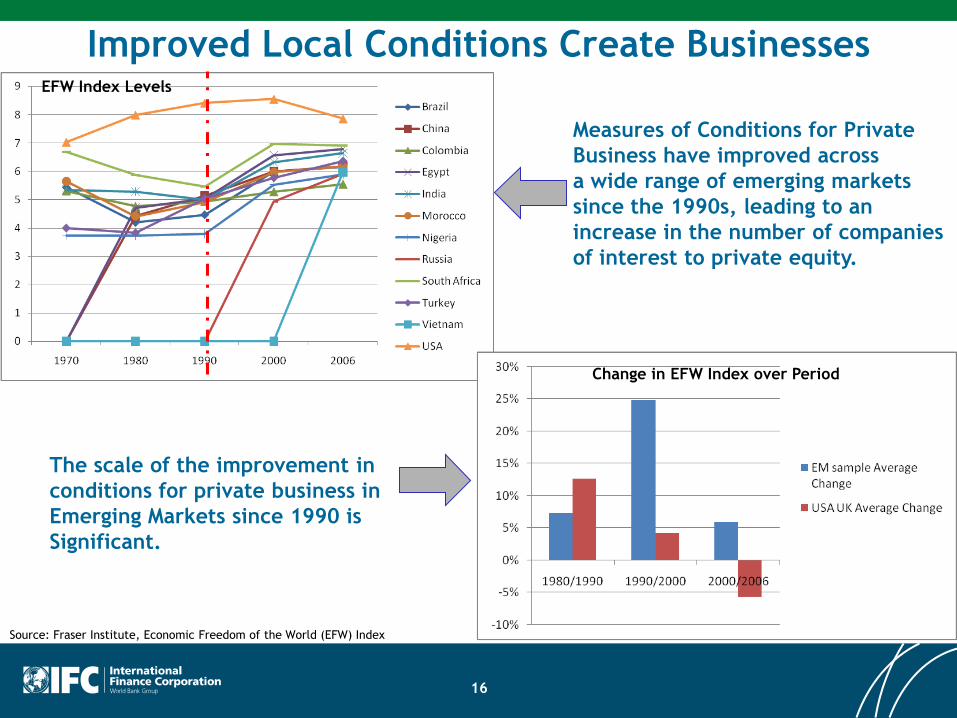
Improved Local Conditions Create Businesses
Source: Fraser Institute, Economic Freedom of the World (EFW) Index
Measures of Conditions for Private
Business have improved across
a wide range of emerging markets
since the 1990s, leading to an
increase in the number of companies
of interest to private equity.
The scale of the improvement in
conditions for private business in
Emerging Markets since 1990 is
Significant.
EFW Index Levels
Change in EFW Index over Period
16
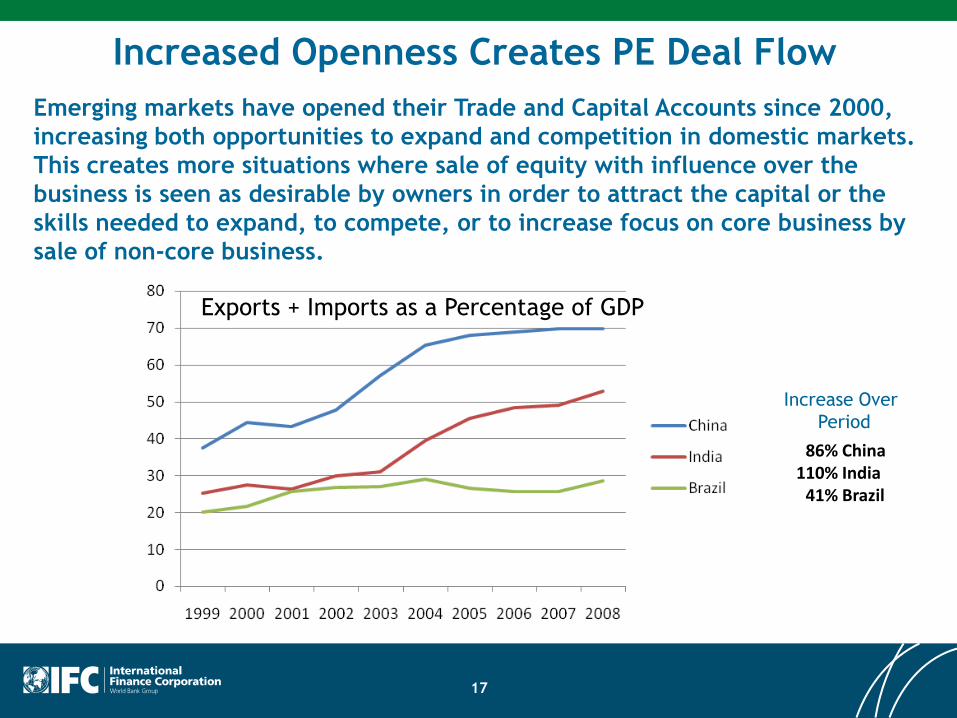
86% China110% India
41% Brazil
Increased Openness Creates PE Deal Flow
Emerging markets have opened their Trade and Capital Accounts since 2000,
increasing both opportunities to expand and competition in domestic markets.
This creates more situations where sale of equity with influence over the
business is seen as desirable by owners in order to attract the capital or the
skills needed to expand, to compete, or to increase focus on core business by
sale of non-core business.
Exports + Imports as a Percentage of GDP
Increase Over
Period
17
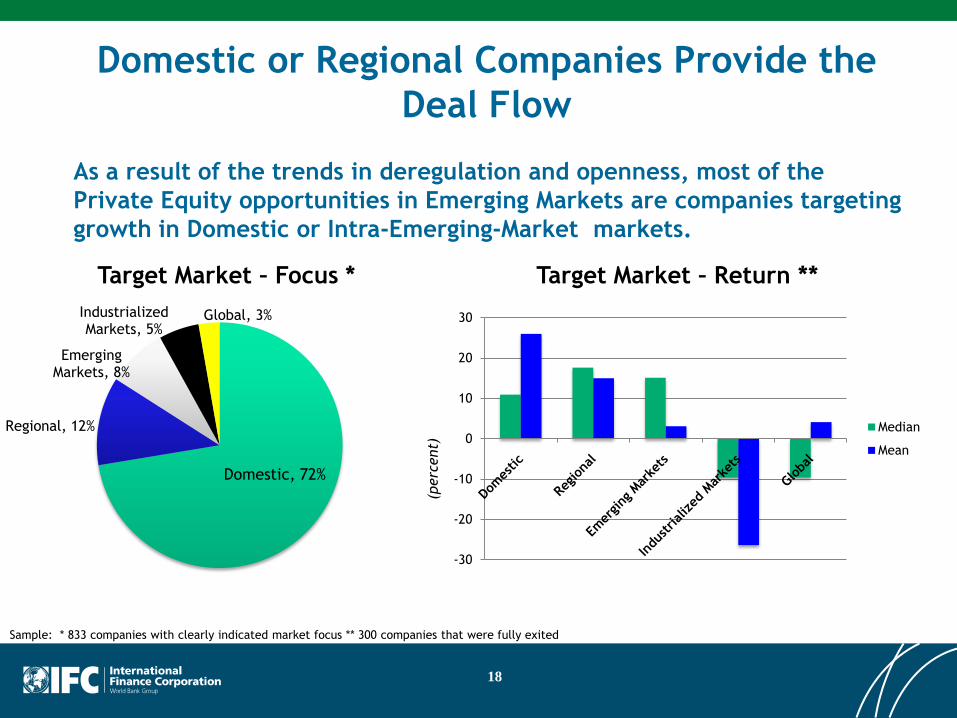
Domestic or Regional Companies Provide the
Deal Flow
18
Sample: * 833 companies with clearly indicated market focus ** 300 companies that were fully exited
Target Market – Return **
As a result of the trends in deregulation and openness, most of the
Private Equity opportunities in Emerging Markets are companies targeting
growth in Domestic or Intra-Emerging-Market markets.
Domestic, 72%
Regional, 12%
Emerging Markets, 8%
Industrialized Markets, 5%
Global, 3%
Target Market – Focus *
-30
-20
-10
0
10
20
30
Median
Mean
(perc
ent)
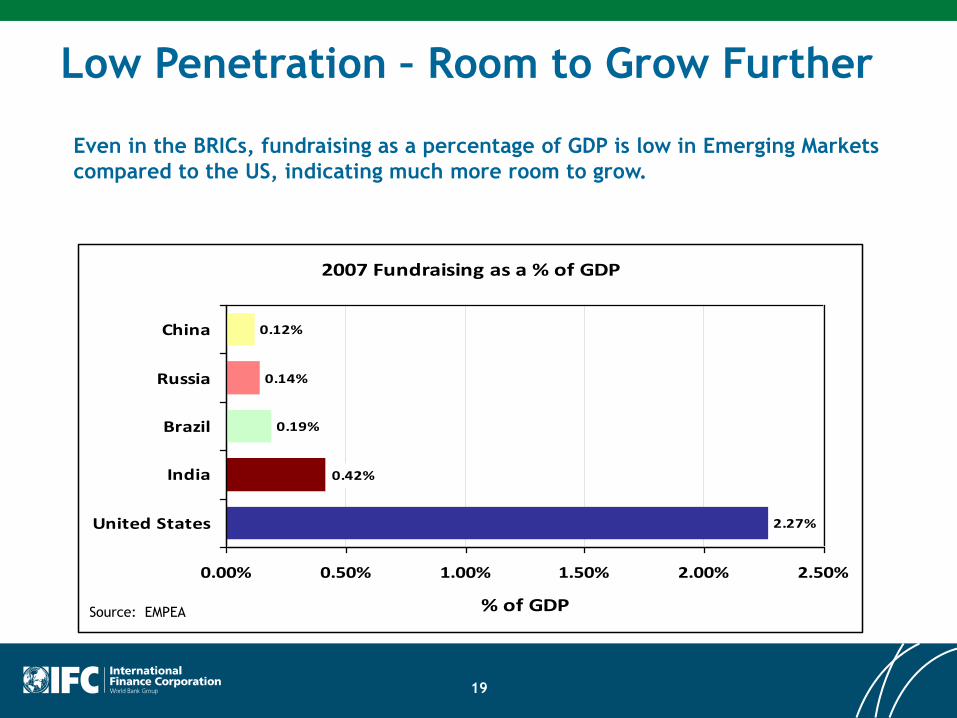
Low Penetration – Room to Grow Further
2007 Fundraising as a % of GDP
2.27%
0.19%
0.14%
0.12%
0.42%
0.00% 0.50% 1.00% 1.50% 2.00% 2.50%
United States
India
Brazil
Russia
China
% of GDPSource: EMPEA
Even in the BRICs, fundraising as a percentage of GDP is low in Emerging Markets
compared to the US, indicating much more room to grow.
19
Taking Advantage of the
Broader Opportunity
Improves Returns
20
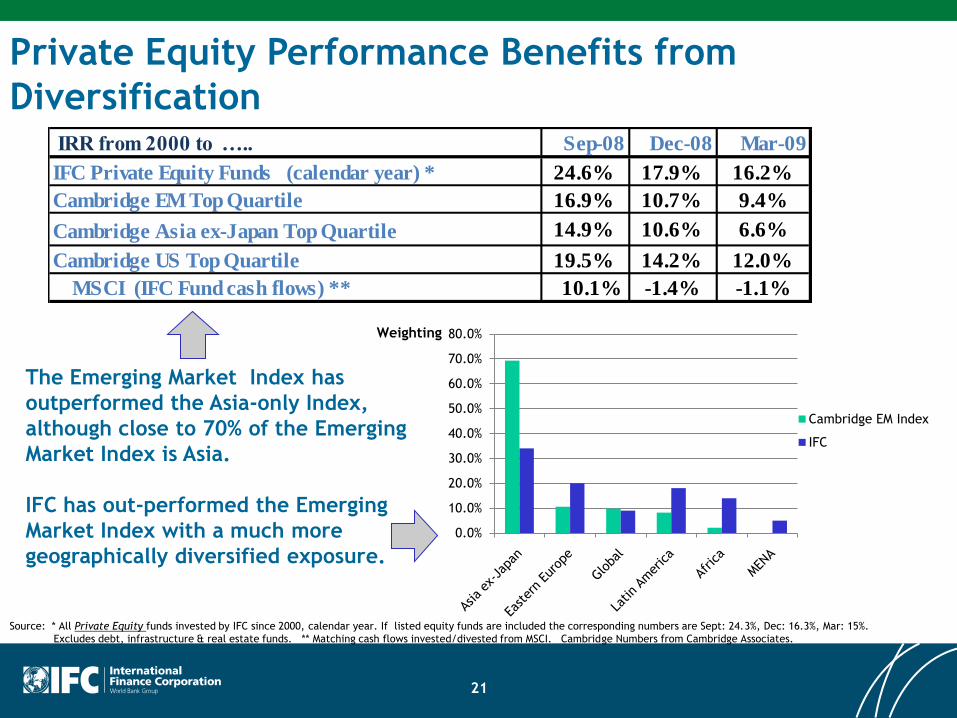
Private Equity Performance Benefits from
Diversification
Source: * All Private Equity funds invested by IFC since 2000, calendar year. If listed equity funds are included the corresponding numbers are Sept: 24.3%, Dec: 16.3%, Mar: 15%.
Excludes debt, infrastructure & real estate funds. ** Matching cash flows invested/divested from MSCI. Cambridge Numbers from Cambridge Associates.
0.0%
10.0%
20.0%
30.0%
40.0%
50.0%
60.0%
70.0%
80.0%
Cambridge EM Index
IFC
The Emerging Market Index has
outperformed the Asia-only Index,
although close to 70% of the Emerging
Market Index is Asia.
IFC has out-performed the Emerging
Market Index with a much more
geographically diversified exposure.
Weighting
IRR from 2000 to ….. Sep-08 Dec-08 Mar-09
IFC Private Equity Funds (calendar year) * 24.6% 17.9% 16.2%
Cambridge EM Top Quartile 16.9% 10.7% 9.4%
Cambridge Asia ex-Japan Top Quartile 14.9% 10.6% 6.6%
Cambridge US Top Quartile 19.5% 14.2% 12.0%
MSCI (IFC Fund cash flows) ** 10.1% -1.4% -1.1%
21
Myth Busters:Frequently Cited Risks
with Private Equity in
Emerging Markets
22
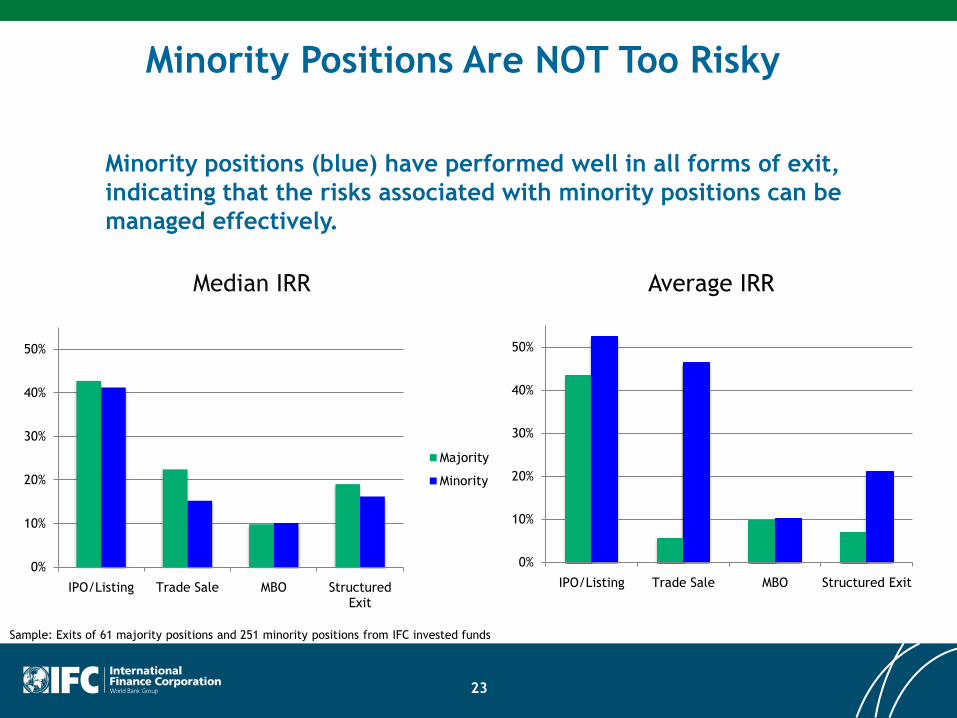
Minority Positions Are NOT Too Risky
Median IRR Average IRR
Sample: Exits of 61 majority positions and 251 minority positions from IFC invested funds
Minority positions (blue) have performed well in all forms of exit,
indicating that the risks associated with minority positions can be
managed effectively.
0%
10%
20%
30%
40%
50%
IPO/Listing Trade Sale MBO Structured Exit
Majority
Minority
0%
10%
20%
30%
40%
50%
IPO/Listing Trade Sale MBO Structured Exit
23
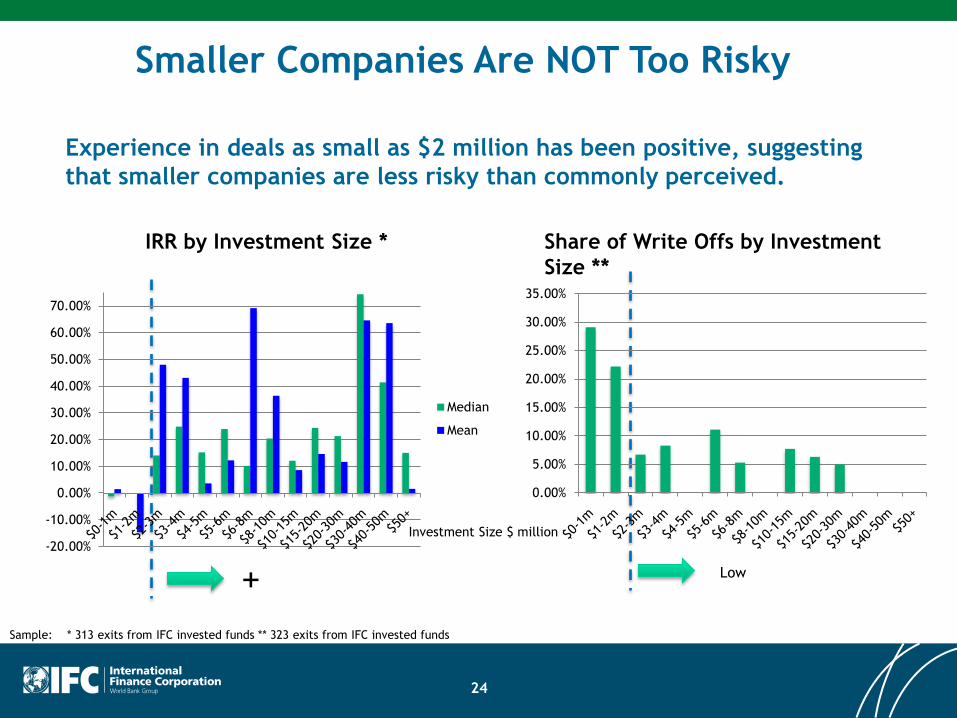
Smaller Companies Are NOT Too Risky
Investment Size $ million
+
Sample: * 313 exits from IFC invested funds ** 323 exits from IFC invested funds
IRR by Investment Size *
Low
Experience in deals as small as $2 million has been positive, suggesting
that smaller companies are less risky than commonly perceived.
-20.00%
-10.00%
0.00%
10.00%
20.00%
30.00%
40.00%
50.00%
60.00%
70.00%
Median
Mean
0.00%
5.00%
10.00%
15.00%
20.00%
25.00%
30.00%
35.00%
Share of Write Offs by Investment
Size **
24
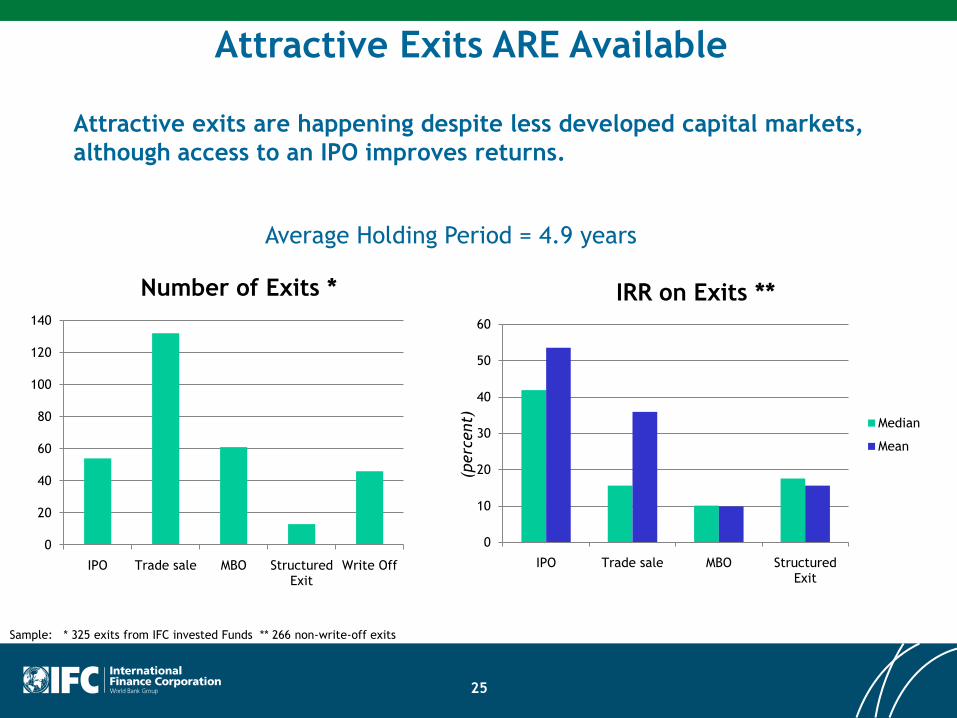
Attractive Exits ARE Available
IRR on Exits **
Sample: * 325 exits from IFC invested Funds ** 266 non-write-off exits
Average Holding Period = 4.9 years
Attractive exits are happening despite less developed capital markets,
although access to an IPO improves returns.
0
20
40
60
80
100
120
140
IPO Trade sale MBO Structured Exit
Write Off
Number of Exits *
0
10
20
30
40
50
60
IPO Trade sale MBO Structured Exit
Median
Mean
(perc
ent)
25
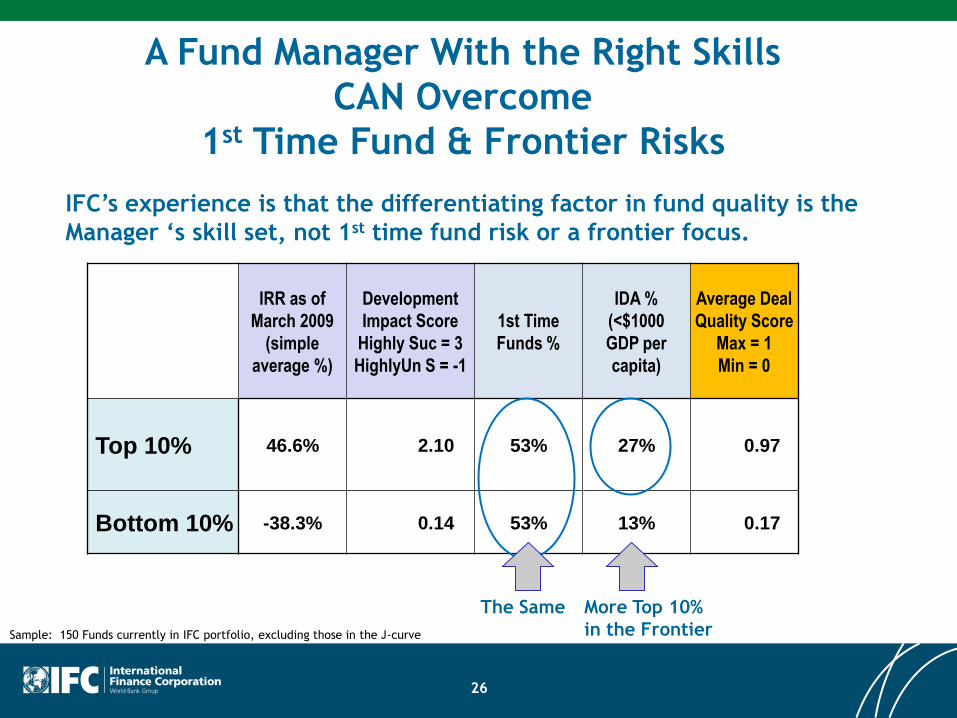
A Fund Manager With the Right Skills
CAN Overcome
1st Time Fund & Frontier Risks
Sample: 150 Funds currently in IFC portfolio, excluding those in the J-curve
IRR as of
March 2009
(simple
average %)
Development
Impact Score
Highly Suc = 3
HighlyUn S = -1
1st Time
Funds %
IDA %
(<$1000
GDP per
capita)
Average Deal
Quality Score
Max = 1
Min = 0
Top 10% 46.6% 2.10 53% 27% 0.97
Bottom 10% -38.3% 0.14 53% 13% 0.17
The Same More Top 10%
in the Frontier
IFC’s experience is that the differentiating factor in fund quality is the
Manager ‘s skill set, not 1st time fund risk or a frontier focus.
26
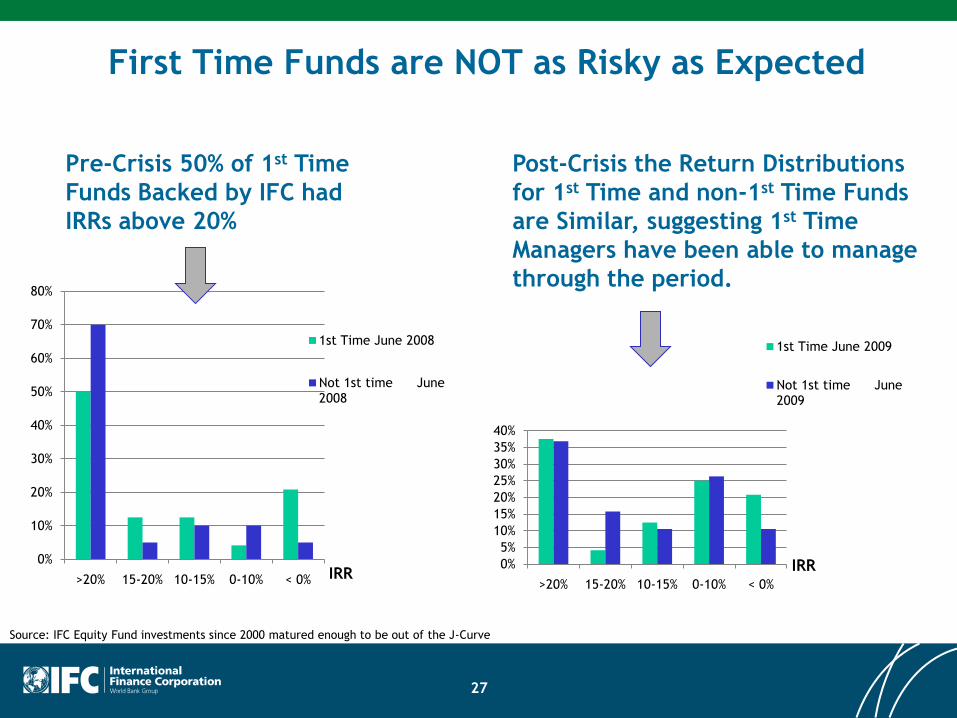
First Time Funds are NOT as Risky as Expected
0%
10%
20%
30%
40%
50%
60%
70%
80%
>20% 15-20% 10-15% 0-10% < 0%
1st Time June 2008
Not 1st time June 2008
0%
5%
10%
15%
20%
25%
30%
35%
40%
>20% 15-20% 10-15% 0-10% < 0%
1st Time June 2009
Not 1st time June 2009
IRRIRR
Source: IFC Equity Fund investments since 2000 matured enough to be out of the J-Curve
Pre-Crisis 50% of 1st Time
Funds Backed by IFC had
IRRs above 20%
Post-Crisis the Return Distributions
for 1st Time and non-1st Time Funds
are Similar, suggesting 1st Time
Managers have been able to manage
through the period.
27