Embed Size (px)
Citation preview
REF: PFIA – 8RPS2U
PRUDENTIAL REAL ESTATE INVESTORS
The Case for China Retail: Issues and Opportunities MARCH 2012
HENRY CHIN, PHD
DIRECTOR OF RESEARCH AND STRATEGY
ALAN CHOW
DIRECTOR OF RESEARCH
PRUDENTIAL REAL ESTATE INVESTORS
8 CAMPUS DRIVE
PARSIPPANY, NJ 07054
1
PRUDENTIAL REAL ESTATE INVESTORS
Executive Summary
China has enormous potential for investors in all property investment categories. Strong population growth, a
large pool of qualified workers, greater integration with the world economy and increasing domestic and foreign
investment are fueling demand for office, retail and residential property. Given the strong interest from global
investors and the growth in the scale and activity in China, it is worth understanding the fundamental drivers and
opportunities of the Chinese retail market in the years ahead.
Above average economic growth: Since 1978, when it first opened its economy to foreign direct investment,
China’s GDP has grown at a compounded rate of 9.9%.1 China’s economy has averaged an impressive 11.7%2
growth rate since it joined the World Trade Organization (WTO) in 2001.
Urbanization, growing middle class and creation of wealth: China is home to 1.35 billion people,3 while an
average of 3.8% of the population moves to cities each year. The urbanization and rapid acceleration of wealth is
creating a burgeoning middle class. Disposable income per capita of households in China’s Tier 1 cities4 has
grown 10.6% annually over the past 10 years.5
Rapid growth of retail sales: Retail sales, which have been increasing at a robust pace over the past decade,
are forecast to grow at around 10% per year from 2012 to 2015. Together with the rapid growth of personal
wealth, domestic and international retailers are eager to expand their footprint in the country.
Lack of investment grade stock: The biggest challenge for many retailers is securing appropriate space. China
is noticeably undersupplied in investment-grade retail stock compared to other major economies. Retail supply in
China is dominated by old department store formats, and only 16% of the supply pipeline in mature areas of Tier
1 cities is considered grade A.6
Risk Remain: Property investment in China is not risk-free. Market transparency and institutional legal framework
are still behind European and US standards. It is vital for foreign investors to take into account both
macroeconomic and institutional risks while investing in China. The lack of liquidity and upward pressure of
pricing are the main concerns within the markets.
1 DTZ China Insight High-end retail investment – Ranking the Opportunities (May 2011) 2 International Monetary Fund – 2010 estimate based on GDP (PPP) 3 Population Division of the United Nations Department of Economic and Social Affairs 4 Beijing, Shanghai, Shenzhen, and Guangzhou 5 National Bureau of Statistics of China 6 CBRE Research and Prudential Real Estate Investors Research
2
PRUDENTIAL REAL ESTATE INVESTORS
Table of Contents
Part 1: Why China? – The Story Behind the Growth .................................................................. 3
Macro Economic Indicators - The GDP Growth .......................................................................... 3
Household Final Expenditure Consumption as a Percentage of GDP ........................................ 4
12th Five Year Plan - Implication for Real Estate Markets .......................................................... 6
Capital Markets ............................................................................................................................ 7
China’s Macro Risks .................................................................................................................... 8
Part 2: The Case for China Commercial Real Estate ................................................................. 9
Urbanization on a Massive Scale ................................................................................................ 9
Real Estate Market Size ............................................................................................................ 10
Part 3: China Retail Market Overview – Understanding China Retail Investments .............. 13
The Evolution of the Asset Class ............................................................................................... 13
Retail Space per Capita Lags Behind ........................................................................................ 14
Riding on the Coat Tail of Retailers ........................................................................................... 14
Space Demands Surge to Meet Consumer Needs ................................................................... 16
Expansion in Retail Footprint ..................................................................................................... 17
Beyond the 1st Tier Cities .......................................................................................................... 18
China’s Retail Supply – Can it be Absorbed? ........................................................................... 19
Part 4: China Retail Market Assessment ................................................................................... 22
Key Criterions for Market Forecast ............................................................................................ 22
Obervations of Lessons Learned ............................................................................................... 24
Part 5: Conclusion ....................................................................................................................... 26
3
PRUDENTIAL REAL ESTATE INVESTORS
Part 1: Why China? The Story Behind the Growth
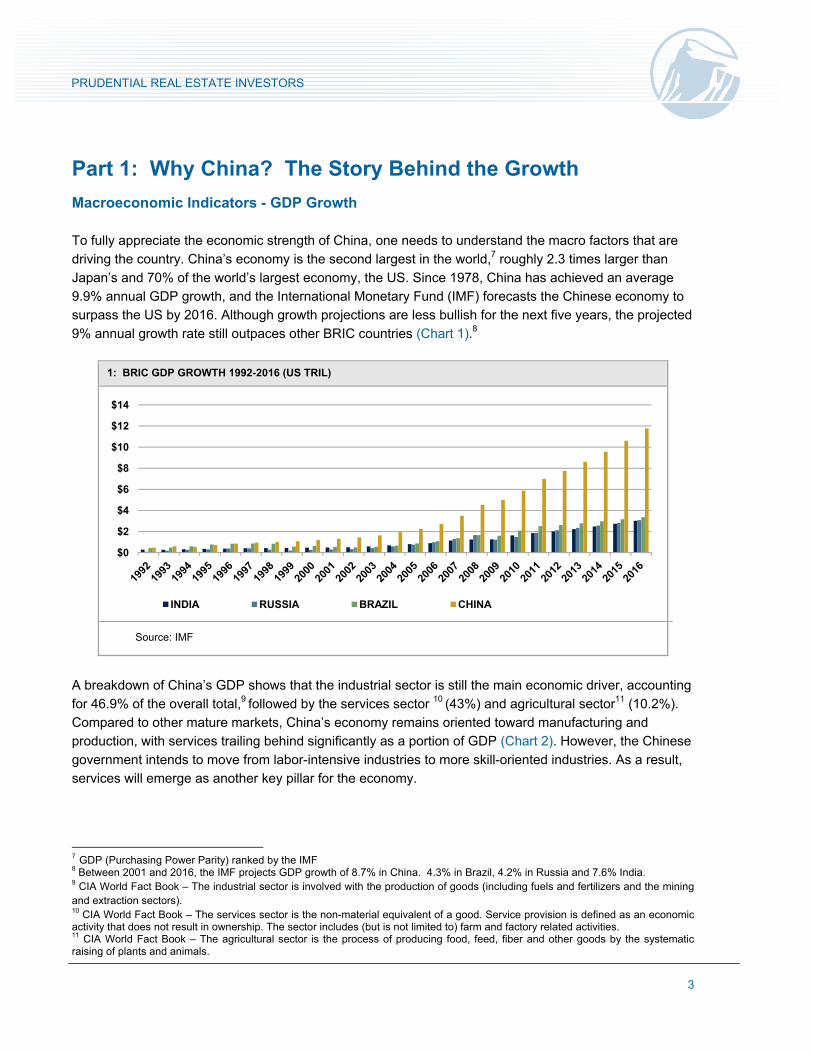
Macroeconomic Indicators - GDP Growth To fully appreciate the economic strength of China, one needs to understand the macro factors that are
driving the country. China’s economy is the second largest in the world,7 roughly 2.3 times larger than
Japan’s and 70% of the world’s largest economy, the US. Since 1978, China has achieved an average
9.9% annual GDP growth, and the International Monetary Fund (IMF) forecasts the Chinese economy to
surpass the US by 2016. Although growth projections are less bullish for the next five years, the projected
9% annual growth rate still outpaces other BRIC countries (Chart 1).8
1: BRIC GDP GROWTH 1992-2016 (US TRIL)
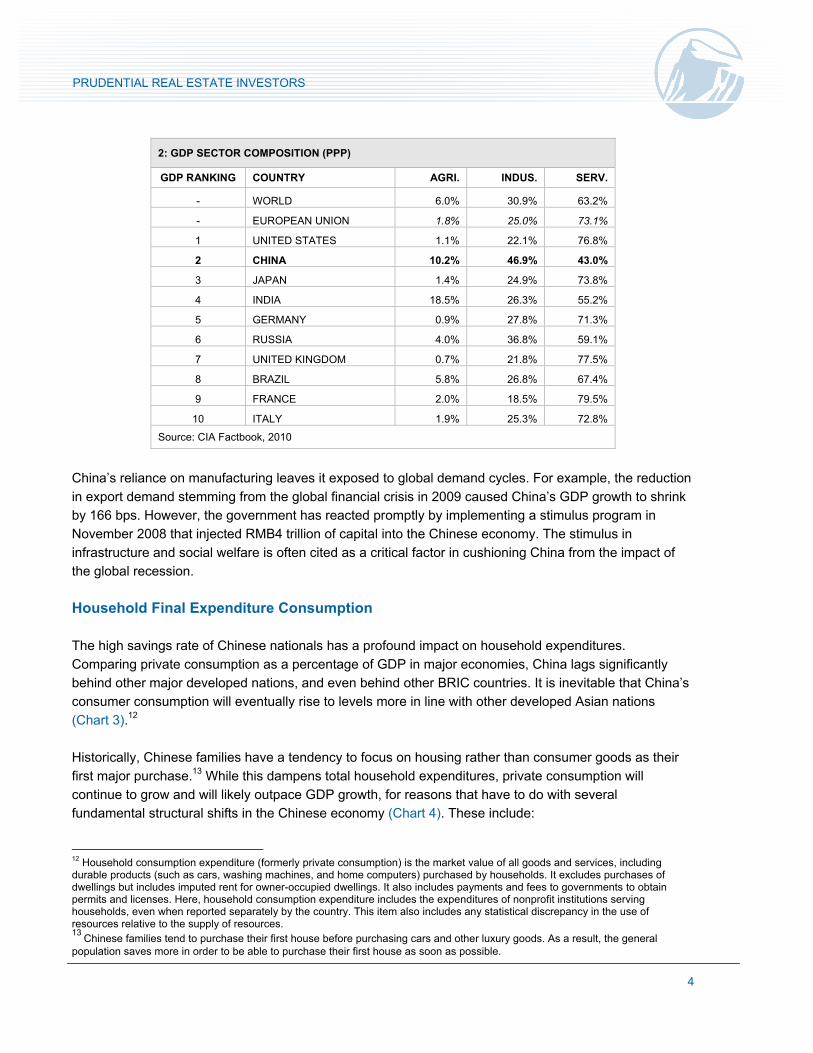
A breakdown of China’s GDP shows that the industrial sector is still the main economic driver, accounting
for 46.9% of the overall total,9 followed by the services sector 10 (43%) and agricultural sector11 (10.2%).
Compared to other mature markets, China’s economy remains oriented toward manufacturing and
production, with services trailing behind significantly as a portion of GDP (Chart 2). However, the Chinese
government intends to move from labor-intensive industries to more skill-oriented industries. As a result,
services will emerge as another key pillar for the economy.
7 GDP (Purchasing Power Parity) ranked by the IMF 8 Between 2001 and 2016, the IMF projects GDP growth of 8.7% in China. 4.3% in Brazil, 4.2% in Russia and 7.6% India. 9 CIA World Fact Book – The industrial sector is involved with the production of goods (including fuels and fertilizers and the mining and extraction sectors). 10 CIA World Fact Book – The services sector is the non-material equivalent of a good. Service provision is defined as an economic activity that does not result in ownership. The sector includes (but is not limited to) farm and factory related activities. 11 CIA World Fact Book – The agricultural sector is the process of producing food, feed, fiber and other goods by the systematic raising of plants and animals.
$0
$2
$4
$6
$8
$10
$12
$14
INDIA RUSSIA BRAZIL CHINA
Source: IMF
4
PRUDENTIAL REAL ESTATE INVESTORS
2: GDP SECTOR COMPOSITION (PPP)
GDP RANKING COUNTRY AGRI. INDUS. SERV.
- WORLD 6.0% 30.9% 63.2%
- EUROPEAN UNION 1.8% 25.0% 73.1%
1 UNITED STATES 1.1% 22.1% 76.8%
2 CHINA 10.2% 46.9% 43.0%
3 JAPAN 1.4% 24.9% 73.8%
4 INDIA 18.5% 26.3% 55.2%
5 GERMANY 0.9% 27.8% 71.3%
6 RUSSIA 4.0% 36.8% 59.1%
7 UNITED KINGDOM 0.7% 21.8% 77.5%
8 BRAZIL 5.8% 26.8% 67.4%
9 FRANCE 2.0% 18.5% 79.5%
10 ITALY 1.9% 25.3% 72.8%
Source: CIA Factbook, 2010
China’s reliance on manufacturing leaves it exposed to global demand cycles. For example, the reduction
in export demand stemming from the global financial crisis in 2009 caused China’s GDP growth to shrink
by 166 bps. However, the government has reacted promptly by implementing a stimulus program in
November 2008 that injected RMB4 trillion of capital into the Chinese economy. The stimulus in
infrastructure and social welfare is often cited as a critical factor in cushioning China from the impact of
the global recession.
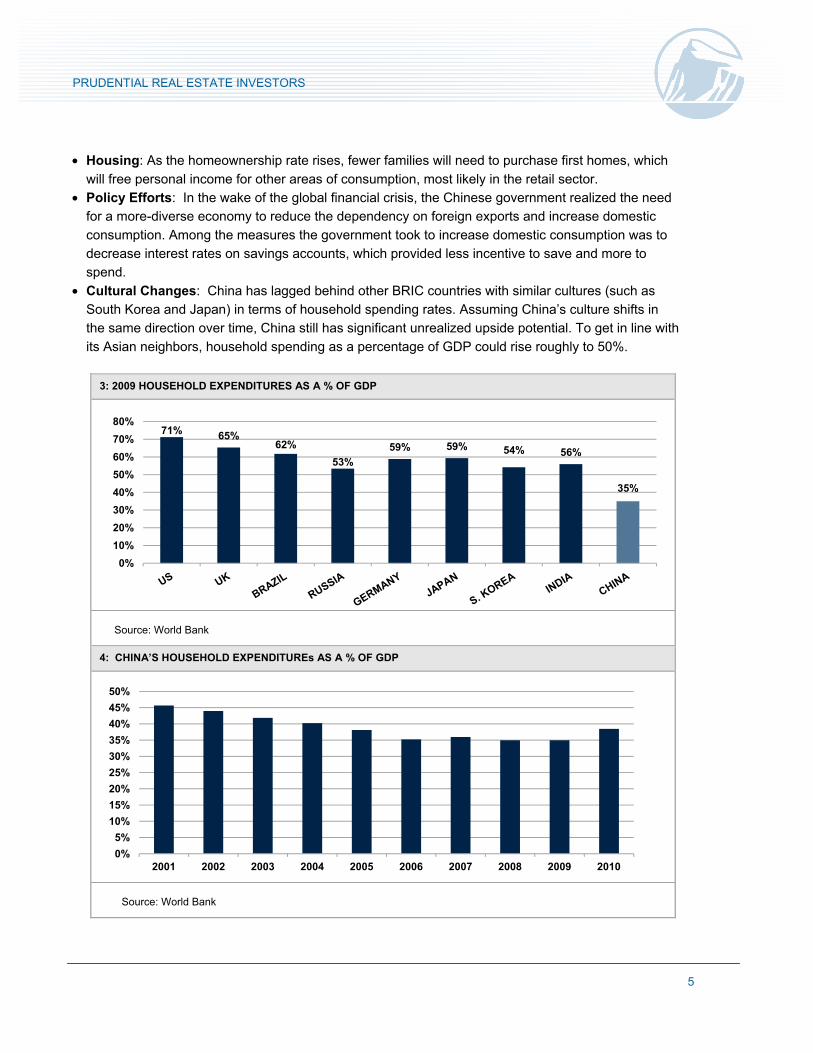
Household Final Expenditure Consumption
The high savings rate of Chinese nationals has a profound impact on household expenditures.
Comparing private consumption as a percentage of GDP in major economies, China lags significantly
behind other major developed nations, and even behind other BRIC countries. It is inevitable that China’s
consumer consumption will eventually rise to levels more in line with other developed Asian nations
(Chart 3).12
Historically, Chinese families have a tendency to focus on housing rather than consumer goods as their
first major purchase.13 While this dampens total household expenditures, private consumption will
continue to grow and will likely outpace GDP growth, for reasons that have to do with several
fundamental structural shifts in the Chinese economy (Chart 4). These include:
12 Household consumption expenditure (formerly private consumption) is the market value of all goods and services, including durable products (such as cars, washing machines, and home computers) purchased by households. It excludes purchases of dwellings but includes imputed rent for owner-occupied dwellings. It also includes payments and fees to governments to obtain permits and licenses. Here, household consumption expenditure includes the expenditures of nonprofit institutions serving households, even when reported separately by the country. This item also includes any statistical discrepancy in the use of resources relative to the supply of resources. 13
Chinese families tend to purchase their first house before purchasing cars and other luxury goods. As a result, the general population saves more in order to be able to purchase their first house as soon as possible.
5
PRUDENTIAL REAL ESTATE INVESTORS
• Housing: As the homeownership rate rises, fewer families will need to purchase first homes, which
will free personal income for other areas of consumption, most likely in the retail sector.
• Policy Efforts: In the wake of the global financial crisis, the Chinese government realized the need
for a more-diverse economy to reduce the dependency on foreign exports and increase domestic
consumption. Among the measures the government took to increase domestic consumption was to
decrease interest rates on savings accounts, which provided less incentive to save and more to
spend.
• Cultural Changes: China has lagged behind other BRIC countries with similar cultures (such as
South Korea and Japan) in terms of household spending rates. Assuming China’s culture shifts in
the same direction over time, China still has significant unrealized upside potential. To get in line with
its Asian neighbors, household spending as a percentage of GDP could rise roughly to 50%.
3: 2009 HOUSEHOLD EXPENDITURES AS A % OF GDP
4: CHINA’S HOUSEHOLD EXPENDITUREs AS A % OF GDP
71% 65%62%
53%
59% 59% 54% 56%
35%
0%
10%
20%
30%
40%
50%
60%
70%
80%
Source: World Bank
0%
5%
10%
15%
20%
25%
30%
35%
40%
45%
50%
2001 2002 2003 2004 2005 2006 2007 2008 2009 2010
Source: World Bank
6
PRUDENTIAL REAL ESTATE INVESTORS
12th Five-Year Plan - Implication for Real Estate Markets
Planning is a key characteristic of the Chinese economy. China’s five-year plans are a series of economic
development initiatives shaped by the Communist Party of China (CPC) through the plenary sessions of
the Central Committee and National Congresses. The party plays a leading role in mapping economic
development, setting growth targets and launching reforms.
The twelfth five-year plan, approved in March 2011, seeks to address rising inequality and domestic
consumption, and to improve social infrastructure and social safety nets. The plan maps the
government’s effort to rebalance the economy. It shifts the emphasis from investment to consumption and
from urban and coastal growth to rural and inland development. The plan also continues the prior plan’s
effort to enhance environmental protection, accelerate the process of openness and reform, and to
emphasize Hong Kong's role as a center of international finance (Chart 5).
5: 12th FIVE-YEAR PLAN: INITIATIVES AND IMPLICATIONS
Initiative Sector Affected Implications for Real Estate
Population controlled below 1.39 billion Social Continued need for housing
Urbanization rate to 51.5% Social Increase in urban and housing development
36 million new affordable apartments Social Government-built subsidized housing
Value-added output of emerging strategic industries to account for 8% of GDP
Economic Growth in commercial, industrial development leading to an increase in investable stock
Foreign investment welcomed in agriculture, high-tech and environment protection industries
Economic Demand in R&D and industrial space
Coastal regions to turn from "world's factory" to hubs of R&D, high-end manufacturing and service sector
Economic Demand in R&D, industrial, and commercial space
Construction of large-scale hydropower plants in southwest China
Economic Greater power capacity driving urban growth and creating demand in housing
Length of high-speed railway to reach 45,000 km
Infrastructure Second- and third-tier cities to grow faster
Length of highway network to reach 83,000 km
Infrastructure Second- and third-tier cities to grow faster
New airport built in Beijing Infrastructure Growth in Beijing real estate, city boundary
Nuclear power to be developed more efficiently to ensure safety
Environmental Ensure that power capacity increases in line with the target rate of growth
Source: Prudential Real Estate Investors
7
PRUDENTIAL REAL ESTATE INVESTORS
Capital Markets
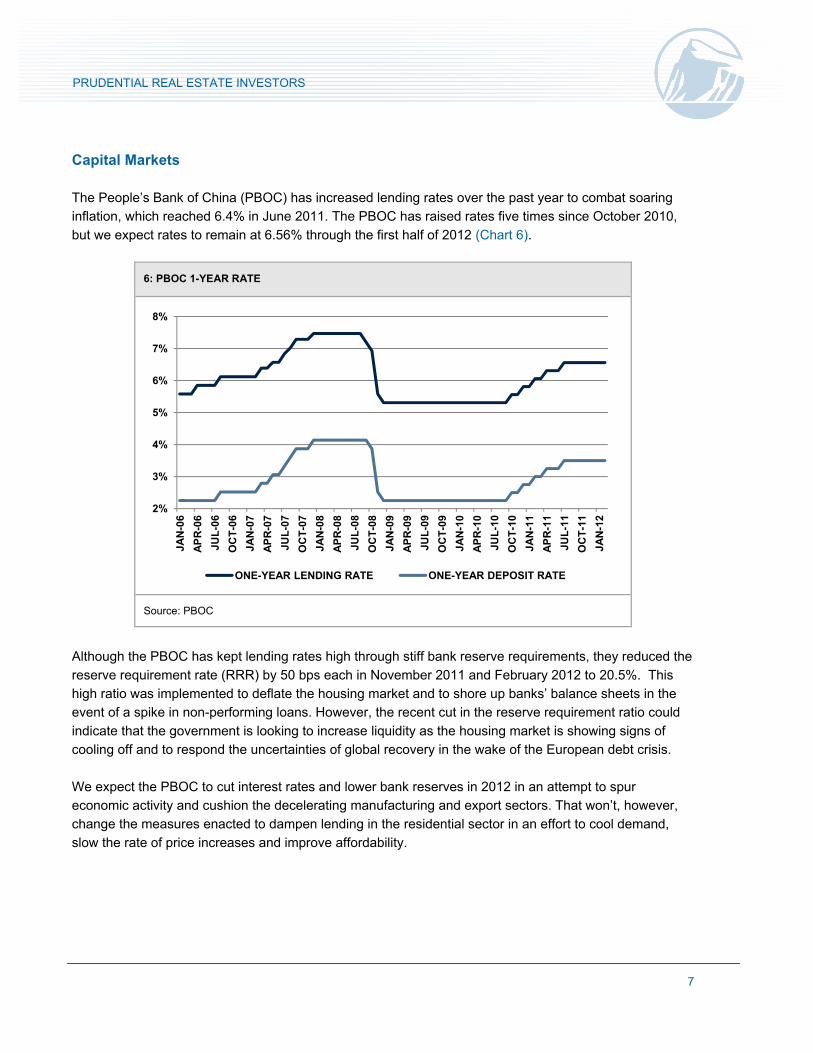
The People’s Bank of China (PBOC) has increased lending rates over the past year to combat soaring
inflation, which reached 6.4% in June 2011. The PBOC has raised rates five times since October 2010,
but we expect rates to remain at 6.56% through the first half of 2012 (Chart 6).
6: PBOC 1-YEAR RATE
Source: PBOC
Although the PBOC has kept lending rates high through stiff bank reserve requirements, they reduced the
reserve requirement rate (RRR) by 50 bps each in November 2011 and February 2012 to 20.5%. This
high ratio was implemented to deflate the housing market and to shore up banks’ balance sheets in the
event of a spike in non-performing loans. However, the recent cut in the reserve requirement ratio could
indicate that the government is looking to increase liquidity as the housing market is showing signs of
cooling off and to respond the uncertainties of global recovery in the wake of the European debt crisis.
We expect the PBOC to cut interest rates and lower bank reserves in 2012 in an attempt to spur
economic activity and cushion the decelerating manufacturing and export sectors. That won’t, however,
change the measures enacted to dampen lending in the residential sector in an effort to cool demand,
slow the rate of price increases and improve affordability.
2%
3%
4%
5%
6%
7%
8%
JAN
-06
AP
R-0
6
JUL
-06
OC
T-0
6
JAN
-07
AP
R-0
7
JUL
-07
OC
T-0
7
JAN
-08
AP
R-0
8
JUL
-08
OC
T-0
8
JAN
-09
AP
R-0
9
JUL
-09
OC
T-0
9
JAN
-10
AP
R-1
0
JUL
-10
OC
T-1
0
JAN
-11
AP
R-1
1
JUL
-11
OC
T-1
1
JAN
-12
ONE-YEAR LENDING RATE ONE-YEAR DEPOSIT RATE
8
PRUDENTIAL REAL ESTATE INVESTORS
Macro Risks
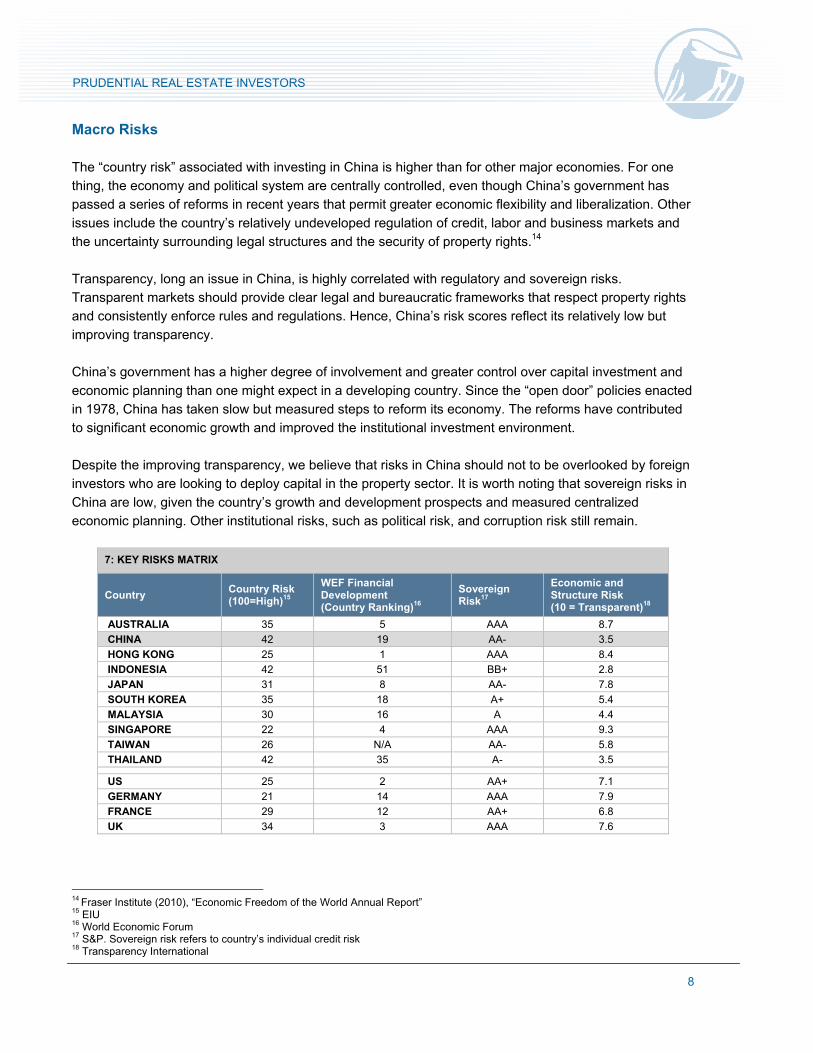
The “country risk” associated with investing in China is higher than for other major economies. For one
thing, the economy and political system are centrally controlled, even though China’s government has
passed a series of reforms in recent years that permit greater economic flexibility and liberalization. Other
issues include the country’s relatively undeveloped regulation of credit, labor and business markets and
the uncertainty surrounding legal structures and the security of property rights.14
Transparency, long an issue in China, is highly correlated with regulatory and sovereign risks.
Transparent markets should provide clear legal and bureaucratic frameworks that respect property rights
and consistently enforce rules and regulations. Hence, China’s risk scores reflect its relatively low but
improving transparency.
China’s government has a higher degree of involvement and greater control over capital investment and
economic planning than one might expect in a developing country. Since the “open door” policies enacted
in 1978, China has taken slow but measured steps to reform its economy. The reforms have contributed
to significant economic growth and improved the institutional investment environment.
Despite the improving transparency, we believe that risks in China should not to be overlooked by foreign
investors who are looking to deploy capital in the property sector. It is worth noting that sovereign risks in
China are low, given the country’s growth and development prospects and measured centralized
economic planning. Other institutional risks, such as political risk, and corruption risk still remain.
7: KEY RISKS MATRIX
Country Country Risk (100=High)15
WEF Financial Development (Country Ranking)16
Sovereign Risk17
Economic and Structure Risk (10 = Transparent)18
AUSTRALIA 35 5 AAA 8.7
CHINA 42 19 AA- 3.5
HONG KONG 25 1 AAA 8.4
INDONESIA 42 51 BB+ 2.8
JAPAN 31 8 AA- 7.8
SOUTH KOREA 35 18 A+ 5.4
MALAYSIA 30 16 A 4.4
SINGAPORE 22 4 AAA 9.3
TAIWAN 26 N/A AA- 5.8
THAILAND 42 35 A- 3.5
US 25 2 AA+ 7.1
GERMANY 21 14 AAA 7.9
FRANCE 29 12 AA+ 6.8
UK 34 3 AAA 7.6
14 Fraser Institute (2010), “Economic Freedom of the World Annual Report” 15 EIU 16 World Economic Forum 17 S&P. Sovereign risk refers to country’s individual credit risk 18 Transparency International
9
PRUDENTIAL REAL ESTATE INVESTORS
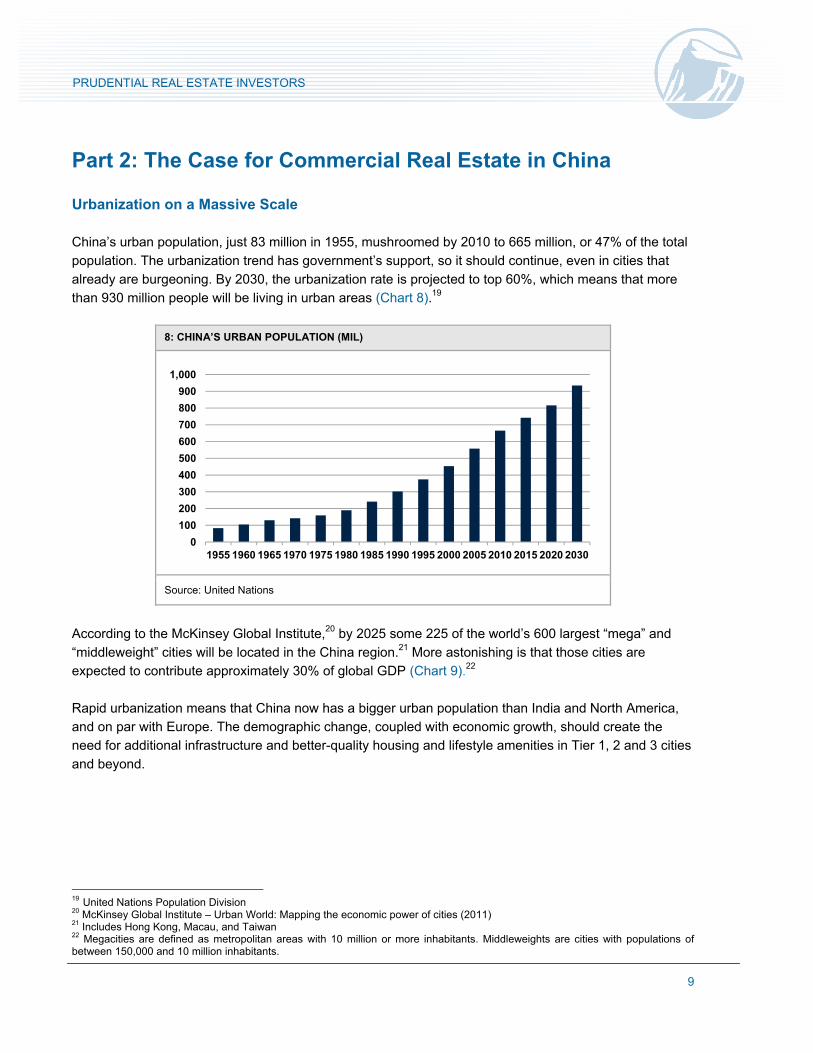
Part 2: The Case for Commercial Real Estate in China Urbanization on a Massive Scale China’s urban population, just 83 million in 1955, mushroomed by 2010 to 665 million, or 47% of the total
population. The urbanization trend has government’s support, so it should continue, even in cities that
already are burgeoning. By 2030, the urbanization rate is projected to top 60%, which means that more
than 930 million people will be living in urban areas (Chart 8).19
8: CHINA’S URBAN POPULATION (MIL)
Source: United Nations
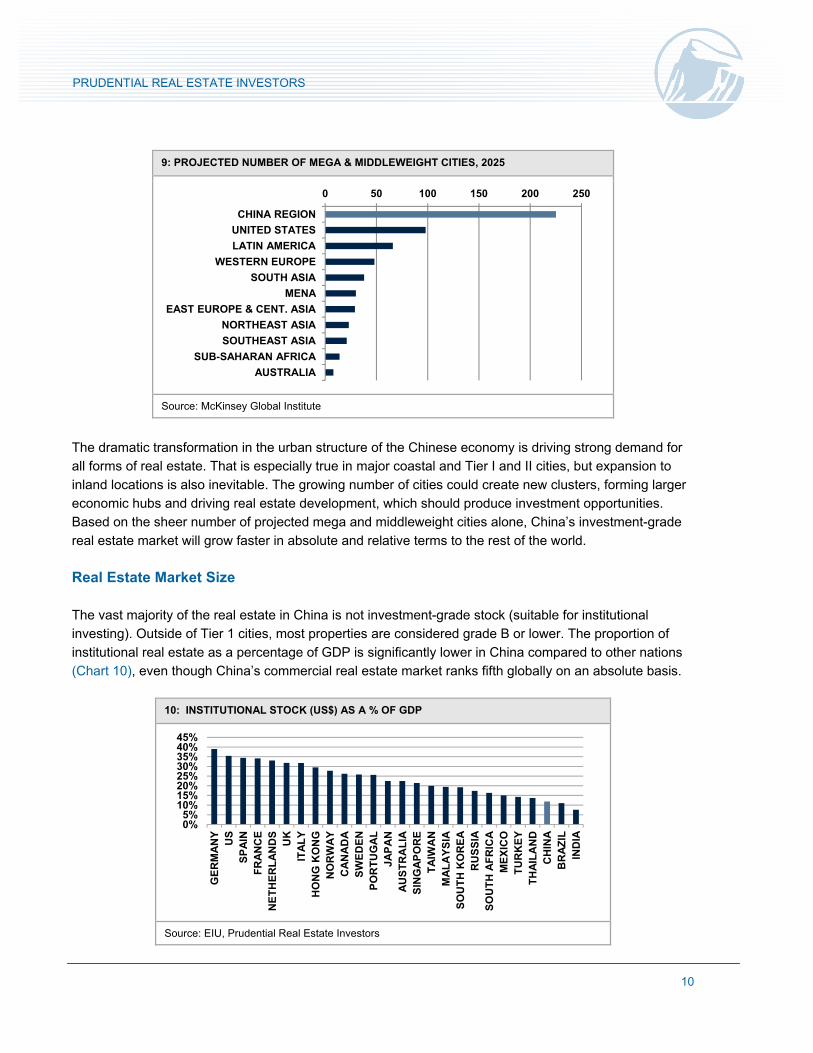
According to the McKinsey Global Institute,20 by 2025 some 225 of the world’s 600 largest “mega” and
“middleweight” cities will be located in the China region.21 More astonishing is that those cities are
expected to contribute approximately 30% of global GDP (Chart 9).22
Rapid urbanization means that China now has a bigger urban population than India and North America,
and on par with Europe. The demographic change, coupled with economic growth, should create the
need for additional infrastructure and better-quality housing and lifestyle amenities in Tier 1, 2 and 3 cities
and beyond.
19 United Nations Population Division 20 McKinsey Global Institute – Urban World: Mapping the economic power of cities (2011) 21 Includes Hong Kong, Macau, and Taiwan 22 Megacities are defined as metropolitan areas with 10 million or more inhabitants. Middleweights are cities with populations of between 150,000 and 10 million inhabitants.
0
100
200
300
400
500
600
700
800
900
1,000
1955 1960 1965 1970 1975 1980 1985 1990 1995 2000 2005 2010 2015 2020 2030
10
PRUDENTIAL REAL ESTATE INVESTORS
9: PROJECTED NUMBER OF MEGA & MIDDLEWEIGHT CITIES, 2025
Source: McKinsey Global Institute
The dramatic transformation in the urban structure of the Chinese economy is driving strong demand for
all forms of real estate. That is especially true in major coastal and Tier I and II cities, but expansion to
inland locations is also inevitable. The growing number of cities could create new clusters, forming larger
economic hubs and driving real estate development, which should produce investment opportunities.
Based on the sheer number of projected mega and middleweight cities alone, China’s investment-grade
real estate market will grow faster in absolute and relative terms to the rest of the world.
Real Estate Market Size The vast majority of the real estate in China is not investment-grade stock (suitable for institutional
investing). Outside of Tier 1 cities, most properties are considered grade B or lower. The proportion of
institutional real estate as a percentage of GDP is significantly lower in China compared to other nations
(Chart 10), even though China’s commercial real estate market ranks fifth globally on an absolute basis.
10: INSTITUTIONAL STOCK (US$) AS A % OF GDP
Source: EIU, Prudential Real Estate Investors
0 50 100 150 200 250
CHINA REGION
UNITED STATES
LATIN AMERICA
WESTERN EUROPE
SOUTH ASIA
MENA
EAST EUROPE & CENT. ASIA
NORTHEAST ASIA
SOUTHEAST ASIA
SUB-SAHARAN AFRICA
AUSTRALIA
0%5%
10%15%20%25%30%35%40%45%
GE
RM
AN
YU
SS
PA
INF
RA
NC
EN
ET
HE
RL
AN
DS
UK
ITA
LY
HO
NG
KO
NG
NO
RW
AY
CA
NA
DA
SW
ED
EN
PO
RT
UG
AL
JAP
AN
AU
ST
RA
LIA
SIN
GA
PO
RE
TA
IWA
NM
AL
AY
SIA
SO
UT
H K
OR
EA
RU
SS
IAS
OU
TH
AF
RIC
AM
EX
ICO
TU
RK
EY
TH
AIL
AN
DC
HIN
AB
RA
ZIL
IND
I A
11
PRUDENTIAL REAL ESTATE INVESTORS
In general, commercial buildings in China have lower standards than developed markets such as the US,
Japan, Hong Kong, Singapore and Western Europe. However, the rapid rate of growth and urbanization
will create development opportunities and move China up in the global rankings.
The lack of available institutional supply has made the real estate market highly attractive relative to
demand from both domestic and foreign investors. That has led property values to increase over the past
decade; a trend is likely to continue for a long time. Domestic investors generally are flush with low-cost
capital, which enables them to outbid foreign rivals. The dearth of suitable stock limits the number of
property trades, as investors do not want to sell without being confident that there is product to buy. The
upshot is that most real estate investors are long-term holders. The lack of suitable stock benefits
developers who have access to the land bank and have been able to build institutional-quality assets.
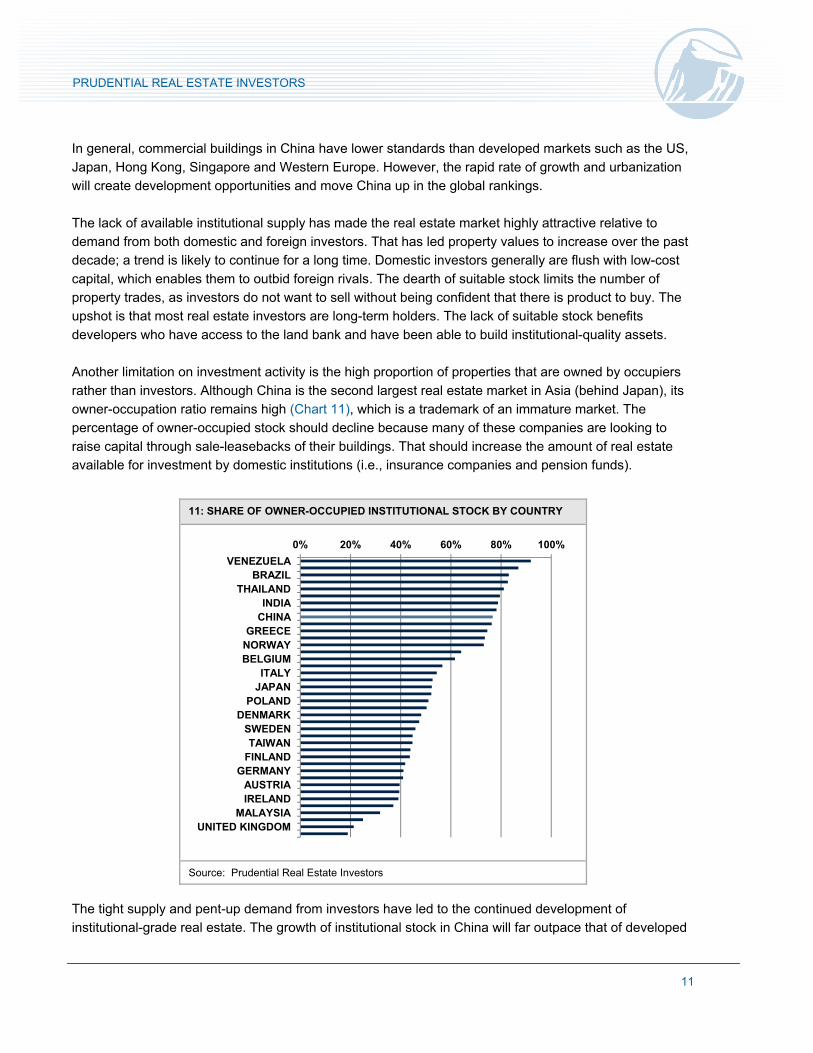
Another limitation on investment activity is the high proportion of properties that are owned by occupiers
rather than investors. Although China is the second largest real estate market in Asia (behind Japan), its
owner-occupation ratio remains high (Chart 11), which is a trademark of an immature market. The
percentage of owner-occupied stock should decline because many of these companies are looking to
raise capital through sale-leasebacks of their buildings. That should increase the amount of real estate
available for investment by domestic institutions (i.e., insurance companies and pension funds).
The tight supply and pent-up demand from investors have led to the continued development of
institutional-grade real estate. The growth of institutional stock in China will far outpace that of developed
11: SHARE OF OWNER-OCCUPIED INSTITUTIONAL STOCK BY COUNTRY
Source: Prudential Real Estate Investors
0% 20% 40% 60% 80% 100%
VENEZUELABRAZIL
THAILANDINDIA
CHINAGREECE
NORWAYBELGIUM
ITALYJAPAN
POLANDDENMARK
SWEDENTAIWAN
FINLANDGERMANY
AUSTRIAIRELAND
MALAYSIAUNITED KINGDOM
12
PRUDENTIAL REAL ESTATE INVESTORS
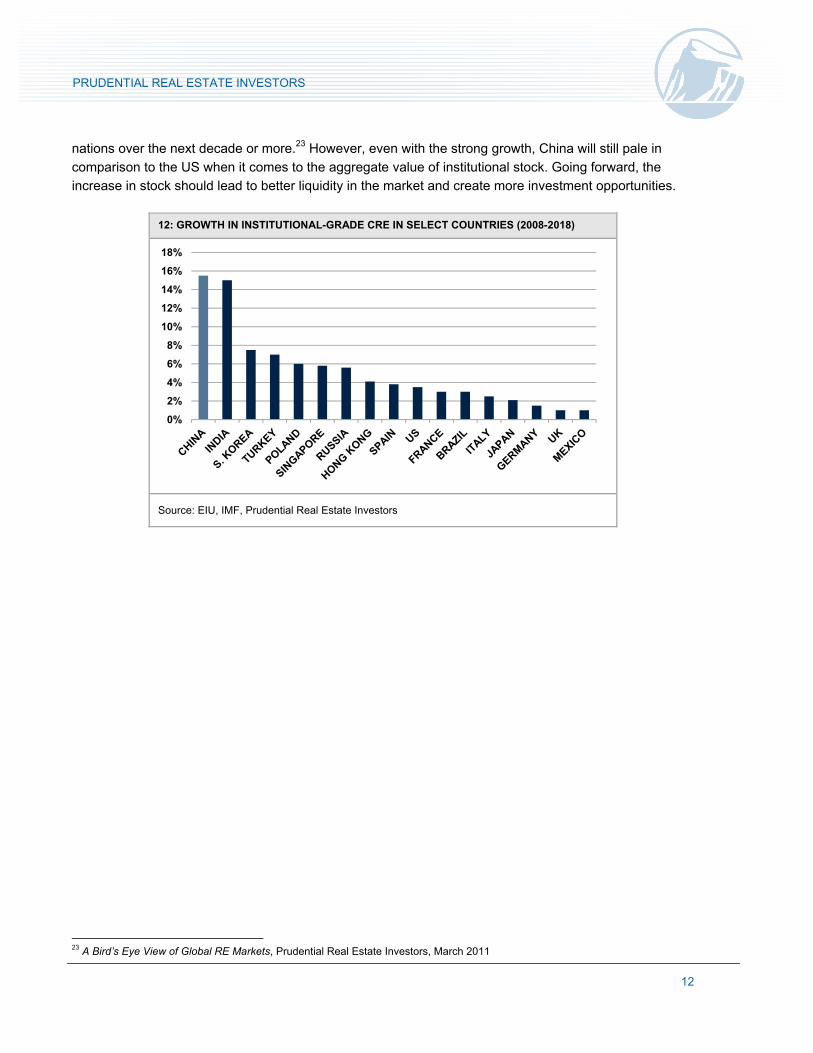
nations over the next decade or more.23 However, even with the strong growth, China will still pale in
comparison to the US when it comes to the aggregate value of institutional stock. Going forward, the
increase in stock should lead to better liquidity in the market and create more investment opportunities.
12: GROWTH IN INSTITUTIONAL-GRADE CRE IN SELECT COUNTRIES (2008-2018)
Source: EIU, IMF, Prudential Real Estate Investors
23 A Bird’s Eye View of Global RE Markets, Prudential Real Estate Investors, March 2011
0%
2%
4%
6%
8%
10%
12%
14%
16%
18%
13
PRUDENTIAL REAL ESTATE INVESTORS
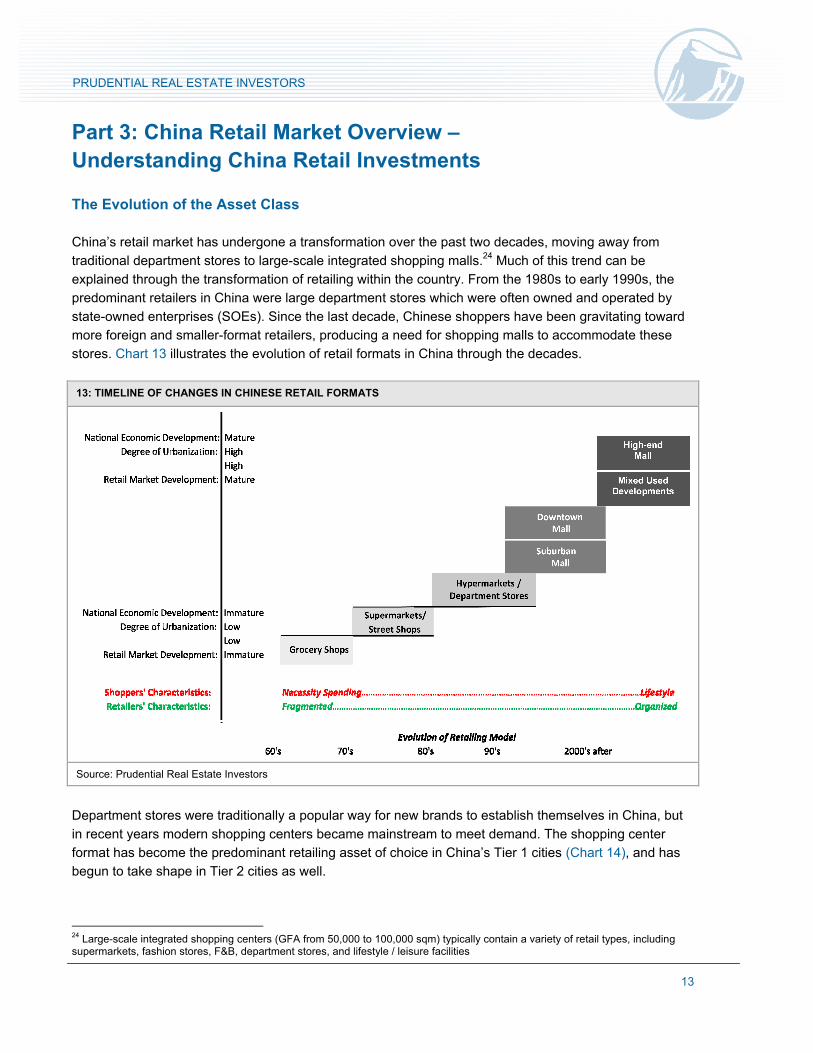
Part 3: China Retail Market Overview – Understanding China Retail Investments The Evolution of the Asset Class China’s retail market has undergone a transformation over the past two decades, moving away from
traditional department stores to large-scale integrated shopping malls.24 Much of this trend can be
explained through the transformation of retailing within the country. From the 1980s to early 1990s, the
predominant retailers in China were large department stores which were often owned and operated by
state-owned enterprises (SOEs). Since the last decade, Chinese shoppers have been gravitating toward
more foreign and smaller-format retailers, producing a need for shopping malls to accommodate these
stores. Chart 13 illustrates the evolution of retail formats in China through the decades.
13: TIMELINE OF CHANGES IN CHINESE RETAIL FORMATS
Source: Prudential Real Estate Investors
Department stores were traditionally a popular way for new brands to establish themselves in China, but
in recent years modern shopping centers became mainstream to meet demand. The shopping center
format has become the predominant retailing asset of choice in China’s Tier 1 cities (Chart 14), and has
begun to take shape in Tier 2 cities as well.
24 Large-scale integrated shopping centers (GFA from 50,000 to 100,000 sqm) typically contain a variety of retail types, including supermarkets, fashion stores, F&B, department stores, and lifestyle / leisure facilities
14
PRUDENTIAL REAL ESTATE INVESTORS
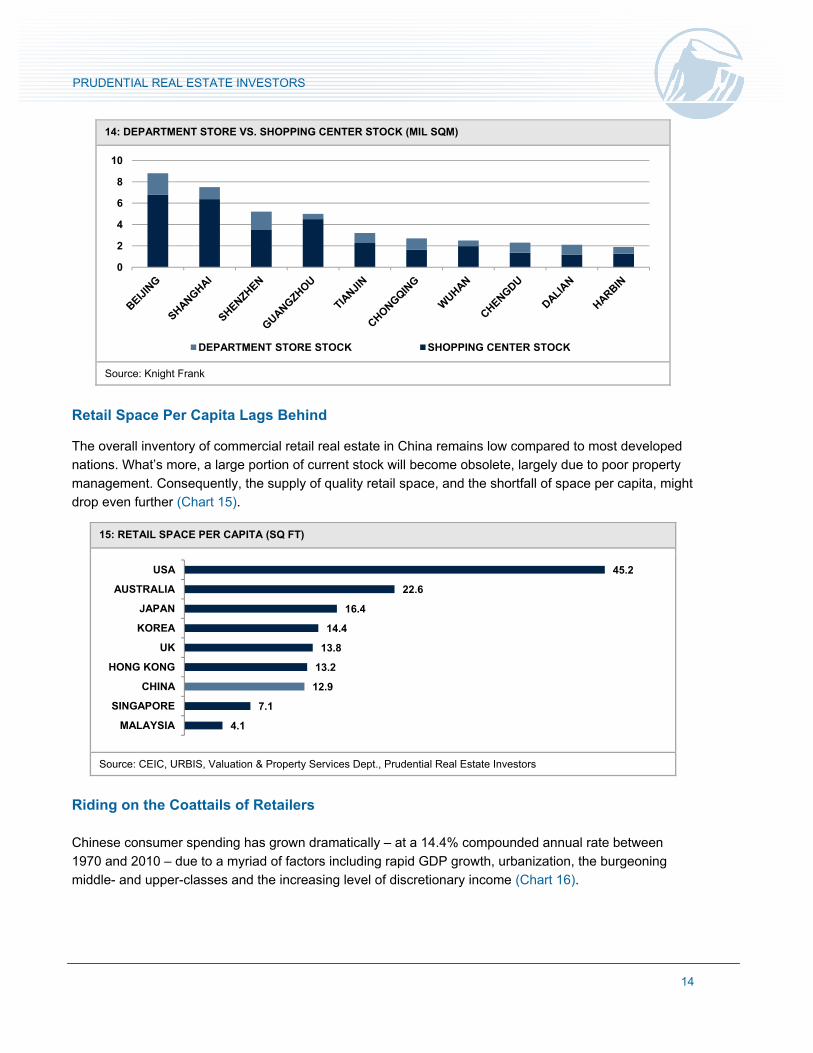
14: DEPARTMENT STORE VS. SHOPPING CENTER STOCK (MIL SQM)
Source: Knight Frank
Retail Space Per Capita Lags Behind
The overall inventory of commercial retail real estate in China remains low compared to most developed
nations. What’s more, a large portion of current stock will become obsolete, largely due to poor property
management. Consequently, the supply of quality retail space, and the shortfall of space per capita, might
drop even further (Chart 15).
15: RETAIL SPACE PER CAPITA (SQ FT)
Source: CEIC, URBIS, Valuation & Property Services Dept., Prudential Real Estate Investors
Riding on the Coattails of Retailers
Chinese consumer spending has grown dramatically – at a 14.4% compounded annual rate between
1970 and 2010 – due to a myriad of factors including rapid GDP growth, urbanization, the burgeoning
middle- and upper-classes and the increasing level of discretionary income (Chart 16).
0
2
4
6
8
10
DEPARTMENT STORE STOCK SHOPPING CENTER STOCK
45.2
22.6
16.4
14.4
13.8
13.2
12.9
7.1
4.1
USA
AUSTRALIA
JAPAN
KOREA
UK
HONG KONG
CHINA
SINGAPORE
MALAYSIA

15
PRUDENTIAL REAL ESTATE INVESTORS
16: TOTAL RETAIL SALES IN CHINA (RMB TRIL)
Source: CEIC, Prudential Real Estate Investors
The Chinese government’s drive to stimulate domestic demand has propelled local retail sales to higher
levels. The National Bureau of Statistics announced that retail spending grew 17.1% in 2011, and
projected that retail sales will rise rapidly over the next several years due to urbanization and GDP growth
(Chart 17).
17: 2011 RETAIL SALES GROWTH FORECAST
Source: EIU, Prudential Real Estate Investors
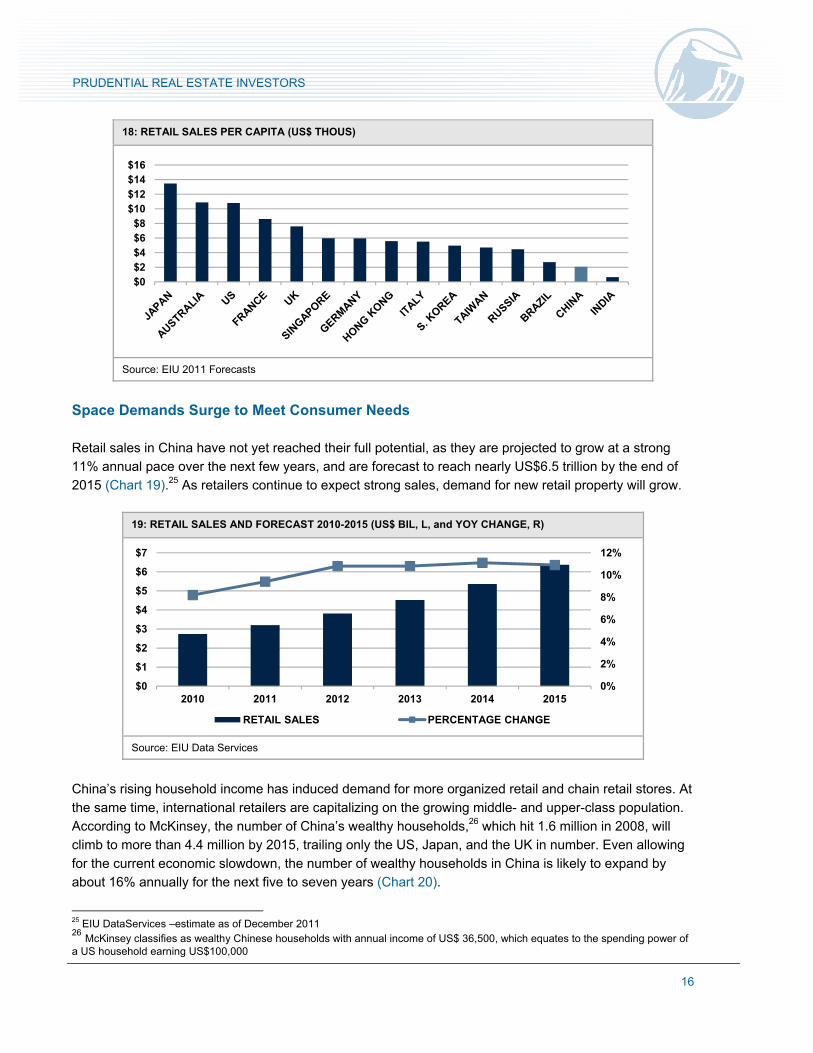
Despite the strong growth in aggregate retail sales, China still lags significantly behind most countries in
sales per capita (Chart 18). China retail sales are about US$2,000 per capita, third among BRIC
countries. China remains far behind developed nations, particularly Japan, which tops the category at
US$13,463. That leaves room for significant growth in China, which bodes well for real estate
investments in the retail sector.
0
2
4
6
8
10
12
14
16
1970
1972
1974
1976
1978
1980
1982
1984
1986
1988
1990
1992
1994
1996
1998
2000
2002
2004
2006
2008
2010
-10% -8% -6% -4% -2% 0% 2% 4% 6% 8% 10%
SPAINPORTUGALAUSTRALIA
IRELANDITALY
NETHERLANDSJAPAN
GERMANYFRANCE
UKSINGAPORE
KOREASWEDEN
USPOLAND
HONG KONGCHINA
16
PRUDENTIAL REAL ESTATE INVESTORS
18: RETAIL SALES PER CAPITA (US$ THOUS)
Source: EIU 2011 Forecasts Space Demands Surge to Meet Consumer Needs
Retail sales in China have not yet reached their full potential, as they are projected to grow at a strong
11% annual pace over the next few years, and are forecast to reach nearly US$6.5 trillion by the end of
2015 (Chart 19).25 As retailers continue to expect strong sales, demand for new retail property will grow.
19: RETAIL SALES AND FORECAST 2010-2015 (US$ BIL, L, and YOY CHANGE, R)
Source: EIU Data Services
China’s rising household income has induced demand for more organized retail and chain retail stores. At
the same time, international retailers are capitalizing on the growing middle- and upper-class population.
According to McKinsey, the number of China’s wealthy households,26 which hit 1.6 million in 2008, will
climb to more than 4.4 million by 2015, trailing only the US, Japan, and the UK in number. Even allowing
for the current economic slowdown, the number of wealthy households in China is likely to expand by
about 16% annually for the next five to seven years (Chart 20).
25 EIU DataServices –estimate as of December 2011 26 McKinsey classifies as wealthy Chinese households with annual income of US$ 36,500, which equates to the spending power of a US household earning US$100,000
$0$2$4$6$8
$10$12$14$16
0%
2%
4%
6%
8%
10%
12%
$0
$1
$2
$3
$4
$5
$6
$7
2010 2011 2012 2013 2014 2015
RETAIL SALES PERCENTAGE CHANGE
17
PRUDENTIAL REAL ESTATE INVESTORS
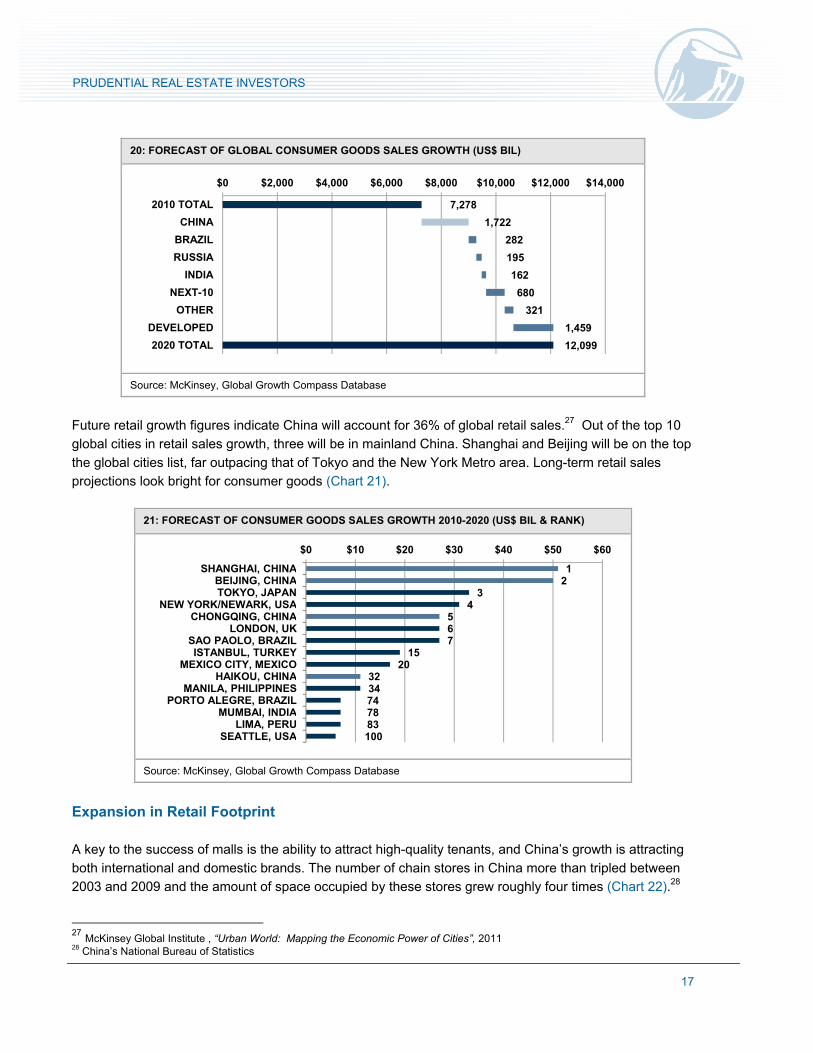
20: FORECAST OF GLOBAL CONSUMER GOODS SALES GROWTH (US$ BIL)
Source: McKinsey, Global Growth Compass Database
Future retail growth figures indicate China will account for 36% of global retail sales.27 Out of the top 10
global cities in retail sales growth, three will be in mainland China. Shanghai and Beijing will be on the top
the global cities list, far outpacing that of Tokyo and the New York Metro area. Long-term retail sales
projections look bright for consumer goods (Chart 21).
21: FORECAST OF CONSUMER GOODS SALES GROWTH 2010-2020 (US$ BIL & RANK)
Source: McKinsey, Global Growth Compass Database
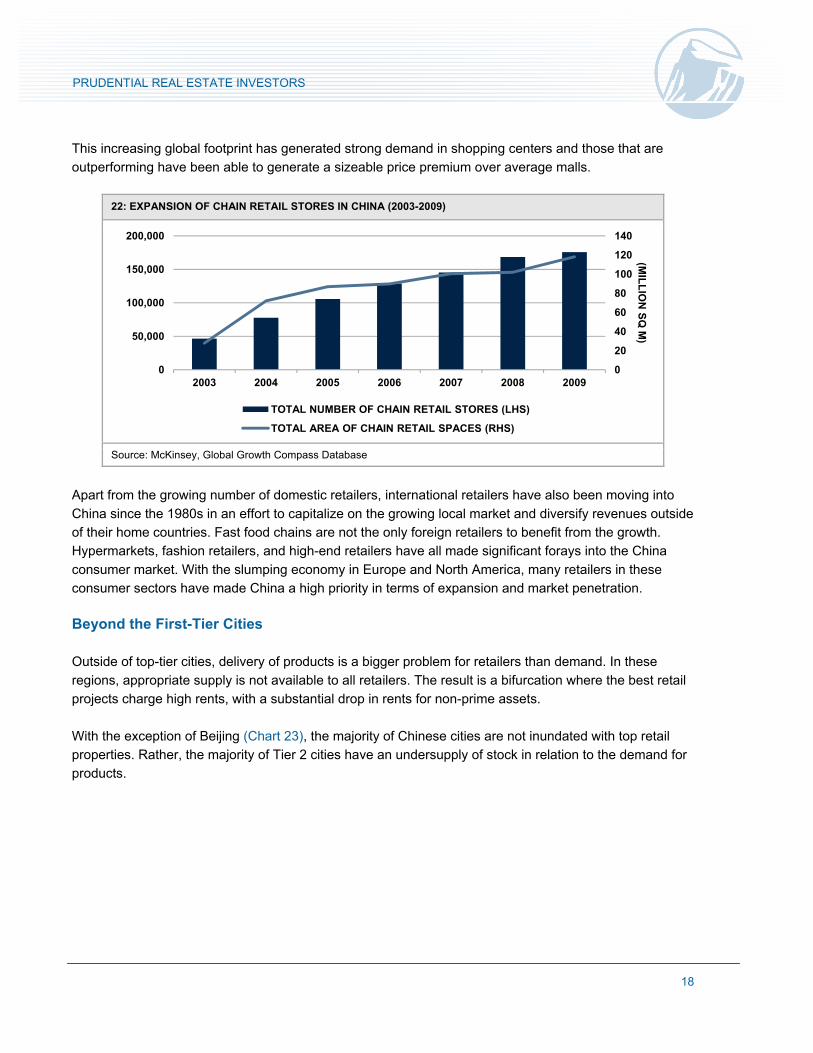
Expansion in Retail Footprint
A key to the success of malls is the ability to attract high-quality tenants, and China’s growth is attracting
both international and domestic brands. The number of chain stores in China more than tripled between
2003 and 2009 and the amount of space occupied by these stores grew roughly four times (Chart 22).28
27 McKinsey Global Institute , “Urban World: Mapping the Economic Power of Cities”, 2011 28 China’s National Bureau of Statistics
7,278
1,722
282
195
162
680
321
1,459
12,099
$0 $2,000 $4,000 $6,000 $8,000 $10,000 $12,000 $14,000
2010 TOTAL
CHINA
BRAZIL
RUSSIA
INDIA
NEXT-10
OTHER
DEVELOPED
2020 TOTAL
12
34
567
1520
3234747883100
$0 $10 $20 $30 $40 $50 $60
SHANGHAI, CHINABEIJING, CHINATOKYO, JAPAN
NEW YORK/NEWARK, USACHONGQING, CHINA
LONDON, UKSAO PAOLO, BRAZILISTANBUL, TURKEY
MEXICO CITY, MEXICOHAIKOU, CHINA
MANILA, PHILIPPINESPORTO ALEGRE, BRAZIL
MUMBAI, INDIALIMA, PERU
SEATTLE, USA
18
PRUDENTIAL REAL ESTATE INVESTORS
This increasing global footprint has generated strong demand in shopping centers and those that are
outperforming have been able to generate a sizeable price premium over average malls.
22: EXPANSION OF CHAIN RETAIL STORES IN CHINA (2003-2009)
Source: McKinsey, Global Growth Compass Database
Apart from the growing number of domestic retailers, international retailers have also been moving into
China since the 1980s in an effort to capitalize on the growing local market and diversify revenues outside
of their home countries. Fast food chains are not the only foreign retailers to benefit from the growth.
Hypermarkets, fashion retailers, and high-end retailers have all made significant forays into the China
consumer market. With the slumping economy in Europe and North America, many retailers in these
consumer sectors have made China a high priority in terms of expansion and market penetration.
Beyond the First-Tier Cities
Outside of top-tier cities, delivery of products is a bigger problem for retailers than demand. In these
regions, appropriate supply is not available to all retailers. The result is a bifurcation where the best retail
projects charge high rents, with a substantial drop in rents for non-prime assets.
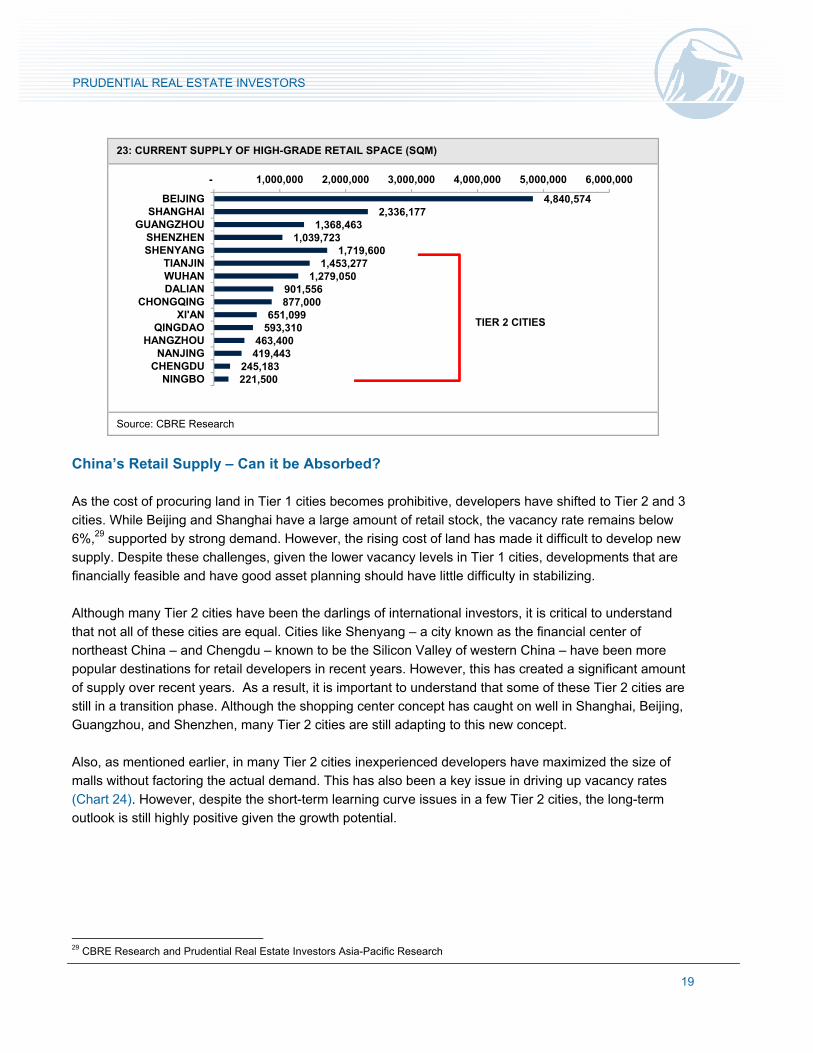
With the exception of Beijing (Chart 23), the majority of Chinese cities are not inundated with top retail
properties. Rather, the majority of Tier 2 cities have an undersupply of stock in relation to the demand for
products.
0
20
40
60
80
100
120
140
0
50,000
100,000
150,000
200,000
2003 2004 2005 2006 2007 2008 2009
(MIL
LIO
N S
Q M
)
TOTAL NUMBER OF CHAIN RETAIL STORES (LHS)
TOTAL AREA OF CHAIN RETAIL SPACES (RHS)
19
PRUDENTIAL REAL ESTATE INVESTORS
23: CURRENT SUPPLY OF HIGH-GRADE RETAIL SPACE (SQM)
Source: CBRE Research
China’s Retail Supply – Can it be Absorbed?
As the cost of procuring land in Tier 1 cities becomes prohibitive, developers have shifted to Tier 2 and 3
cities. While Beijing and Shanghai have a large amount of retail stock, the vacancy rate remains below
6%,29 supported by strong demand. However, the rising cost of land has made it difficult to develop new
supply. Despite these challenges, given the lower vacancy levels in Tier 1 cities, developments that are
financially feasible and have good asset planning should have little difficulty in stabilizing.
Although many Tier 2 cities have been the darlings of international investors, it is critical to understand
that not all of these cities are equal. Cities like Shenyang – a city known as the financial center of
northeast China – and Chengdu – known to be the Silicon Valley of western China – have been more
popular destinations for retail developers in recent years. However, this has created a significant amount
of supply over recent years. As a result, it is important to understand that some of these Tier 2 cities are
still in a transition phase. Although the shopping center concept has caught on well in Shanghai, Beijing,
Guangzhou, and Shenzhen, many Tier 2 cities are still adapting to this new concept.
Also, as mentioned earlier, in many Tier 2 cities inexperienced developers have maximized the size of
malls without factoring the actual demand. This has also been a key issue in driving up vacancy rates
(Chart 24). However, despite the short-term learning curve issues in a few Tier 2 cities, the long-term
outlook is still highly positive given the growth potential.
29 CBRE Research and Prudential Real Estate Investors Asia-Pacific Research
4,840,574 2,336,177
1,368,463 1,039,723
1,719,600 1,453,277
1,279,050 901,556 877,000
651,099 593,310
463,400 419,443
245,183 221,500
- 1,000,000 2,000,000 3,000,000 4,000,000 5,000,000 6,000,000
BEIJINGSHANGHAI
GUANGZHOUSHENZHENSHENYANG
TIANJINWUHANDALIAN
CHONGQINGXI'AN
QINGDAOHANGZHOU
NANJINGCHENGDU
NINGBO
TIER 2 CITIES
20
PRUDENTIAL REAL ESTATE INVESTORS
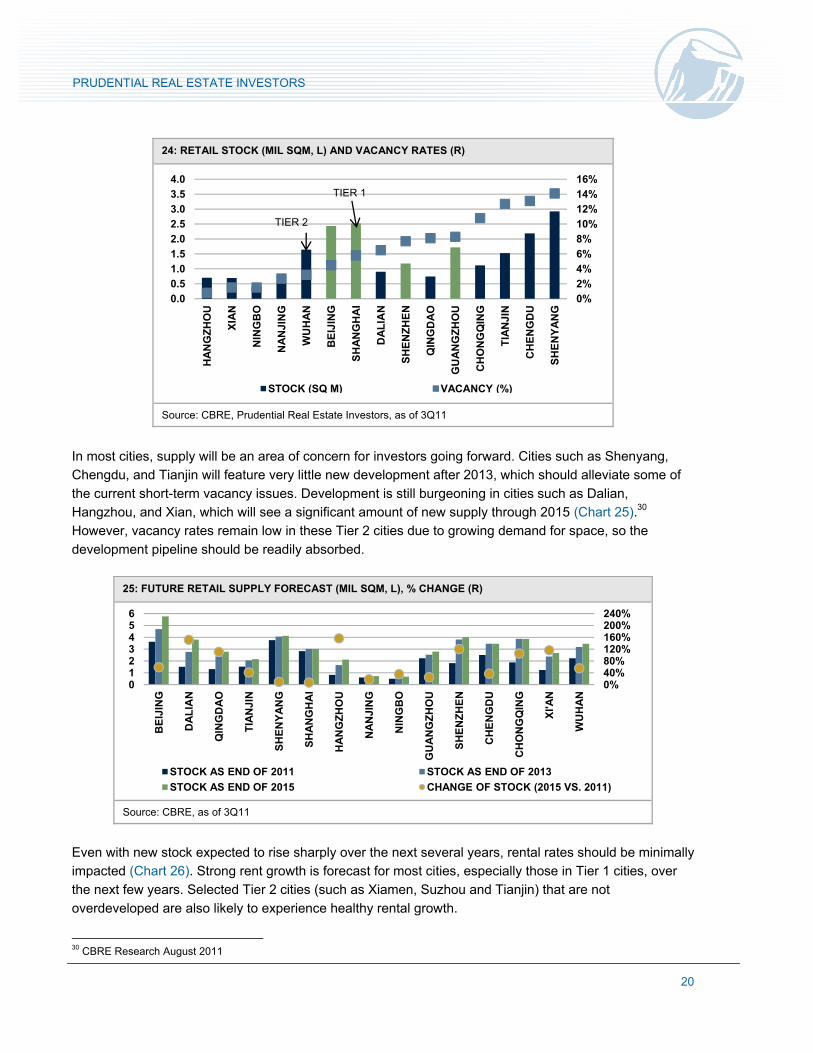
24: RETAIL STOCK (MIL SQM, L) AND VACANCY RATES (R)
Source: CBRE, Prudential Real Estate Investors, as of 3Q11
In most cities, supply will be an area of concern for investors going forward. Cities such as Shenyang,
Chengdu, and Tianjin will feature very little new development after 2013, which should alleviate some of
the current short-term vacancy issues. Development is still burgeoning in cities such as Dalian,
Hangzhou, and Xian, which will see a significant amount of new supply through 2015 (Chart 25).30
However, vacancy rates remain low in these Tier 2 cities due to growing demand for space, so the
development pipeline should be readily absorbed.
25: FUTURE RETAIL SUPPLY FORECAST (MIL SQM, L), % CHANGE (R)
Source: CBRE, as of 3Q11
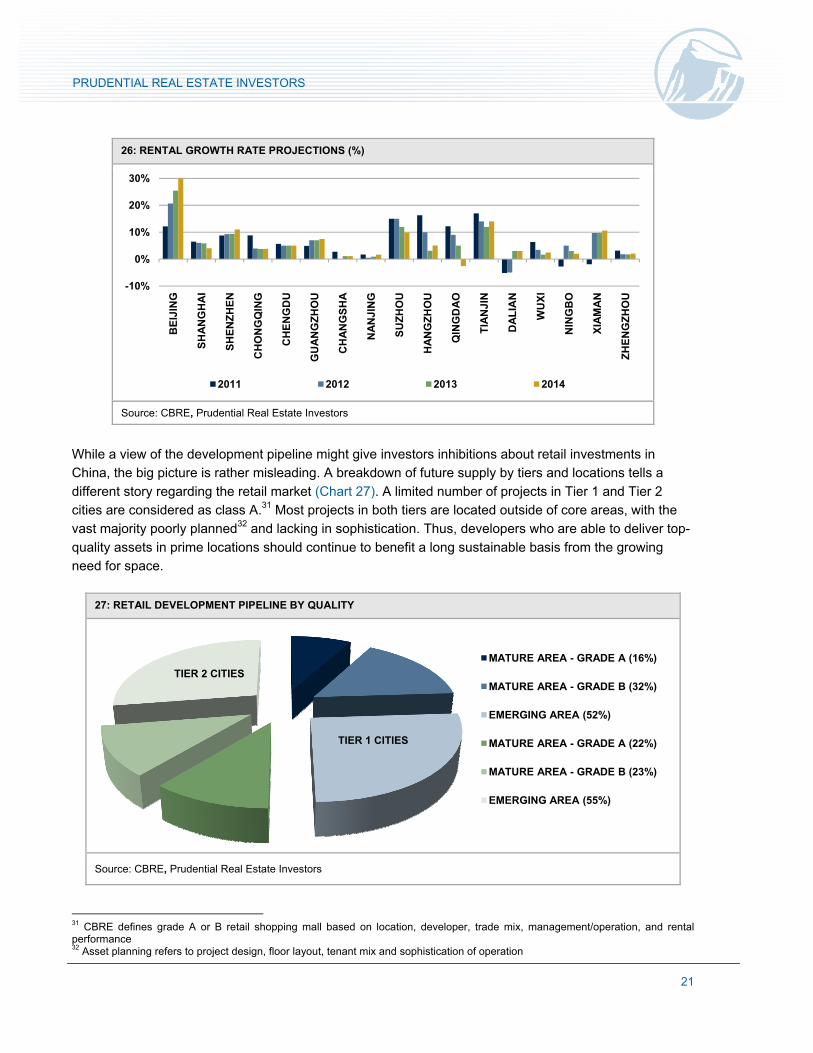
Even with new stock expected to rise sharply over the next several years, rental rates should be minimally
impacted (Chart 26). Strong rent growth is forecast for most cities, especially those in Tier 1 cities, over
the next few years. Selected Tier 2 cities (such as Xiamen, Suzhou and Tianjin) that are not
overdeveloped are also likely to experience healthy rental growth.
30 CBRE Research August 2011
0%
2%
4%
6%
8%
10%
12%
14%
16%
0.0
0.5
1.0
1.5
2.0
2.5
3.0
3.5
4.0
HA
NG
ZH
OU
XIA
N
NIN
GB
O
NA
NJI
NG
WU
HA
N
BE
IJIN
G
SH
AN
GH
AI
DA
LIA
N
SH
EN
ZH
EN
QIN
GD
AO
GU
AN
GZ
HO
U
CH
ON
GQ
ING
TIA
NJI
N
CH
EN
GD
U
SH
EN
YA
NG
STOCK (SQ M) VACANCY (%)
TIER 1
TIER 2
0%40%80%120%160%200%240%
0123456
BE
IJIN
G
DA
LIA
N
QIN
GD
AO
TIA
NJI
N
SH
EN
YA
NG
SH
AN
GH
AI
HA
NG
ZH
OU
NA
NJI
NG
NIN
GB
O
GU
AN
GZ
HO
U
SH
EN
ZH
EN
CH
EN
GD
U
CH
ON
GQ
ING
XI'A
N
WU
HA
N
STOCK AS END OF 2011 STOCK AS END OF 2013
STOCK AS END OF 2015 CHANGE OF STOCK (2015 VS. 2011)
21
PRUDENTIAL REAL ESTATE INVESTORS
26: RENTAL GROWTH RATE PROJECTIONS (%)
Source: CBRE, Prudential Real Estate Investors
While a view of the development pipeline might give investors inhibitions about retail investments in
China, the big picture is rather misleading. A breakdown of future supply by tiers and locations tells a
different story regarding the retail market (Chart 27). A limited number of projects in Tier 1 and Tier 2
cities are considered as class A.31 Most projects in both tiers are located outside of core areas, with the
vast majority poorly planned32 and lacking in sophistication. Thus, developers who are able to deliver top-
quality assets in prime locations should continue to benefit a long sustainable basis from the growing
need for space.
27: RETAIL DEVELOPMENT PIPELINE BY QUALITY
Source: CBRE, Prudential Real Estate Investors
31 CBRE defines grade A or B retail shopping mall based on location, developer, trade mix, management/operation, and rental performance 32 Asset planning refers to project design, floor layout, tenant mix and sophistication of operation
-10%
0%
10%
20%
30%B
EIJ
ING
SH
AN
GH
AI
SH
EN
ZH
EN
CH
ON
GQ
ING
CH
EN
GD
U
GU
AN
GZ
HO
U
CH
AN
GS
HA
NA
NJI
NG
SU
ZH
OU
HA
NG
ZH
OU
QIN
GD
AO
TIA
NJI
N
DA
LIA
N
WU
XI
NIN
GB
O
XIA
MA
N
ZH
EN
GZ
HO
U
2011 2012 2013 2014
MATURE AREA - GRADE A (16%)
MATURE AREA - GRADE B (32%)
EMERGING AREA (52%)
MATURE AREA - GRADE A (22%)
MATURE AREA - GRADE B (23%)
EMERGING AREA (55%)
TIER 2 CITIES
TIER 1 CITIES
22
PRUDENTIAL REAL ESTATE INVESTORS
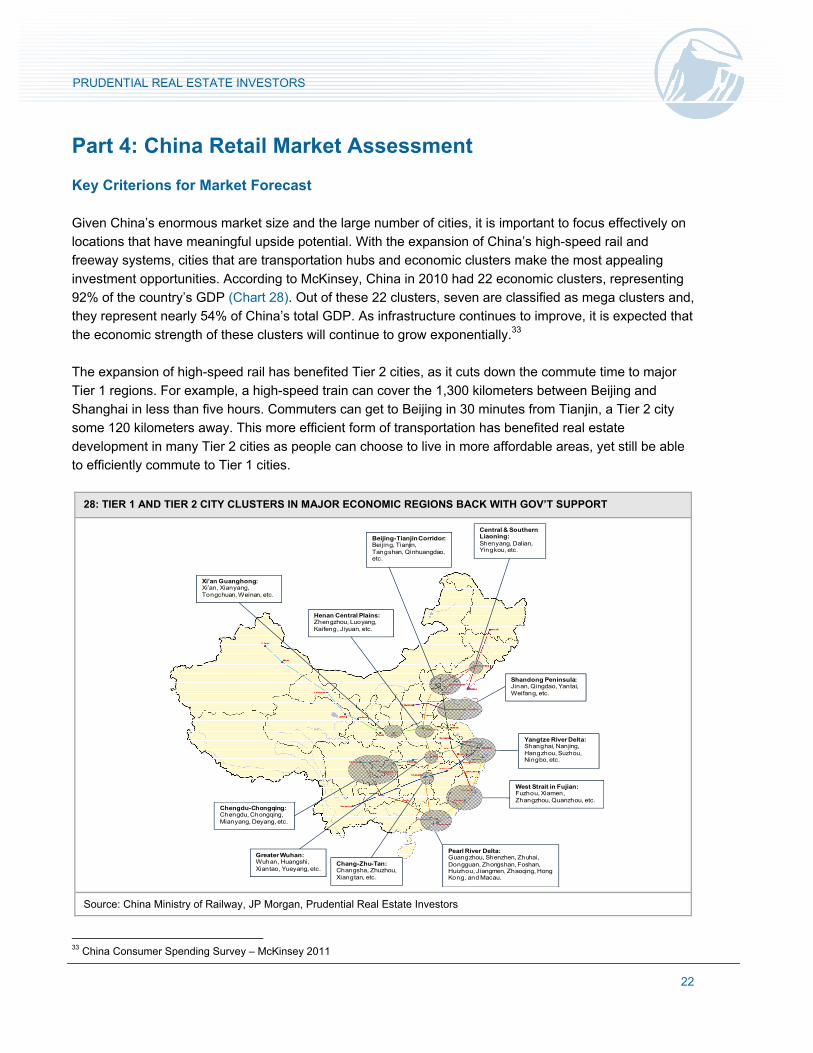
Part 4: China Retail Market Assessment Key Criterions for Market Forecast
Given China’s enormous market size and the large number of cities, it is important to focus effectively on
locations that have meaningful upside potential. With the expansion of China’s high-speed rail and
freeway systems, cities that are transportation hubs and economic clusters make the most appealing
investment opportunities. According to McKinsey, China in 2010 had 22 economic clusters, representing
92% of the country’s GDP (Chart 28). Out of these 22 clusters, seven are classified as mega clusters and,
they represent nearly 54% of China’s total GDP. As infrastructure continues to improve, it is expected that
the economic strength of these clusters will continue to grow exponentially.33
The expansion of high-speed rail has benefited Tier 2 cities, as it cuts down the commute time to major
Tier 1 regions. For example, a high-speed train can cover the 1,300 kilometers between Beijing and
Shanghai in less than five hours. Commuters can get to Beijing in 30 minutes from Tianjin, a Tier 2 city
some 120 kilometers away. This more efficient form of transportation has benefited real estate
development in many Tier 2 cities as people can choose to live in more affordable areas, yet still be able
to efficiently commute to Tier 1 cities.
28: TIER 1 AND TIER 2 CITY CLUSTERS IN MAJOR ECONOMIC REGIONS BACK WITH GOV’T SUPPORT
Source: China Ministry of Railway, JP Morgan, Prudential Real Estate Investors
33 China Consumer Spending Survey – McKinsey 2011
Central & Southern Liaoning:Shenyang, Dalian, Yingkou, etc.
Beijing-Tianjin Corridor:Beijing, Tianjin, Tangshan, Qinhuangdao, etc.
Shandong Peninsula:Jinan, Qingdao, Yantai, Weifang, etc.
Yangtze River Delta:Shanghai, Nanjing, Hangzhou, Suzhou, Ningbo, etc.
West Strait in Fujian:Fuzhou, Xiamen, Zhangzhou, Quanzhou, etc.
Pearl River Delta:Guangzhou, Shenzhen, Zhuhai, Dongguan, Zhongshan, Foshan, Huizhou, Jiangmen, Zhaoqing, Hong Kong, and Macau.
Chang-Zhu-Tan:Changsha, Zhuzhou, Xiangtan, etc.
Greater Wuhan:Wuhan, Huangshi, Xiantao, Yueyang, etc.
Chengdu-Chongqing:Chengdu, Chongqing, Mianyang, Deyang, etc.
Xi’an Guanghong:Xi’an, Xianyang, Tongchuan, Weinan, etc.
Henan Central Plains:Zhengzhou, Luoyang, Kaifeng, Jiyuan, etc.
23
PRUDENTIAL REAL ESTATE INVESTORS
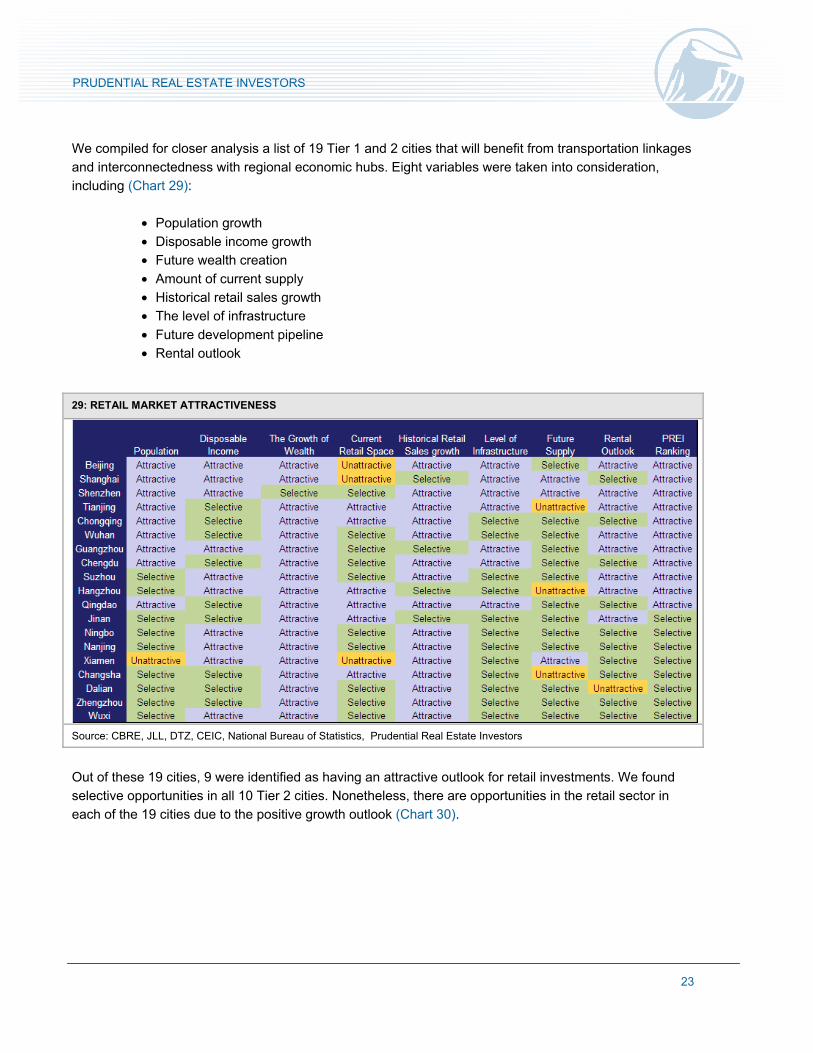
We compiled for closer analysis a list of 19 Tier 1 and 2 cities that will benefit from transportation linkages
and interconnectedness with regional economic hubs. Eight variables were taken into consideration,
including (Chart 29):
• Population growth
• Disposable income growth
• Future wealth creation
• Amount of current supply
• Historical retail sales growth
• The level of infrastructure
• Future development pipeline
• Rental outlook
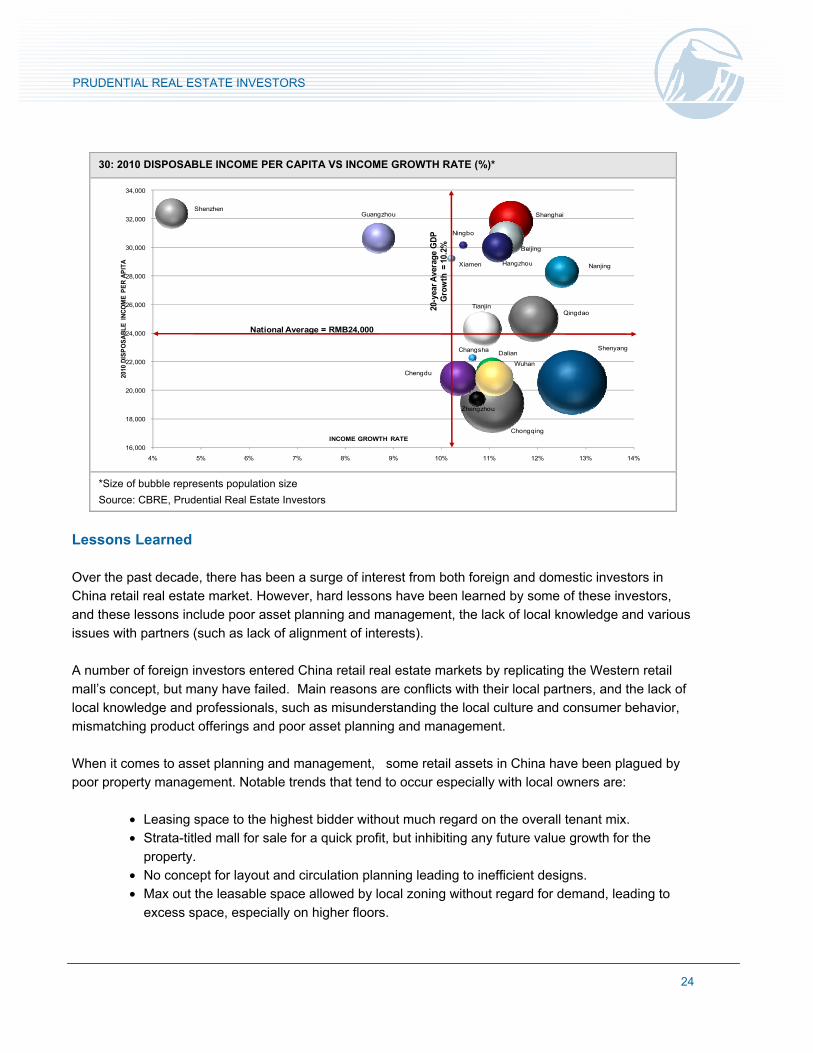
Out of these 19 cities, 9 were identified as having an attractive outlook for retail investments. We found
selective opportunities in all 10 Tier 2 cities. Nonetheless, there are opportunities in the retail sector in
each of the 19 cities due to the positive growth outlook (Chart 30).
29: RETAIL MARKET ATTRACTIVENESS
Source: CBRE, JLL, DTZ, CEIC, National Bureau of Statistics, Prudential Real Estate Investors
24
PRUDENTIAL REAL ESTATE INVESTORS
30: 2010 DISPOSABLE INCOME PER CAPITA VS INCOME GROWTH RATE (%)*
*Size of bubble represents population size
Source: CBRE, Prudential Real Estate Investors
Lessons Learned
Over the past decade, there has been a surge of interest from both foreign and domestic investors in
China retail real estate market. However, hard lessons have been learned by some of these investors,
and these lessons include poor asset planning and management, the lack of local knowledge and various
issues with partners (such as lack of alignment of interests).
A number of foreign investors entered China retail real estate markets by replicating the Western retail
mall’s concept, but many have failed. Main reasons are conflicts with their local partners, and the lack of
local knowledge and professionals, such as misunderstanding the local culture and consumer behavior,
mismatching product offerings and poor asset planning and management.
When it comes to asset planning and management, some retail assets in China have been plagued by
poor property management. Notable trends that tend to occur especially with local owners are:
• Leasing space to the highest bidder without much regard on the overall tenant mix.
• Strata-titled mall for sale for a quick profit, but inhibiting any future value growth for the
property.
• No concept for layout and circulation planning leading to inefficient designs.
• Max out the leasable space allowed by local zoning without regard for demand, leading to
excess space, especially on higher floors.
Shenyang
Nanjing
Qingdao
Shanghai
Beijing
Hangzhou
Chongqing
Dalian
Tianjin
Zhengzhou
Changsha
Ningbo
Chengdu
Xiamen
GuangzhouShenzhen
Wuhan
16,000
18,000
20,000
22,000
24,000
26,000
28,000
30,000
32,000
34,000
4% 5% 6% 7% 8% 9% 10% 11% 12% 13% 14%
2010
DIS
PO
SA
BL
E I
NC
OM
E P
ER
AP
ITA
INCOME GROWTH RATE
National Average = RMB24,000
20-y
ear A
vera
geG
DP
G
row
th =
10.
2%
25
PRUDENTIAL REAL ESTATE INVESTORS
• Lack of proper market analysis and due diligence during the design phase often lead to the
wrong product and tenant mix.
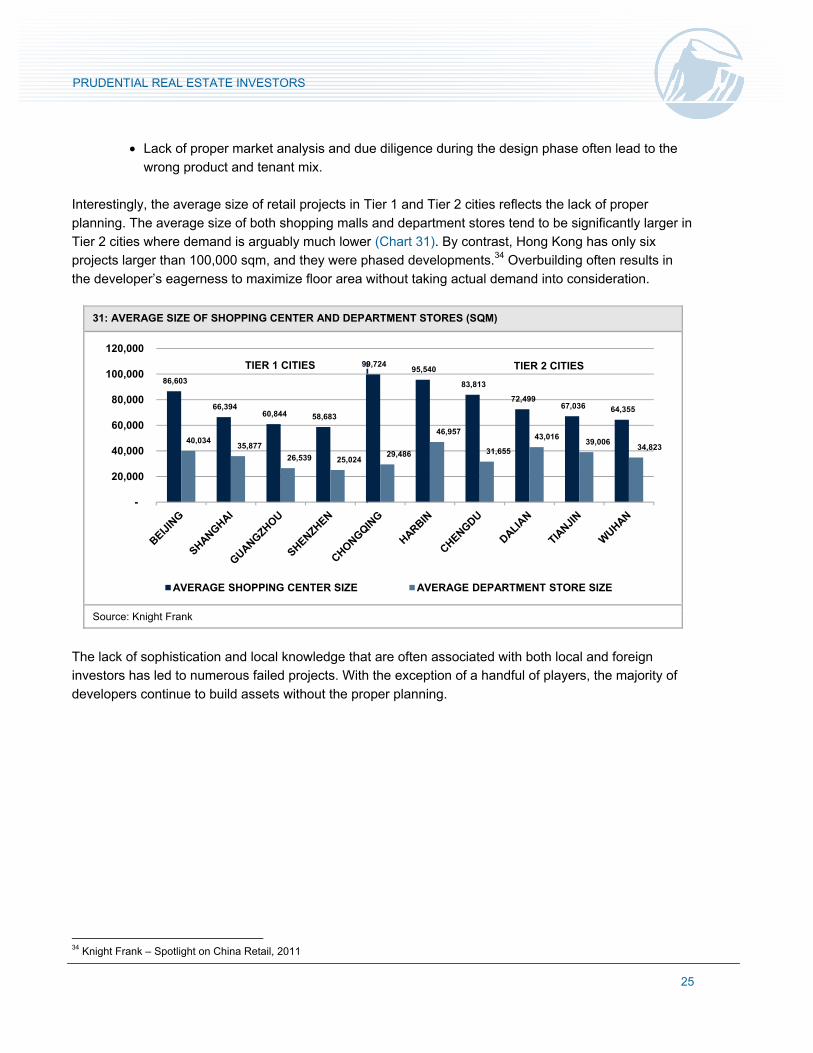
Interestingly, the average size of retail projects in Tier 1 and Tier 2 cities reflects the lack of proper
planning. The average size of both shopping malls and department stores tend to be significantly larger in
Tier 2 cities where demand is arguably much lower (Chart 31). By contrast, Hong Kong has only six
projects larger than 100,000 sqm, and they were phased developments.34 Overbuilding often results in
the developer’s eagerness to maximize floor area without taking actual demand into consideration.
31: AVERAGE SIZE OF SHOPPING CENTER AND DEPARTMENT STORES (SQM)
Source: Knight Frank
The lack of sophistication and local knowledge that are often associated with both local and foreign
investors has led to numerous failed projects. With the exception of a handful of players, the majority of
developers continue to build assets without the proper planning.
34 Knight Frank – Spotlight on China Retail, 2011
86,603
66,394 60,844 58,683
99,724 95,540
83,813
72,499 67,036 64,355
40,034 35,877
26,539 25,024 29,486
46,957
31,655
43,016 39,006
34,823
-
20,000
40,000
60,000
80,000
100,000
120,000
AVERAGE SHOPPING CENTER SIZE AVERAGE DEPARTMENT STORE SIZE
TIER 1 CITIES TIER 2 CITIES
26
PRUDENTIAL REAL ESTATE INVESTORS
Part 5: Conclusion
China’s retail sector has enormous potential. Strong urbanization, macroeconomic growth, projected
higher personal spending, expansion of retail chains, greater integration with the world economy, and
increasing domestic and foreign investments are fueling demand for quality retail properties. Retail
investors in China are looking to capitalize on two major developing trends.
First, more robust consumer spending must materialize for stronger retail sales. The current level of retail
spending as a percentage of disposable income is the lowest among other advanced economies and
even other BRIC countries, implying that there is room for China for stronger retail sales going forward.
Second, urbanization in Tier 2 cities needs to be followed with transportation and infrastructure
developments. McKinsey projects that cities in China will comprise 30% of the world’s GDP over the next
several decades, and as such, urbanization will undoubtedly be a major driver for retail investment.
On balance, the real estate investment market in China is still in its nascent stages and various risks exist
in the real estate market.
• Liquidity Risks: The investment market is still in its early stages. Investors face challenges
in finding the appropriate investment-grade product and given the competitive environment,
some local investors are willing to pay a premium for these assets.
• Regulatory Risks: Foreign investors need to obtain approvals from the Ministry of
Commerce (MOFCOM) and the State Administration of Foreign Exchange (SAFE) in order
to purchase property in China. The amount of regulation tends to fluctuate depending on
government’s views at any given time, and there are times when moving capital in and out
of China is difficult.
• Development & Counterparty Risks: Given China’s lack of transparency and relatively high
corruption index,35 domestic developers and sellers are known to have at times
circumvented regulations. Local officials, especially in second and third tier cities, are more
prone to corruption and may not always comply with the legal system.
• Title Risks: Title to new development projects are often not handed over upon the
completion of construction. The developer must apply for title from the local government
and, depending on location, the process can take up to two years to complete. Thus,
proper title may not transfer upon project delivery.
These risk factors are not likely to disappear in the near future and should be taken into account.
35 Transparency International Country Index
27
PRUDENTIAL REAL ESTATE INVESTORS
Important Disclosure Prudential Investment Management is the primary asset management business of Prudential Financial, Inc. Prudential Real Estate Investors is Prudential Investment Management’s real estate investment advisory business and operates through Prudential Investment Management, Inc. (PIM), a registered investment advisor. Prudential, the Prudential logo and the Rock symbol are service marks of Prudential Financial, Inc. and its related entities, registered in many jurisdictions worldwide. These materials represent the views, opinions and recommendations of the author(s) regarding the economic conditions, asset classes, securities, issuers or financial instrument referenced herein. Distribution of this information to any person other than the person to whom it was originally delivered and to such person’s advisers is unauthorized, and any reproduction of these materials, in whole or in part, or the divulgence of any of the contents hereof, without prior consent of Prudential Real Estate Investors is prohibited. Certain information contained herein has been obtained from sources that Prudential Real Estate Investors believes to be reliable as of the date presented; however, Prudential Real Estate Investors cannot guarantee the accuracy of such information, assure its completeness, or warrant such information will not be changed. The information contained herein is current as of the date of issuance (or such earlier date as referenced herein) and is subject to change without notice. Prudential Real Estate Investors has no obligation to update any or all of such information; nor do we make any express or implied warranties or representations as to the completeness or accuracy or accept responsibility for errors. These materials are not intended as an offer or solicitation with respect to the purchase or sale of any security or other financial instrument or any investment management services and should not be used as the basis for any investment decision. Past performance is no guarantee or reliable indicator of future results. No liability whatsoever is accepted for any loss (whether direct, indirect, or consequential) that may arise from any use of the information contained in or derived from this report. Prudential Real Estate Investors and its affiliates may make investment decisions that are inconsistent with the recommendations or views expressed herein, including for proprietary accounts of Prudential Real Estate Investors or its affiliates. The opinions and recommendations herein do not take into account individual client circumstances, objectives, or needs and are not intended as recommendations of particular securities, financial instruments or strategies to particular clients or prospects. No determination has been made regarding the suitability of any securities, financial instruments or strategies for particular clients or prospects. For any securities or financial instruments mentioned herein, the recipient(s) of this report must make its own independent decisions. Conflicts of Interest: Key research team staff may be participating voting members of certain Prudential Real Estate Investors fund and/or product investment committees with respect to decisions made on underlying investments or transactions. In addition, research personnel may receive incentive compensation based upon the overall performance of the organization itself and certain investment funds or products. At the date of issue, Prudential Real Estate Investors and/or affiliates may be buying, selling, or holding significant positions in real estate, including publicly traded real estate securities. Prudential Real Estate Investors affiliates may develop and publish research that is independent of, and different than, the recommendations contained herein. Prudential Real Estate Investors personnel other than the author(s), such as sales, marketing and trading personnel, may provide oral or written market commentary or ideas to Prudential Real Estate Investors clients or prospects or proprietary investment ideas that differ from the views expressed herein. Additional information regarding actual and potential conflicts of interest is available in Part II of PIM’s Form ADV.
REF: PFIA – 8RPS2U


![DNV RP U301[Jan2013] Risk Management of Shale Gas Developments & Operations](https://img.pdfslide.us/doc/110x75/552eb990550346e10c8b4a39/dnv-rp-u301jan2013-risk-management-of-shale-gas-developments-operations.jpg)