Embed Size (px)
Citation preview
AJS Volume 111 Number 1 (July 2005): 141–212 141
� 2005 by The University of Chicago. All rights reserved.0002-9602/2005/11101-0004$10.00
The Case for a New Class Map1
Kim A. WeedenCornell University
David B. GruskyStanford University
It is increasingly fashionable to claim that social classes are purelyacademic constructs that no longer provide much information aboutlifestyles, attitudes, and other individual-level outcomes. The fewavailable tests of this claim rely on stylized measures of social classthat either group detailed occupations into a small number of “bigclasses” or reduce them to scores on vertical scales of prestige, so-cioeconomic status, or cultural or economic capital. We show thatthese conventional approaches understate the total effects of the siteof production by failing to capitalize on the institutionalized socialcategories that develop at the detailed occupational level.
Over the last 25 years, the goal of class analysis has shifted from devel-oping accounts of collective action, revolutions, and other macroleveloutcomes (e.g., Thompson 1963; Braverman 1974; Burawoy 1979) to ex-plaining variability in individual-level life chances, attitudes, and behav-iors (see Holton and Turner 1989; cf. Sørensen 2000).2 This revolutionaryshift in the rationale for class analysis has not been accompanied by acorresponding shift in the class maps that are used to prosecute class
1 The research reported here was supported by a National Science Foundation researchgrant (SBS-9906419) and with discretionary funds from Cornell University, the Uni-versity of Chicago, and Stanford University. We are grateful for helpful commentsfrom Julia Adams, Vivek Chibber, Dalton Conley, Paul DiMaggio, Kathleen Gerson,John Goldthorpe, Michael Hout, Guillermina Jasso, Christopher Jencks, Michele La-mont, Robert Mare, Jeffery Paige, Margaret Somers, George Steinmetz, Ross Stolzen-berg, Bruce Western, and Yu Xie. We also thank Miller McPherson and the AJSreviewers for especially detailed and useful comments. For the deficiencies that remain,we take full responsibility. Direct correspondence to Kim A. Weeden, Department ofSociology, Cornell University, Ithaca, New York 14853. E-mail: [email protected] For convenience, we will often refer to these individual-level correlates as “outcomes,”even though we appreciate that some of them are not effects of class membership.
American Journal of Sociology
142
analysis. Indeed, contemporary debates about the structure of socialclasses (e.g., Wysong and Perrucci 1999) are eerily similar to debates thatdominated when the macrolevel agenda still held sway, almost as if onecan devise and justify class maps without considering their purpose. Weredress this oversight by asking whether a new, highly detailed classscheme devised explicitly for the microlevel agenda performs better thanconventional class maps.
The intellectual backdrop for our analyses is ongoing dissatisfactionwith the explanatory power of the usual social class maps (esp. Kingston2000). Most notably, postmodernist critics have argued that class analysishas failed to deliver on the new microlevel agenda, in large part becauseattitudes and behaviors arise from a “complex mosaic of taste subcultures”that are unrelated to class membership (Pakulski and Waters 1996, p.157; see also Clark and Lipset 2001; Beck 2000; Inglehart 1997; Kingston2000). These critics conclude that the concept of social class, while usefulfor explaining behavior in the early industrial period, is an intellectualdead end that misrepresents the “basic fissures that define the contoursof social life” (Kingston 2000, pp. 210–12). The postmodern critique im-plies that social action is increasingly individualistic and that any re-maining institutional constraints on action (e.g., religion, gender, race) aregenerated largely outside the site of production.3
This conclusion, popular though it is, ignores the possibility that socialclasses remain well formed and only appear to have weak effects becausethe class concept has been so poorly operationalized. The long-standing,untested, and seemingly problematic assumption of conventional classmodels is that the site of production is organized into a small number ofbig classes (e.g., “service class,” “routine nonmanual class”). This “big-class assumption” allows class analysts to ignore or dismiss the smallersocial groups (i.e., “occupations”) that emerge around functional niches inthe division of labor and that typically become deeply institutionalizedin the labor market. We argue below that occupations have considerableexplanatory power by virtue of this institutionalization. Indeed, whereasbig classes affect individual-level outcomes primarily through a rationalaction mechanism (e.g., Goldthorpe 2000), occupations shape behaviorthrough the additional sociological forces of self-selection, differential re-cruitment, socialization, and interactional closure, all of which becomeactivated in the context of institutionalized categories. It follows thatoccupations are better suited than big classes for the new microlevelagenda of explaining individual-level behaviors and attitudes (see Gruskyand Sørensen 1998, 2001; Grusky, Weeden, and Sørensen 2000; Grusky
3 We use the term “site of production” to refer to the social organizational setting withinwhich goods and services are produced.
Case for a New Class Map
143
and Weeden 2001, 2002; Weeden and Grusky 2005, in press; Grusky 2005;Weeden 2005).
We develop this argument in five parts. In the first section, we considerwhy contemporary sociologists should care about constructing class maps,thereby motivating our own efforts to build a new map for the microleveltradition. We then develop the theory underlying our argument that in-stitutionalized categories become internally homogeneous and thus allowfor a more powerful account of individual-level outcomes. In the nexttwo sections, we provide indirect tests of this argument: the first sectionexplores the extent to which competing class maps (i.e., big class anddisaggregate) capture the bivariate structure at the site of production, andthe second section examines the more purely causal effects of class in thecontext of multivariate models. To foreshadow our results, we find thatthe disaggregate class model outperforms big-class models in both cases,even when modeling life chances and other outcomes that are conven-tionally regarded as the home ground of big-class analysis (see Goldthorpeand McKnight in press). We conclude by discussing alternative ways ofrethinking conventional class models and by arguing that such alterna-tives to our approach may be only marginally useful for a microlevelresearch agenda.
THE MICROLEVEL RATIONALE FOR A CLASS MAP
Anticlass rhetoric has so permeated the discipline that it is now necessaryto argue what once was taken for granted: that sociologists of all stripes,not just self-identified class analysts, should be interested in developinga class model that lives up to the demands scholars place on it. We begin,then, by making the case for a new class scheme that is designed withthe microlevel research tradition in mind. The main purpose of a refur-bished class scheme, we argue, is to identify structural positions at thesite of production that provide the strongest possible signal of “life con-ditions,” where this refers to the panoply of circumstances that define thequality and character of our social lives, including the economic flowsand resources that we control, our institutional affiliations and commit-ments, the types of lifestyles that we lead, and our sentiments and atti-tudes. We are thus looking for an information-rich class map that rep-resents the “geography of social structure . . . by describing importantdifferences between structural locations” (Sørensen 2000, pp. 1526–27;Giddens 1973, pp. 171–72; Goldthorpe 2000, p. 206). This class conceptis not very demanding; after all, classes that are fine-tuned to the micro-level agenda do not need to embody antagonistic interests, act collectivelyon behalf of these interests, or bring about fundamental macrolevel
American Journal of Sociology
144
change. These more ambitious claims, while not developed here, maynonetheless be defensible for our new class map. In some of our priorwork, for example, we have argued that occupations are the main vehiclethrough which rent is extracted, thus implying that interoccupationalantagonisms might emerge in the competition over rent (Weeden 2002;see also Abbott 1988).
Here, however, we focus on the more delimited task of defining cate-gories that capture the available structure at the site of production andhence are good information-conveying “containers.”4 We will assess such“class structuration” (Giddens 1973) in two ways: first by evaluating howa disaggregate model fares (relative to big-class maps) in capturing thebivariate association between structural categories and life conditions, andthen by evaluating how it performs in a multivariate explanatory context.As we argue below, the first test is relevant to analyses in which socialclass is treated as a dependent variable, while the second is relevant toanalyses in which it is treated as an independent variable. We next reviewthese two forms of microlevel analysis and ask how an optimal class mapmight be devised for each.
The Determinants of Class
The class standing of an individual is treated as a dependent variable inmuch of contemporary sociology. For example, class maps are used asdependent variables in analyses of class reproduction and mobility, class-based assortative mating, class-based friendship and network ties, andclass or occupational segregation (by sex and race). These researchtraditions are best served by a class scheme that provides a strong signalof life conditions. That is, insofar as the objective of such research is todetermine how and why individuals are allocated to different life con-ditions, the analyst should use a class scheme that successfully capturesvariability in life conditions.
This conclusion, obvious though it may seem, has not informed theconstruction or testing of contemporary class maps. The typical classanalyst develops some preferred class map by (a) nominating a particularvariable (e.g., authority, employment relations) as especially useful in un-derstanding the structure of the site of production, and (b) then definingclass categories that capture differences across workers on that variable.
4 As will become evident, our new formulation redefines the class concept. It is, how-ever, not so radical a redefinition as to break with the longstanding assumption (e.g.,Marx [1869] 1963; Weber 1946) that class categories should characterize the availablestructure at the site of production. We do not seek to devise categories that representstructure that emerges outside the site of production (e.g., religions, racial groups,gender groups).
Case for a New Class Map
145
For example, Goldthorpe (2000) first argues that the “form of regulationof employment” (e.g., salaried, short-term contract) is analytically impor-tant, and he then demonstrates that the categories of the Erikson-Goldthorpe (EG) big-class scheme differ in their characteristic forms ofregulation. Attempts to test class schemes, if any are made, typicallyinvolve showing that the proposed categories indeed succeed in capturingthe privileged analytic variable (e.g., Evans 1992; Evans and Mills 1998;Rose and O’Reilly 1997, 1998).
This standard approach is a vestige of the old macrolevel agenda thatdoes not transfer gracefully to the new microlevel agenda. To be sure,when the goal of class analysis is to understand how opposing interestsmight generate class antagonisms, it makes sense to build a class maparound that one critical variable (e.g., property ownership, authority re-lations) that defines class interests, latent though it may be. If, by contrast,the goal is to understand differential life conditions, the standard approachis no longer defensible. After all, “life conditions” is an intrinsically syn-thetic concept, and it is unlikely that a single variable can exhaust it. Itis curious that theorists who have abandoned the macrolevel agenda (ifever they held it) continue to motivate and test their class maps in termsof a criterion variable that has been nominated, seemingly by fiat, asespecially important. While we cannot know for sure, we suspect thatclass analysts have carried over this conventional approach to the newmicrolevel agenda quite unthinkingly, as if old macrolevel objectives werestill relevant.
At the same time, it is possible that conventional class models can serveas broad, synthetic indicators of life conditions, even though they weremore narrowly devised to capture a single criterion variable. Although aconventional class map might be justified this way, few scholars do so(cf. Bourdieu 1984), perhaps because there is little in the way of researchresults that might sustain this justification. As we have noted, some schol-ars (e.g., Evans 1992) have tried to validate their class map against a fewpreferred criteria, but such tests do not provide the comprehensive as-sessment that an omnibus measure of life conditions demands. These testsare also problematic because they consider only big-class maps and, as aresult, prematurely cut off debate on a logically prior question, namelywhether any big-class model is up to the task of capturing the availablestructure at the site of production (e.g., Evans and Mills 1998; Evans1992; Halaby and Weakliem 1993; Kingston 2000).
The only line of research that comes close to assessing the explanatorypotential of a disaggregate approach is that of Bourdieu (esp. 1984) and
American Journal of Sociology
146
Lamont (e.g., 1994; also, Peterson and Simkus 1992).5 This research, whichdoes often draw on detailed occupational categories, is an important im-petus for our own approach. At the same time, it falls well short of acomprehensive assessment of the explanatory potential of occupations,not just because the preferred class maps are “top-heavy” hybrids thatdisaggregate professional occupations and aggregate all others, but alsobecause such maps have been “validated” against a quite narrow rangeof outcomes, typically only lifestyles and consumption practices. We ex-tend this line of research by evaluating a fully disaggregate class schemewith respect to a far more comprehensive set of outcomes.
This evaluation entails assessing the strength of the bivariate relation-ship between the postulated class maps (e.g., big class, disaggregate) andvarious life conditions (e.g., life chances, lifestyles, cultures).6 We appre-ciate that tastes will vary regarding which conditions should be privilegedas constitutive of class: Weberian purists emphasize that life chances aloneare relevant, whereas advocates of more imperialist definitions of classreject the usual distinction between class and status (i.e., “habitus”) andopt for schemes that capture both (see Bourdieu 1984; Giddens 1973;Lamont 1994). We can remain agnostic on these debates because ourresults indicate that conventional big classes fall short for all aspects oflife conditions. As we will show, no matter how widely or narrowly classis conceived, it is difficult to defend conventional big classes.7
The Effects of Class
We have argued that research on the determinants of class membershipshould be based on class maps that capture as much of the variability inlife conditions as possible. Should analyses of the effects of social class besubject to the same stricture? As the microlevel agenda diffused, such
5 There is a relatively large body of research on how cultural practices are related togradients of education, socioeconomic status (SES), or prestige (e.g., Bryson 1996, 1998).6 If classes were instead defined as constellations of conditions (e.g., life chances, life-styles) that cluster together, the relevant test might be a latent class analysis assessingwhether such constellations appear at the big-class or occupation level (see Birkelund,Goodman, and Rose 1996; also see Grusky and Weeden 2002, pp. 234–35). Here, wewill only address whether class locations capture variability in each condition takenseparately, but we will be taking on a more ambitious latent class analysis in subsequentresearch (e.g., Grusky and Weeden in press).7 We appreciate that some research questions are best resolved by analyzing particularaspects of life conditions (e.g., income) rather than some omnibus measure. In suchcases, scholars should simply use the individual-level variable of interest without firstpushing it through the fulcrum of class. The analytic niche for a class map rests withscholarship that requires an omnibus measure of life conditions (see Grusky 2005, pp.6–7).
Case for a New Class Map
147
analyses became ubiquitous, so much so that, for virtually any individual-level variable, a well-developed research literature can now be found thattreats that variable as class determined. These analyses of class effectstypically take the form of a sociological horse race that pits social classagainst other core sociological variables (e.g., race, gender, religion) toassess which variable is the most important. The task of revealing “true”class effects therefore involves estimating a full multivariate model thateliminates any possible confounding of class with other causes.
This approach makes it especially important to use a class map thatcaptures the available structure at the site of production, thereby pro-tecting against any downward bias in estimated class effects. Given thatmany commentators have argued that class effects are now weak (e.g.,Pakulski and Waters 1996; Kingston 2000), a special burden rests on classanalysts to either concede the point or, alternatively, to demonstrate thatconventional class maps fail to exhaust the structure at the site of pro-duction. We take on this task with illustrative multivariate models thatshow whether class effects can be strengthened by replacing the nominalcategories of big-class maps with more deeply institutionalized microclasscategories. Armed with these analyses, we can determine whether theapparent weakness of class effects arises merely because class has beenpoorly operationalized or because, as postmodernists would have it, classis now truly a weak force. As we see it, the main rationale for developinga new microlevel map is that much of sociology is oriented toward themicrolevel task of teasing out the strength and pattern of class effects, atask that is compromised insofar as class maps do not maximize explan-atory power.
We appreciate that social class is also one of the most frequently usedcontrol variables in sociological research. In such research, class acts aslittle more than a nuisance variable that must be “controlled” for thepurpose of securing unbiased estimates of other, presumably more inter-esting variables (e.g., race, religion). Typically, issues of operationalizationare treated cavalierly when a control for class is needed, as if the choicebetween various big-class maps is more relevant in theory than in practice.This is unfortunate. Indeed, insofar as conventional big-class models failto capture the explanatory power available at the site of production, muchsociological research may be subject to the omitted variable bias thatarises when class effects are only partly purged. It follows that researcherswho wish to control for class should also use a class map that is tailor-made for the microlevel research objective.

American Journal of Sociology
148
Overview of Analytic Strategy
If the goal of a class map is to provide an omnibus signal of life conditions,then it is appropriate to evaluate our class maps across a wide range ofindividual-level outcomes. We carry out bivariate analyses that incor-porate 55 variables from four topical domains: (a) life chances (e.g., in-come, education, working conditions), (b) lifestyles (e.g., consumptionpractices, institutional participation), (c) culture (e.g., political preferences,social attitudes), and (d) demographic composition (e.g., race, ethnicity).The first three domains represent areas that have historically been viewedas crucial “litmus tests” for class maps. As we noted above, some scholars(e.g., Weber 1946) regard life chances as the main life conditions of interest,whereas others (e.g., Bourdieu 1984; Thompson 1963) prefer more en-compassing definitions of class that incorporate lifestyles and sentiments.We provide evidence pertaining to all three domains and allow readersto pick and choose those that correspond to their preferred definition ofclass. The fourth domain, demographic composition, is not directly rel-evant to typical definitions of class (cf. Bourdieu 1984), but we include itbecause commentators have long argued that class formation and struc-turation can be undermined by racial and ethnic cleavages (e.g., Bradley1996; Bonacich 1972; Giddens 1973). Again, our objective is to providethe most comprehensive validation of class maps to date, while appre-ciating that some of our readers might prefer a narrower assessment.
We also carry out analyses that test standard gradational representa-tions of inequality. Up to now, we have made much of the hegemony ofbig-class schemes, but other models of inequality obviously remain inplay. In particular, gradational formulations have long been popular,whether in the “American” tradition of scaling occupations according toSES or prestige (e.g., Hauser and Warren 1997; Nakao and Treas 1994),or the “French” tradition of treating occupations as subtle signals of theeconomic and cultural capital controlled by their incumbents (esp. Bour-dieu 1984). The main problem with both traditions is that they simplyassume that occupations can safely be reduced to one or two continuousvariables (e.g., prestige, cultural capital). As with big-class approaches,scaling obscures the far more complicated effects of occupational culturesor other forms of “horizontal” differentiation that arise when social closureis secured at the detailed occupational level. Put differently, conventionalscales tell stories about why occupations matter but overlook the logicallyprior issues of how much occupations matter and whether they matter inways other than the preferred stories. We take on these logically priorissues in our analyses.
In summary, all conventional approaches begin with a characterizationof the site of production that aggregates occupations into big classes or
Case for a New Class Map
149
represents them with continuous scales, thus ignoring the possibility thatsuch practices conceal much of the association between occupations andindividual-level outcomes. Although there is considerable debate over howbig classes should be defined (e.g., Evans and Mills 1998), how occupationsshould be scaled (e.g., Hauser and Warren 1997), or whether big-classschemes are superior to scales (e.g., Rytina 2000; Hout and Hauser 1992;Kalleberg and Griffin 1980), scholars invariably assume that at least oneof these forms of data reduction is satisfactory. We will test this assumptionand thereby ask whether a more fundamental recasting of class maps isnecessary.
WHERE IS STRUCTURATION FOUND?
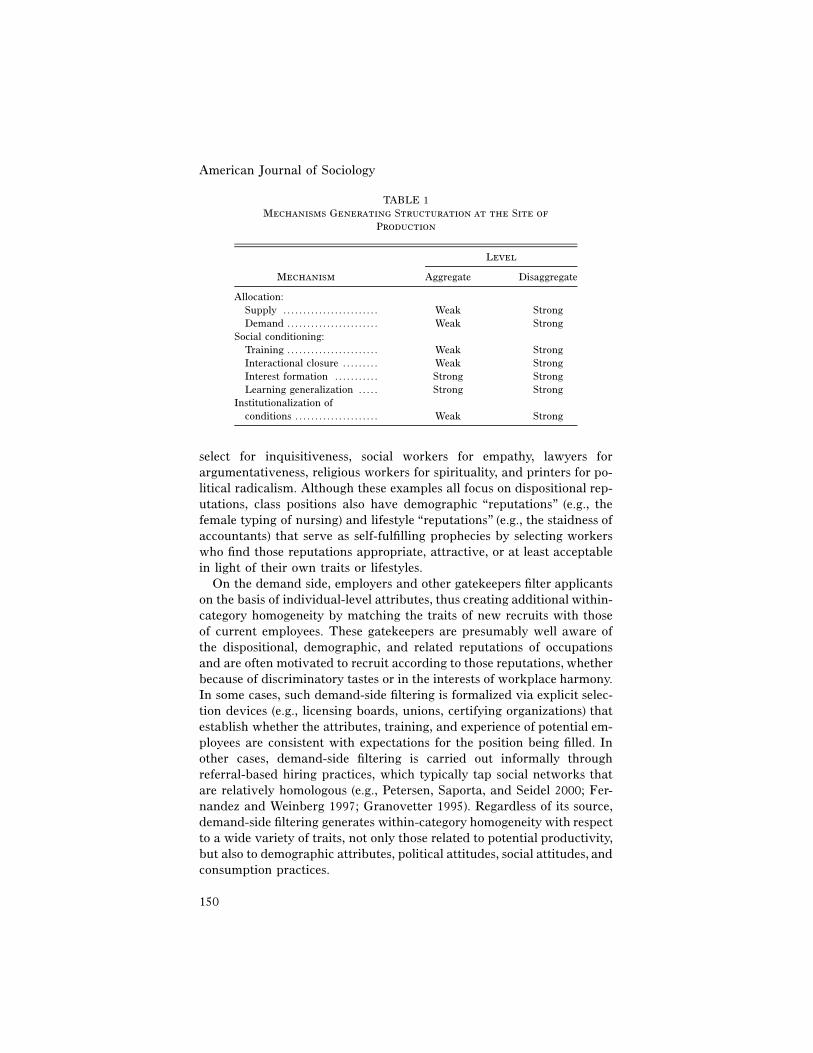
If class is as central to sociology as the preceding section implies, thenthe discipline should have a more than passing interest in determiningthe level of aggregation at which class categories structure outcomes. Thisissue is best addressed by considering whether the proximate mechanismsthat generate class homogeneity operate principally at the big-class oroccupational level. In the present section, we outline the three main pro-cesses that generate within-group homogeneity (i.e., allocation, social con-ditioning, and institutionalization of conditions), with our objective beingto specify the level at which each such process operates. As discussedbelow, some of the sociological processes that generate the class-outcomerelationship operate at the big-class level, whereas others operate moredirectly and forcefully at the disaggregate level. It follows that real struc-ture obtains at both levels. We argue, however, that selection, socialization,and other homogeneity-inducing mechanisms operate with special forceat the occupation level, implying that conventional big-class models willconceal a substantial portion of the structure at the site of production (seetable 1).
The first mechanism, allocation, refers to the selective processes thataffect the types of individuals who are found in particular positions inthe productive sphere. This mechanism operates on both the supply anddemand sides. On the supply side, workers self-select into positions basednot only on their perceptions about which occupations are remunerativeand intrinsically rewarding (see, e.g., Logan 1996), but also on their beliefsabout which occupations provide a good fit in terms of their preexistingbeliefs, attitudes, lifestyle predilections, and demographic attributes. Forexample, individuals with liberal political values are more likely attractedto the profession of sociology, given its reputation as a haven for left-leaning politics; this self-selection in turn solidifies the dispositional rep-utation itself (Caplow 1954). Similarly, we might expect journalists to self-
American Journal of Sociology
150
TABLE 1Mechanisms Generating Structuration at the Site of
Production
Mechanism
Level
Aggregate Disaggregate
Allocation:Supply . . . . . . . . . . . . . . . . . . . . . . . . Weak StrongDemand . . . . . . . . . . . . . . . . . . . . . . . Weak Strong
Social conditioning:Training . . . . . . . . . . . . . . . . . . . . . . . Weak StrongInteractional closure . . . . . . . . . Weak StrongInterest formation . . . . . . . . . . . Strong StrongLearning generalization . . . . . Strong Strong
Institutionalization ofconditions . . . . . . . . . . . . . . . . . . . . . Weak Strong
select for inquisitiveness, social workers for empathy, lawyers forargumentativeness, religious workers for spirituality, and printers for po-litical radicalism. Although these examples all focus on dispositional rep-utations, class positions also have demographic “reputations” (e.g., thefemale typing of nursing) and lifestyle “reputations” (e.g., the staidness ofaccountants) that serve as self-fulfilling prophecies by selecting workerswho find those reputations appropriate, attractive, or at least acceptablein light of their own traits or lifestyles.
On the demand side, employers and other gatekeepers filter applicantson the basis of individual-level attributes, thus creating additional within-category homogeneity by matching the traits of new recruits with thoseof current employees. These gatekeepers are presumably well aware ofthe dispositional, demographic, and related reputations of occupationsand are often motivated to recruit according to those reputations, whetherbecause of discriminatory tastes or in the interests of workplace harmony.In some cases, such demand-side filtering is formalized via explicit selec-tion devices (e.g., licensing boards, unions, certifying organizations) thatestablish whether the attributes, training, and experience of potential em-ployees are consistent with expectations for the position being filled. Inother cases, demand-side filtering is carried out informally throughreferral-based hiring practices, which typically tap social networks thatare relatively homologous (e.g., Petersen, Saporta, and Seidel 2000; Fer-nandez and Weinberg 1997; Granovetter 1995). Regardless of its source,demand-side filtering generates within-category homogeneity with respectto a wide variety of traits, not only those related to potential productivity,but also to demographic attributes, political attitudes, social attitudes, andconsumption practices.
Case for a New Class Map
151
The key question for our purposes is whether the allocative processesof self-selection and differential recruitment operate principally at the big-class or occupational level. Here it is relevant that occupations, more sothan big classes, tend to be institutionalized in the labor market, embeddedin the cognitive maps of workers and employers, and characterized bythe cultural reputations that drive allocative processes. Indeed, in manyoccupations, licenses and credentials serve as explicit gatekeeping devices,restricting entry to certain qualified eligibles and promoting the socialclosure that generates distinctive cultures and reputations. The general-ized reputations that attach to big classes tend to be comparatively weak.The classes of “nonskilled managers” (Wright 1997) or “routine nonman-uals” (Erikson and Goldthorpe 1992) are, for example, largely academicconstructions that lack well-developed closure mechanisms and have ac-cordingly amorphous reputations. The main gatekeeping device at thebig-class level is the bachelor’s degree, yet this form of closure maps ontojust one big class (i.e., the “service class”), and only imprecisely at that.Although many occupations are poorly institutionalized and lack preex-isting reputations or formalized selection devices (e.g., “assemblers,” “sys-tems analysts”), insofar as closure mechanisms can be found at all, it ismainly at the occupational level.
If the allocation mechanism evokes the imagery of social classes asvessels for individuals with common preexisting attributes, the “socialconditioning” mechanism (Bourdieu 1984, p. 101) is instead explicitlycausal, referring to the transformative effects of the objective conditionsof work and the social practices characteristic of a class position. Theseconditions and practices shape the development of classwide and localpolitical interests (Marx 1963; Dahrendorf 1959; Krause 1996), alter theattributes that workers value both on and off the job (Kohn [1980] 1994,pp. 436–37; Kohn and Schooler 1983), affect lifestyles and patterns offamily interactions (Zablocki and Kanter 1976, p. 276; see also Menaghan1991), and motivate workers to learn particular skills (Becker 1967). Foursubmechanisms, all of which fall under the social conditioning rubric,generate these diverse effects: training, interactional closure, interest for-mation, and learning generalization. We review each of these below.
The first two submechanisms, training and interactional closure, drawexplicitly on the classical sociological forces of socialization and normativecontrol. The training submechanism becomes relevant whenever em-ployees complete lengthy class-specific education (i.e., generalized liberalarts curriculum) or occupation-specific training (e.g., apprenticeships, po-lice and military academies, graduate and professional schools) that so-lidifies preexisting attitudes, instills explicit codes of behavior, or otherwisegenerates homogeneity among recruits (e.g., Caplow 1954). Although for-mal training is the most obvious mode of such socialization, informal
American Journal of Sociology
152
training also occurs as incumbents interact with like-minded colleaguesand are exposed to the political beliefs, social attitudes, perceived interests,and consumption practices characteristic of a given structural location.This “interactional closure” at the site of production generates homoge-neous communities (e.g., Park 1952, p. 196) because political and socialattitudes crystallize out of social interactions (e.g., Berelson, Lazarsfeld,and McPhee 1954), and because groups impose sanctions against memberswho deviate from normative beliefs or behaviors (e.g., Wilensky and Lad-insky 1967).
Do training and interactional closure generate homogeneity of outcomesprimarily at the big-class level or at the occupation level? It is relevantthat these two submechanisms come into play in the context of institu-tionalized groupings characterized by formalized training regimens (e.g.,apprenticeships, graduate training) and substantial intraclass interaction.By implication, they will be especially apparent at the disaggregate levelwhere occupational groupings are well formed, and their boundaries, farfrom being arbitrary academic constructions, are explicitly defended byemployers, unions, professional associations, and credentialing bodies. Aswe have stressed elsewhere (Grusky and Weeden 2001), not all occupationshave well-developed training regimens and dense networks, but at thesame time many do (e.g., Van Maanen and Barley 1984; Hughes 1958;Caplow 1954). By contrast, such organic communities have proved elusiveat the big-class level (e.g., Brint 1984, 1994; Goldthorpe and Lockwood1969), emerging in well-developed form only at particular historical mo-ments (e.g., Thompson 1963).
If training and interactional closure are thus less developed at the big-class level, we do not mean to suggest that they are completely absent,even in the contemporary period. Most notably, postsecondary schoolsprovide generalized training for members of a broadly defined “serviceclass,” a form of training that should generate classwide homogeneity onat least some outcomes (e.g., tolerance, liberalism). This training is not,however, widely regarded as preparatory for any particular big class, atleast not to the extent that most vocational training (e.g., the JD) is pre-paratory to a particular occupation (i.e., lawyer). It follows that training-based closure is relatively poorly developed at the big-class level. Likewise,interactional closure is also weakly developed at the big-class level becauseit primarily takes the form of class-based residential segregation, not con-straints on workplace interaction. That is, neighborhood residents oftenfall into the same big class, a form of segregation that creates the potentialfor interactional closure at the big-class level. This source of homogeneityis relatively weak given that interaction between neighbors is both lessfrequent and less extensive than interaction between coworkers. Thus,although residual forms of classwide socialization and normative control
Case for a New Class Map
153
persist, these processes operate more directly and powerfully at the levelof institutionalized occupations.
The remaining two submechanisms, interest formation and learninggeneralization, become relevant insofar as class categories are homoge-neous with respect to working conditions, opportunities, and the resulting“logic” of the class situation. The standard formulation here, as expressedby Bourdieu, is that “homogenous conditions of existence impose ho-mogenous conditionings and produce homogenous systems of dispositionscapable of generating similar practices” (1984, p. 104; see also Becker andCarper 1956). This homogeneity of practice is established either because(a) the underlying opportunities, constraints, and logic of the class situationgenerate a characteristic set of interests (Goldthorpe 2002); or (b) there isa “direct translation of the lessons of the job to outside-the-job realities”(Kohn 2001, p. 539). The distinction between these two submechanismslies in the emphasis placed on instrumental calculation. In the interest-based account, class incumbents adopt beliefs or pursue courses of actionthat, given the logic of the class situation, allow them to best realize theirobjectives. The learning generalization account instead implies that classincumbents unconsciously appreciate and value salient features of theirjob or workplace. For example, workers involved in substantively com-plex tasks should learn to value complexity and intellectual prowess bothon and off the job, thus creating a preference for intellectually demandingleisure activities.
Both accounts assume that members of a putative class experience aworkplace environment that is similar in terms of the conditions that forminterests or lead to learning generalization. The key issue, then, in deter-mining whether aggregation undermines these mechanisms is the extentto which it introduces intraclass heterogeneity in the workplace conditionsof interest (e.g., income, substantive complexity, autonomy). In this con-text, it is not necessarily troubling that big-class categories are poorlyinstitutionalized, because sociologists typically construct them to be ho-mogenous with respect to at least some working conditions. At the sametime, the smaller categories that employers devise (i.e., occupations) willlikewise be homogeneous insofar as their job-construction efforts areguided by a consensual “template” that specifies the job tasks, workingconditions, and rewards of an occupation. Put differently, the homogeneityof big classes arises because sociologists attempt analytically to combinejobs or occupations into coherent groups, whereas the homogeneity ofoccupations arises because employers (and, to some extent, workers) fash-ion jobs that correspond with ideal-typical occupational templates.
This implies that homogeneous class categories may be constructedeither by employers or sociologists. We cannot make a priori judgmentsabout the effects of aggregation because it is unclear whether sociologists
American Journal of Sociology
154
have succeeded in defining big classes in ways that retain much of thehomogeneity that matters for interest formation or learning generalization.Given this ambiguity, we have assumed in table 1 that these mechanismsgenerate roughly the same amount of homogeneity at the two levels,although it is conceivable that sociologists are in fact better than employersat constructing categories that capture variability in the dimensions gov-erning interest formation or learning generalization.
The final mechanism listed in table 1, “institutionalization of condi-tions,” refers explicitly to the processes by which work is typically struc-tured and rewarded. This mechanism becomes relevant when explainingwhy the objective conditions of work (e.g., work hours, income) tend tobe similar within big classes and occupations. As noted above, occupationstend to encompass similar work conditions, given that they are the in-stitutionalized categories in terms of which employers fashion jobs (see,e.g., Bridges 1995). Moreover, occupational associations and unions at-tempt to homogenize further the work conditions of particular occupa-tions, with their success revealed in the diffusion of occupation-specificlicenses, credentials, certifications, and apprenticeship systems (e.g., Wee-den 2002; Freidson 1994, 2001; Murphy 1988). Only rarely, and even lessoften successfully, do these organizations seek to effect classwide changesin the conditions of work (Abbott 1988). To be sure, sociologists whoaggregate occupations into big classes are again sorting on work condi-tions, at least insofar as work conditions are correlated with the criteriaby which the preferred big classes are explicitly defined. This sorting islikely, however, to be indirect with respect to the particular outcomesincluded in our life chances domain.
The main implication of this discussion is that most of the mechanismsthat generate the class-outcome association operate more directly anddecisively at the level of detailed occupations (see table 1). It follows thatbig-class theorists must fall back on a limited menu of mechanisms whendescribing how classes structure individual-level outcomes. For example,Goldthorpe (2000, 2002; also Goldthorpe and McKnight in press) explainsthis relationship almost entirely in terms of a rational action account (i.e.,interest formation), whereby class incumbents pursue courses of actionthat are subjectively sensible given the particular bundle of constraintsand opportunities characterizing their class situation. This rational actionaccount may be the strongest card that a big-class theorist can play, butit is far weaker than the homogeneity-inducing mechanisms available tothe theorist of institutionalized class categories. It follows that big-classmaps encourage analysts to search for association between the site ofproduction and individual outcomes where only a fraction of that asso-ciation is likely to be found.
Case for a New Class Map
155
SOCIAL CARTOGRAPHY
We begin our empirical analyses by examining whether big-class mapssuccessfully capture variability in life conditions. These “cartographic”analyses involve characterizing the bivariate association between classmembership and a wide range of variables in the life chances, lifestyles,culture, and demography domains. We proceed by first describing thedata and then presenting our class maps, models, and results. The mul-tivariate analyses, to which we turn in the subsequent section, rely onlargely similar data and methods and thus will be presented moreeconomically.
Data
We assess the strength of the relationship between class maps and out-comes as comprehensively as possible by examining 55 individual-levelvariables drawn from our four topical domains. Within each domain, wechose variables that offered large sample sizes, consistent coverage acrosssurvey years, and similar item wording over time. After imposing theserestrictions, we found that a few of the topics (e.g., abortion attitudes)were covered by an extremely large number of items. Rather than over-weight the analyses with these items, we chose a representative samplingof them.8
The variables pertaining to life chances and demographic compositionare principally drawn from the 1972–2002 March CPS (Bureau of LaborStatistics [BLS] 2004), while those in the remaining domains are drawnfrom the 1972–2002 GSS (Davis, Smith, and Marsden 2004). We combinedmultiple years of the surveys to obtain adequate sample sizes. In a com-panion piece (Weeden and Grusky 2005), we have disaggregated by sampleyear and examined trends in the strength of the class-outcome relationship,but these trends proved to be relatively weak and do not alter our mainconclusions here. Appendix table A1 lists all variables and their sourcequestions, response categories, and contributing surveys.
We define class and occupation schemes with 1970 Standard Occu-pation Classification (SOC) codes. Unfortunately, data from post-1991GSS and post-1982 CPS files are only published in 1980 or 1990 SOCschemes, forcing us to reconcile classifications. We back-coded the morerecent data into the 1970 scheme by (a) translating the 1990-basis datainto the 1980 scheme, (b) multiplying each 1980-basis record by the num-ber of 1970 SOC codes that contribute to the 1980 code (U.S. Bureau ofthe Census 1989), and (c) assigning sex-specific weights to each record in
8 We have no reason to believe that our results would be any different had we selecteddifferent items.
American Journal of Sociology
156
the resulting expanded data set.9 This weight equals the proportion of the1980 code that is drawn from the constituent 1970 code, multiplied bythe survey weight and, for CPS data, a deflation factor that retains theoriginal sample size. The GSS and CPS analyses are both restricted toadult respondents ages 25–64 in the civilian labor force, and the CPSsamples are further restricted to households in months one to four of thesampling rotation to ensure that a given household does not contributemore than one observation to the sample (see BLS 2004).
Class Maps
We translated the 1970-basis SOC codes into various class maps, withour featured map being a new, highly disaggregate scheme of 126 occu-pations (see app. table A2). In deciding which detailed codes to combineand which to retain, we sought to identify institutionalized boundaries asrevealed by the distribution of occupational associations, unions, and li-censing arrangements, as well as the technical features of the work itself.We carried out this task by referring to Weeden’s (2002) archive ofoccupation-level data on the forms of social closure (e.g., credentialing,certification, associations, licensing) that detailed occupations have pur-sued and realized. This archive, which is described in more detail inWeeden (2002), allows us to identify the institutionalized boundaries thatgenerate intracategory homogeneity.
We were, however, forced to make various compromises in constructingthis scheme, not only because we often lacked the cases needed to maintaindistinctions that are institutionalized in the labor market, but also becausewe sought to construct a classification that is nested in conventional big-class schemes. We recognize, then, that some of our categories combineSOC occupations that differ in bases of recruitment and self-selection,work conditions, and constraints on interaction, while others define anoccupation that is only “deeply institutionalized” insofar as it has appearedin thousands of administrative publications (e.g., “professionals, n.e.c.”).Indeed, we often resorted to combining occupations (e.g., professionals,n.e.c.) that were similar only by virtue of their working conditions, a basisfor aggregation that is admittedly no different than that routinely de-ployed, albeit on a far broader scale, by conventional class analysts. Theresulting 126-category scheme, while clearly imperfect, is nonetheless a
9 For a given 1980 occupation, suppose that 90% of incumbents would have been codedinto occupation X in the 1970 scheme, while 10% would have been coded into occu-pation Y. Each person with this 1980 occupation contributes two records to the ex-panded data set: one record receives code X and a weight of 0.9, and the other receivescode Y and a weight of 0.1.
Case for a New Class Map
157
substantial improvement over aggregate class models because it capturesfar more of the institutionalized social groupings in the division of labor.If this imperfect scheme performs relatively well, one might reasonablysurmise that elaborated schemes that capture yet more of the institution-alized categories in the labor market would perform even better.
We evaluate our 126-category scheme against conventional big-classand gradational representations of the site of production. Obviously, thereis less than complete consensus within the aggregate and gradationalcamps, making it difficult to carry out a definitive analysis without de-ploying several schemes. We represent the big-class tradition with twowell-known schemes and the gradational tradition with four scales. Un-fortunately, we cannot include Wright’s (1997) neo-Marxian class scheme,preeminent though it is. The GSS and CPS do not allow us to implementthis classification precisely enough to do it justice, while Wright’s (e.g.,1997) U.S. survey contains less than 1,500 cases, too few to sustain anoccupation-level analysis.
Instead, we apply the EG scheme, which has arguably become the defacto standard within the big-class tradition. Although this scheme has adetailed 11-class version, we use the more commonly applied seven-classversion. This version has become standard because the more detailedvariant rests on information on firm size and employer status, neither ofwhich is routinely available in the GSS surveys or in many of the othersurveys commonly used in inequality research (see Erikson and Gold-thorpe 1992, pp. 35–47). The categories of the seven-class version areservice workers, routine nonmanuals, petty bourgeoisie, skilled craftworkers, unskilled manual workers, farmers, and agricultural workers.In translating the 1970 SOC codes into this scheme, we relied principallyon the EG protocol for recoding 1960 SOC codes, but then checked ourresults against ISCO-based protocols developed by Ganzeboom, Luijkx,and Treiman (1989).10
For all its popularity, the EG scheme has not entirely supplanted al-ternatives based on aggregate census bureau categories. Consequently, wealso consider a 12-class scheme in which the constituent categories areself-employed professionals, employed professionals, employed managers,self-employed managers, sales workers, clerical workers, craft workers,operatives, service workers, laborers, farmers, and farm laborers.11 This“Featherman-Hauser” (FH) scheme, so labeled because Featherman and
10 We thank Walter Muller, John Goldthorpe, Harry Ganzeboom, Ruud Luijkx, andDonald Treiman for sharing the conversion protocols.11 We opt against a 17-category version of the FH scheme because the industrial dis-tinctions that it adds to the 12-class version (e.g., retail sales workers, wholesale salesworkers) typically fall outside the purview of class analysis.
American Journal of Sociology
158
Hauser (1978) popularized it, is easily implemented by cross-classifyingcensus major occupations and employment status.12 The relationships be-tween the FH, EG, and detailed schemes are specified in appendix tableA2.
The lack of consensus within the gradational tradition also requiresthat we evaluate our occupation scheme against several formulations. Theobvious suspects are SES and prestige scales, both of which dominatedNorth American scholarship in the latter half of the 20th century. Al-though interest in these scales has waned, gradational approaches thatscore occupations by their level of cultural capital or “occupational ed-ucation” (see Hauser and Warren 1997) are increasingly popular. The mainconvention here, which we follow, is to measure occupational educationas the proportion of incumbents who have at least 13 years of schooling(e.g., Kalmijn 1994). We also implement Bourdieu’s two-dimensional for-mulation by distinguishing between the total volume of cultural and eco-nomic capital and the relative amounts of each (Bourdieu 1984; see alsoDiMaggio and Mohr 1985). We measure the first dimension, total capital,as the sum of the Z-scores of occupational education and earnings (Hauserand Warren 1997), and the second dimension, capital composition, as theratio of occupational education to earnings.13
We assigned scores on each of these five scales to the 126 occupationsin our detailed classification scheme. We obtained 1980-basis prestigescores from Nakao and Treas (1994), and 1980-basis SES, cultural capital,total capital, and capital composition scores from Hauser and Warren(1997). We then back-coded these 1980-basis scores into the 1970 SOC(see above), assigned these scores and the 126-category occupation codesto all CPS respondents, and constructed a weighted average within eachof the 126 occupations.14 Although aggregating up to the level of 126occupations suppresses some within-category heterogeneity in these scales,supplementary analyses (not shown) indicate that this lost heterogeneity
12 To maintain consistency across class schemes, we assigned 14 (of 428) sparsely pop-ulated SOC occupations to FH categories that diverge from the major occupationgroup. These inconsistencies occur when technically similar occupations are coded intodifferent SOC major groups. Milliners, for example, are coded as operatives in theSOC, while tailors are coded as craft workers. There are too few milliners to justifya separate occupation in our scheme, so we combine milliners with tailors and, to beconsistent with EG, assign the resulting occupation to the FH “craft worker” class.We privileged EG because it is gaining ascendancy in the day-to-day practice of so-ciology, even in North America (see, e.g., Manza and Brooks 1999).13 It follows that “total capital” is a socioeconomic scale in which income and educationare weighted equally.14 We used 1980-basis rather than 1970-basis SES and prestige scales because thisallows us to center better on the time period covered by our surveys. Given the stabilityof these scales, this decision is likely inconsequential.
Case for a New Class Map
159
is trivially small. That is, when the disaggregate scales are regressed onthe corresponding aggregate ones, the explained variance is quite high(SES: 94.6%, prestige: 93.2%, cultural capital: 96.3%, total capital: 93.5%,capital composition: 83.5%).
Models and Methods
We carry out our analyses with 55 four-way tables formed by cross-classifying detailed occupation, employment status, gender, and outcome.We then decompose the total occupation-by-outcome association into acomponent that is explained by big classes (or scales) and a componentthat remains unexplained by big classes (or scales), thereby giving us ameasure of the relative cost, in terms of explanatory power foregone, ofaggregation (or scaling).
These simple decompositions are carried out with data that have beensmoothed in two ways. First, we smooth away any residual three-wayinteractions between sex, occupation, and outcome, which allows for morepowerful tests of the effects of aggregation. Although we would prefer toanalyze tables for men and women separately, the three-way cross-classification of sex, occupation, and outcome is sparse for the GSS var-iables, thereby increasing the risk that the analysis will unfairly capitalizeon noise. By smoothing across sex, we can retain the pooled sample size,halve the number of models to be presented, reduce “noise,” and still allowfor sex differences in the outcome and occupation distributions.
The second type of data smoothing is necessary because the EG andFH schemes, unlike our occupation-based scheme, distinguish betweenemployed and self-employed members of some classes (i.e., professionaland managerial). The detailed and big-class schemes are therefore nestedonly if we further disaggregate occupations by employment status. How-ever, such extreme differentiation is not only inconsistent with our con-ceptual approach, but also makes the GSS tables unacceptably sparse.The solution to this problem differs by class scheme. In analyses usingthe FH scheme, we disaggregate professional and managerial occupationsby employment status, but then constrain the three-way interaction be-tween occupation, employment status, and outcome to be the same forall occupations within the professional class and for all occupations withinthe managerial class. This approach maintains consistency with the FHapproach by allowing for interactions with employment status at the big-class level (but not the detailed occupational level).
The FH tables are smoothed, then, by fitting to each disaggregate tablea model that (a) constrains the association between occupation and out-come to be identical for men and women, while allowing two-way inter-actions between sex and occupation and between sex and outcome; and
American Journal of Sociology
160
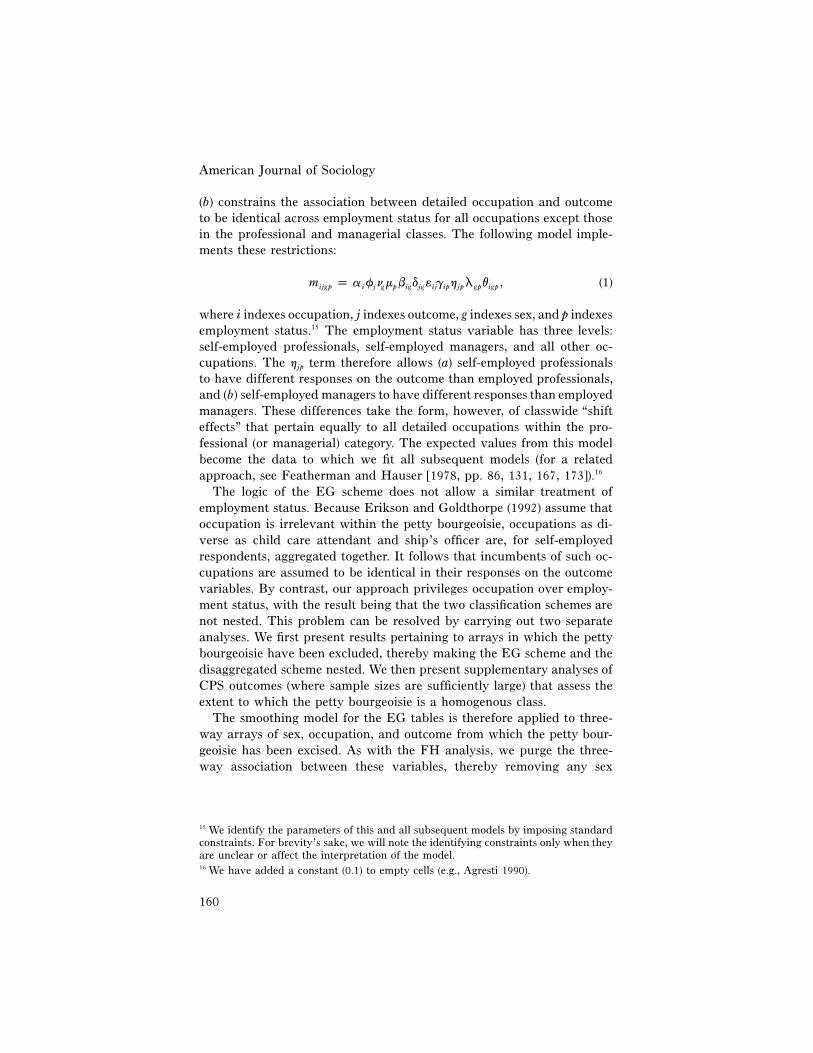
(b) constrains the association between detailed occupation and outcometo be identical across employment status for all occupations except thosein the professional and managerial classes. The following model imple-ments these restrictions:
m p a f n m b d � g h l v , (1)ijgp i j g p ig jg ij ip jp gp igp
where i indexes occupation, j indexes outcome, g indexes sex, and p indexesemployment status.15 The employment status variable has three levels:self-employed professionals, self-employed managers, and all other oc-cupations. The hjp term therefore allows (a) self-employed professionalsto have different responses on the outcome than employed professionals,and (b) self-employed managers to have different responses than employedmanagers. These differences take the form, however, of classwide “shifteffects” that pertain equally to all detailed occupations within the pro-fessional (or managerial) category. The expected values from this modelbecome the data to which we fit all subsequent models (for a relatedapproach, see Featherman and Hauser [1978, pp. 86, 131, 167, 173]).16
The logic of the EG scheme does not allow a similar treatment ofemployment status. Because Erikson and Goldthorpe (1992) assume thatoccupation is irrelevant within the petty bourgeoisie, occupations as di-verse as child care attendant and ship’s officer are, for self-employedrespondents, aggregated together. It follows that incumbents of such oc-cupations are assumed to be identical in their responses on the outcomevariables. By contrast, our approach privileges occupation over employ-ment status, with the result being that the two classification schemes arenot nested. This problem can be resolved by carrying out two separateanalyses. We first present results pertaining to arrays in which the pettybourgeoisie have been excluded, thereby making the EG scheme and thedisaggregated scheme nested. We then present supplementary analyses ofCPS outcomes (where sample sizes are sufficiently large) that assess theextent to which the petty bourgeoisie is a homogenous class.
The smoothing model for the EG tables is therefore applied to three-way arrays of sex, occupation, and outcome from which the petty bour-geoisie has been excised. As with the FH analysis, we purge the three-way association between these variables, thereby removing any sex
15 We identify the parameters of this and all subsequent models by imposing standardconstraints. For brevity’s sake, we will note the identifying constraints only when theyare unclear or affect the interpretation of the model.16 We have added a constant (0.1) to empty cells (e.g., Agresti 1990).
Case for a New Class Map
161
differences in the occupation-outcome association from the pool of totalassociation to be explained. This yields the following model:
m p a f n b d � , (2)ijg i j g ig jg ij
where all symbols are defined as above. The fitted values from this modelare again used for all subsequent EG analyses. It bears emphasizing thatthese data-smoothing procedures merely exclude residual forms of asso-ciation that neither the big-class nor microclass approaches predict.
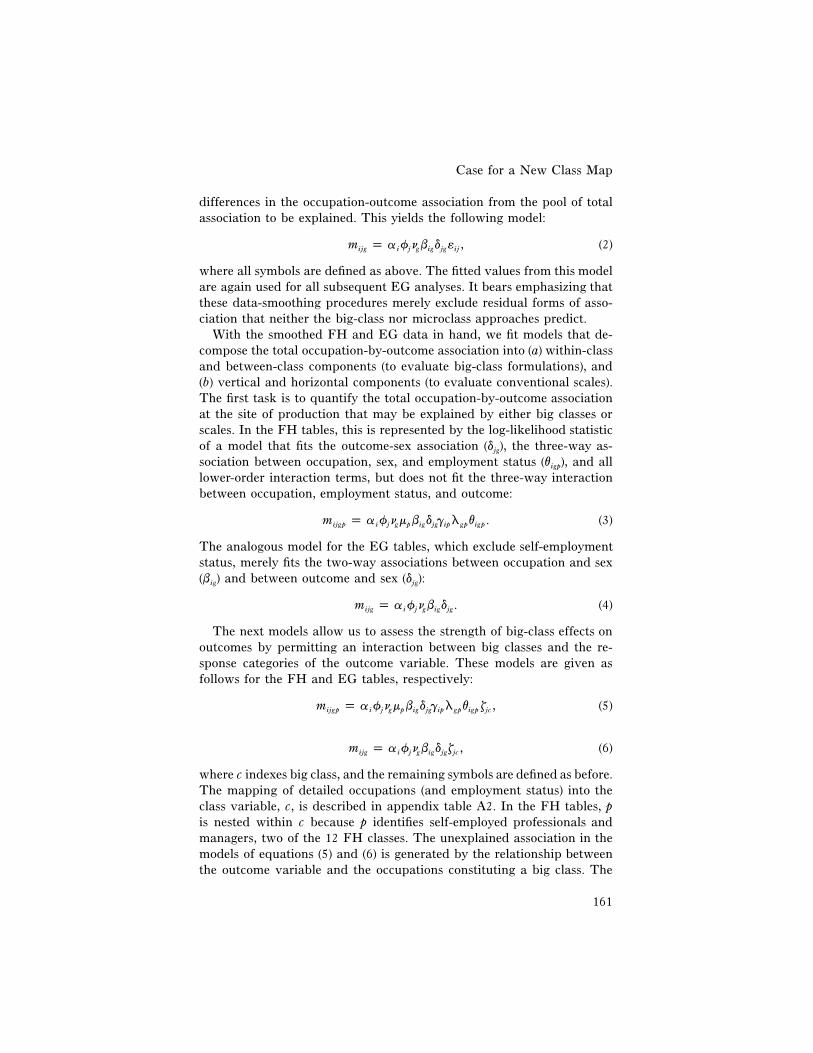
With the smoothed FH and EG data in hand, we fit models that de-compose the total occupation-by-outcome association into (a) within-classand between-class components (to evaluate big-class formulations), and(b) vertical and horizontal components (to evaluate conventional scales).The first task is to quantify the total occupation-by-outcome associationat the site of production that may be explained by either big classes orscales. In the FH tables, this is represented by the log-likelihood statisticof a model that fits the outcome-sex association (djg), the three-way as-sociation between occupation, sex, and employment status (vigp), and alllower-order interaction terms, but does not fit the three-way interactionbetween occupation, employment status, and outcome:
m p a f n m b d g l v . (3)ijgp i j g p ig jg ip gp igp
The analogous model for the EG tables, which exclude self-employmentstatus, merely fits the two-way associations between occupation and sex(big) and between outcome and sex (djg):
m p a f n b d . (4)ijg i j g ig jg
The next models allow us to assess the strength of big-class effects onoutcomes by permitting an interaction between big classes and the re-sponse categories of the outcome variable. These models are given asfollows for the FH and EG tables, respectively:
m p a f n m b d g l v z , (5)ijgp i j g p ig jg ip gp igp jc
m p a f n b d z , (6)ijg i j g ig jg jc
where c indexes big class, and the remaining symbols are defined as before.The mapping of detailed occupations (and employment status) into theclass variable, c, is described in appendix table A2. In the FH tables, pis nested within c because p identifies self-employed professionals andmanagers, two of the 12 FH classes. The unexplained association in themodels of equations (5) and (6) is generated by the relationship betweenthe outcome variable and the occupations constituting a big class. The
American Journal of Sociology
162
fit statistics from these models thus allow us to evaluate the assumptionof within-class homogeneity.
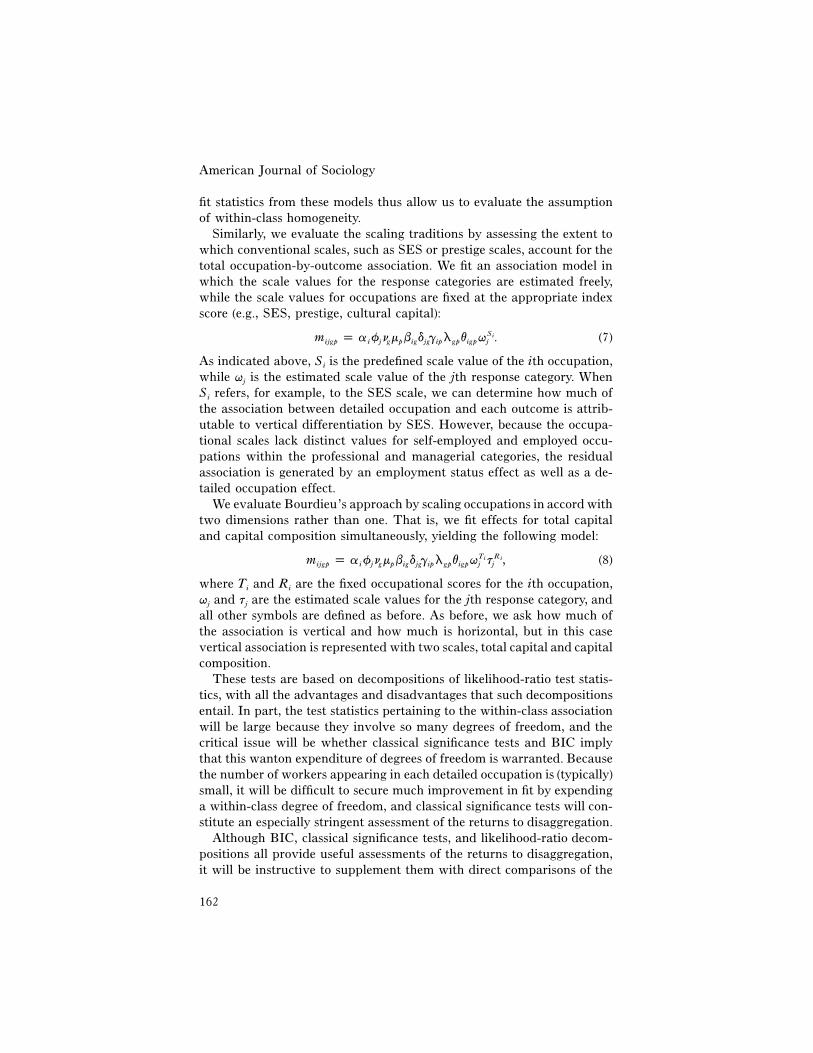
Similarly, we evaluate the scaling traditions by assessing the extent towhich conventional scales, such as SES or prestige scales, account for thetotal occupation-by-outcome association. We fit an association model inwhich the scale values for the response categories are estimated freely,while the scale values for occupations are fixed at the appropriate indexscore (e.g., SES, prestige, cultural capital):
Sim p a f n m b d g l v q . (7)ijgp i j g p ig jg ip gp igp j
As indicated above, Si is the predefined scale value of the ith occupation,while qj is the estimated scale value of the jth response category. WhenSi refers, for example, to the SES scale, we can determine how much ofthe association between detailed occupation and each outcome is attrib-utable to vertical differentiation by SES. However, because the occupa-tional scales lack distinct values for self-employed and employed occu-pations within the professional and managerial categories, the residualassociation is generated by an employment status effect as well as a de-tailed occupation effect.
We evaluate Bourdieu’s approach by scaling occupations in accord withtwo dimensions rather than one. That is, we fit effects for total capitaland capital composition simultaneously, yielding the following model:
T Ri im p a f n m b d g l v q t , (8)ijgp i j g p ig jg ip gp igp j j
where Ti and Ri are the fixed occupational scores for the ith occupation,qj and tj are the estimated scale values for the jth response category, andall other symbols are defined as before. As before, we ask how much ofthe association is vertical and how much is horizontal, but in this casevertical association is represented with two scales, total capital and capitalcomposition.
These tests are based on decompositions of likelihood-ratio test statis-tics, with all the advantages and disadvantages that such decompositionsentail. In part, the test statistics pertaining to the within-class associationwill be large because they involve so many degrees of freedom, and thecritical issue will be whether classical significance tests and BIC implythat this wanton expenditure of degrees of freedom is warranted. Becausethe number of workers appearing in each detailed occupation is (typically)small, it will be difficult to secure much improvement in fit by expendinga within-class degree of freedom, and classical significance tests will con-stitute an especially stringent assessment of the returns to disaggregation.
Although BIC, classical significance tests, and likelihood-ratio decom-positions all provide useful assessments of the returns to disaggregation,it will be instructive to supplement them with direct comparisons of the
Case for a New Class Map
163
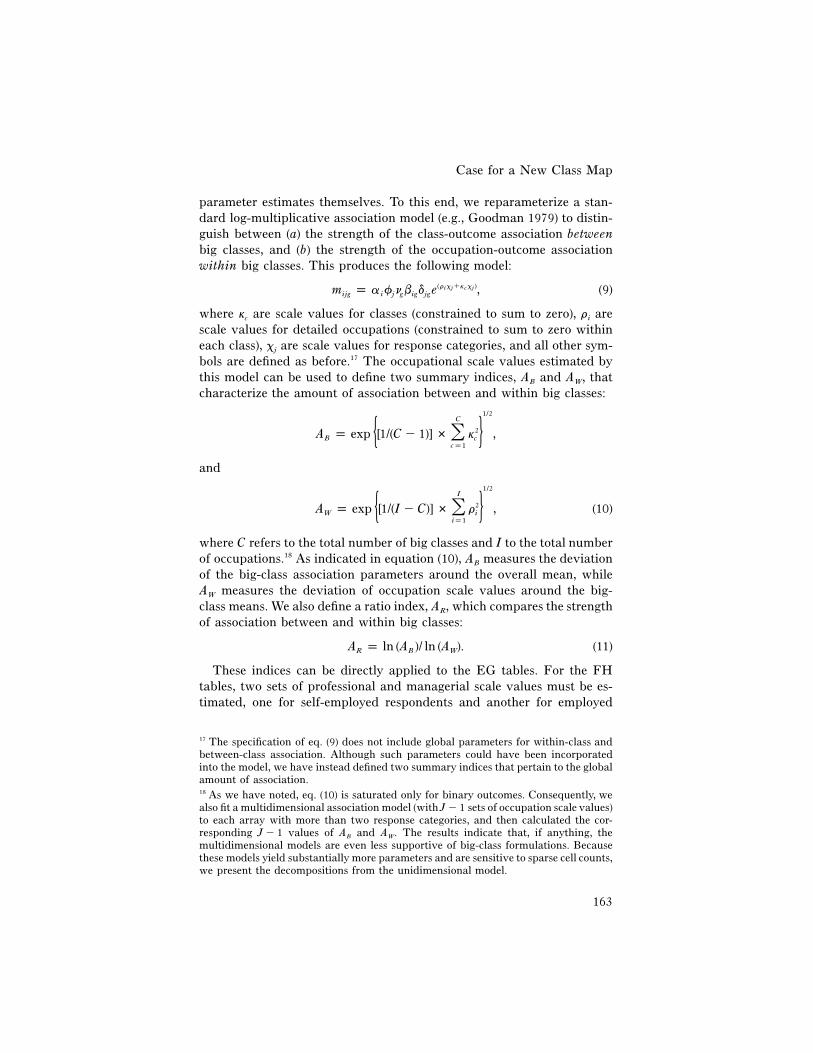
parameter estimates themselves. To this end, we reparameterize a stan-dard log-multiplicative association model (e.g., Goodman 1979) to distin-guish between (a) the strength of the class-outcome association betweenbig classes, and (b) the strength of the occupation-outcome associationwithin big classes. This produces the following model:
(r x �k x )i j c jm p a f n b d e , (9)ijg i j g ig jg
where kc are scale values for classes (constrained to sum to zero), ri arescale values for detailed occupations (constrained to sum to zero withineach class), xj are scale values for response categories, and all other sym-bols are defined as before.17 The occupational scale values estimated bythis model can be used to define two summary indices, AB and AW, thatcharacterize the amount of association between and within big classes:
1/2C
2A p exp [1/(C � 1)] # k ,�B c{ }cp1
and
1/2I
2A p exp [1/(I � C)] # r , (10)�W i{ }ip1
where C refers to the total number of big classes and I to the total numberof occupations.18 As indicated in equation (10), AB measures the deviationof the big-class association parameters around the overall mean, whileAW measures the deviation of occupation scale values around the big-class means. We also define a ratio index, AR, which compares the strengthof association between and within big classes:
A p ln (A )/ ln (A ). (11)R B W
These indices can be directly applied to the EG tables. For the FHtables, two sets of professional and managerial scale values must be es-timated, one for self-employed respondents and another for employed
17 The specification of eq. (9) does not include global parameters for within-class andbetween-class association. Although such parameters could have been incorporatedinto the model, we have instead defined two summary indices that pertain to the globalamount of association.18 As we have noted, eq. (10) is saturated only for binary outcomes. Consequently, wealso fit a multidimensional association model (with sets of occupation scale values)J � 1to each array with more than two response categories, and then calculated the cor-responding values of AB and AW. The results indicate that, if anything, theJ � 1multidimensional models are even less supportive of big-class formulations. Becausethese models yield substantially more parameters and are sensitive to sparse cell counts,we present the decompositions from the unidimensional model.
American Journal of Sociology
164
respondents. In this case, AB is calculated as shown in equation (10), butAW is calculated as the geometric mean of AWEM and AWSE, where AWEM
equals the value of AW after excluding the two self-employed classes, andAWSE equals the value of AW after excluding the two employed classes.The values of AWSE and AWEM are identical for binary outcomes (for whichmodel 9 is saturated). They differ for outcomes with more than two re-sponse categories, but disparities between them are trivial and nonsys-tematic, and our conclusions are not affected by resorting to the mean.
Results
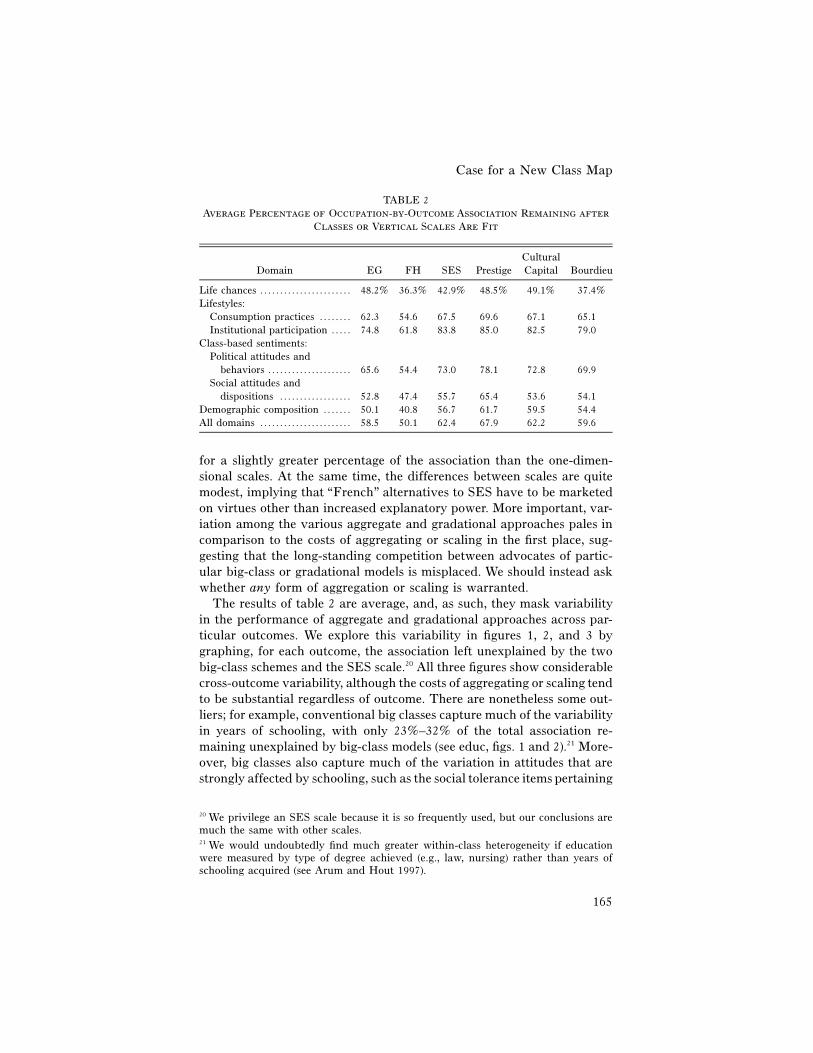
The results from our decomposition exercise are presented for all 55 out-comes in appendix B, tables B1–B3. We summarize these results in table2 by presenting, for each domain, the average percentage of the totalassociation that remains after big classes (columns 1–2) or vertical scales(columns 3–6) are fit. This table indicates that the conventional practiceof aggregating or scaling occupations conceals much of the structure atthe site of production. Depending on the domain, aggregate class mapsleave 36%–75% of the total association in the tables unexplained, whereasgradational representations of class fare even worse, leaving 37%–85%of the total association unexplained. When averages are calculated acrossall domains (see bottom row), the unexplained association ranges from50%–68%, meaning that none of the conventional approaches accountsfor more than half of the structure at the site of production, and someaccount for as little as a third of that structure.
These results reveal that conventional models of class and status varyin their explanatory power, but probably not enough to justify all thedebate about their relative merits. The FH scheme accounts for more ofthe total association at the site of production than does the EG scheme,but it also expends more degrees of freedom and is devised specificallyfor the idiosyncrasies of the U.S. classification schemes. Although someof the class-based association is suppressed by excluding the petty bour-geoisie from the EG tables, our supplementary analyses of the CPS out-comes (see app. table B2) suggest that these losses are likely offset, if notovershadowed, by the substantial occupation-level structuration withinthe petty bourgeoisie.19 Among gradational approaches, the SES and cul-tural capital scales capture roughly equivalent proportions of the totalassociation, and both perform better than prestige scales (see Hauser andWarren 1997). The two-dimensional scale inspired by Bourdieu accounts
19 The model of independence, when applied to the outcome-by-occupation array forthe petty bourgeoisie, is rejected under all conventional measures of fit (see app. tableB1).
Case for a New Class Map
165
TABLE 2Average Percentage of Occupation-by-Outcome Association Remaining after
Classes or Vertical Scales Are Fit
Domain EG FH SES PrestigeCulturalCapital Bourdieu
Life chances . . . . . . . . . . . . . . . . . . . . . . . 48.2% 36.3% 42.9% 48.5% 49.1% 37.4%Lifestyles:
Consumption practices . . . . . . . . 62.3 54.6 67.5 69.6 67.1 65.1Institutional participation . . . . . 74.8 61.8 83.8 85.0 82.5 79.0
Class-based sentiments:Political attitudes and
behaviors . . . . . . . . . . . . . . . . . . . . . 65.6 54.4 73.0 78.1 72.8 69.9Social attitudes and
dispositions . . . . . . . . . . . . . . . . . . 52.8 47.4 55.7 65.4 53.6 54.1Demographic composition . . . . . . . 50.1 40.8 56.7 61.7 59.5 54.4All domains . . . . . . . . . . . . . . . . . . . . . . . 58.5 50.1 62.4 67.9 62.2 59.6
for a slightly greater percentage of the association than the one-dimen-sional scales. At the same time, the differences between scales are quitemodest, implying that “French” alternatives to SES have to be marketedon virtues other than increased explanatory power. More important, var-iation among the various aggregate and gradational approaches pales incomparison to the costs of aggregating or scaling in the first place, sug-gesting that the long-standing competition between advocates of partic-ular big-class or gradational models is misplaced. We should instead askwhether any form of aggregation or scaling is warranted.
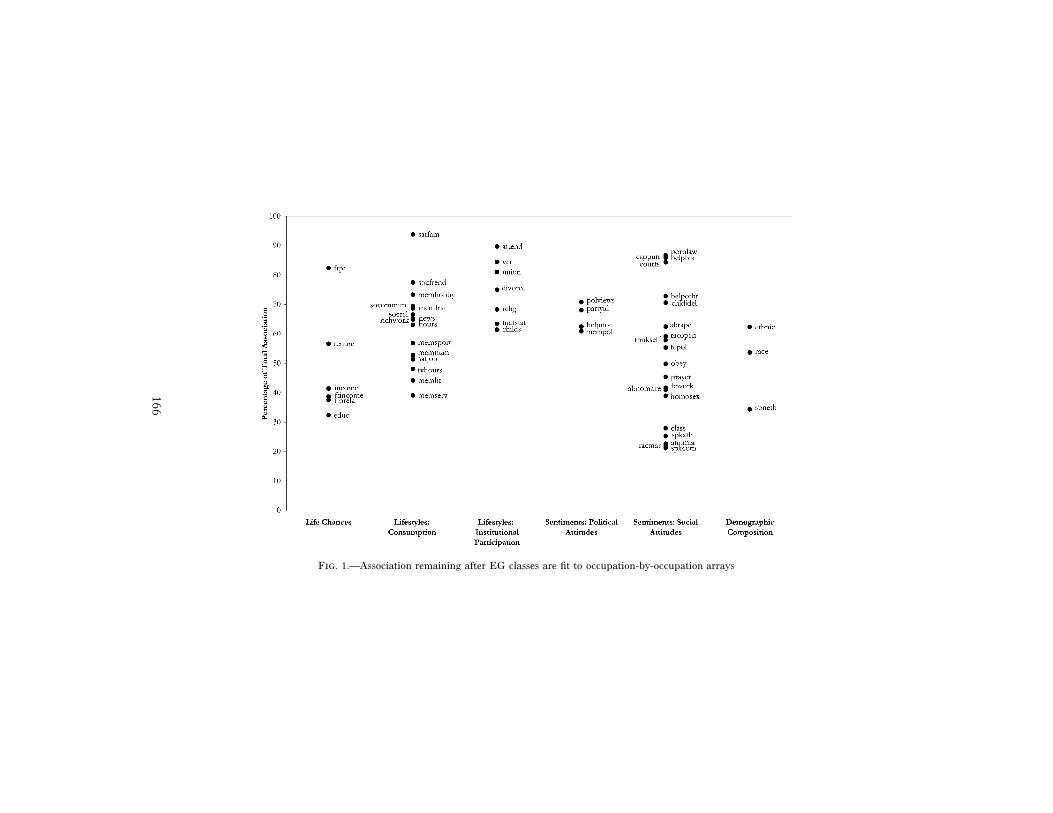
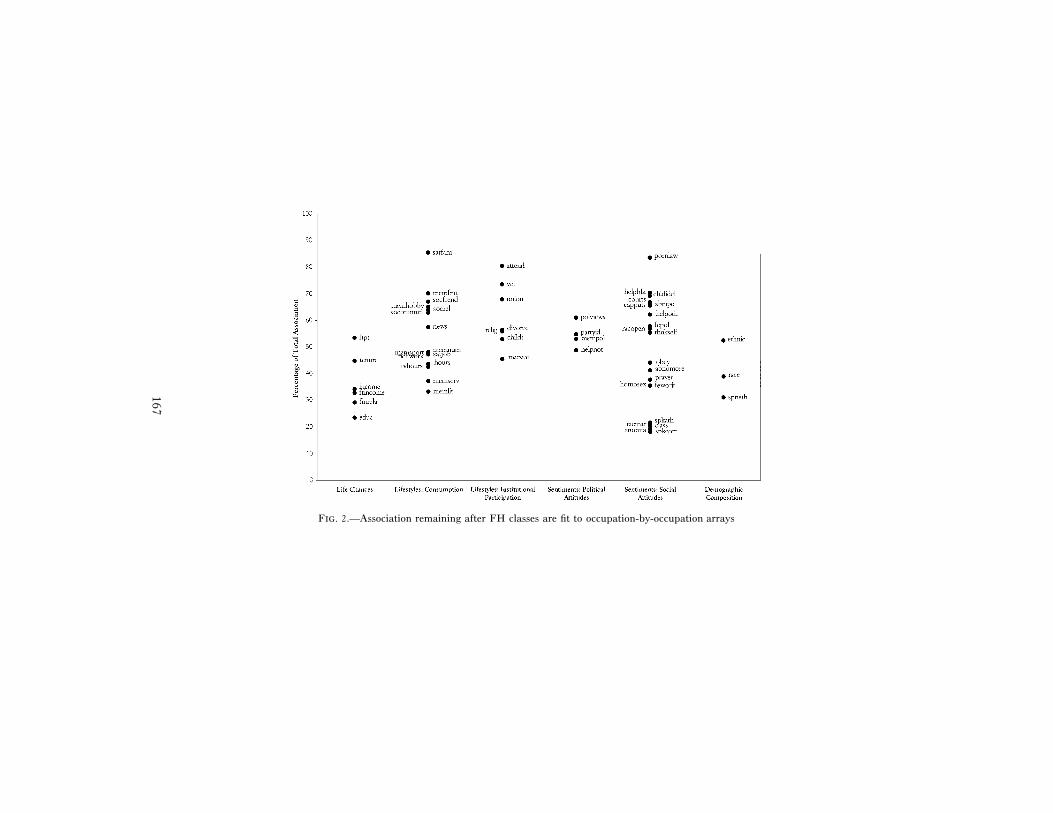
The results of table 2 are average, and, as such, they mask variabilityin the performance of aggregate and gradational approaches across par-ticular outcomes. We explore this variability in figures 1, 2, and 3 bygraphing, for each outcome, the association left unexplained by the twobig-class schemes and the SES scale.20 All three figures show considerablecross-outcome variability, although the costs of aggregating or scaling tendto be substantial regardless of outcome. There are nonetheless some out-liers; for example, conventional big classes capture much of the variabilityin years of schooling, with only 23%–32% of the total association re-maining unexplained by big-class models (see educ, figs. 1 and 2).21 More-over, big classes also capture much of the variation in attitudes that arestrongly affected by schooling, such as the social tolerance items pertaining
20 We privilege an SES scale because it is so frequently used, but our conclusions aremuch the same with other scales.21 We would undoubtedly find much greater within-class heterogeneity if educationwere measured by type of degree achieved (e.g., law, nursing) rather than years ofschooling acquired (see Arum and Hout 1997).
166
Fig. 1.—Association remaining after EG classes are fit to occupation-by-occupation arrays
167
Fig. 2.—Association remaining after FH classes are fit to occupation-by-occupation arrays
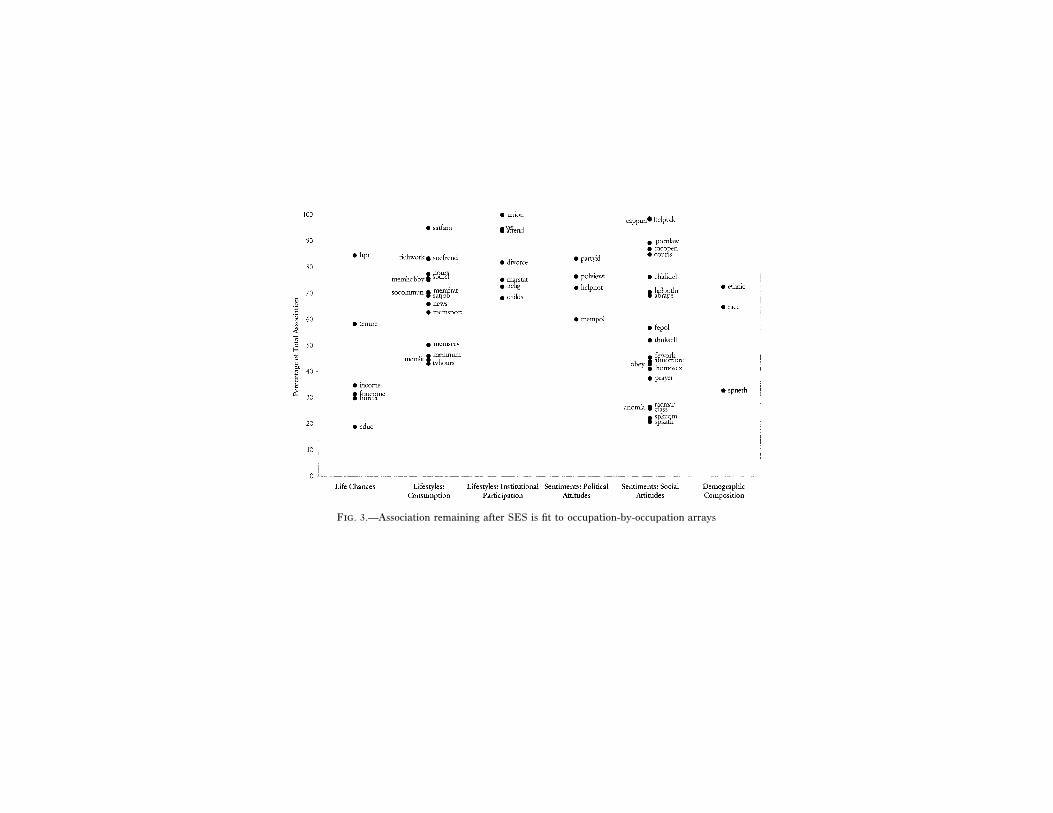
Fig. 3.—Association remaining after SES is fit to occupation-by-occupation arrays
Case for a New Class Map
169
to racial intermarriage and to deviant or minority behaviors. These resultssuggest that some attitudes crystallize in college and are not greatly mod-ified within the occupational communities to which college graduatessubsequently disperse.22
In the life chances domain, some of the items are organized in big-classterms (i.e., educ), whereas others clearly are not. For example, the like-lihood of working full time (as opposed to part time) differs substantiallywithin big classes (see ftpt), presumably because employers, employees,and unions rely on occupation-specific, not classwide, “templates” as theyestablish working conditions. The comparison of bank tellers and postalclerks, both routine nonmanuals, provides a useful illustration of thisconclusion. In recent years, bank tellers have increasingly become part-time employees as banks react to intensified competition with a “low-road” reorganization of the labor force (i.e., reduced benefits, female em-ployment), whereas postal clerks have been protected from suchreorganization because of strong unions and a quasi-public ethos. Becauseworking conditions are governed, at least in part, by forces that play outat the occupational (rather than big-class) level, there is considerable in-teroccupational heterogeneity in such conditions. Likewise, other out-comes within the life chances domain (e.g., income, tenure) also showsubstantial within-class heterogeneity, suggesting that even the strictestof Weberian scholars should consider defining class in less aggregate terms.
The culture domain (i.e., “sentiments and dispositions”) also exhibitsmuch local association, with items pertaining to pornography (pornlaw),abortion (abrape), affirmative action (helpblk), crime and punishment(courts, cappun), and family orientation (chldidel) all registering at the60% level or higher. The shared college experience evidently operates ona select few attitudes, leaving many others to be principally a functionof differential recruitment, self-selection, socialization, and other occu-pation-specific forces. In the lifestyles domain, big classes fail even morespectacularly, sometimes leaving as much as 80%–90% of the associationat the site of production unexplained (e.g., church attendance). The lesson,then, is that conventional class schemes conceal much of the variabilityin life conditions. Although big-class schemes do adequately signal yearsof schooling and a select set of attitudes that are evidently determinedby schooling (e.g., tolerance), they fail to provide the omnibus measureof life conditions that the microlevel agenda demands.
The critic of these results may properly point out that our decompo-sitions capitalize on sampling variability. We have estimated the conse-
22 The “class identification” item (class) is also an outlier. This result is hardly surprisinggiven that the item elicits subjective identification with aggregate rather than disag-gregate classes (see Emmison and Western 1990).
American Journal of Sociology
170
quences of such “overfitting” (see, e.g., Hauser and Logan 1992) by draw-ing five random samples of CPS respondents, each of which reflects theaverage sample size of the GSS tables (approximately 15,000), and thencalculating the residual within-class association for all samples. The latterstatistics may be compared to those obtained for the full CPS sample.23
Across all CPS outcomes, the residual association calculated from theGSS-sized samples is, on average, less than 2% greater than that calculatedfrom the full CPS samples. We conclude that a relatively small proportionof the occupational heterogeneity within big classes is due to parameter-ized noise.24
The case for microclasses is also supported by significance tests. By thisstandard, disaggregate models are favored for 49 to 51 of the 55 outcomevariables, depending on the significance level and class scheme (see app.B).25 Again, there are only minor differences in test results across ourvarious class schemes and scales, with the FH scheme fitting slightly betterthan the EG scheme and SES scale. The FH class model (see eq. [5]) isrejected at the .05 level for all but three variables and at the .01 level forall but six (satfam, socfrend, memhobby, mempolit, fework, helpothr),whereas the EG class model is rejected at the .05 level for all but twovariables and at the .01 level for all but four (memhobby, mempolit,chldidel, helpothr). The SES scale is likewise rejected at the .01 level forall but three outcomes (memhobby, mempolit, helpothr).
If conventional tests of significance favor our disaggregate approach,the BIC criterion (e.g., Raftery 1995) is more ambiguous. Ironically, BICuniversally prefers the less parsimonious occupation models for outcomesdrawn from the relatively large CPS sample, but, conversely, it prefersthe more parsimonious class models for outcomes drawn from the rela-tively small GSS sample. It seems unlikely that all CPS outcomes happento be structured at the occupational level while all GSS outcomes happento be structured at the class level. Moreover, if BIC is rejecting the CPSclass models because CPS items are truly structured at the occupational
23 We aggregate response categories to reflect the level of detail we would have usedhad we been limited to GSS-sized samples. For example, the full CPS sample couldsupport an analysis of five marital statuses, but we would have combined the “wid-owed,” “separated,” and “divorced” categories had only 15,000 cases been available.24 It is relevant here that the correlation between sample size and residual association(in the GSS tables) is positive. If small-sample outcomes were inflating the averagesin table 2, we would expect to find negative correlations.25 The df used in the model contrasts are adjusted to reflect the smoothing procedure.When contrasting the models of eqs. (3) and (5), the appropriate df is given by (I �
, where I is the number of occupations, J is the number of1)(J � 1) � (C � 1)(J � 1)response categories, and C is the number of aggregate classes (see app. B for fit statisticsfor all outcomes). We have not sought to make further adjustments to the df that maybe required in sparse arrays.
Case for a New Class Map
171
level, it should deliver the same verdict for the deflated (i.e., N p) CPS tables. Instead, the BIC values universally switch sign when15,000
applied to these deflated tables, indicating that the disaggregate approachis no longer preferred.26 This reversal of fortune implies that the BICstatistic differs across the GSS and CPS items simply because the CPSoffers larger samples.
It is worth noting that BIC was developed for the case in which con-ventional significance tests encouraged researchers to adopt a complicatedmodel even when the added parameters conveyed little additional infor-mation (see, e.g., Grusky and Hauser 1984; Raftery 1995). We face theopposite situation: the more parsimonious models account for an unac-ceptably low share of the association, but BIC nonetheless encourages us,at least for GSS outcomes, to accept these “counterintuitive” models. Thisconundrum motivated Raftery (1995) to comment that BIC often prefersthe “sociologically unacceptable” but parsimonious model relative to theoverparameterized alternative (pp. 152–53). The standard recommenda-tion in this circumstance is to search for an intermediate model that revealsthe sociologically relevant association, but does so with fewer parameters(e.g., Raftery 1995, p. 153). In the present context, the association leftunexplained by big classes may arise from residual vertical heterogeneity(e.g., SES) within big classes, thus implying that big-class and gradationaleffects should be fit simultaneously. The resulting hybrid model combinesthe specifications of equations (5) and (7):
Sim p a f n m b d g l v q z , (12)ijgp i j g p ig jp ip gp igp j cj
where all symbols are defined as above. We applied this model using theFH scheme and the SES scale.
The fit statistics from this model indicate that very little of the residualassociation within big classes is due to socioeconomic differences amongthe constituent occupations (see fig. 4). For the life chances and toleranceitems, SES captures a respectable percentage of the residual association,which is unsurprising given the dominant weight of education in this scale(Hauser and Warren 1997). However, our hybrid model accounts, on av-erage, for only 14% of the residual within-class association, and it failsconventional significance tests for 48 of the 55 outcomes (at ).a p .05Again, BIC provides a more ambiguous reading, almost universally pre-ferring the parsimonious hybrid models for the GSS variables, while pre-
26 The corollary of this is that if we could analyze CPS-sized samples for the GSSoutcomes, BIC would presumably prefer the occupation models, thereby coming inline with conventional L2 tests.
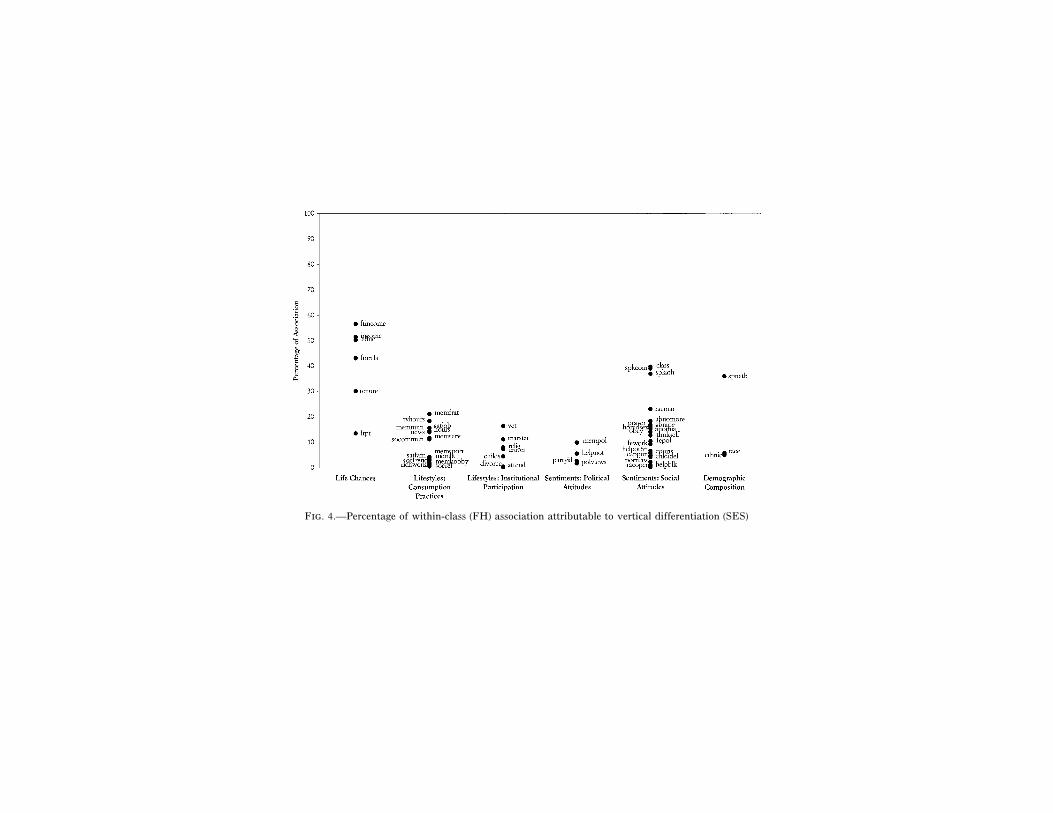
Fig. 4.—Percentage of within-class (FH) association attributable to vertical differentiation (SES)
Case for a New Class Map
173
ferring the occupation models for the CPS variables.27 These results in-dicate that researchers must look elsewhere to find the elusive model thatsimultaneously fits the data, captures an acceptable proportion of the totalassociation at the site of production, and yet meets BIC’s high standardsfor parsimony. We return to this point in our concluding comments.
We conclude this section by calculating parametric indices of thestrength of association at the big-class and occupational levels (see eqs.[10] and [11]). These indices are provided for all 55 outcomes in appendixB and are summarized in table 3. For the most part, values of AR in table3 hover around unity, indicating that there is as much association withinbig classes as between them. The only exceptions to the latter claim arewithin the life chances and demographic domains. In the life chancesdomain, the value of AR registers as high as 1.33, implying that there is33% more heterogeneity between big classes than within them. At thesame time, the absolute amount of within-class heterogeneity in this do-main remains very high, in fact higher than in any other domain. Becausebig-class formulations suppress much heterogeneity in the life chancesdomain, such formulations are problematic even when a pure Weberiandefinition of classes is preferred (see Goldthorpe and McKnight in press,p. 2).
In summary, there is little empirical justification for aggregating oc-cupations, decades of class-analytic practice to the contrary. If the amountof between-class association is regarded as large enough to justify big-class analysis, then the residual within-class association must also be re-garded as large enough to warrant occupational analysis. This is becausethere is just as much occupational variability around the big-class meansas big-class variability around the grand mean. To be sure, the values ofAR are again deflated by overfitting, but not to the extent that our mainconclusion can be questioned.28 Although our critics often suggest thatthere are diminishing returns to moving beyond the usual big-class for-mulations, the data make it clear that analysts will secure just as muchadditional information by expending a within-class degree of freedom asa between-class degree of freedom. These results imply that scholars whoend their analysis at the big-class level do so without empiricaljustification.
27 The only exception is Spanish ethnicity (spneth), a CPS outcome for which BICprefers the hybrid model. In this case, there is little residual association to be explainedat the occupation level, and BIC is on the mark.28 If there is any doubt on this point, it is worth comparing the values of AR in theCPS samples to those in the GSS samples, which are more susceptible to overfitting.The size of this index is similar in the two samples (see app. table B1), suggesting thatoverfitting does not have an unduly large effect.
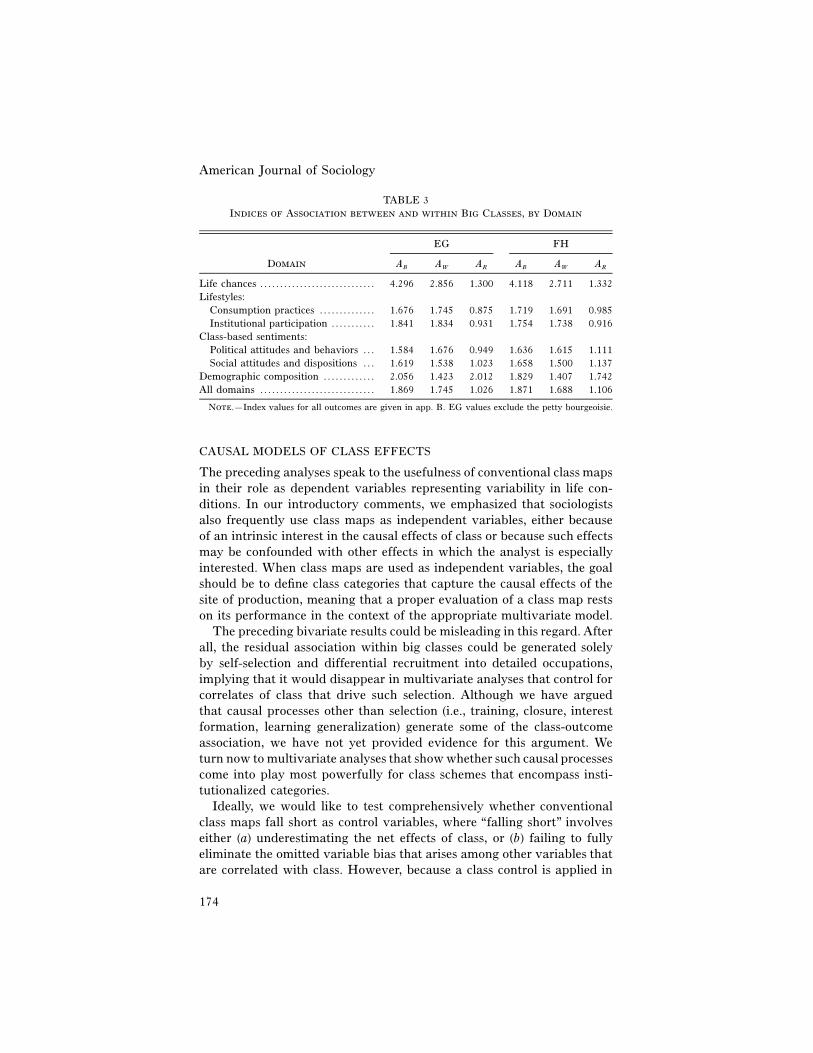
American Journal of Sociology
174
TABLE 3Indices of Association between and within Big Classes, by Domain
Domain
EG FH
AB AW AR AB AW AR
Life chances . . . . . . . . . . . . . . . . . . . . . . . . . . . . . 4.296 2.856 1.300 4.118 2.711 1.332Lifestyles:
Consumption practices . . . . . . . . . . . . . . 1.676 1.745 0.875 1.719 1.691 0.985Institutional participation . . . . . . . . . . . 1.841 1.834 0.931 1.754 1.738 0.916
Class-based sentiments:Political attitudes and behaviors . . . 1.584 1.676 0.949 1.636 1.615 1.111Social attitudes and dispositions . . . 1.619 1.538 1.023 1.658 1.500 1.137
Demographic composition . . . . . . . . . . . . . 2.056 1.423 2.012 1.829 1.407 1.742All domains . . . . . . . . . . . . . . . . . . . . . . . . . . . . . 1.869 1.745 1.026 1.871 1.688 1.106
Note.—Index values for all outcomes are given in app. B. EG values exclude the petty bourgeoisie.
CAUSAL MODELS OF CLASS EFFECTS
The preceding analyses speak to the usefulness of conventional class mapsin their role as dependent variables representing variability in life con-ditions. In our introductory comments, we emphasized that sociologistsalso frequently use class maps as independent variables, either becauseof an intrinsic interest in the causal effects of class or because such effectsmay be confounded with other effects in which the analyst is especiallyinterested. When class maps are used as independent variables, the goalshould be to define class categories that capture the causal effects of thesite of production, meaning that a proper evaluation of a class map restson its performance in the context of the appropriate multivariate model.
The preceding bivariate results could be misleading in this regard. Afterall, the residual association within big classes could be generated solelyby self-selection and differential recruitment into detailed occupations,implying that it would disappear in multivariate analyses that control forcorrelates of class that drive such selection. Although we have arguedthat causal processes other than selection (i.e., training, closure, interestformation, learning generalization) generate some of the class-outcomeassociation, we have not yet provided evidence for this argument. Weturn now to multivariate analyses that show whether such causal processescome into play most powerfully for class schemes that encompass insti-tutionalized categories.
Ideally, we would like to test comprehensively whether conventionalclass maps fall short as control variables, where “falling short” involveseither (a) underestimating the net effects of class, or (b) failing to fullyeliminate the omitted variable bias that arises among other variables thatare correlated with class. However, because a class control is applied in
Case for a New Class Map
175
such a wide range of literatures, a comprehensive test would requireredoing a daunting amount of quantitative social science. We instead offerillustrative analyses of the sources of political beliefs and of leisure timeand overwork. These analyses will provide suggestive evidence on theusefulness of a disaggregate class map for multivariate modeling, serveas a template for future research on the net effects of social class, andalso address debates within sociology that are important in their ownright.
The Sources of Political Beliefs
We begin with an analysis of political beliefs. The relationship betweensocial class and political beliefs has long occupied center stage in strati-fication research, not only in early Marxian scholarship on class and in-terest formation, but also in subsequent post-Marxian investigations ofthe “democratic” class struggle. In the contemporary literature, the em-pirical relationship between class and political behavior remains muchanalyzed, principally for the evidence it brings to bear on the “death ofclass” debates (e.g., Manza and Brooks 1999; Evans 1999; Clark andLipset 2001; Hechter 2004). This literature thus provides a fitting contextfor determining whether conventional class effects are weak merely be-cause class has been poorly operationalized or because, as postmodernistsallege, the site of production is no longer the main stage on which politicalbeliefs develop.
We suspect that the former interpretation is on the mark. When classmodels are recast in terms of institutionalized categories, we expect stron-ger effects to emerge not only because political beliefs are often forged inthe secondary socialization that specialized training provides (e.g., pro-fessional schools), but also because they are maintained and reproducedwithin a “habitus” that can develop in institutionalized and socially closedcategories (e.g., Bourdieu 1984). For example, professional sociologistscome into constant contact with colleagues who are committed to liberalpolitical beliefs, thus reducing exposure to alternative views and raisingthe costs of straying. Although occupation-specific political cultures areprobably most prominent in the professions, they may also emerge in thecrafts (e.g., the political radicalism of printers) and in other relativelyclosed occupations.
We proceed by applying the state-of-the-art causal model developed by
American Journal of Sociology
176
Manza and Brooks (1999). This model can be specified as an orderedlogit:
′F(a � X b) j p 11 i′ ′Pr (yFX ) p F(a � X b) � F(a � X b) 1 ! j X J � 1 (13)i i 1 i j�1 i{ ′1 � F(a � X b) j p J,1 i
where F designates the cumulative logistic distribution, and the numberof response categories, J, equals five. The response variable, yi, thus rangesfrom one (very liberal) to five (very conservative), while aj refers to the
estimated cut points for this variable. The vector Xi includes age,J � 1education, year, sex, race, religion, and the site of production. In the fullmodel, the site of production is represented by detailed occupation effectsand by main effects of self-employment for the professional and mana-gerial FH classes. The implicit claim, by contrast, of conventional classanalysts is that the site of production can be adequately represented bytrimmed models that only allow for FH class effects, SES effects, or acombination of FH class and SES effects.29 We also fit models that omitdemographic variables from Xi and thereby allow us to evaluate theirstrength relative to that of the big-class and detailed occupation variables.
All models are fit to the 1972–2002 GSS data ( ) for re-N p 23,260spondents of ages 18 to 64. The inclusion of the younger group of re-spondents, which is conventional in the class politics literature (e.g.,Manza and Brooks 1999), generates a slightly larger sample than in thebivariate analyses. Although we have omitted respondents who are notin the labor force, supplementary analyses indicate that doing so does notchange our conclusions in any important way (see Manza and Brooks1999).
As table 4 shows, the fit statistics for our models indicate that politicalbeliefs vary substantially by occupation, even after fitting effects for othersocial cleavages. The site of production places second only to religion innet association explained, surpassing such sociological standbys as edu-cation, race, sex, and region (table 4). Of the production-based association,FH classes account for 16.7%, while vertical heterogeneity within classesaccounts for a mere 2.3%. Nominally, this result implies that scholars whorepresent social class with the standard 12-category FH scheme will ignoreover three-quarters of the story, although overfitting again leads to aslightly inflated estimate. Classicists will note that the likelihood-ratiocontrasts favor the detailed occupation model ( with 115 df;2L p 742.3table 4), whereas Bayesians will note that BIC prefers the more parsi-
29 We continue to use SES scores aggregated to the 126-occupation level, thus allowingus to decompose the total association generated at the site of production.
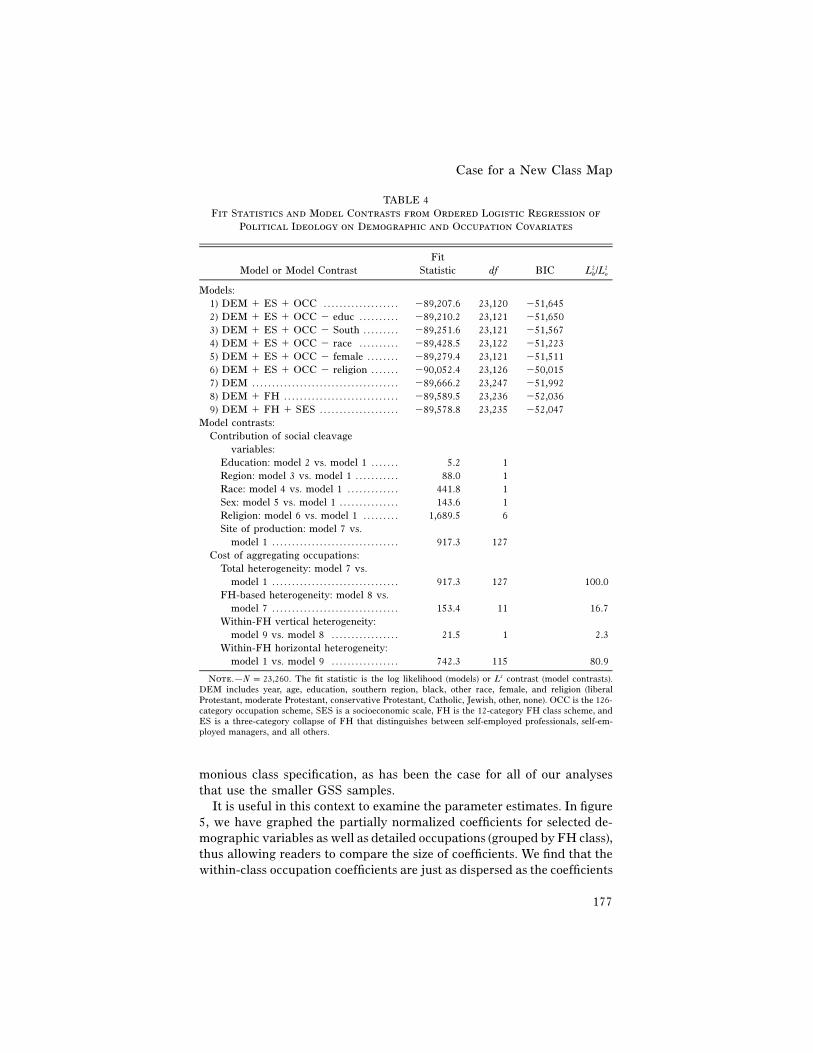
Case for a New Class Map
177
TABLE 4Fit Statistics and Model Contrasts from Ordered Logistic Regression of
Political Ideology on Demographic and Occupation Covariates
Model or Model ContrastFit
Statistic df BIC 2 2L /Lh o
Models:1) DEM � ES � OCC . . . . . . . . . . . . . . . . . . . �89,207.6 23,120 �51,6452) DEM � ES � OCC � educ . . . . . . . . . . �89,210.2 23,121 �51,6503) DEM � ES � OCC � South . . . . . . . . . �89,251.6 23,121 �51,5674) DEM � ES � OCC � race . . . . . . . . . . �89,428.5 23,122 �51,2235) DEM � ES � OCC � female . . . . . . . . �89,279.4 23,121 �51,5116) DEM � ES � OCC � religion . . . . . . . �90,052.4 23,126 �50,0157) DEM . . . . . . . . . . . . . . . . . . . . . . . . . . . . . . . . . . . . . �89,666.2 23,247 �51,9928) DEM � FH . . . . . . . . . . . . . . . . . . . . . . . . . . . . . �89,589.5 23,236 �52,0369) DEM � FH � SES . . . . . . . . . . . . . . . . . . . . �89,578.8 23,235 �52,047
Model contrasts:Contribution of social cleavage
variables:Education: model 2 vs. model 1 . . . . . . . 5.2 1Region: model 3 vs. model 1 . . . . . . . . . . . 88.0 1Race: model 4 vs. model 1 . . . . . . . . . . . . . 441.8 1Sex: model 5 vs. model 1 . . . . . . . . . . . . . . . 143.6 1Religion: model 6 vs. model 1 . . . . . . . . . 1,689.5 6Site of production: model 7 vs.
model 1 . . . . . . . . . . . . . . . . . . . . . . . . . . . . . . . . 917.3 127Cost of aggregating occupations:
Total heterogeneity: model 7 vs.model 1 . . . . . . . . . . . . . . . . . . . . . . . . . . . . . . . . 917.3 127 100.0
FH-based heterogeneity: model 8 vs.model 7 . . . . . . . . . . . . . . . . . . . . . . . . . . . . . . . . 153.4 11 16.7
Within-FH vertical heterogeneity:model 9 vs. model 8 . . . . . . . . . . . . . . . . . 21.5 1 2.3
Within-FH horizontal heterogeneity:model 1 vs. model 9 . . . . . . . . . . . . . . . . . 742.3 115 80.9
Note.— . The fit statistic is the log likelihood (models) or L2 contrast (model contrasts).N p 23,260DEM includes year, age, education, southern region, black, other race, female, and religion (liberalProtestant, moderate Protestant, conservative Protestant, Catholic, Jewish, other, none). OCC is the 126-category occupation scheme, SES is a socioeconomic scale, FH is the 12-category FH class scheme, andES is a three-category collapse of FH that distinguishes between self-employed professionals, self-em-ployed managers, and all others.
monious class specification, as has been the case for all of our analysesthat use the smaller GSS samples.
It is useful in this context to examine the parameter estimates. In figure5, we have graphed the partially normalized coefficients for selected de-mographic variables as well as detailed occupations (grouped by FH class),thus allowing readers to compare the size of coefficients. We find that thewithin-class occupation coefficients are just as dispersed as the coefficients
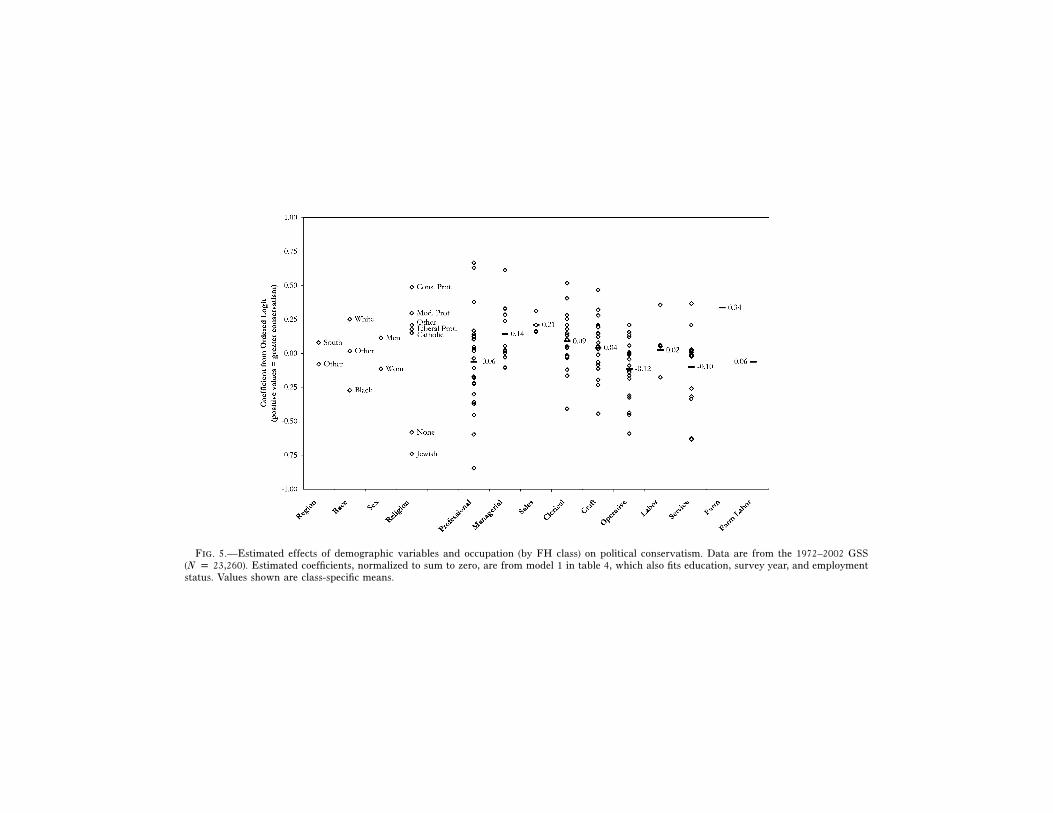
Fig. 5.—Estimated effects of demographic variables and occupation (by FH class) on political conservatism. Data are from the 1972–2002 GSS(N p 23,260). Estimated coefficients, normalized to sum to zero, are from model 1 in table 4, which also fits education, survey year, and employmentstatus. Values shown are class-specific means.
Case for a New Class Map
179
for other major covariates of political beliefs (e.g., race, gender, region).Moreover, this heterogeneity emerges in all of the big classes, not just theprofessions. By implication, scholars who deem it necessary to includemeasures of race, gender, or region in their models would seem obligedto include measures of detailed occupation as well. While big-class effectsare significant (table 4), figure 5 makes it clear that they fail to accountfor much of the structure at the site of production, leaving conventionalclass analysts open to the postmodernist critique that their star variableis rather weak.
The Sources of Overwork
We turn now to our analysis of working hours. This topic has attractedmuch scholarly attention, presumably because work commitments affectleisure time, serve as a natural starting point in understanding the shiftingbalance between work and family obligations, and set limits on earningsand economic security (Jacobs and Gerson 2001, p. 40). In recent schol-arship, long-term trends in working hours are widely debated, with manyanalysts reporting a substantial increase in working hours and a conse-quent decline of leisure (Schor 1991; cf. Jacobs and Gerson 2001; Robinsonand Godbey 1997). According to Hochschild (1997), work commitmentsare also increasingly encroaching on the needs of families, as employeescome to appreciate the workplace as a refuge from the demands of familylife.
This line of research rests decisively on quantitative models of theindividual and institutional sources of “overwork.” In conventional modelsof overwork, scholars often fit a big-class “professions effect,” but moredetailed occupational effects have not, to our knowledge, been estimated.The latter effects are likely to arise through two mechanisms. First, work-ers who enter “greedy” occupations (Coser 1974) encounter and interactwith like-minded employees who, in a gruesome display of workaholiccodependency, encourage each other to work yet longer hours (e.g., Freid-son 1994; Epstein et al. 1999). In the terminology of table 1, this is a formof interactional closure whereby workplace practices, such as norms aboutworking hours, diffuse widely and are internalized by occupation mem-bers. Second, work practices are embedded in an institutional contextthat, for at least some occupations, place real limits on individual dis-cretion over work hours. The medical residency, for example, requiresphysicians to log (and become accustomed to) long hours, while the typicalpractice of measuring productivity by billable hours encourages lawyersto do the same. By contrast, the accounting profession has a built-incyclical workload, meaning that most accountants will work long hoursonly during tax season. These examples, all of which speak to the insti-
American Journal of Sociology
180
tutionalization of conditions (see table 1), suggest that work hours arelikely to vary substantially by occupation rather than big class.
We estimate a logistic regression model that predicts whether respon-dents usually work 49 hours or longer in a given week. This model, whichis applied to data from the 1998–2002 outgoing rotation group (ORG)files of the CPS ( ), takes the following form:30N p 306,420
Pr (Y p 1)iln p a � b X , (14)x i[ ]1 � Pr (Y p 1)i
where Yi is a dichotomous variable coded unity if the respondent usuallyworks 49 or more hours a week at his or her main job and zero otherwise.The vector Xi contains the covariates that conventionally appear in modelsof overwork: years of education, race (white, African-American, AsianAmerican, Native American, and Hispanic), sex, age in years, the squareof age, presence of a spouse in the home, presence of a child in the home(no child, youngest child 0–2 years old, youngest child 3–5 years old,youngest child 6–13 years old, youngest child 14–17 years old), and in-teraction terms between sex and the family status variables.31 As in thepreceding analysis, Xi also contains measures of FH class, SES, detailedoccupation, and employment status. We can again assess the relative con-tributions of demographic variables, big classes, and detailed occupationsby estimating models containing various permutations of the elements ofXi.
The fit statistics from these logistic regression models (see table 5) revealtwo noteworthy results. First, the site of production again has a substantialeffect on the odds of overwork, even after controlling for the demographicand family attributes that presumably affect recruitment or self-selectioninto class locations. Second, the decomposition of the site-of-productioneffect into big-class, vertical, and horizontal components reveals that ag-gregation entails a substantial cost, although big classes perform betterin this analysis than in the preceding one. As table 5 shows, the FH class
30 We use the ORG files (instead of the March files; see BLS [2004]) because theyinclude a measure of “usual hours” at the main job. For 7.5% of the cases, we assumethat hours worked last week can proxy for usual hours, thereby reducing the percentageof cases with missing data to 0.6. The sample is restricted to the adult civilian laborforce in households in month four of their CPS rotation.31 In some economic analyses of overwork, family income is included to signal reser-vation wages, and hourly wages are included to measure the benefits of workingadditional hours. We exclude these variables because they are partly endogenous:family income will rise with hours worked, and hours worked are used to calculatehourly wages for salaried workers. Thus, the occupation effects in our models may becapturing, in part, omitted income and wage effects. If including these regressorsweakens occupation effects, the interpretation would be unclear.
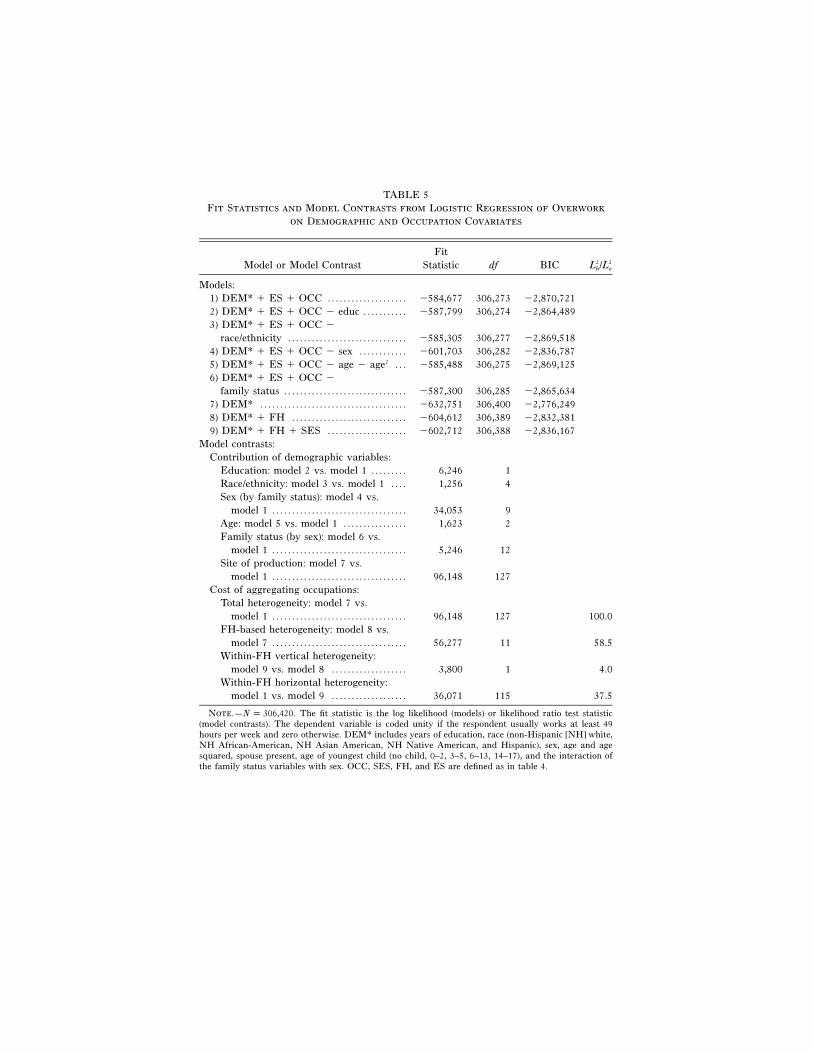
TABLE 5Fit Statistics and Model Contrasts from Logistic Regression of Overwork
on Demographic and Occupation Covariates
Model or Model ContrastFit
Statistic df BIC 2 2L /Lh o
Models:1) DEM* � ES � OCC . . . . . . . . . . . . . . . . . . . . �584,677 306,273 �2,870,7212) DEM* � ES � OCC � educ . . . . . . . . . . . �587,799 306,274 �2,864,4893) DEM* � ES � OCC �
race/ethnicity . . . . . . . . . . . . . . . . . . . . . . . . . . . . . . �585,305 306,277 �2,869,5184) DEM* � ES � OCC � sex . . . . . . . . . . . . �601,703 306,282 �2,836,7875) DEM* � ES � OCC � age � age2 . . . �585,488 306,275 �2,869,1256) DEM* � ES � OCC �
family status . . . . . . . . . . . . . . . . . . . . . . . . . . . . . . . �587,300 306,285 �2,865,6347) DEM* . . . . . . . . . . . . . . . . . . . . . . . . . . . . . . . . . . . . . �632,751 306,400 �2,776,2498) DEM* � FH . . . . . . . . . . . . . . . . . . . . . . . . . . . . . �604,612 306,389 �2,832,3819) DEM* � FH � SES . . . . . . . . . . . . . . . . . . . . �602,712 306,388 �2,836,167
Model contrasts:Contribution of demographic variables:
Education: model 2 vs. model 1 . . . . . . . . . 6,246 1Race/ethnicity: model 3 vs. model 1 . . . . 1,256 4Sex (by family status): model 4 vs.
model 1 . . . . . . . . . . . . . . . . . . . . . . . . . . . . . . . . . . 34,053 9Age: model 5 vs. model 1 . . . . . . . . . . . . . . . . 1,623 2Family status (by sex): model 6 vs.
model 1 . . . . . . . . . . . . . . . . . . . . . . . . . . . . . . . . . . 5,246 12Site of production: model 7 vs.
model 1 . . . . . . . . . . . . . . . . . . . . . . . . . . . . . . . . . . 96,148 127Cost of aggregating occupations:
Total heterogeneity: model 7 vs.model 1 . . . . . . . . . . . . . . . . . . . . . . . . . . . . . . . . . . 96,148 127 100.0
FH-based heterogeneity: model 8 vs.model 7 . . . . . . . . . . . . . . . . . . . . . . . . . . . . . . . . . . 56,277 11 58.5
Within-FH vertical heterogeneity:model 9 vs. model 8 . . . . . . . . . . . . . . . . . . . 3,800 1 4.0
Within-FH horizontal heterogeneity:model 1 vs. model 9 . . . . . . . . . . . . . . . . . . . 36,071 115 37.5
Note.— . The fit statistic is the log likelihood (models) or likelihood ratio test statisticN p 306,420(model contrasts). The dependent variable is coded unity if the respondent usually works at least 49hours per week and zero otherwise. DEM* includes years of education, race (non-Hispanic [NH] white,NH African-American, NH Asian American, NH Native American, and Hispanic), sex, age and agesquared, spouse present, age of youngest child (no child, 0–2, 3–5, 6–13, 14–17), and the interaction ofthe family status variables with sex. OCC, SES, FH, and ES are defined as in table 4.
American Journal of Sociology
182
scheme accounts for 58.5% of the total association at the site of production,while the remaining 41.5% is attributable to within-class heterogeneity,of which a mere 4.0% is credited to SES. The within-class effects accountfor a smaller share of the association than in the prior analysis, but BICnonetheless now prefers the model that fits detailed occupation effects.32
The case for disaggregate analysis is strengthened by examining thecoefficients themselves. In figure 6, we have graphed the additive coef-ficients for selected covariates of overwork, thus facilitating a comparisonof effects across variables. We find that intraclass differences in workingpractices dwarf differences between categories of the demographic vari-ables. Again, such occupational effects emerge not only in the professions,but also within the managerial, clerical, craft, operative, and serviceclasses. For example, restaurant managers are four times more likely thangovernment managers and officials to work long hours, even after con-trolling for employment status. This disparity is likely driven less byrestaurant managers’ preference for long hours than by differences inwork conditions. That is, restaurant managers are often required to beavailable during the full range of hours when customers want service,whereas government officials are rarely so obligated. The big class of craftworkers is also heterogeneous; for example, automobile mechanics arethree times more likely to work long hours than printers, a disparity nodoubt attributable to the success of printers in gaining union contractsthat place explicit restrictions on the amount of overtime and that reducethe need for overtime by protecting superfluous positions in the face ofdeclining demand. These results suggest, then, that conventional big-classmodels fail in the analysis of overwork because they do not operate atthe level at which workplace practices, such as hours worked, areinstitutionalized.
DISCUSSION
The class analytic tradition has come under attack from postmodernists,anti-Marxists, and other commentators who argue that social class is anantiquated concept of little use in understanding modern or postmoderninequality (e.g., Pakulski and Waters 1996; Kingston 2000; Clark andLipset 1991, 2001; Pahl 1989). In large part, the retreat from class analysisshould be blamed on class analysts themselves, because they continue toresort to old class categories that are no longer deeply institutionalized inthe labor market, if ever they were. The main empirical cost of using
32 If we instead specify the dependent variable as the logit of full-time work status oras a continuous measure of work hours, conventional significance tests and BIC stillprefer the detailed occupation model.
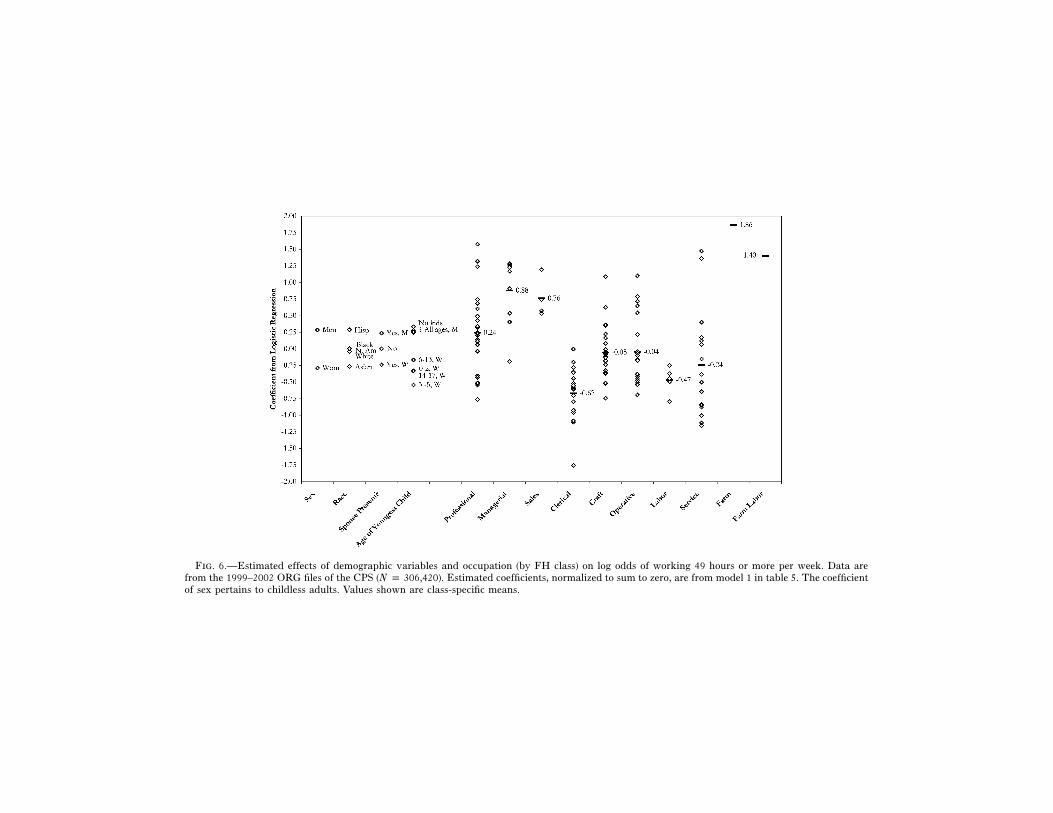
Fig. 6.—Estimated effects of demographic variables and occupation (by FH class) on log odds of working 49 hours or more per week. Data arefrom the 1999–2002 ORG files of the CPS (N p 306,420). Estimated coefficients, normalized to sum to zero, are from model 1 in table 5. The coefficientof sex pertains to childless adults. Values shown are class-specific means.
American Journal of Sociology
184
such categories is that they are poorly correlated with the life conditionsthat they are supposed to represent and the individual-level behaviorsthat they are supposed to explain. This empirical weakness of big classes(e.g., Kingston 2000) has unfortunately led to strong and overstated claimsabout the declining importance of the site of production itself (esp. Hall2001). That is, postmodernists and other critics of class analysis haveignored the possibility that the site of production is well organized at thelocal level and that conventional class analysts, by virtue of their obsessionwith big-class formulations, have simply failed to capture this localstructure.
Why has so much local structure developed in advanced industrialsocieties?33 Up to this point, we have merely argued that institutionalizedgroupings are generated mainly at the local level, and that these localgroupings should be exploited when constructing class categories. We havenot, however, discussed why structure tends to emerge and become in-stitutionalized at the local level. As we see it, the usual Smithian ([1776]1991) account is relevant, because it points to the gross inefficiencies thatwould obtain if firms in large-scale societies relied on big-class generaliststo staff positions. We doubt, for example, that a Silicon Valley computerfirm could survive by hiring “service class” generalists who were at onceresponsible for computer programming, accounting, lawyering, market-ing, and all the other tasks that the EG service class now encompasses.To be sure, standard stories about postoccupationalization (e.g., Casey1995) suggest that there are limits to the returns to specialization, buteven the most radical postoccupationalists would recognize that the di-vision of labor implied by big-class categories is far too gross to be efficientin the modern context.
Although Smith (1991) argues at length about the efficiency of thedivision of labor, he does not speak to why a particular division of laborcomes to be institutionalized in the form of occupations. The division oflabor could well take on a purely idiosyncratic form in which each firmdevises from scratch its own system of job categories and then relies onin-house training in staffing them. However, rather than resorting to suchin-house solutions, most firms fall back on the prepackaged solutions thatthe occupational division of labor represents, presumably because (a) itwould be costly to reinvent the division of labor, (b) these prepackagedsolutions allow firms to outsource occupation-specific training to voca-tional and professional schools and hence capitalize on the returns to scalewithin the training production function, and (c) such solutions protectfirms from the risk involved in providing lengthy firm-specific trainingto employees who could subsequently exit the firm. From the perspective
33 We thank Miller McPherson for sparking our interest in this question.
Case for a New Class Map
185
of workers, this solution also has its advantages, most obviously that ofproviding them with marketable general human capital as well as theorganizational means (e.g., professional associations) for capturing rentthrough social closure (e.g., Sørensen 2000; Weeden 2002). Granted, arange of institutional solutions to these organizational problems is avail-able, with some societies (e.g., Japan) opting for well-developed internallabor markets that allow them to reduce, if only to some extent, theirreliance on occupational training. Although some variability in the extentof occupationalization is clearly possible, all modern labor markets drawheavily on prepackaged occupational solutions (see Brinton in press).
It does not follow that the division of labor realized in contemporarylabor markets is by any means optimal. The combined effects of inertiaand partisan interoccupational struggle result in suboptimal solutions thatpersist by virtue of path dependency (e.g., Abbott 1988). The currentdivision of labor among, for example, opticians, optometrists, and oph-thalmologists reflects the strategic decisions that each occupation has madein competing for particular tasks, the power that they can bring to bearon organizations (e.g., licensing boards) that legitimate and support par-ticular divisions of labor, and a myriad of other historically contingentcircumstances. If an efficiency account cannot predict the particular di-vision of labor that obtains, it does at least tell us that a far more spe-cialized division of labor than that implied by conventional big-classschemes will emerge. In this sense, the blunt instrument of efficiency onlyselects out grossly suboptimal solutions, such as those embodied in con-ventional big-class schemes.
Why, then, have generations of class analysts aggregated deeply insti-tutionalized local categories into big classes? It is not merely that Marxformulated his class model at a time when the scale of production wasfar smaller and hence the division of labor was less developed. Moreimportant, the main objective of Marxian class analysis has long been tomake inferences about the fundamental interests of workers (and hencethe likelihood of collective action), and such interests were presumed tobe similar among all workers regardless of their occupation. As noted inthe introduction, these models of macrolevel class action are now lessfashionable, and class analysts have accordingly become less interestedin identifying fundamental interests and more interested in explaining“surface-level” behaviors and attitudes (Holton and Turner 1989). Thisrecasting of class analysis, which has occurred gradually and withoutmuch fanfare, has so far rested on the assumption that the aggregate classmodels devised for old macrolevel analysis can also serve well the newmicrolevel agenda. We have argued, to the contrary, that aggregate classmodels fall short for this new agenda because they are largely nominaland hence must rest on weak rational choice mechanisms for their ex-
American Journal of Sociology
186
planatory power. If class analysts are serious about developing class-basedaccounts of individual-level outcomes, they would be well advised toformulate new class categories that meet the demands of microlevelanalysis.
Our results for U.S. data are consistent with this line of argument. Wefind, for example, that conventional aggregate models mask approxi-mately half of the total association at the site of production, while gra-dational models perform even worse. As table 2 shows, the various ag-gregate and gradational approaches differ only modestly in the amountof structure they capture, meaning that the crucial decision is not whichaggregate class map or vertical scale to adopt, but the logically prior oneof whether to aggregate or scale occupations at all. This conclusion holdsfor the wide range of criterion variables in terms of which big classeshave historically been defined or justified. Indeed, our results eventhreaten neo-Weberian versions of big-class analysis, given that conven-tional big classes aggregate occupations that differ substantially in theirlife chances (see table 3).
We have also examined the viability of big-class formulations in thecontext of multivariate explanatory models. In our analysis of politicalbeliefs, we found that detailed occupations account for over 80% of theassociation at the site of production, even when socioeconomic scales areallowed to absorb residual vertical heterogeneity within big classes. Al-though big classes perform somewhat better in our multivariate modelsof overwork, they still conceal about 40% of the variability in this de-pendent variable. If social classes are indeed the “crack troops in soci-ologists’ war on unexplained variance” (DiMaggio 2001, p. 542), suchsizable losses in explanatory power should give pause.
The skeptic might well argue that our microclass models must neces-sarily perform well because they expend so many degrees of freedom. Thisis not a defensible position. For almost all outcomes, the test statistics forour microclass models are reduced by an amount that is far in excess ofwhat would be expected given the degrees of freedom expended, and ourparametric measures further indicate that there is as much associationwithin big classes as between them. The latter result implies that, insofaras the amount of between-class association is regarded as large enoughto justify big-class analysis, then so too the residual within-class associ-ation must be regarded as large enough to justify occupational analysis.In short, there is no warrant for ending analysis at the big-class level,because just as much structure is revealed by continuing on and analyzingwithin-class variability.
Why are microclass categories so powerful? Unlike big classes, micro-classes are institutionalized through various closure-generating mecha-nisms (e.g., associations), and this social clothing worn by functionally
Case for a New Class Map
187
similar jobs gives them much explanatory power (even though they cannotcapture simple hierarchical effects to the extent that big-class categoriescan). There are four mechanisms, in particular, through which institu-tionalized categories come to be filled with workers who are similar toone another (see table 1). First, many occupations have preexisting ste-reotypes (about the skills, proclivities, and personalities of incumbents)that attract workers who find those stereotypes appealing and repel thosewho do not, thereby converting the stereotypes into self-fulfilling proph-ecies (i.e., self-selection). Second, such recruits are often subjected to ex-plicit training in the form of vocational programs, apprenticeships, orgraduate or professional school, all of which generate occupation-specifichomogeneity in behaviors and worldviews (i.e., training). Third, socialinteraction occurs disproportionately within occupational boundaries evenafter the formal training period is completed, thus preserving and rein-forcing occupation-specific lifestyles and worldviews (i.e., interactionalclosure). Fourth, because employers from diverse firms and industriesconstruct jobs in accord with the same occupational templates, there ismuch within-occupation consistency in working conditions (i.e., institu-tionalization of conditions). These four processes combine to convert tech-nical categories into socially meaningful ones and to generate closed group-ings at the occupation level.
In some cases, such closure-generating processes also operate at the big-class level, but typically in weakened form. For example, postsecondaryschools provide generalized socialization for members of a broadly definedEG “service class,” generating some cultural homogeneity at the big-classlevel through training and ongoing interactional closure. Consistent withthis interpretation, we found evidence of considerable big-class homo-geneity in those outcomes (e.g., attitudes toward racial intermarriage) thatreflect the liberalizing and tolerance-inducing effects of postsecondaryschooling (see figures 1 and 2). Although there is, then, some opportunityfor generalized socialization at the big-class level, scholars more oftenargue that a rational action mechanism generates big-class effects. To besure, a rational action mechanism also operates for institutionalized group-ings, but it is supplemented by a package of additional sociological forces(i.e., self-selection, training, interactional closure, institutionalization ofconditions) that generate additional explanatory power.
The preceding discussion makes the case that scholars have overin-vested in the search for aggregate classes and underinvested in the studyof more deeply institutionalized groupings at the disaggregate level. Thecritic might well counter, however, that the study of local organization isperfectly suitable for scholars of occupations and professions, but is hardlythe heady stuff appropriate for class analysis proper (see Goldthorpe 2002;Kingston 2000). This reaction, while understandable, fails to appreciate
American Journal of Sociology
188
the classlike behavior that emerges at the local level. We have arguedelsewhere (e.g., Grusky and Weeden 2001, 2002) that occupations actcollectively on behalf of their members, extract rent and exploit non-members, and otherwise behave precisely as class theorists have longthought aggregate classes should. Although class analysts are free to claimthat such processes are of interest only when revealed at aggregate levels,this reaction closes off an important route for revitalizing class analysisand protecting it from those who exploit the characteristic weakness ofbig classes to advance (misleadingly) broader claims about the irrelevanceof the site of production. If class analysts can move beyond their obsessionwith big groupings and own up to the explanatory power of smallerclasslike groupings, the microlevel business of class analysis can be ad-dressed in much more persuasive ways.
We appreciate that our analyses are merely a first step in building anew microlevel class analysis that capitalizes on these homogeneity-inducing mechanisms. For most items, we now know that conventionalaggregate schemes fail to capture much of the structure at the site ofproduction, but we have not established that our own disaggregate schemedominates other possible class schemes that are either more or less dis-aggregate. We are referring, for example, to (a) hybrid schemes that fitbig classes in some regions of the division of labor and detailed occupationsin others, (b) occupational scaling schemes that convert occupations intoabstract variables, and (c) suboccupational scaling schemes that convertjobs into abstract variables. The first two alternatives presume that ourmicroclass scheme is too disaggregate and that a simpler specificationshould be sought, whereas the third alternative presumes that our schemeis too aggregate and that more fine-grained schemes should be pursued.We argue below that some of these alternatives do not have much em-pirical support, while others are plausible and should be explored further.
We begin by asking whether institutionalized occupational categoriesare as widespread as our microclass model assumes. For reasons of par-simony, it might make sense to search for a middle-ground model thatdisaggregates those big classes in which closure has flourished at thedetailed occupational level, but retains big classes whenever such occu-pationalization has been suppressed. In a follow-up paper (Weeden andGrusky in press), we have estimated a hybrid model that allows for oc-cupationalization in the professional, craft, and service sectors but retainsbig classes elsewhere in the division of labor, thereby taking seriously thelong-standing claim that occupationalization has proceeded unevenly (e.g.,Wilensky 1966). We find that this hybrid model fits poorly because thereis substantial microclass variability in all big classes, even those in whichoccupationalization presumably has been suppressed. Evidently, occu-pationalization has diffused well beyond the boundaries of the professional
Case for a New Class Map
189
and craft classes, thus undermining the rationale for a model that selec-tively allows for big classes in some regions but not others (see Weedenand Grusky [in press] for details).
Can a more parsimonious specification be achieved by modeling thisintraclass heterogeneity as a function of occupation-level variables (e.g.,authority, prestige, SES)? The resulting “scaling model” has only rarelybeen applied in the context of big-class mappings, presumably becausethey contain too few categories to adjudicate between the many competingscales of interest. Scaling is, however, tractable in a microclass context inwhich many more degrees of freedom are available (see Hout 1984, 1988;Hout and Jackson 1986). The question that then arises is whether sucha scaling exercise is likely to pay off in this data-rich context.
The answer to this question depends on the purpose of the research.For analysts who wish merely to apply a “control” for social class, itwould be superfluous, for example, to scale occupations. After all, if ascaled version of the class mapping cannot fully capture the structure atthe site of production, then the analyst who nonetheless uses the scale isneedlessly risking omitted variable bias. In this research context, the mainobjective should be to ensure that the coefficients of interest are unbiased,which requires class effects to be represented in their entirety.
The role for scaling is also circumscribed in analyses that assess theoverall strength of the class effect rather than its particular pattern acrossthe categories of the class variable. We care about the overall strength ofclass effects when we ask, for example, how deeply the “class principle”has been institutionalized in different time periods, countries, or socialgroupings (e.g., races, ethnic groups). The scholar addressing such de-scriptive questions is obligated to apply a class map that fully capturesthe association at the site of production and is therefore sensitive to allforms of change or variability in the global class effect. Given this obli-gation, the secondary step of scaling the underlying class categories is notonly superfluous, but also counterproductive if it conceals some of thisstructure. We might add that all of the scales considered here (e.g., SES,prestige, cultural capital) are counterproductive in this sense.
A scaling exercise is more useful, however, when class analysts entertainhypotheses about the pattern of class effects, not just their overall strength.It is often hypothesized, for example, that incumbents of higher socialclasses are more likely to read newspapers, participate in “high culture,”vote for conservative candidates, or join churches and other voluntaryassociations. These types of hypotheses can be addressed by scaling classesin terms of SES (or some other gradational index) and assessing whetherthe socioeconomic effect is in the predicted direction. Even in this context,the analyst will want to begin with a model that fits the full complementof occupation effects, with the question then being whether the variability
American Journal of Sociology
190
revealed in this full model follows a socioeconomic gradient. As we haveemphasized, it is useful to formalize this test by explicitly scaling the classcategories (rather than merely inspecting the unconstrained pattern ofclass differences), a constraint that becomes viable only when there areenough class categories to test it reliably. We hope, then, that our newclass map will reinvigorate the scaling tradition by making it possible todistinguish successfully between competing hypotheses about the under-lying pattern of class effects.
It follows that class analysis should rest on two forms of class maps,a microclass base that is used for purging class effects or measuring theiroverall strength, and various scalings of that base that are used to testhypotheses about the underlying pattern of the occupational parameters.If we part ways with advocates of scaling, it is only because they presumethat a categorical map has no role in class analysis and can be replacedfor all research purposes with a parsimonious scaling. As we have argued,a scale could legitimately serve all research purposes only if it capturedall available structure at the site of production, a daunting requirementin light of our own negative results on the explanatory power of SES,prestige, and other scales (see fig. 4). Although it is worth searching fornew variables that perform better, it is unrealistic to expect that a completeaccount will be developed in the near term.
We have so far addressed criticisms of our microclass approach thatinvolve simplifying it, either by restoring big classes in selected regionsof the class structure or by converting occupations into underlying “di-mensions” that explain interclass variability. We next consider the critiquethat our model is overly aggregate because it ignores suboccupationalforms of organization (e.g., Kohn 2001; Halaby and Weakliem 1993).Under this formulation, occupations are dismissed as largely arbitraryconstructions that mask real differences in job-level work conditions, andjobs instead become the base units of analysis. Given the intractably largenumber of jobs, some form of simplification is typically necessary. How-ever, instead of aggregating up to socially constructed occupational bound-aries, job-level analysts prefer to identify the technical conditions of workthat distinguish jobs (e.g., autonomy, authority, complexity) and presum-ably affect behavior and attitudes (Shu et al. 1996; Kohn and Schooler1983; Mortimer and Lorence 1979).
This approach has clearly yielded important results. At the same time,because jobs that share the same working conditions are not typicallyorganized into meaningful groups, the resulting class model cannot cap-ture the social effects of selection, shared training, and interactional clo-sure. We have argued at length that the explanatory losses involved inforegoing these social effects may be substantial. In ignoring institution-alized categories, the advocates of job-level scaling presume, as do many
Case for a New Class Map
191
class analysts, that sociologists should be oriented toward discerning thosedeeper analytic forces that are concealed from ordinary view. This anti-institutional bias can and should be subjected to empirical test. If ourskepticism is on the mark, the returns to disaggregating big classes intooccupations should be substantial, whereas the returns to disaggregationbeyond the occupational level should quickly diminish. This paper con-firms the first hypothesis, but the second has yet to be tested.
The typical analyst of jobs might also argue that the usual job-levelmeasures of working conditions can help explain interoccupation vari-ability in attitudes, political behavior, and other individual-level outcomes.In this case, our critic is not necessarily suggesting that class analystsshould disaggregate beyond the occupational level, just that differencesacross occupations in outcomes might be explained in terms of job-levelvariables. We have acknowledged in table 1 that some interoccupationalvariability in outcomes is generated by job-level variables that affectinterest formation and learning generalization. However, because theseare merely two of many mechanisms that generate interoccupational het-erogeneity, we doubt that job-level variables will offer a complete account.
This claim is best illustrated by example. If we were asked to accountfor the humanist, antimaterialist, and left-leaning habitus of sociologists,we would emphasize (a) the left-leaning reputation of sociology and theconsequent self-selection of left-leaning recruits, (b) the inculcation of aliberal worldview through lengthy professional training and socialization,and (c) the reinforcing effects of interaction with like-minded colleagues.We would be hard-pressed, by contrast, to explain this complex of atti-tudes and behaviors in terms of the working conditions under whichsociologists labor, given that such conditions (e.g., high autonomy, lowauthority, high complexity) are much the same as those of other aca-demics.34 This homogeneity in working conditions is problematic for con-ventional class analysis because many professors, such as economists, arestrikingly more conservative than sociologists in their politics and life-styles. It would be difficult to account for the relative conservatism ofeconomists without recognizing that they are self-selected for conserva-tism, that their graduate training in neoclassical approaches reinforcesthis preexisting affinity for conservatism, and that their ongoing inter-
34 We have argued in this study that occupations are breeding grounds of difference,but we have not tried to explain the content of these differences. Why, for example,did economics rather than sociology develop a conservative worldview? If pressed, wewould emphasize that the two disciplines have different orientations to the centers ofeconomic and political power. That is, sociologists work principally in academia andare isolated from centers of power (in business and politics), whereas economists aredeeply entrenched in the business and political worlds and hence are less likely todevelop the oppositional resistance of those, like sociologists, who are powerless.
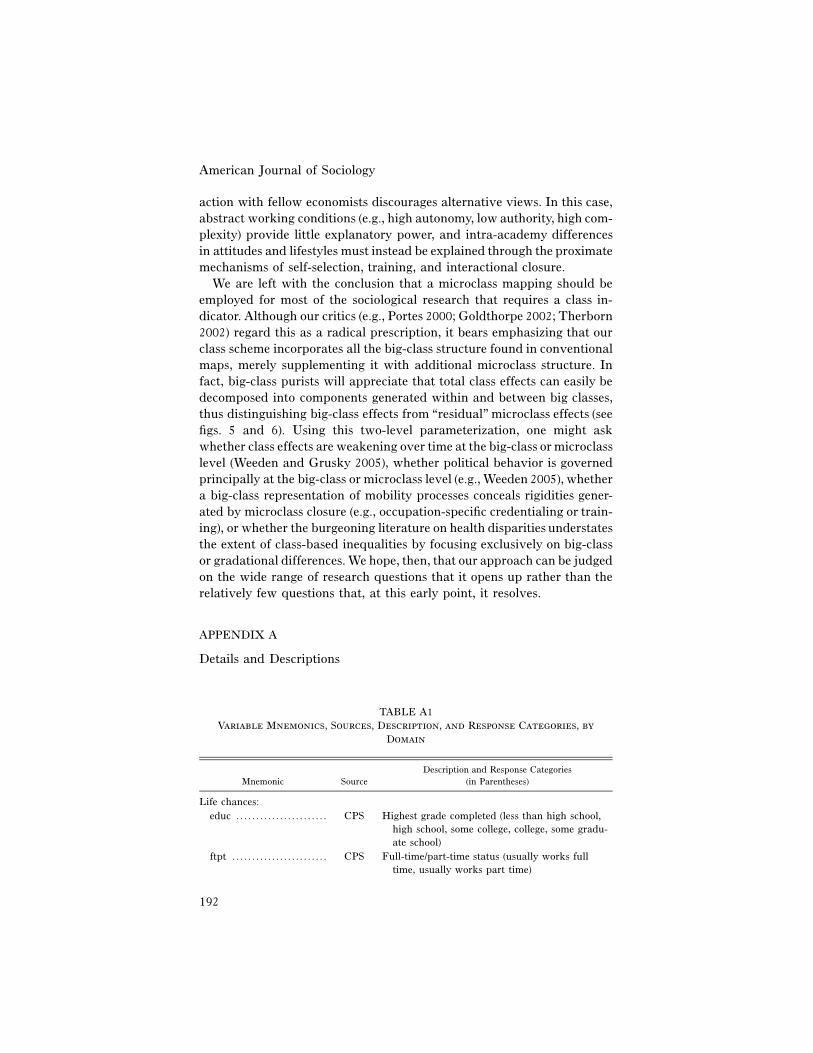
American Journal of Sociology
192
action with fellow economists discourages alternative views. In this case,abstract working conditions (e.g., high autonomy, low authority, high com-plexity) provide little explanatory power, and intra-academy differencesin attitudes and lifestyles must instead be explained through the proximatemechanisms of self-selection, training, and interactional closure.
We are left with the conclusion that a microclass mapping should beemployed for most of the sociological research that requires a class in-dicator. Although our critics (e.g., Portes 2000; Goldthorpe 2002; Therborn2002) regard this as a radical prescription, it bears emphasizing that ourclass scheme incorporates all the big-class structure found in conventionalmaps, merely supplementing it with additional microclass structure. Infact, big-class purists will appreciate that total class effects can easily bedecomposed into components generated within and between big classes,thus distinguishing big-class effects from “residual” microclass effects (seefigs. 5 and 6). Using this two-level parameterization, one might askwhether class effects are weakening over time at the big-class or microclasslevel (Weeden and Grusky 2005), whether political behavior is governedprincipally at the big-class or microclass level (e.g., Weeden 2005), whethera big-class representation of mobility processes conceals rigidities gener-ated by microclass closure (e.g., occupation-specific credentialing or train-ing), or whether the burgeoning literature on health disparities understatesthe extent of class-based inequalities by focusing exclusively on big-classor gradational differences. We hope, then, that our approach can be judgedon the wide range of research questions that it opens up rather than therelatively few questions that, at this early point, it resolves.
APPENDIX A
Details and Descriptions
TABLE A1Variable Mnemonics, Sources, Description, and Response Categories, by
Domain
Mnemonic SourceDescription and Response Categories
(in Parentheses)
Life chances:educ . . . . . . . . . . . . . . . . . . . . . . . CPS Highest grade completed (less than high school,
high school, some college, college, some gradu-ate school)
ftpt . . . . . . . . . . . . . . . . . . . . . . . . CPS Full-time/part-time status (usually works fulltime, usually works part time)
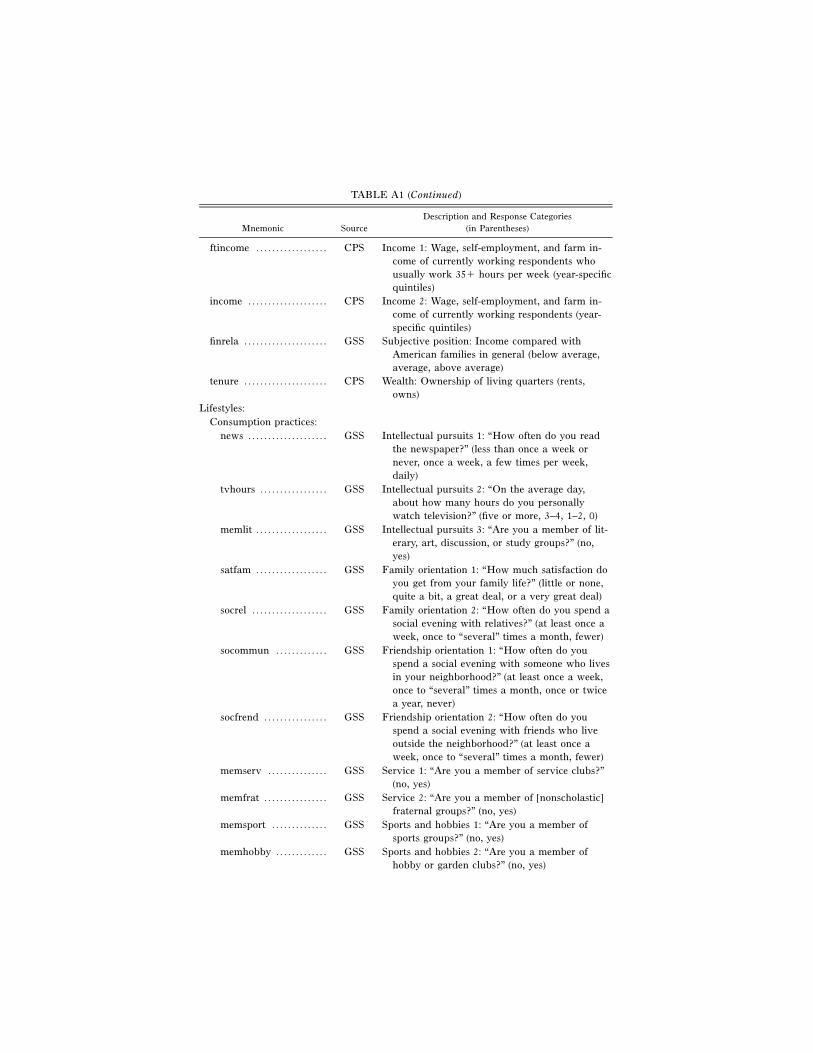
TABLE A1 (Continued)
Mnemonic SourceDescription and Response Categories
(in Parentheses)
ftincome . . . . . . . . . . . . . . . . . . CPS Income 1: Wage, self-employment, and farm in-come of currently working respondents whousually work 35� hours per week (year-specificquintiles)
income . . . . . . . . . . . . . . . . . . . . CPS Income 2: Wage, self-employment, and farm in-come of currently working respondents (year-specific quintiles)
finrela . . . . . . . . . . . . . . . . . . . . . GSS Subjective position: Income compared withAmerican families in general (below average,average, above average)
tenure . . . . . . . . . . . . . . . . . . . . . CPS Wealth: Ownership of living quarters (rents,owns)
Lifestyles:Consumption practices:
news . . . . . . . . . . . . . . . . . . . . GSS Intellectual pursuits 1: “How often do you readthe newspaper?” (less than once a week ornever, once a week, a few times per week,daily)
tvhours . . . . . . . . . . . . . . . . . GSS Intellectual pursuits 2: “On the average day,about how many hours do you personallywatch television?” (five or more, 3–4, 1–2, 0)
memlit . . . . . . . . . . . . . . . . . . GSS Intellectual pursuits 3: “Are you a member of lit-erary, art, discussion, or study groups?” (no,yes)
satfam . . . . . . . . . . . . . . . . . . GSS Family orientation 1: “How much satisfaction doyou get from your family life?” (little or none,quite a bit, a great deal, or a very great deal)
socrel . . . . . . . . . . . . . . . . . . . GSS Family orientation 2: “How often do you spend asocial evening with relatives?” (at least once aweek, once to “several” times a month, fewer)
socommun . . . . . . . . . . . . . GSS Friendship orientation 1: “How often do youspend a social evening with someone who livesin your neighborhood?” (at least once a week,once to “several” times a month, once or twicea year, never)
socfrend . . . . . . . . . . . . . . . . GSS Friendship orientation 2: “How often do youspend a social evening with friends who liveoutside the neighborhood?” (at least once aweek, once to “several” times a month, fewer)
memserv . . . . . . . . . . . . . . . GSS Service 1: “Are you a member of service clubs?”(no, yes)
memfrat . . . . . . . . . . . . . . . . GSS Service 2: “Are you a member of [nonscholastic]fraternal groups?” (no, yes)
memsport . . . . . . . . . . . . . . GSS Sports and hobbies 1: “Are you a member ofsports groups?” (no, yes)
memhobby . . . . . . . . . . . . . GSS Sports and hobbies 2: “Are you a member ofhobby or garden clubs?” (no, yes)
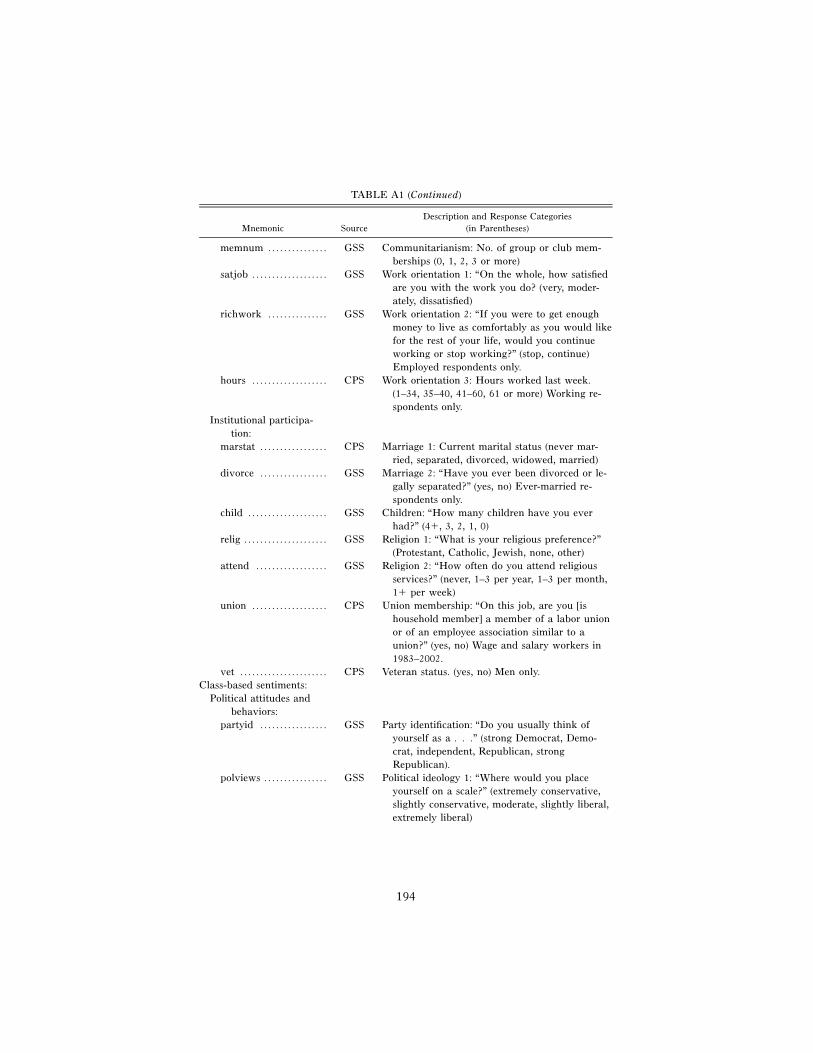
194
TABLE A1 (Continued)
Mnemonic SourceDescription and Response Categories
(in Parentheses)
memnum . . . . . . . . . . . . . . . GSS Communitarianism: No. of group or club mem-berships (0, 1, 2, 3 or more)
satjob . . . . . . . . . . . . . . . . . . . GSS Work orientation 1: “On the whole, how satisfiedare you with the work you do? (very, moder-ately, dissatisfied)
richwork . . . . . . . . . . . . . . . GSS Work orientation 2: “If you were to get enoughmoney to live as comfortably as you would likefor the rest of your life, would you continueworking or stop working?” (stop, continue)Employed respondents only.
hours . . . . . . . . . . . . . . . . . . . CPS Work orientation 3: Hours worked last week.(1–34, 35–40, 41–60, 61 or more) Working re-spondents only.
Institutional participa-tion:
marstat . . . . . . . . . . . . . . . . . CPS Marriage 1: Current marital status (never mar-ried, separated, divorced, widowed, married)
divorce . . . . . . . . . . . . . . . . . GSS Marriage 2: “Have you ever been divorced or le-gally separated?” (yes, no) Ever-married re-spondents only.
child . . . . . . . . . . . . . . . . . . . . GSS Children: “How many children have you everhad?” (4�, 3, 2, 1, 0)
relig . . . . . . . . . . . . . . . . . . . . . GSS Religion 1: “What is your religious preference?”(Protestant, Catholic, Jewish, none, other)
attend . . . . . . . . . . . . . . . . . . GSS Religion 2: “How often do you attend religiousservices?” (never, 1–3 per year, 1–3 per month,1� per week)
union . . . . . . . . . . . . . . . . . . . CPS Union membership: “On this job, are you [ishousehold member] a member of a labor unionor of an employee association similar to aunion?” (yes, no) Wage and salary workers in1983–2002.
vet . . . . . . . . . . . . . . . . . . . . . . CPS Veteran status. (yes, no) Men only.Class-based sentiments:
Political attitudes andbehaviors:
partyid . . . . . . . . . . . . . . . . . GSS Party identification: “Do you usually think ofyourself as a . . .” (strong Democrat, Demo-crat, independent, Republican, strongRepublican).
polviews . . . . . . . . . . . . . . . . GSS Political ideology 1: “Where would you placeyourself on a scale?” (extremely conservative,slightly conservative, moderate, slightly liberal,extremely liberal)
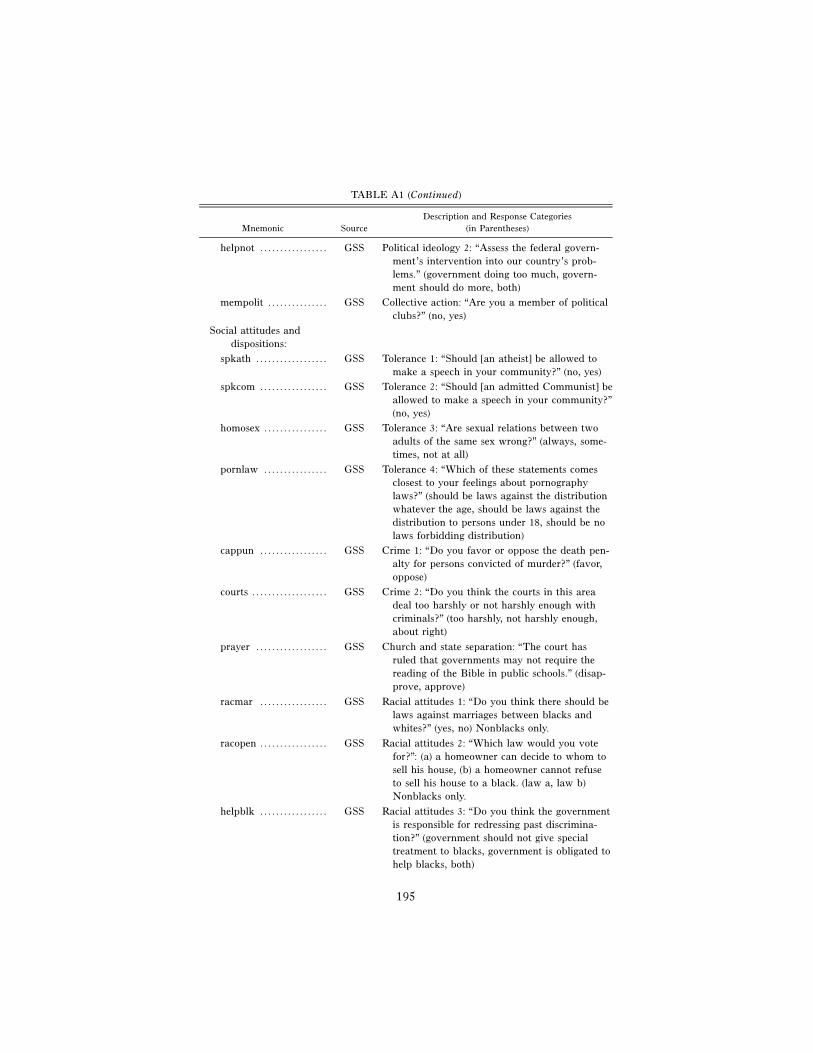
195
TABLE A1 (Continued)
Mnemonic SourceDescription and Response Categories
(in Parentheses)
helpnot . . . . . . . . . . . . . . . . . GSS Political ideology 2: “Assess the federal govern-ment’s intervention into our country’s prob-lems.” (government doing too much, govern-ment should do more, both)
mempolit . . . . . . . . . . . . . . . GSS Collective action: “Are you a member of politicalclubs?” (no, yes)
Social attitudes anddispositions:
spkath . . . . . . . . . . . . . . . . . . GSS Tolerance 1: “Should [an atheist] be allowed tomake a speech in your community?” (no, yes)
spkcom . . . . . . . . . . . . . . . . . GSS Tolerance 2: “Should [an admitted Communist] beallowed to make a speech in your community?”(no, yes)
homosex . . . . . . . . . . . . . . . . GSS Tolerance 3: “Are sexual relations between twoadults of the same sex wrong?” (always, some-times, not at all)
pornlaw . . . . . . . . . . . . . . . . GSS Tolerance 4: “Which of these statements comesclosest to your feelings about pornographylaws?” (should be laws against the distributionwhatever the age, should be laws against thedistribution to persons under 18, should be nolaws forbidding distribution)
cappun . . . . . . . . . . . . . . . . . GSS Crime 1: “Do you favor or oppose the death pen-alty for persons convicted of murder?” (favor,oppose)
courts . . . . . . . . . . . . . . . . . . . GSS Crime 2: “Do you think the courts in this areadeal too harshly or not harshly enough withcriminals?” (too harshly, not harshly enough,about right)
prayer . . . . . . . . . . . . . . . . . . GSS Church and state separation: “The court hasruled that governments may not require thereading of the Bible in public schools.” (disap-prove, approve)
racmar . . . . . . . . . . . . . . . . . GSS Racial attitudes 1: “Do you think there should belaws against marriages between blacks andwhites?” (yes, no) Nonblacks only.
racopen . . . . . . . . . . . . . . . . . GSS Racial attitudes 2: “Which law would you votefor?”: (a) a homeowner can decide to whom tosell his house, (b) a homeowner cannot refuseto sell his house to a black. (law a, law b)Nonblacks only.
helpblk . . . . . . . . . . . . . . . . . GSS Racial attitudes 3: “Do you think the governmentis responsible for redressing past discrimina-tion?” (government should not give specialtreatment to blacks, government is obligated tohelp blacks, both)
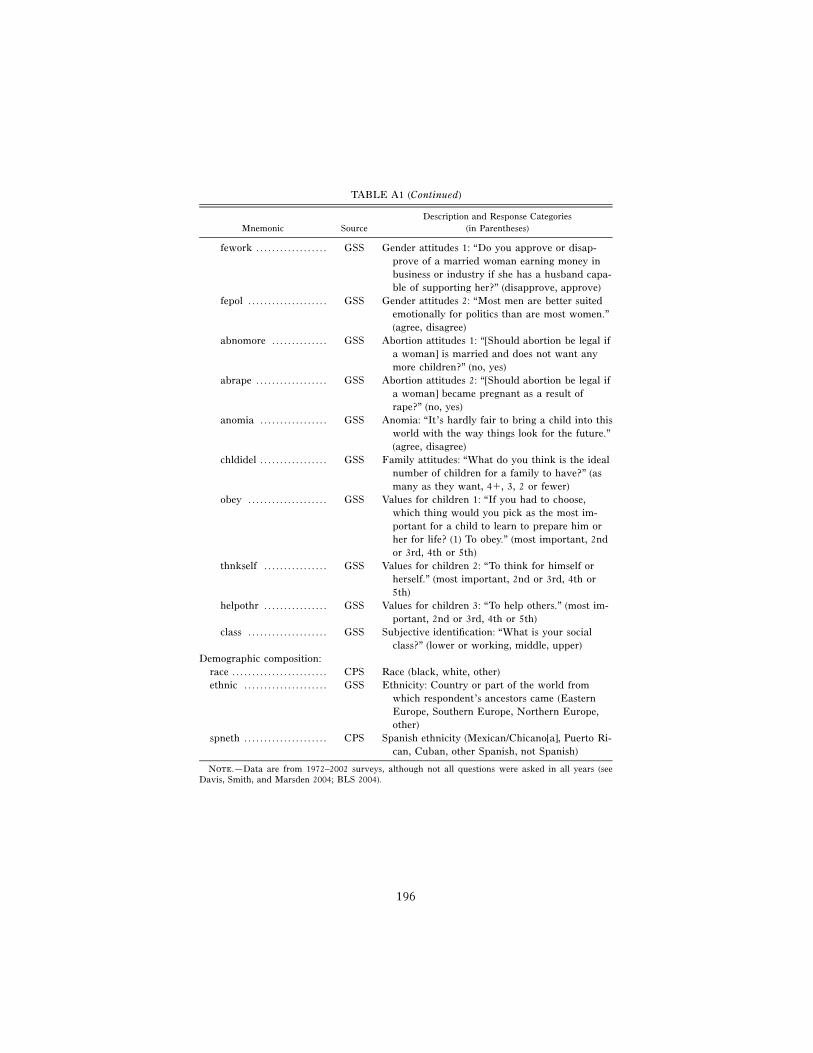
196
TABLE A1 (Continued)
Mnemonic SourceDescription and Response Categories
(in Parentheses)
fework . . . . . . . . . . . . . . . . . . GSS Gender attitudes 1: “Do you approve or disap-prove of a married woman earning money inbusiness or industry if she has a husband capa-ble of supporting her?” (disapprove, approve)
fepol . . . . . . . . . . . . . . . . . . . . GSS Gender attitudes 2: “Most men are better suitedemotionally for politics than are most women.”(agree, disagree)
abnomore . . . . . . . . . . . . . . GSS Abortion attitudes 1: “[Should abortion be legal ifa woman] is married and does not want anymore children?” (no, yes)
abrape . . . . . . . . . . . . . . . . . . GSS Abortion attitudes 2: “[Should abortion be legal ifa woman] became pregnant as a result ofrape?” (no, yes)
anomia . . . . . . . . . . . . . . . . . GSS Anomia: “It’s hardly fair to bring a child into thisworld with the way things look for the future.”(agree, disagree)
chldidel . . . . . . . . . . . . . . . . . GSS Family attitudes: “What do you think is the idealnumber of children for a family to have?” (asmany as they want, 4�, 3, 2 or fewer)
obey . . . . . . . . . . . . . . . . . . . . GSS Values for children 1: “If you had to choose,which thing would you pick as the most im-portant for a child to learn to prepare him orher for life? (1) To obey.” (most important, 2ndor 3rd, 4th or 5th)
thnkself . . . . . . . . . . . . . . . . GSS Values for children 2: “To think for himself orherself.” (most important, 2nd or 3rd, 4th or5th)
helpothr . . . . . . . . . . . . . . . . GSS Values for children 3: “To help others.” (most im-portant, 2nd or 3rd, 4th or 5th)
class . . . . . . . . . . . . . . . . . . . . GSS Subjective identification: “What is your socialclass?” (lower or working, middle, upper)
Demographic composition:race . . . . . . . . . . . . . . . . . . . . . . . . CPS Race (black, white, other)ethnic . . . . . . . . . . . . . . . . . . . . . GSS Ethnicity: Country or part of the world from
which respondent’s ancestors came (EasternEurope, Southern Europe, Northern Europe,other)
spneth . . . . . . . . . . . . . . . . . . . . . CPS Spanish ethnicity (Mexican/Chicano[a], Puerto Ri-can, Cuban, other Spanish, not Spanish)
Note.—Data are from 1972–2002 surveys, although not all questions were asked in all years (seeDavis, Smith, and Marsden 2004; BLS 2004).
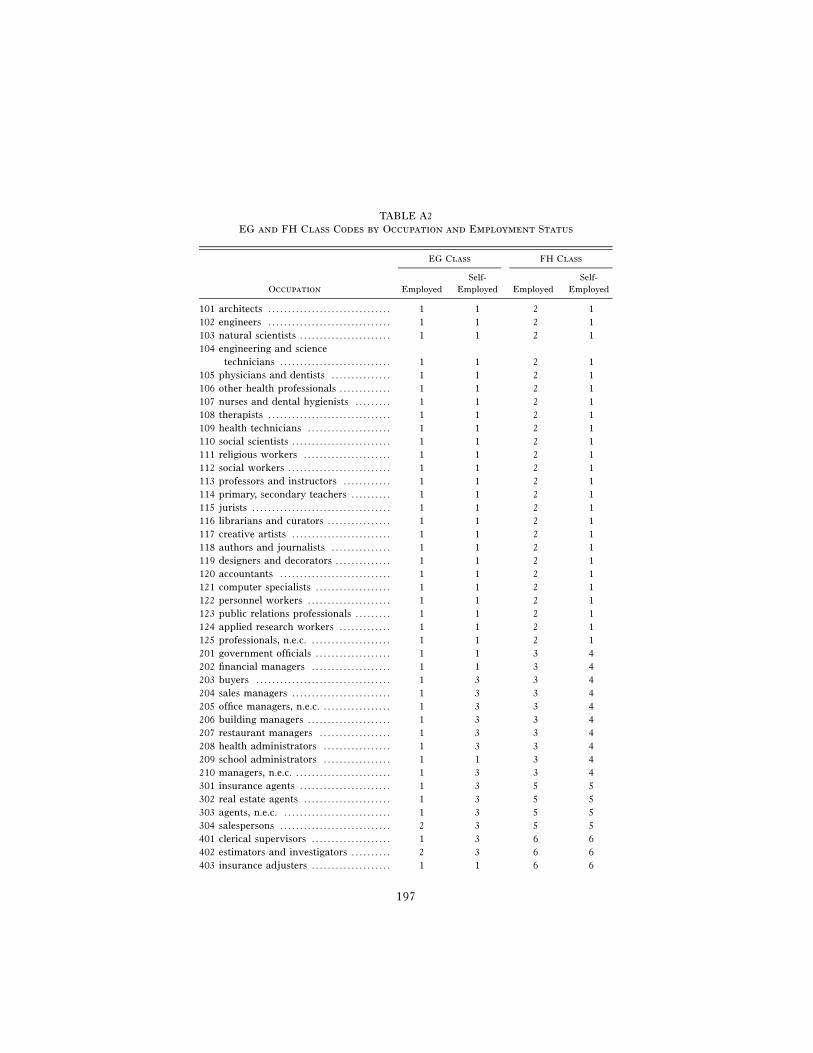
197
TABLE A2EG and FH Class Codes by Occupation and Employment Status
Occupation
EG Class FH Class
EmployedSelf-
Employed EmployedSelf-
Employed
101 architects . . . . . . . . . . . . . . . . . . . . . . . . . . . . . . . 1 1 2 1102 engineers . . . . . . . . . . . . . . . . . . . . . . . . . . . . . . . 1 1 2 1103 natural scientists . . . . . . . . . . . . . . . . . . . . . . . 1 1 2 1104 engineering and science
technicians . . . . . . . . . . . . . . . . . . . . . . . . . . . . 1 1 2 1105 physicians and dentists . . . . . . . . . . . . . . . 1 1 2 1106 other health professionals . . . . . . . . . . . . . 1 1 2 1107 nurses and dental hygienists . . . . . . . . . 1 1 2 1108 therapists . . . . . . . . . . . . . . . . . . . . . . . . . . . . . . . 1 1 2 1109 health technicians . . . . . . . . . . . . . . . . . . . . . 1 1 2 1110 social scientists . . . . . . . . . . . . . . . . . . . . . . . . . 1 1 2 1111 religious workers . . . . . . . . . . . . . . . . . . . . . . 1 1 2 1112 social workers . . . . . . . . . . . . . . . . . . . . . . . . . . 1 1 2 1113 professors and instructors . . . . . . . . . . . . 1 1 2 1114 primary, secondary teachers . . . . . . . . . . 1 1 2 1115 jurists . . . . . . . . . . . . . . . . . . . . . . . . . . . . . . . . . . . 1 1 2 1116 librarians and curators . . . . . . . . . . . . . . . . 1 1 2 1117 creative artists . . . . . . . . . . . . . . . . . . . . . . . . . 1 1 2 1118 authors and journalists . . . . . . . . . . . . . . . 1 1 2 1119 designers and decorators . . . . . . . . . . . . . . 1 1 2 1120 accountants . . . . . . . . . . . . . . . . . . . . . . . . . . . . 1 1 2 1121 computer specialists . . . . . . . . . . . . . . . . . . . 1 1 2 1122 personnel workers . . . . . . . . . . . . . . . . . . . . . 1 1 2 1123 public relations professionals . . . . . . . . . 1 1 2 1124 applied research workers . . . . . . . . . . . . . 1 1 2 1125 professionals, n.e.c. . . . . . . . . . . . . . . . . . . . . 1 1 2 1201 government officials . . . . . . . . . . . . . . . . . . . 1 1 3 4202 financial managers . . . . . . . . . . . . . . . . . . . . 1 1 3 4203 buyers . . . . . . . . . . . . . . . . . . . . . . . . . . . . . . . . . . 1 3 3 4204 sales managers . . . . . . . . . . . . . . . . . . . . . . . . . 1 3 3 4205 office managers, n.e.c. . . . . . . . . . . . . . . . . . 1 3 3 4206 building managers . . . . . . . . . . . . . . . . . . . . . 1 3 3 4207 restaurant managers . . . . . . . . . . . . . . . . . . 1 3 3 4208 health administrators . . . . . . . . . . . . . . . . . 1 3 3 4209 school administrators . . . . . . . . . . . . . . . . . 1 1 3 4210 managers, n.e.c. . . . . . . . . . . . . . . . . . . . . . . . . 1 3 3 4301 insurance agents . . . . . . . . . . . . . . . . . . . . . . . 1 3 5 5302 real estate agents . . . . . . . . . . . . . . . . . . . . . . 1 3 5 5303 agents, n.e.c. . . . . . . . . . . . . . . . . . . . . . . . . . . . 1 3 5 5304 salespersons . . . . . . . . . . . . . . . . . . . . . . . . . . . . 2 3 5 5401 clerical supervisors . . . . . . . . . . . . . . . . . . . . 1 3 6 6402 estimators and investigators . . . . . . . . . . 2 3 6 6403 insurance adjusters . . . . . . . . . . . . . . . . . . . . 1 1 6 6
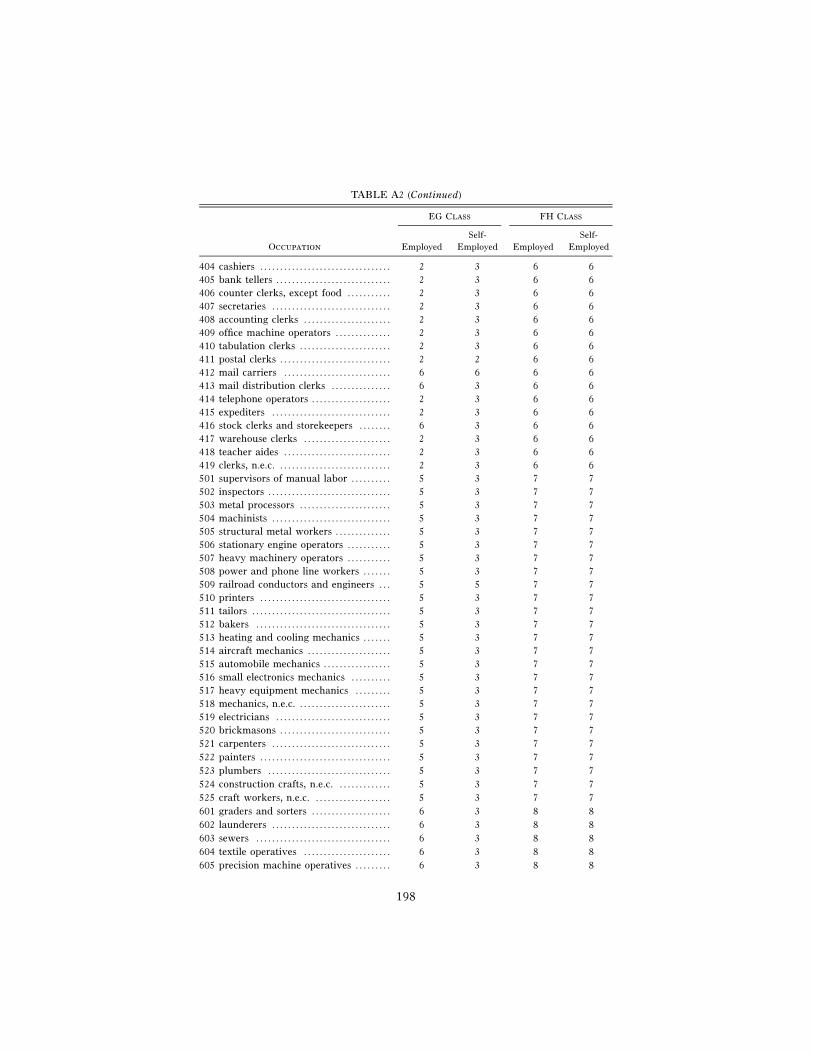
198
TABLE A2 (Continued)
Occupation
EG Class FH Class
EmployedSelf-
Employed EmployedSelf-
Employed
404 cashiers . . . . . . . . . . . . . . . . . . . . . . . . . . . . . . . . . 2 3 6 6405 bank tellers . . . . . . . . . . . . . . . . . . . . . . . . . . . . . 2 3 6 6406 counter clerks, except food . . . . . . . . . . . 2 3 6 6407 secretaries . . . . . . . . . . . . . . . . . . . . . . . . . . . . . . 2 3 6 6408 accounting clerks . . . . . . . . . . . . . . . . . . . . . . 2 3 6 6409 office machine operators . . . . . . . . . . . . . . 2 3 6 6410 tabulation clerks . . . . . . . . . . . . . . . . . . . . . . . 2 3 6 6411 postal clerks . . . . . . . . . . . . . . . . . . . . . . . . . . . . 2 2 6 6412 mail carriers . . . . . . . . . . . . . . . . . . . . . . . . . . . 6 6 6 6413 mail distribution clerks . . . . . . . . . . . . . . . 6 3 6 6414 telephone operators . . . . . . . . . . . . . . . . . . . . 2 3 6 6415 expediters . . . . . . . . . . . . . . . . . . . . . . . . . . . . . . 2 3 6 6416 stock clerks and storekeepers . . . . . . . . 6 3 6 6417 warehouse clerks . . . . . . . . . . . . . . . . . . . . . . 2 3 6 6418 teacher aides . . . . . . . . . . . . . . . . . . . . . . . . . . . 2 3 6 6419 clerks, n.e.c. . . . . . . . . . . . . . . . . . . . . . . . . . . . . 2 3 6 6501 supervisors of manual labor . . . . . . . . . . 5 3 7 7502 inspectors . . . . . . . . . . . . . . . . . . . . . . . . . . . . . . . 5 3 7 7503 metal processors . . . . . . . . . . . . . . . . . . . . . . . 5 3 7 7504 machinists . . . . . . . . . . . . . . . . . . . . . . . . . . . . . . 5 3 7 7505 structural metal workers . . . . . . . . . . . . . . 5 3 7 7506 stationary engine operators . . . . . . . . . . . 5 3 7 7507 heavy machinery operators . . . . . . . . . . . 5 3 7 7508 power and phone line workers . . . . . . . 5 3 7 7509 railroad conductors and engineers . . . 5 5 7 7510 printers . . . . . . . . . . . . . . . . . . . . . . . . . . . . . . . . . 5 3 7 7511 tailors . . . . . . . . . . . . . . . . . . . . . . . . . . . . . . . . . . . 5 3 7 7512 bakers . . . . . . . . . . . . . . . . . . . . . . . . . . . . . . . . . . 5 3 7 7513 heating and cooling mechanics . . . . . . . 5 3 7 7514 aircraft mechanics . . . . . . . . . . . . . . . . . . . . . 5 3 7 7515 automobile mechanics . . . . . . . . . . . . . . . . . 5 3 7 7516 small electronics mechanics . . . . . . . . . . 5 3 7 7517 heavy equipment mechanics . . . . . . . . . 5 3 7 7518 mechanics, n.e.c. . . . . . . . . . . . . . . . . . . . . . . . 5 3 7 7519 electricians . . . . . . . . . . . . . . . . . . . . . . . . . . . . . 5 3 7 7520 brickmasons . . . . . . . . . . . . . . . . . . . . . . . . . . . . 5 3 7 7521 carpenters . . . . . . . . . . . . . . . . . . . . . . . . . . . . . . 5 3 7 7522 painters . . . . . . . . . . . . . . . . . . . . . . . . . . . . . . . . . 5 3 7 7523 plumbers . . . . . . . . . . . . . . . . . . . . . . . . . . . . . . . 5 3 7 7524 construction crafts, n.e.c. . . . . . . . . . . . . . 5 3 7 7525 craft workers, n.e.c. . . . . . . . . . . . . . . . . . . . 5 3 7 7601 graders and sorters . . . . . . . . . . . . . . . . . . . . 6 3 8 8602 launderers . . . . . . . . . . . . . . . . . . . . . . . . . . . . . . 6 3 8 8603 sewers . . . . . . . . . . . . . . . . . . . . . . . . . . . . . . . . . . 6 3 8 8604 textile operatives . . . . . . . . . . . . . . . . . . . . . . 6 3 8 8605 precision machine operatives . . . . . . . . . 6 3 8 8
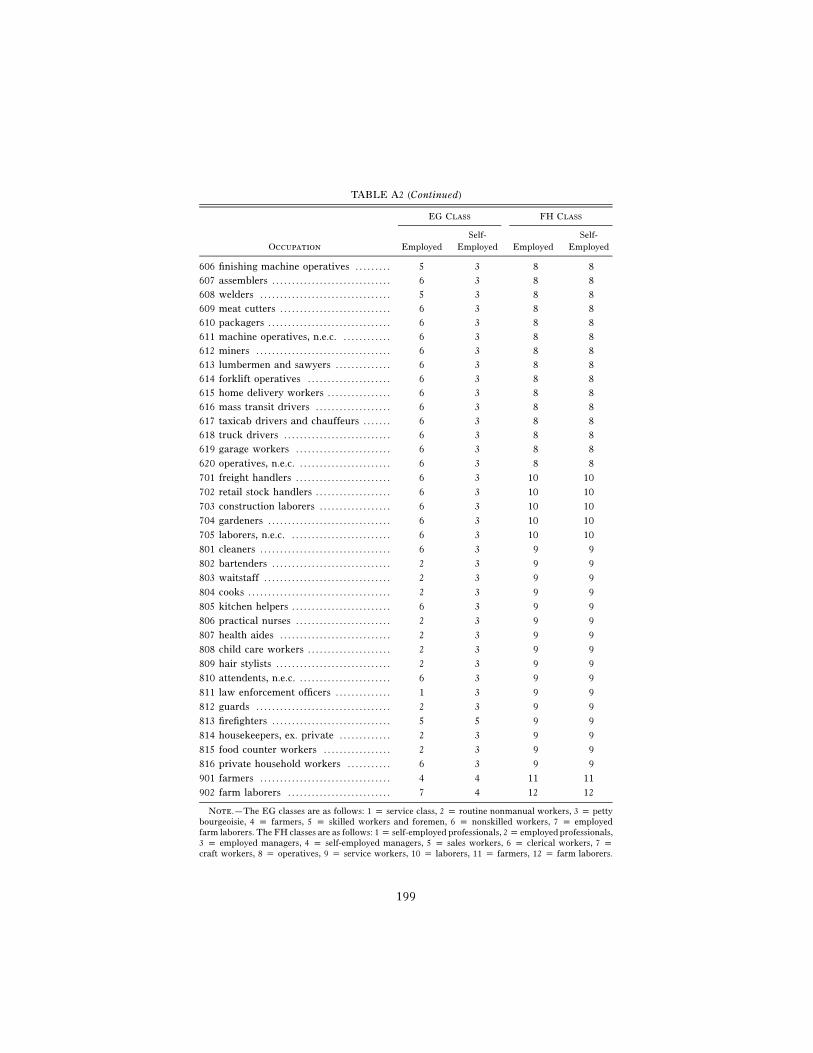
199
TABLE A2 (Continued)
Occupation
EG Class FH Class
EmployedSelf-
Employed EmployedSelf-
Employed
606 finishing machine operatives . . . . . . . . . 5 3 8 8607 assemblers . . . . . . . . . . . . . . . . . . . . . . . . . . . . . . 6 3 8 8608 welders . . . . . . . . . . . . . . . . . . . . . . . . . . . . . . . . . 5 3 8 8609 meat cutters . . . . . . . . . . . . . . . . . . . . . . . . . . . . 6 3 8 8610 packagers . . . . . . . . . . . . . . . . . . . . . . . . . . . . . . . 6 3 8 8611 machine operatives, n.e.c. . . . . . . . . . . . . 6 3 8 8612 miners . . . . . . . . . . . . . . . . . . . . . . . . . . . . . . . . . . 6 3 8 8613 lumbermen and sawyers . . . . . . . . . . . . . . 6 3 8 8614 forklift operatives . . . . . . . . . . . . . . . . . . . . . 6 3 8 8615 home delivery workers . . . . . . . . . . . . . . . . 6 3 8 8616 mass transit drivers . . . . . . . . . . . . . . . . . . . 6 3 8 8617 taxicab drivers and chauffeurs . . . . . . . 6 3 8 8618 truck drivers . . . . . . . . . . . . . . . . . . . . . . . . . . . 6 3 8 8619 garage workers . . . . . . . . . . . . . . . . . . . . . . . . 6 3 8 8620 operatives, n.e.c. . . . . . . . . . . . . . . . . . . . . . . . 6 3 8 8701 freight handlers . . . . . . . . . . . . . . . . . . . . . . . . 6 3 10 10702 retail stock handlers . . . . . . . . . . . . . . . . . . . 6 3 10 10703 construction laborers . . . . . . . . . . . . . . . . . . 6 3 10 10704 gardeners . . . . . . . . . . . . . . . . . . . . . . . . . . . . . . . 6 3 10 10705 laborers, n.e.c. . . . . . . . . . . . . . . . . . . . . . . . . . 6 3 10 10801 cleaners . . . . . . . . . . . . . . . . . . . . . . . . . . . . . . . . . 6 3 9 9802 bartenders . . . . . . . . . . . . . . . . . . . . . . . . . . . . . . 2 3 9 9803 waitstaff . . . . . . . . . . . . . . . . . . . . . . . . . . . . . . . . 2 3 9 9804 cooks . . . . . . . . . . . . . . . . . . . . . . . . . . . . . . . . . . . . 2 3 9 9805 kitchen helpers . . . . . . . . . . . . . . . . . . . . . . . . . 6 3 9 9806 practical nurses . . . . . . . . . . . . . . . . . . . . . . . . 2 3 9 9807 health aides . . . . . . . . . . . . . . . . . . . . . . . . . . . . 2 3 9 9808 child care workers . . . . . . . . . . . . . . . . . . . . . 2 3 9 9809 hair stylists . . . . . . . . . . . . . . . . . . . . . . . . . . . . . 2 3 9 9810 attendents, n.e.c. . . . . . . . . . . . . . . . . . . . . . . . 6 3 9 9811 law enforcement officers . . . . . . . . . . . . . . 1 3 9 9812 guards . . . . . . . . . . . . . . . . . . . . . . . . . . . . . . . . . . 2 3 9 9813 firefighters . . . . . . . . . . . . . . . . . . . . . . . . . . . . . . 5 5 9 9814 housekeepers, ex. private . . . . . . . . . . . . . 2 3 9 9815 food counter workers . . . . . . . . . . . . . . . . . 2 3 9 9816 private household workers . . . . . . . . . . . 6 3 9 9901 farmers . . . . . . . . . . . . . . . . . . . . . . . . . . . . . . . . . 4 4 11 11902 farm laborers . . . . . . . . . . . . . . . . . . . . . . . . . . 7 4 12 12
Note.—The EG classes are as follows: 1 p service class, 2 p routine nonmanual workers, 3 p pettybourgeoisie, 4 p farmers, 5 p skilled workers and foremen, 6 p nonskilled workers, 7 p employedfarm laborers. The FH classes are as follows: 1 p self-employed professionals, 2 p employed professionals,3 p employed managers, 4 p self-employed managers, 5 p sales workers, 6 p clerical workers, 7 pcraft workers, 8 p operatives, 9 p service workers, 10 p laborers, 11 p farmers, 12 p farm laborers.
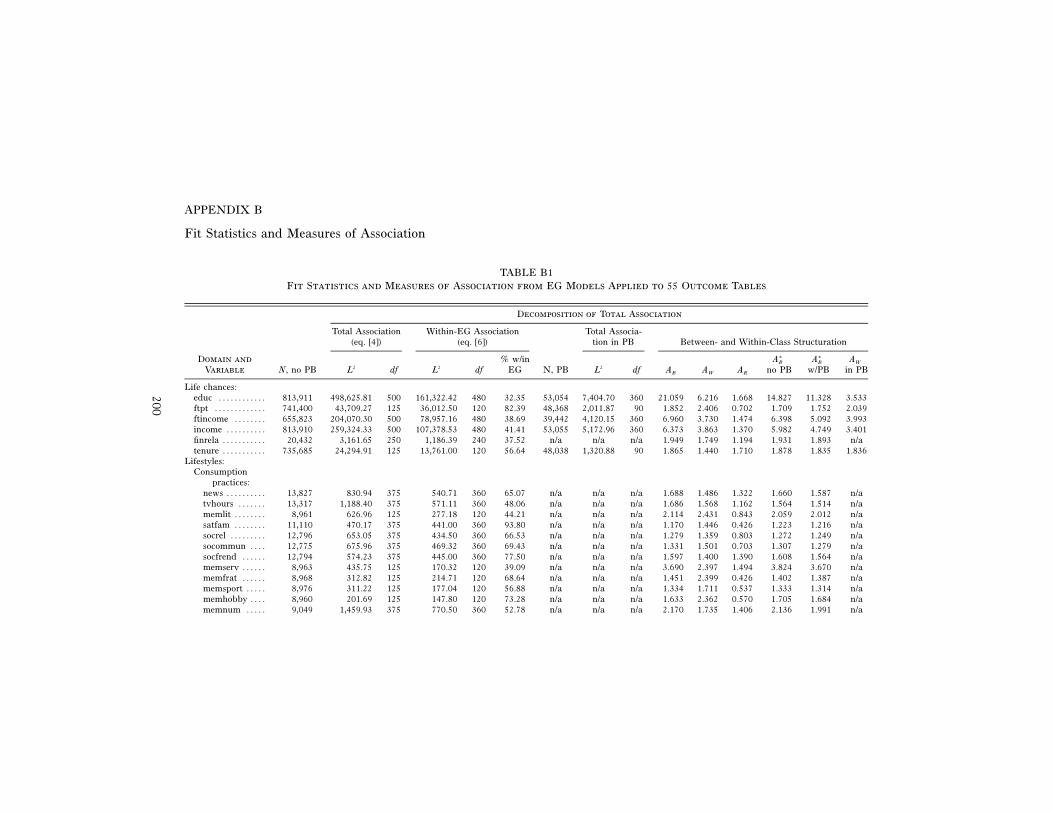
200
APPENDIX B
Fit Statistics and Measures of Association
TABLE B1Fit Statistics and Measures of Association from EG Models Applied to 55 Outcome Tables
Decomposition of Total Association
Total Association(eq. [4])
Within-EG Association(eq. [6])
Total Associa-tion in PB Between- and Within-Class Structuration
Domain andVariable N, no PB L2 df L2 df
% w/inEG N, PB L2 df AB AW AR
∗AB
no PB
∗AB
w/PBAW
in PB
Life chances:educ . . . . . . . . . . . . 813,911 498,625.81 500 161,322.42 480 32.35 53,054 7,404.70 360 21.059 6.216 1.668 14.827 11.328 3.533ftpt . . . . . . . . . . . . . 741,400 43,709.27 125 36,012.50 120 82.39 48,368 2,011.87 90 1.852 2.406 0.702 1.709 1.752 2.039ftincome . . . . . . . . 655,823 204,070.30 500 78,957.16 480 38.69 39,442 4,120.15 360 6.960 3.730 1.474 6.398 5.092 3.993income . . . . . . . . . . 813,910 259,324.33 500 107,378.53 480 41.41 53,055 5,172.96 360 6.373 3.863 1.370 5.982 4.749 3.401finrela . . . . . . . . . . . 20,432 3,161.65 250 1,186.39 240 37.52 n/a n/a n/a 1.949 1.749 1.194 1.931 1.893 n/atenure . . . . . . . . . . . 735,685 24,294.91 125 13,761.00 120 56.64 48,038 1,320.88 90 1.865 1.440 1.710 1.878 1.835 1.836
Lifestyles:Consumption
practices:news . . . . . . . . . . 13,827 830.94 375 540.71 360 65.07 n/a n/a n/a 1.688 1.486 1.322 1.660 1.587 n/atvhours . . . . . . . 13,317 1,188.40 375 571.11 360 48.06 n/a n/a n/a 1.686 1.568 1.162 1.564 1.514 n/amemlit . . . . . . . . 8,961 626.96 125 277.18 120 44.21 n/a n/a n/a 2.114 2.431 0.843 2.059 2.012 n/asatfam . . . . . . . . 11,110 470.17 375 441.00 360 93.80 n/a n/a n/a 1.170 1.446 0.426 1.223 1.216 n/asocrel . . . . . . . . . 12,796 653.05 375 434.50 360 66.53 n/a n/a n/a 1.279 1.359 0.803 1.272 1.249 n/asocommun . . . . 12,775 675.96 375 469.32 360 69.43 n/a n/a n/a 1.331 1.501 0.703 1.307 1.279 n/asocfrend . . . . . . 12,794 574.23 375 445.00 360 77.50 n/a n/a n/a 1.597 1.400 1.390 1.608 1.564 n/amemserv . . . . . . 8,963 435.75 125 170.32 120 39.09 n/a n/a n/a 3.690 2.397 1.494 3.824 3.670 n/amemfrat . . . . . . 8,968 312.82 125 214.71 120 68.64 n/a n/a n/a 1.451 2.399 0.426 1.402 1.387 n/amemsport . . . . . 8,976 311.22 125 177.04 120 56.88 n/a n/a n/a 1.334 1.711 0.537 1.333 1.314 n/amemhobby . . . . 8,960 201.69 125 147.80 120 73.28 n/a n/a n/a 1.633 2.362 0.570 1.705 1.684 n/amemnum . . . . . 9,049 1,459.93 375 770.50 360 52.78 n/a n/a n/a 2.170 1.735 1.406 2.136 1.991 n/a
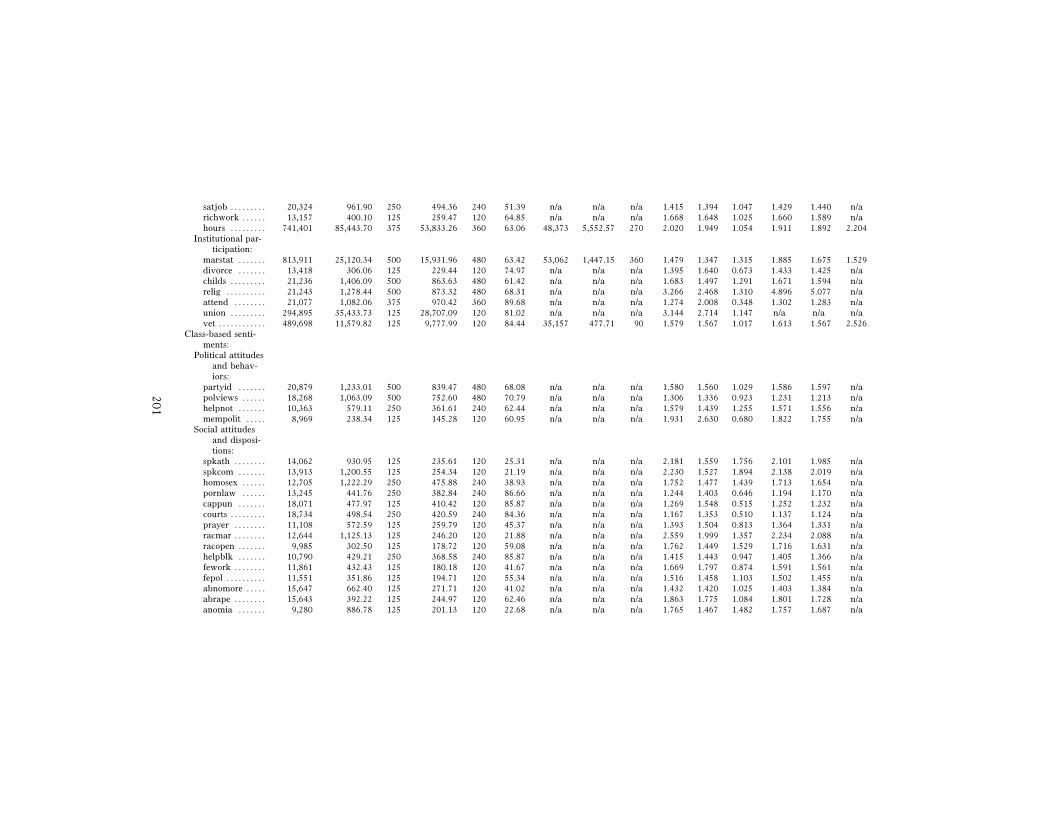
201
satjob . . . . . . . . . 20,324 961.90 250 494.36 240 51.39 n/a n/a n/a 1.415 1.394 1.047 1.429 1.440 n/arichwork . . . . . . 13,157 400.10 125 259.47 120 64.85 n/a n/a n/a 1.668 1.648 1.025 1.660 1.589 n/ahours . . . . . . . . . 741,401 85,443.70 375 53,833.26 360 63.06 48,373 5,552.57 270 2.020 1.949 1.054 1.911 1.892 2.204
Institutional par-ticipation:
marstat . . . . . . . 813,911 25,120.34 500 15,931.96 480 63.42 53,062 1,447.15 360 1.479 1.347 1.315 1.885 1.675 1.529divorce . . . . . . . 13,418 306.06 125 229.44 120 74.97 n/a n/a n/a 1.395 1.640 0.673 1.433 1.425 n/achilds . . . . . . . . . 21,236 1,406.09 500 863.63 480 61.42 n/a n/a n/a 1.683 1.497 1.291 1.671 1.594 n/arelig . . . . . . . . . . 21,243 1,278.44 500 873.32 480 68.31 n/a n/a n/a 3.266 2.468 1.310 4.896 5.077 n/aattend . . . . . . . . 21,077 1,082.06 375 970.42 360 89.68 n/a n/a n/a 1.274 2.008 0.348 1.302 1.283 n/aunion . . . . . . . . . 294,895 35,433.73 125 28,707.09 120 81.02 n/a n/a n/a 3.144 2.714 1.147 n/a n/a n/avet . . . . . . . . . . . . 489,698 11,579.82 125 9,777.99 120 84.44 35,157 477.71 90 1.579 1.567 1.017 1.613 1.567 2.526
Class-based senti-ments:
Political attitudesand behav-iors:
partyid . . . . . . . 20,879 1,233.01 500 839.47 480 68.08 n/a n/a n/a 1.580 1.560 1.029 1.586 1.597 n/apolviews . . . . . . 18,268 1,063.09 500 752.60 480 70.79 n/a n/a n/a 1.306 1.336 0.923 1.231 1.213 n/ahelpnot . . . . . . . 10,363 579.11 250 361.61 240 62.44 n/a n/a n/a 1.579 1.439 1.255 1.571 1.556 n/amempolit . . . . . 8,969 238.34 125 145.28 120 60.95 n/a n/a n/a 1.931 2.630 0.680 1.822 1.755 n/a
Social attitudesand disposi-tions:
spkath . . . . . . . . 14,062 930.95 125 235.61 120 25.31 n/a n/a n/a 2.181 1.559 1.756 2.101 1.985 n/aspkcom . . . . . . . 13,913 1,200.55 125 254.34 120 21.19 n/a n/a n/a 2.230 1.527 1.894 2.138 2.019 n/ahomosex . . . . . . 12,705 1,222.29 250 475.88 240 38.93 n/a n/a n/a 1.752 1.477 1.439 1.713 1.654 n/apornlaw . . . . . . 13,245 441.76 250 382.84 240 86.66 n/a n/a n/a 1.244 1.403 0.646 1.194 1.170 n/acappun . . . . . . . 18,071 477.97 125 410.42 120 85.87 n/a n/a n/a 1.269 1.548 0.515 1.252 1.232 n/acourts . . . . . . . . . 18,734 498.54 250 420.59 240 84.36 n/a n/a n/a 1.167 1.353 0.510 1.137 1.124 n/aprayer . . . . . . . . 11,108 572.59 125 259.79 120 45.37 n/a n/a n/a 1.393 1.504 0.813 1.364 1.331 n/aracmar . . . . . . . . 12,644 1,125.13 125 246.20 120 21.88 n/a n/a n/a 2.559 1.999 1.357 2.234 2.088 n/aracopen . . . . . . . 9,985 302.50 125 178.72 120 59.08 n/a n/a n/a 1.762 1.449 1.529 1.716 1.631 n/ahelpblk . . . . . . . 10,790 429.21 250 368.58 240 85.87 n/a n/a n/a 1.415 1.443 0.947 1.405 1.366 n/afework . . . . . . . . 11,861 432.43 125 180.18 120 41.67 n/a n/a n/a 1.669 1.797 0.874 1.591 1.561 n/afepol . . . . . . . . . . 11,551 351.86 125 194.71 120 55.34 n/a n/a n/a 1.516 1.458 1.103 1.502 1.455 n/aabnomore . . . . . 15,647 662.40 125 271.71 120 41.02 n/a n/a n/a 1.432 1.420 1.025 1.403 1.384 n/aabrape . . . . . . . . 15,643 392.22 125 244.97 120 62.46 n/a n/a n/a 1.863 1.775 1.084 1.801 1.728 n/aanomia . . . . . . . 9,280 886.78 125 201.13 120 22.68 n/a n/a n/a 1.765 1.467 1.482 1.757 1.687 n/a
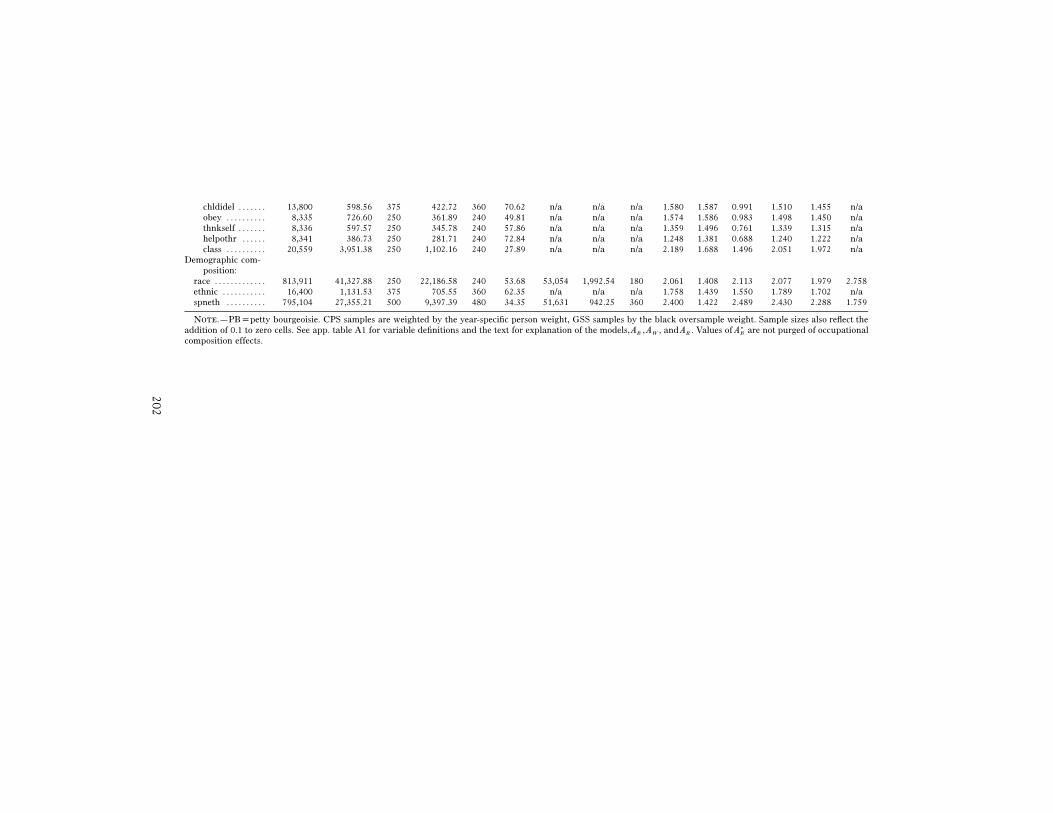
202
chldidel . . . . . . . 13,800 598.56 375 422.72 360 70.62 n/a n/a n/a 1.580 1.587 0.991 1.510 1.455 n/aobey . . . . . . . . . . 8,335 726.60 250 361.89 240 49.81 n/a n/a n/a 1.574 1.586 0.983 1.498 1.450 n/athnkself . . . . . . . 8,336 597.57 250 345.78 240 57.86 n/a n/a n/a 1.359 1.496 0.761 1.339 1.315 n/ahelpothr . . . . . . 8,341 386.73 250 281.71 240 72.84 n/a n/a n/a 1.248 1.381 0.688 1.240 1.222 n/aclass . . . . . . . . . . 20,559 3,951.38 250 1,102.16 240 27.89 n/a n/a n/a 2.189 1.688 1.496 2.051 1.972 n/a
Demographic com-position:
race . . . . . . . . . . . . . 813,911 41,327.88 250 22,186.58 240 53.68 53,054 1,992.54 180 2.061 1.408 2.113 2.077 1.979 2.758ethnic . . . . . . . . . . . 16,400 1,131.53 375 705.55 360 62.35 n/a n/a n/a 1.758 1.439 1.550 1.789 1.702 n/aspneth . . . . . . . . . . 795,104 27,355.21 500 9,397.39 480 34.35 51,631 942.25 360 2.400 1.422 2.489 2.430 2.288 1.759
Note.—PBppetty bourgeoisie. CPS samples are weighted by the year-specific person weight, GSS samples by the black oversample weight. Sample sizes also reflect theaddition of 0.1 to zero cells. See app. table A1 for variable definitions and the text for explanation of the models, , , and . Values of are not purged of occupational∗A A A AB W R B
composition effects.
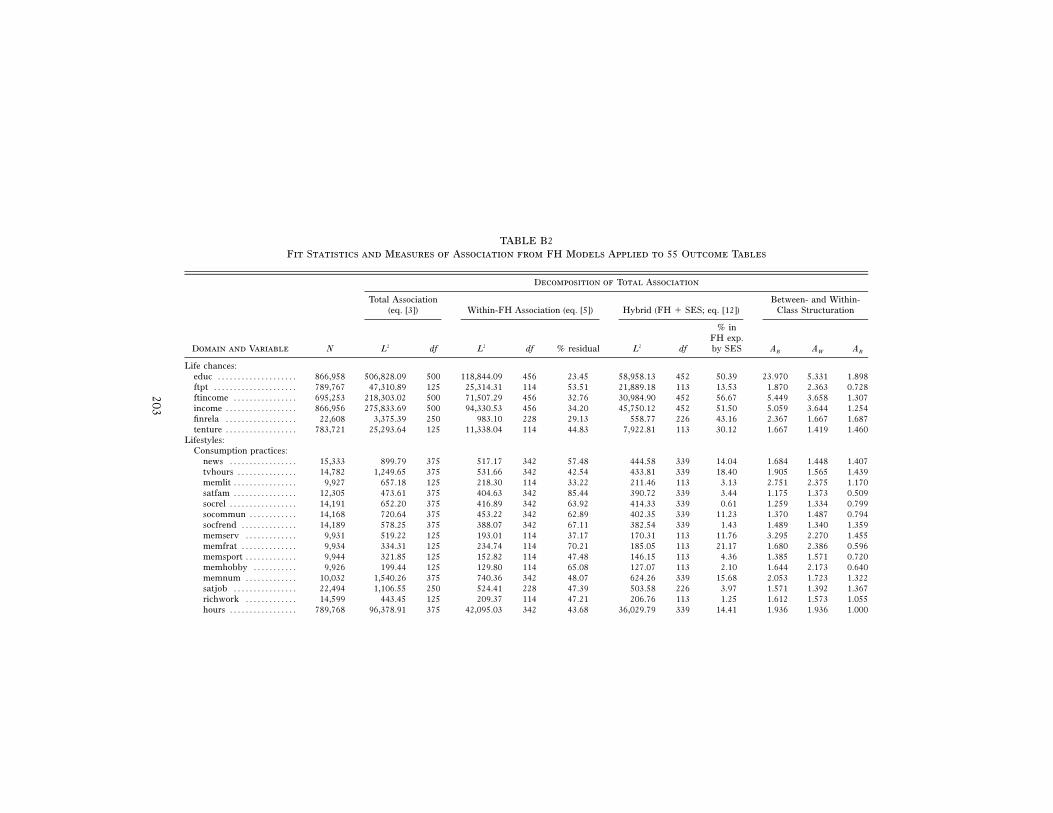
203
TABLE B2Fit Statistics and Measures of Association from FH Models Applied to 55 Outcome Tables
Decomposition of Total Association
Total Association(eq. [3]) Within-FH Association (eq. [5]) Hybrid (FH � SES; eq. [12])
Between- and Within-Class Structuration
Domain and Variable N L2 df L2 df % residual L2 df
% inFH exp.by SES AB AW AR
Life chances:educ . . . . . . . . . . . . . . . . . . . . 866,958 506,828.09 500 118,844.09 456 23.45 58,958.13 452 50.39 23.970 5.331 1.898ftpt . . . . . . . . . . . . . . . . . . . . . 789,767 47,310.89 125 25,314.31 114 53.51 21,889.18 113 13.53 1.870 2.363 0.728ftincome . . . . . . . . . . . . . . . . 695,253 218,303.02 500 71,507.29 456 32.76 30,984.90 452 56.67 5.449 3.658 1.307income . . . . . . . . . . . . . . . . . . 866,956 275,833.69 500 94,330.53 456 34.20 45,750.12 452 51.50 5.059 3.644 1.254finrela . . . . . . . . . . . . . . . . . . 22,608 3,375.39 250 983.10 228 29.13 558.77 226 43.16 2.367 1.667 1.687tenture . . . . . . . . . . . . . . . . . . 783,721 25,293.64 125 11,338.04 114 44.83 7,922.81 113 30.12 1.667 1.419 1.460
Lifestyles:Consumption practices:
news . . . . . . . . . . . . . . . . . 15,333 899.79 375 517.17 342 57.48 444.58 339 14.04 1.684 1.448 1.407tvhours . . . . . . . . . . . . . . . 14,782 1,249.65 375 531.66 342 42.54 433.81 339 18.40 1.905 1.565 1.439memlit . . . . . . . . . . . . . . . . 9,927 657.18 125 218.30 114 33.22 211.46 113 3.13 2.751 2.375 1.170satfam . . . . . . . . . . . . . . . . 12,305 473.61 375 404.63 342 85.44 390.72 339 3.44 1.175 1.373 0.509socrel . . . . . . . . . . . . . . . . . 14,191 652.20 375 416.89 342 63.92 414.33 339 0.61 1.259 1.334 0.799socommun . . . . . . . . . . . . 14,168 720.64 375 453.22 342 62.89 402.35 339 11.23 1.370 1.487 0.794socfrend . . . . . . . . . . . . . . 14,189 578.25 375 388.07 342 67.11 382.54 339 1.43 1.489 1.340 1.359memserv . . . . . . . . . . . . . 9,931 519.22 125 193.01 114 37.17 170.31 113 11.76 3.295 2.270 1.455memfrat . . . . . . . . . . . . . . 9,934 334.31 125 234.74 114 70.21 185.05 113 21.17 1.680 2.386 0.596memsport . . . . . . . . . . . . . 9,944 321.85 125 152.82 114 47.48 146.15 113 4.36 1.385 1.571 0.720memhobby . . . . . . . . . . . 9,926 199.44 125 129.80 114 65.08 127.07 113 2.10 1.644 2.173 0.640memnum . . . . . . . . . . . . . 10,032 1,540.26 375 740.36 342 48.07 624.26 339 15.68 2.053 1.723 1.322satjob . . . . . . . . . . . . . . . . 22,494 1,106.55 250 524.41 228 47.39 503.58 226 3.97 1.571 1.392 1.367richwork . . . . . . . . . . . . . 14,599 443.45 125 209.37 114 47.21 206.76 113 1.25 1.612 1.573 1.055hours . . . . . . . . . . . . . . . . . 789,768 96,378.91 375 42,095.03 342 43.68 36,029.79 339 14.41 1.936 1.936 1.000
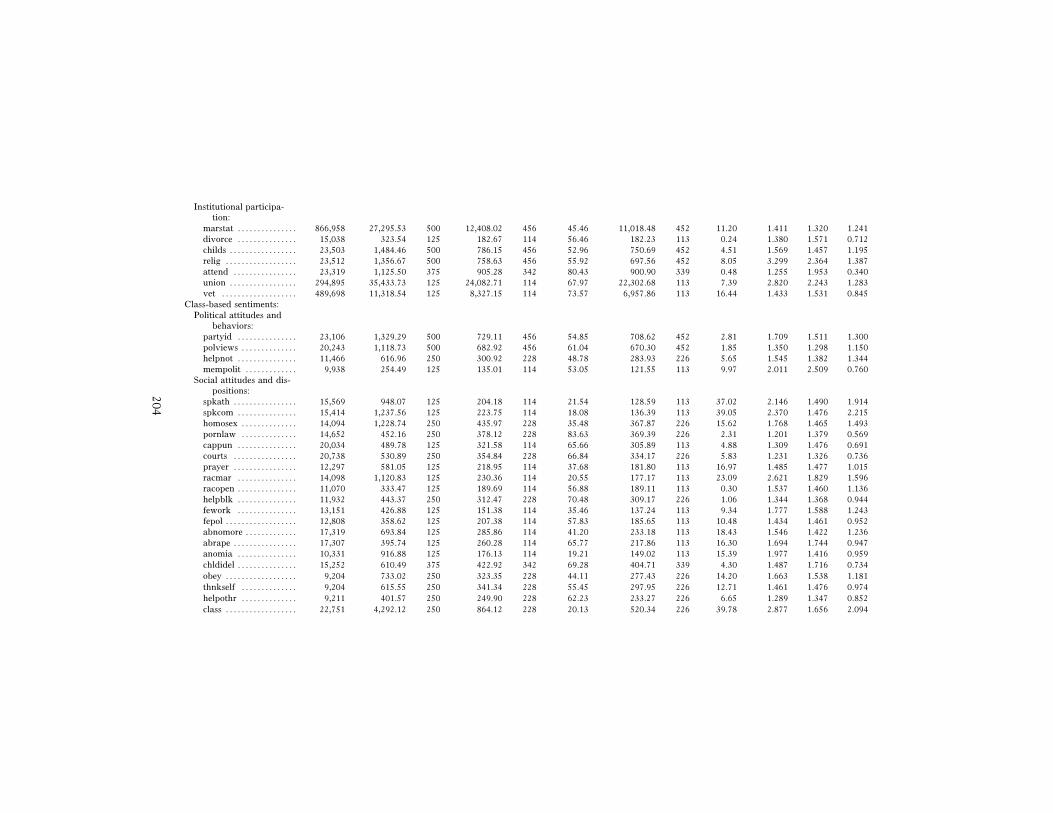
204
Institutional participa-tion:
marstat . . . . . . . . . . . . . . . 866,958 27,295.53 500 12,408.02 456 45.46 11,018.48 452 11.20 1.411 1.320 1.241divorce . . . . . . . . . . . . . . . 15,038 323.54 125 182.67 114 56.46 182.23 113 0.24 1.380 1.571 0.712childs . . . . . . . . . . . . . . . . . 23,503 1,484.46 500 786.15 456 52.96 750.69 452 4.51 1.569 1.457 1.195relig . . . . . . . . . . . . . . . . . . 23,512 1,356.67 500 758.63 456 55.92 697.56 452 8.05 3.299 2.364 1.387attend . . . . . . . . . . . . . . . . 23,319 1,125.50 375 905.28 342 80.43 900.90 339 0.48 1.255 1.953 0.340union . . . . . . . . . . . . . . . . . 294,895 35,433.73 125 24,082.71 114 67.97 22,302.68 113 7.39 2.820 2.243 1.283vet . . . . . . . . . . . . . . . . . . . 489,698 11,318.54 125 8,327.15 114 73.57 6,957.86 113 16.44 1.433 1.531 0.845
Class-based sentiments:Political attitudes and
behaviors:partyid . . . . . . . . . . . . . . . 23,106 1,329.29 500 729.11 456 54.85 708.62 452 2.81 1.709 1.511 1.300polviews . . . . . . . . . . . . . . 20,243 1,118.73 500 682.92 456 61.04 670.30 452 1.85 1.350 1.298 1.150helpnot . . . . . . . . . . . . . . . 11,466 616.96 250 300.92 228 48.78 283.93 226 5.65 1.545 1.382 1.344mempolit . . . . . . . . . . . . . 9,938 254.49 125 135.01 114 53.05 121.55 113 9.97 2.011 2.509 0.760
Social attitudes and dis-positions:
spkath . . . . . . . . . . . . . . . . 15,569 948.07 125 204.18 114 21.54 128.59 113 37.02 2.146 1.490 1.914spkcom . . . . . . . . . . . . . . . 15,414 1,237.56 125 223.75 114 18.08 136.39 113 39.05 2.370 1.476 2.215homosex . . . . . . . . . . . . . . 14,094 1,228.74 250 435.97 228 35.48 367.87 226 15.62 1.768 1.465 1.493pornlaw . . . . . . . . . . . . . . 14,652 452.16 250 378.12 228 83.63 369.39 226 2.31 1.201 1.379 0.569cappun . . . . . . . . . . . . . . . 20,034 489.78 125 321.58 114 65.66 305.89 113 4.88 1.309 1.476 0.691courts . . . . . . . . . . . . . . . . 20,738 530.89 250 354.84 228 66.84 334.17 226 5.83 1.231 1.326 0.736prayer . . . . . . . . . . . . . . . . 12,297 581.05 125 218.95 114 37.68 181.80 113 16.97 1.485 1.477 1.015racmar . . . . . . . . . . . . . . . 14,098 1,120.83 125 230.36 114 20.55 177.17 113 23.09 2.621 1.829 1.596racopen . . . . . . . . . . . . . . . 11,070 333.47 125 189.69 114 56.88 189.11 113 0.30 1.537 1.460 1.136helpblk . . . . . . . . . . . . . . . 11,932 443.37 250 312.47 228 70.48 309.17 226 1.06 1.344 1.368 0.944fework . . . . . . . . . . . . . . . 13,151 426.88 125 151.38 114 35.46 137.24 113 9.34 1.777 1.588 1.243fepol . . . . . . . . . . . . . . . . . . 12,808 358.62 125 207.38 114 57.83 185.65 113 10.48 1.434 1.461 0.952abnomore . . . . . . . . . . . . . 17,319 693.84 125 285.86 114 41.20 233.18 113 18.43 1.546 1.422 1.236abrape . . . . . . . . . . . . . . . . 17,307 395.74 125 260.28 114 65.77 217.86 113 16.30 1.694 1.744 0.947anomia . . . . . . . . . . . . . . . 10,331 916.88 125 176.13 114 19.21 149.02 113 15.39 1.977 1.416 0.959chldidel . . . . . . . . . . . . . . . 15,252 610.49 375 422.92 342 69.28 404.71 339 4.30 1.487 1.716 0.734obey . . . . . . . . . . . . . . . . . . 9,204 733.02 250 323.35 228 44.11 277.43 226 14.20 1.663 1.538 1.181thnkself . . . . . . . . . . . . . . 9,204 615.55 250 341.34 228 55.45 297.95 226 12.71 1.461 1.476 0.974helpothr . . . . . . . . . . . . . . 9,211 401.57 250 249.90 228 62.23 233.27 226 6.65 1.289 1.347 0.852class . . . . . . . . . . . . . . . . . . 22,751 4,292.12 250 864.12 228 20.13 520.34 226 39.78 2.877 1.656 2.094
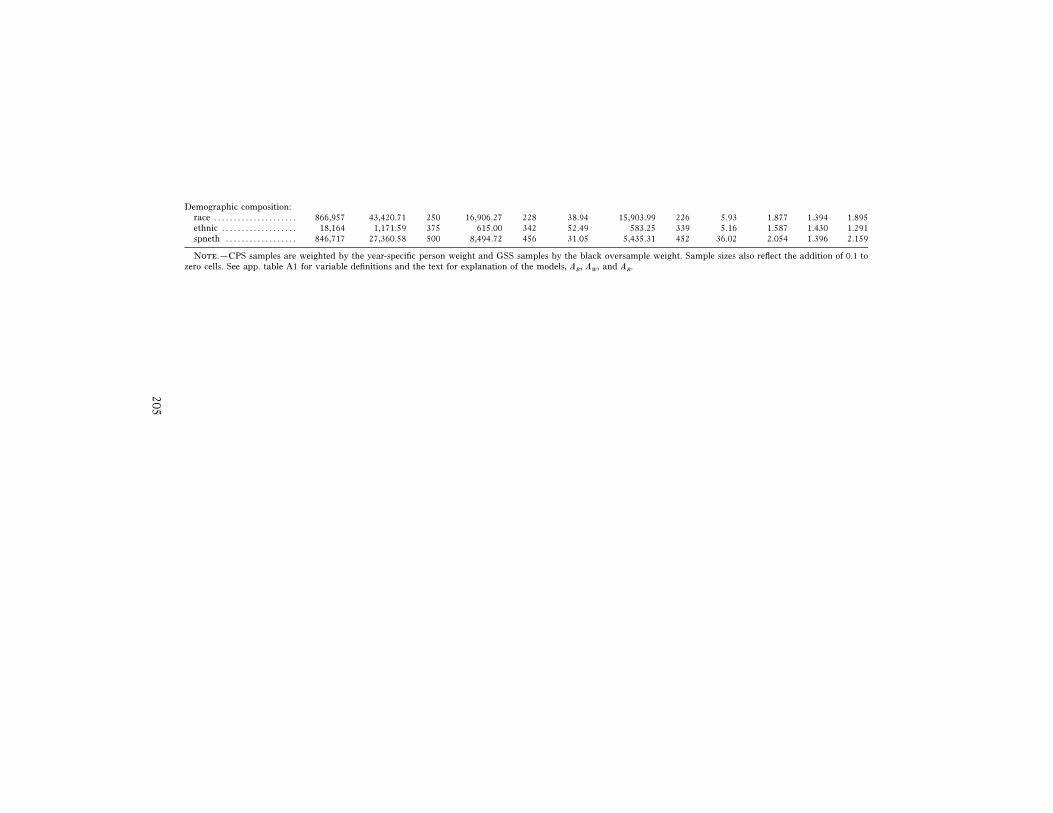
205
Demographic composition:race . . . . . . . . . . . . . . . . . . . . . 866,957 43,420.71 250 16,906.27 228 38.94 15,903.99 226 5.93 1.877 1.394 1.895ethnic . . . . . . . . . . . . . . . . . . . 18,164 1,171.59 375 615.00 342 52.49 583.25 339 5.16 1.587 1.430 1.291spneth . . . . . . . . . . . . . . . . . . 846,717 27,360.58 500 8,494.72 456 31.05 5,435.31 452 36.02 2.054 1.396 2.159
Note.—CPS samples are weighted by the year-specific person weight and GSS samples by the black oversample weight. Sample sizes also reflect the addition of 0.1 tozero cells. See app. table A1 for variable definitions and the text for explanation of the models, , , and .A A AB W R
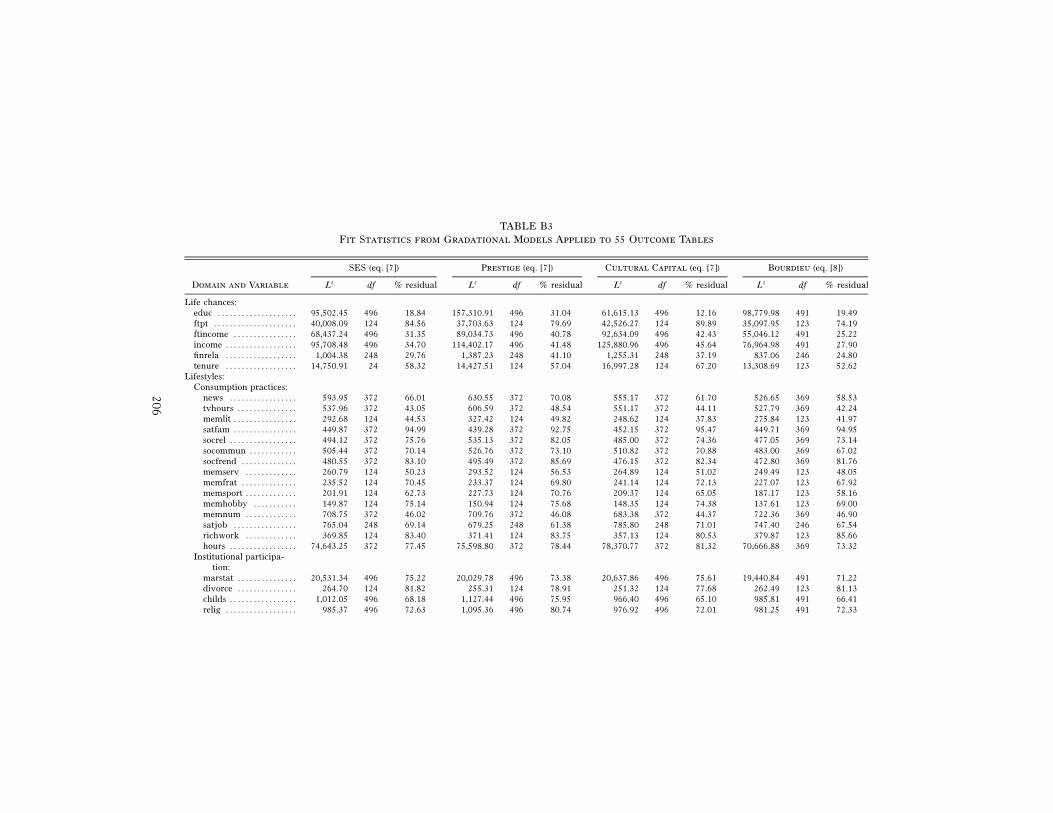
206
TABLE B3Fit Statistics from Gradational Models Applied to 55 Outcome Tables
Domain and Variable
SES (eq. [7]) Prestige (eq. [7]) Cultural Capital (eq. [7]) Bourdieu (eq. [8])
L2 df % residual L2 df % residual L2 df % residual L2 df % residual
Life chances:educ . . . . . . . . . . . . . . . . . . . . 95,502.45 496 18.84 157,310.91 496 31.04 61,615.13 496 12.16 98,779.98 491 19.49ftpt . . . . . . . . . . . . . . . . . . . . . 40,008.09 124 84.56 37,703.63 124 79.69 42,526.27 124 89.89 35,097.95 123 74.19ftincome . . . . . . . . . . . . . . . . 68,437.24 496 31.35 89,034.73 496 40.78 92,634.09 496 42.43 55,046.12 491 25.22income . . . . . . . . . . . . . . . . . . 95,708.48 496 34.70 114,402.17 496 41.48 125,880.96 496 45.64 76,964.98 491 27.90finrela . . . . . . . . . . . . . . . . . . 1,004.38 248 29.76 1,387.23 248 41.10 1,255.31 248 37.19 837.06 246 24.80tenure . . . . . . . . . . . . . . . . . . 14,750.91 24 58.32 14,427.51 124 57.04 16,997.28 124 67.20 13,308.69 123 52.62
Lifestyles:Consumption practices:
news . . . . . . . . . . . . . . . . . 593.95 372 66.01 630.55 372 70.08 555.17 372 61.70 526.65 369 58.53tvhours . . . . . . . . . . . . . . . 537.96 372 43.05 606.59 372 48.54 551.17 372 44.11 527.79 369 42.24memlit . . . . . . . . . . . . . . . . 292.68 124 44.53 327.42 124 49.82 248.62 124 37.83 275.84 123 41.97satfam . . . . . . . . . . . . . . . . 449.87 372 94.99 439.28 372 92.75 452.15 372 95.47 449.71 369 94.95socrel . . . . . . . . . . . . . . . . . 494.12 372 75.76 535.13 372 82.05 485.00 372 74.36 477.05 369 73.14socommun . . . . . . . . . . . . 505.44 372 70.14 526.76 372 73.10 510.82 372 70.88 483.00 369 67.02socfrend . . . . . . . . . . . . . . 480.55 372 83.10 495.49 372 85.69 476.15 372 82.34 472.80 369 81.76memserv . . . . . . . . . . . . . 260.79 124 50.23 293.52 124 56.53 264.89 124 51.02 249.49 123 48.05memfrat . . . . . . . . . . . . . . 235.52 124 70.45 233.37 124 69.80 241.14 124 72.13 227.07 123 67.92memsport . . . . . . . . . . . . . 201.91 124 62.73 227.73 124 70.76 209.37 124 65.05 187.17 123 58.16memhobby . . . . . . . . . . . 149.87 124 75.14 150.94 124 75.68 148.35 124 74.38 137.61 123 69.00memnum . . . . . . . . . . . . . 708.75 372 46.02 709.76 372 46.08 683.38 372 44.37 722.36 369 46.90satjob . . . . . . . . . . . . . . . . 765.04 248 69.14 679.25 248 61.38 785.80 248 71.01 747.40 246 67.54richwork . . . . . . . . . . . . . 369.85 124 83.40 371.41 124 83.75 357.13 124 80.53 379.87 123 85.66hours . . . . . . . . . . . . . . . . . 74,643.25 372 77.45 75,598.80 372 78.44 78,370.77 372 81.32 70,666.88 369 73.32
Institutional participa-tion:
marstat . . . . . . . . . . . . . . . 20,531.34 496 75.22 20,029.78 496 73.38 20,637.86 496 75.61 19,440.84 491 71.22divorce . . . . . . . . . . . . . . . 264.70 124 81.82 255.31 124 78.91 251.32 124 77.68 262.49 123 81.13childs . . . . . . . . . . . . . . . . . 1,012.05 496 68.18 1,127.44 496 75.95 966.40 496 65.10 985.81 491 66.41relig . . . . . . . . . . . . . . . . . . 985.37 496 72.63 1,095.36 496 80.74 976.92 496 72.01 981.25 491 72.33
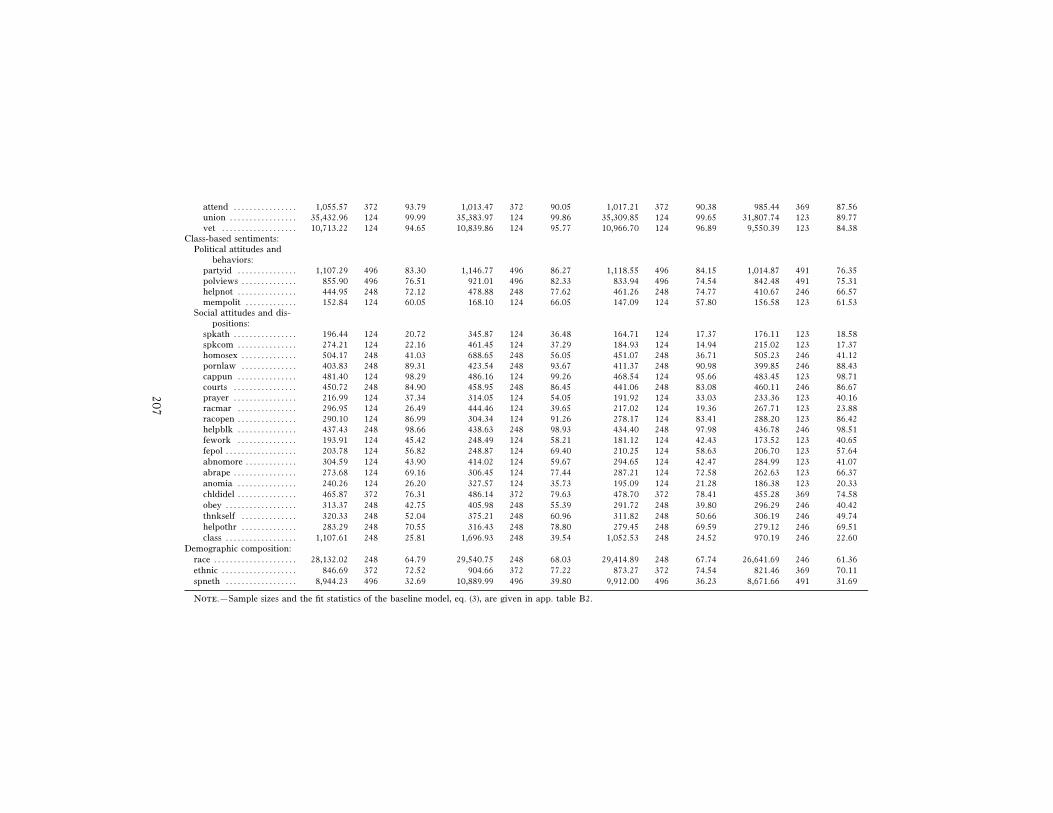
207
attend . . . . . . . . . . . . . . . . 1,055.57 372 93.79 1,013.47 372 90.05 1,017.21 372 90.38 985.44 369 87.56union . . . . . . . . . . . . . . . . . 35,432.96 124 99.99 35,383.97 124 99.86 35,309.85 124 99.65 31,807.74 123 89.77vet . . . . . . . . . . . . . . . . . . . 10,713.22 124 94.65 10,839.86 124 95.77 10,966.70 124 96.89 9,550.39 123 84.38
Class-based sentiments:Political attitudes and
behaviors:partyid . . . . . . . . . . . . . . . 1,107.29 496 83.30 1,146.77 496 86.27 1,118.55 496 84.15 1,014.87 491 76.35polviews . . . . . . . . . . . . . . 855.90 496 76.51 921.01 496 82.33 833.94 496 74.54 842.48 491 75.31helpnot . . . . . . . . . . . . . . . 444.95 248 72.12 478.88 248 77.62 461.26 248 74.77 410.67 246 66.57mempolit . . . . . . . . . . . . . 152.84 124 60.05 168.10 124 66.05 147.09 124 57.80 156.58 123 61.53
Social attitudes and dis-positions:
spkath . . . . . . . . . . . . . . . . 196.44 124 20.72 345.87 124 36.48 164.71 124 17.37 176.11 123 18.58spkcom . . . . . . . . . . . . . . . 274.21 124 22.16 461.45 124 37.29 184.93 124 14.94 215.02 123 17.37homosex . . . . . . . . . . . . . . 504.17 248 41.03 688.65 248 56.05 451.07 248 36.71 505.23 246 41.12pornlaw . . . . . . . . . . . . . . 403.83 248 89.31 423.54 248 93.67 411.37 248 90.98 399.85 246 88.43cappun . . . . . . . . . . . . . . . 481.40 124 98.29 486.16 124 99.26 468.54 124 95.66 483.45 123 98.71courts . . . . . . . . . . . . . . . . 450.72 248 84.90 458.95 248 86.45 441.06 248 83.08 460.11 246 86.67prayer . . . . . . . . . . . . . . . . 216.99 124 37.34 314.05 124 54.05 191.92 124 33.03 233.36 123 40.16racmar . . . . . . . . . . . . . . . 296.95 124 26.49 444.46 124 39.65 217.02 124 19.36 267.71 123 23.88racopen . . . . . . . . . . . . . . . 290.10 124 86.99 304.34 124 91.26 278.17 124 83.41 288.20 123 86.42helpblk . . . . . . . . . . . . . . . 437.43 248 98.66 438.63 248 98.93 434.40 248 97.98 436.78 246 98.51fework . . . . . . . . . . . . . . . 193.91 124 45.42 248.49 124 58.21 181.12 124 42.43 173.52 123 40.65fepol . . . . . . . . . . . . . . . . . . 203.78 124 56.82 248.87 124 69.40 210.25 124 58.63 206.70 123 57.64abnomore . . . . . . . . . . . . . 304.59 124 43.90 414.02 124 59.67 294.65 124 42.47 284.99 123 41.07abrape . . . . . . . . . . . . . . . . 273.68 124 69.16 306.45 124 77.44 287.21 124 72.58 262.63 123 66.37anomia . . . . . . . . . . . . . . . 240.26 124 26.20 327.57 124 35.73 195.09 124 21.28 186.38 123 20.33chldidel . . . . . . . . . . . . . . . 465.87 372 76.31 486.14 372 79.63 478.70 372 78.41 455.28 369 74.58obey . . . . . . . . . . . . . . . . . . 313.37 248 42.75 405.98 248 55.39 291.72 248 39.80 296.29 246 40.42thnkself . . . . . . . . . . . . . . 320.33 248 52.04 375.21 248 60.96 311.82 248 50.66 306.19 246 49.74helpothr . . . . . . . . . . . . . . 283.29 248 70.55 316.43 248 78.80 279.45 248 69.59 279.12 246 69.51class . . . . . . . . . . . . . . . . . . 1,107.61 248 25.81 1,696.93 248 39.54 1,052.53 248 24.52 970.19 246 22.60
Demographic composition:race . . . . . . . . . . . . . . . . . . . . . 28,132.02 248 64.79 29,540.75 248 68.03 29,414.89 248 67.74 26,641.69 246 61.36ethnic . . . . . . . . . . . . . . . . . . . 846.69 372 72.52 904.66 372 77.22 873.27 372 74.54 821.46 369 70.11spneth . . . . . . . . . . . . . . . . . . 8,944.23 496 32.69 10,889.99 496 39.80 9,912.00 496 36.23 8,671.66 491 31.69
Note.—Sample sizes and the fit statistics of the baseline model, eq. (3), are given in app. table B2.
American Journal of Sociology
208
REFERENCES
Abbott, Andrew. 1988. The System of Professions: An Essay on the Division of ExpertLabor. Chicago: University of Chicago Press.
Agresti, Alan. 1990. Categorical Data Analysis. New York: John Wiley & Sons.Arum, Richard, and Michael Hout. 1997. “The Early Returns: School-to-Work
Transitions in the United States.” Pp. 130–46 in Educational Origins and ClassDestinations, edited by Walter Muller and Yossi Shavit. Boulder, Colo.: Westview.
Beck, Ulrich. 2000. Brave New World of Work, translated by Patrick Camiller. Malden,Mass.: Blackwell.
Becker, Gary S. 1967. Human Capital: A Theoretical and Empirical Analysis withSpecial Reference to Education. Chicago: University of Chicago Press.
Becker, Howard S., and James Carper. 1956. “The Elements of Identification with anOccupation.” American Sociological Review 21 (3): 341–48.
Berelson, Bernard R., Paul F. Lazarsfeld, and William N. McPhee. 1954. Voting: AStudy of Opinion Formation in Presidential Campaigns. Chicago: University ofChicago Press.
Birkelund, Gunn Elisabeth, Leo A. Goodman, and David Rose. 1996. “The LatentStructure of Job Characteristics of Men and Women.” American Sociological Review104:1346–97.
Bonacich, Edna. 1972. “A Theory of Ethic Antagonism: The Split Labor Market.”American Sociological Review 37:547–59.
Bourdieu, Pierre. 1984. Distinction: A Social Critique of the Judgement of Taste,translated by Richard Nice. New York: Cambridge University Press.
Bradley, Harriet. 1996. Fractured Identities: Changing Patterns of Inequality.Cambridge: Polity Press.
Braverman, Harry. 1974. Labor and Monopoly Capital: The Degradation of Work inthe 20th Century. New York: Monthly Review Press.
Bridges, William. 1995. “Where Do Markets Go To? An Analysis of Change in Internaland External Mobility Patterns.” Research in Social Stratification and Mobility 14:71–98.
Brint, Steven. 1984. “‘New Class’ and Cumulative Trend Explanations of LiberalPolitical Attitudes of Professionals.” American Journal of Sociology 90:30–71.
———. 1994. In an Age of Experts: The Changing Role of Professionals in Politicsand Public Life. Princeton, N.J.: Princeton University Press.
Brinton, Mary C. In press. “Education and Economy.” In Handbook of EconomicSociology, edited by Neil Smelser and Richard Swedberg. New York: Russell Sage.
Bryson, Bethany. 1996. “Anything but Heavy Metal: Symbolic Exclusion and MusicalDislikes.” American Sociological Review 61 (5): 881–96.
———. 1998. “What about the Univores? Musical Dislikes and Group Based IdentityConstruction among Americans with Low Levels of Education.” Poetics 25 (2–3):141–56.
Burawoy, Michael. 1979. Manufacturing Consent: Changes in the Labor Process underMonopoly Capitalism. Chicago: University of Chicago Press.
Bureau of Labor Statistics. 2004. March demographic files of the Current PopulationSurveys. Machine-readable data file. Washington, D.C.: Bureau of the Census.
Caplow, Theodore. 1954. The Sociology of Work. Minneapolis: University of MinnesotaPress.
Casey, Catherine. 1995. Work, Self, and Society. London: Routledge.Clark, Terry Nichols, and Seymour M. Lipset. 1991. “Are Social Classes Dying?”
International Sociology 6:397–410.———, eds. 2001. The Breakdown of Class Politics. Washington, D.C., and Baltimore:
Woodrow Wilson Center Press and Johns Hopkins University Press.
Case for a New Class Map
209
Coser, Lewis A. 1974. Greedy Institutions: Patterns of Undivided Commitment. NewYork: Free Press.
Dahrendorf, Ralf. 1959. Class and Class Consciousness in Industrial Society. Stanford,Calif.: Stanford University Press.
Davis, James A., Tom W. Smith, and Peter Marsden. 2004. GSS (General Social Survey)1972–2002 Cumulative Data File. NORC ed. Chicago: NORC.
DiMaggio, Paul. 2001. “Social Stratification, Life-style, Social Cognition, and SocialParticipation.” Pp. 542–55 in Social Stratification: Class, Race, and Gender inSociological Perspective, 2d ed. Edited by David B. Grusky. Boulde, Colo.r:Westview.
DiMaggio, Paul, and John Mohr. 1985. “Cultural Capital, Educational Attainment,and Marital Selection.” American Journal of Sociology 90:1231–61.
Emmison, Michael, and Mark Western. 1990. “Social Class and Social Identity: AComment on Marshall et al.” Sociology 24 (2): 241–53.
Epstein, Cynthia Fuchs, Carroll Seron, Bonnie Oglensky, and Robert Saute. 1999. ThePart-Time Paradox: Time Norms, Professional Life, Family and Gender. New York:Routledge.
Erikson, Robert, and John H. Goldthorpe. 1992. The Constant Flux: A Study of ClassMobility in Industrial Societies. Oxford: Clarendon.
Evans, Geoffrey. 1992. “Testing the Validity of the Goldthorpe Class Schema.”European Sociological Review 8 (3): 211–32.
———. 1999. The End of Class Politics. Oxford: Oxford University Press.Evans, Geoffrey, and Colin Mills. 1998. “Identifying Class Structure: A Latent Class
Analysis of the Criterion-Related and Construct Validity of the Goldthorpe ClassSchema.” European Sociological Review 14 (1): 87–106.
Featherman, David L., and Robert M. Hauser. 1978. Opportunity and Change. NewYork: Academic.
Fernandez, Roberto M., and Nancy Weinberg. 1997. “Personal Contacts and Hiringin a Retail Bank.” American Sociological Review 62:883–902.
Freidson, Eliot. 1994. Professionalism Reborn: Theory, Prophecy, and Policy. Chicago:University of Chicago Press.
———. 2001. Professionalism: The Third Logic. Chicago: University of Chicago Press.Ganzeboom, Harry B. G., Ruud Luijkx, and Donald J. Treiman. 1989.
“Intergenerational Class Mobility in Comparative Perspective.” Research in SocialStratification and Mobility 9:3–79.
Giddens, Anthony. 1973. The Class Structure of the Advanced Societies. New York:Harper.
Goldthorpe, John H. 2000. On Sociology: Numbers, Narratives, and the Integration ofResearch and Theory. Oxford: Oxford University Press.
———. 2002. “Occupational Sociology, Yes; Class Analysis, No: Comment on Gruskyand Weeden’s Research Agenda.” Acta Sociologica 45:211–17.
Goldthorpe, John H., and David Lockwood. 1969. The Affluent Worker in the ClassStructure. Cambridge: Oxford University Press.
Goldthorpe, John H., and Abigail McKnight. In press. “The Economic Basis of SocialClass.” In Mobility and Inequality: Frontiers of Research from Sociology andEconomics, edited by Stephen L. Morgan, Gary Fields, and David B. Grusky.Stanford, Calif.: Stanford University Press.
Goodman, Leo. 1979. “Simple Models for the Analysis of Association in Cross-Classifications Having Ordered Categories.” Journal of the American StatisticalAssociation 74:537–52.
Granovetter, Mark. 1995. Getting a Job, 2d ed. Chicago: University of Chicago Press.Grusky, David B. 2005. “Foundations of a Neo-Durkheimian Class Analysis.” In
Approaches to Class Analysis, edited by Erik Olin Wright. Cambridge: CambridgeUniversity Press.
American Journal of Sociology
210
Grusky, David B., and Robert M. Hauser. 1984. “Comparative Social MobilityRevisited: Models of Convergence and Divergence in 16 Countries.” AmericanSociological Review 49:19–38.
Grusky, David B., and Jesper B. Sørensen. 1998. “Can Class Analysis Be Salvaged?”American Journal of Sociology 103:1187–1234.
———. 2001. “Are There Big Social Classes?” Pp. 183–94 in Social Stratification:Class, Race, and Gender in Sociological Perspective, 2d ed. Edited by David B.Grusky. Boulder, Colo.: Westview.
Grusky, David B., and Kim A. Weeden. 2001. “Decomposition without Death: AResearch Agenda for the New Class Analysis.” Acta Sociologica 44 (3): 203–18.
———. 2002. “Class Analysis and the Heavy Weight of Convention.” Acta Sociologica45 (3): 229–36.
———. In press. “Does the Sociological Approach to Studying Mobility Have aFuture?” In Mobility and Inequality: Frontiers of Research from Sociology andEconomics, edited by Stephen L. Morgan, Gary Fields, and David B. Grusky.Stanford, Calif.: Stanford University Press.
Grusky, David B., Kim A. Weeden, and Jesper Sørensen. 2000. “The Case for Realismin Class Analysis.” Political Power and Social Theory 14:291–305.
Halaby, Charles, and David Weakliem. 1993. “Class and Authority in the EarningsFunction.” American Sociological Review 58:16–30.
Hall, Stuart. 2001. “The Meaning of New Times.” Pp. 859–65 in Social Stratification:Class, Race, and Gender in Sociological Perspective, 2d ed. Edited by David B.Grusky. Boulder, Colo.: Westview.
Hauser, Robert M., and John Logan. 1992. “How Not to Measure IntergenerationalOccupational Persistence.” American Journal of Sociology 97 (6): 1689–1711.
Hauser, Robert M., and John Robert Warren. 1997. “Socioeconomic Indexes forOccupations: A Review, Update, and Critique.” Sociological Methodology 27:177–298.
Hechter, Michael. 2004. “From Class to Culture.” American Journal of Sociology 110(2): 400–445.
Hochschild, Arlie Russell. 1997. The Time Bind: When Work Becomes Home and HomeBecomes Work. New York: Metropolitan Books.
Holton, Robert J., and Brian S. Turner. 1989. Max Weber on Economy and Society.London: Routledge.
Hout, Michael. 1984. “Status, Autonomy, and Training in Occupational Mobility.”American Journal of Sociology 89:1379–1409.
———. 1988. “More Universalism, Less Structural Mobility: The AmericanOccupational Structure in the 1980s.” American Journal of Sociology 93:1358–1400.
Hout, Michael, and Robert M. Hauser. 1992. “Symmetry and Hierarchy in SocialMobility: A Methodological Analysis of the CASMIN Model of Class Mobility.”European Sociological Review 8:239–66.
Hout, Michael, and John A. Jackson. 1986. “Dimensions of Occupational Mobility inthe Republic of Ireland.” European Sociological Review 2:114–37.
Hughes, Everett C. 1958. Men and Their Work. Glencoe, Ill.: Free Press.Inglehart, Ronald. 1997. Modernization and Postmodernization: Cultural, Economic,
and Political Change in 43 Societies. Princeton, N.J.: Princeton University Press.Jacobs, Jerry A., and Kathleen Gerson. 2001. “Overworked Americans or Overworked
Families: Explaining Trends in Work, Leisure, and Family Time.” Work andOccupations 28 (1): 40–63.
Kalleberg, Arne K., and Larry J. Griffin. 1980. “Class, Occupation, and Inequality inJob Rewards.” American Journal of Sociology 85 (4): 731–68.
Kalmijn, Mathijs. 1994. “Assortative Mating by Cultural and Economic OccupationalStatus.” American Journal of Sociology 100 (2): 422–52.
Case for a New Class Map
211
Kingston, Paul W. 2000. The Classless Society. Stanford, Calif.: Stanford UniversityPress.
Kohn, Melvin L. [1980] 2001. “Job Complexity and Adult Personality.” Pp. 430–38 inSocial Stratification: Class, Race, and Gender in Sociological Perspective, edited byDavid B. Grusky. Boulder, Colo.: Westview.
Kohn, Melvin L., and Carmi Schooler, with the collaboration of Joanne Miller. 1983.Work and Personality: An Inquiry into the Impact of Social Stratification. Norwood,N.J.: Ablex.
Krause, Elliott A. 1996. Death of the Guilds: Professions, States, and the Advance ofCapitalism, 1930 to the Present. New Haven, Conn.: Yale University Press.
Lamont, Michele. 1994. Money, Morals, and Manners: The Culture of the French andAmerican Upper-Middle Class. Chicago: University of Chicago Press.
Logan, John. 1996. “Opportunity and Choice in Socially Structured Labor Markets.”American Journal of Sociology 102 (1): 114–60.
Manza, Jeff, and Clem Brooks. 1999. Social Cleavages and Political Change. Oxford:Oxford University Press.
Marx, Karl. (1869) 1963. The Eighteenth Brumaire of Louis Bonaparte. New York:International Publishers.
Menaghan, Elizabeth G. 1991. “Work Experiences and Family Interaction Processes:The Long Reach of the Job?” Annual Review of Sociology 17:419–44.
Mortimer, Jeylan T., and Jon Lorence. 1979. “Work Experience and Occupational ValueSocialization.” American Journal of Sociology 84:1361–85.
Murphy, Raymond. 1988. Social Closure: The Theory of Monopolization and Exclusion.Oxford: Clarendon.
Nakao, Keiko, and Judith Treas. 1994. “Updating Occupational Prestige andSocioeconomic Scores: How the New Measures Measure Up.” SociologicalMethodology 24:1–72.
Pahl, Raymond E. 1989. “Is the Emporer Naked? Some Questions on the Adequacyof Sociological Theory in Urban and Regional Research.” International Journal ofUrban and Regional Research 13:709–20.
Pakulski, Jan, and Malcolm Waters. 1996. Death of Class. Thousand Oaks, Calif.:Sage.
Park, Robert Ezra. 1952. Human Communities: The City and Human Ecology. Glencoe,Ill.: Free Press.
Petersen, Trond, Ishak Saporta, and Mark-David Seidel. 2000. “Offering a Job:Meritocracy and Social Networks.” American Journal of Sociology 106 (3): 763–816.
Peterson, Richard A., and Albert Simkus. 1992. “How Musical Tastes MarkOccupational Status Groups.” Pp. 152–86 in Cultivating Differences: SymbolicBoundaries and the Making of Inequality, edited by Michele Lamont and MarcelFournier. Chicago: University of Chicago Press.
Portes, Alejandro. 2000. “The Resilient Importance of Class: A NominalistInterpretation.” Political Power and Social Theory 14:249–84.
Raftery, Adrian E. 1995. “Bayesian Model Selection in Social Research.” SociologicalMethodology 25:111–63.
Robinson, John P., and Geoffrey Godbey. 1997. Time for Life: The Surprising WaysAmericans Use Their Time. University Park: University of Pennsylvania Press.
Rose, David, and Karen O’Reilly, eds. 1997. Constructing Classes: Towards a NewSocial Classification for the United Kingdom. Swindon: ONS/ESRC.
———. 1998. Final Report of the ESRC Review of Government Social Classifications.Swindon: ONS/ESRC.
Rytina, Steve. 2000. “Is Occupational Mobility Declining in the US?” Social Forces78 (4): 1227–76.
Schor, Juliet B. 1991. The Overworked American: The Unexpected Decline of Leisure.New York: Basic Books.
American Journal of Sociology
212
Shu, Xioaling, Pi-Ling Fan, Xiaoli Li, and Margaret Mooney Marini. 1996.“Characterizing Occupations with Data from the Dictionary of Occupational Titles.”Social Science Research 25 (2): 149–73.
Sørensen, Aage B. 2000. “Employment Relations and Class Structure.” Pp. 16–42 inRenewing Class Analysis, edited by Rosemary Crompton, Fiona Devine, MichaelSavage, and John Scott. Oxford: Blackwell.
Smith, Adam. (1776) 1991. The Wealth of Nations. Amherst, N.Y.: Prometheus.Therborn, Goran. 2002. “Class Perspectives: Shrink or Widen?” Acta Sociologica 45
(3): 221–25.Thompson, E. P. 1963. The Making of the English Working Class. New York: Pantheon.U.S. Bureau of the Census. 1989. “The Relationship between the 1970 and 1980
Industry and Occupation Classification Systems.” Technical paper 59. Washington,D.C.: U.S. Government Printing Office.
Van Maanen, John, and Stephen R. Barley. 1984. “Occupational Communities: Cultureand Control in Organizations.” Research in Organizational Behavior 6:287–365.
Weber, Max. 1946. “Class, Status, and Party.” Pp. 180–95 in From Max Weber: Essaysin Sociology, edited by H. H. Gerth and C. Wright Mills. Oxford: Oxford UniversityPress.
Weeden, Kim A. 2002. “Why Do Some Occupations Pay More Than Others? SocialClosure and Earnings Inequality in the United States.” American Journal ofSociology 108 (1): 55–101.
———. 2005. “Occupation Politics or Big Class Politics?” Working paper. CornellUniversity, Department of Sociology.
Weeden, Kim A., and David B. Grusky. 2005. “Are Social Classes Decomposing?”Working paper. Cornell University, Department of Sociology.
———. In press. “Are There Any Big Classes at All?” In The Shape of Social Inequality:Stratification and Ethnicity in Comparative Perspective, edited by David Bills. Vol.22 of Research in Social Stratification and Mobility. Amsterdam: Elsevier.
Wilensky, Harold L. 1966. “Class, Class Consciousness, and American Workers.” Pp.12–44 in Labor in a Changing America, edited by William Haber. New York: Basic.
Wilensky, Harold L., and Jack Ladinsky. 1967. “From Religious Community toOccupational Group: Structural Assimilation among Professors, Lawyers, andEngineers.” American Sociological Review 32 (4): 541–61.
Wright, Erik Olin. 1997. Class Counts: Comparative Studies in Class Analysis.Cambridge: Cambridge University Press.
Wysong, Earl, and Robert Perrucci. 1999. The New Class Society. Lanham: Rowman& Littlefield.
Zablocki, Benjamin J., and Rosabeth Moss Kanter. 1976. “The Differentiation of Life-Styles.” Annual Review of Sociology 2:269–98.