Embed Size (px)
Citation preview
The CAP framework for business process modelling>
Keith Thomas Phalp*
Empirical Software Engineering Research Group, Department of Computing, Bournemouth University, Talbot Campus, Poole House, Wallisdown, Poole,UK
Received 3 June 1996; accepted 5 May 1998
Abstract
Business process modelling is an area of work that is increasingly used in conjunction with software development. For example, manydevelopment methods note the importance of strategic or business modelling, typically as a prerequisite to analysis. In addition, SystemsEngineering for Business Process Change suggests the need to model the business process in maintaining and evolving existing (legacy)systems.
In order to model business processes, one needs to consider what notations are most suitable, and what methods to adopt. However, themost appropriate notation typically depends on a number of contextual issues, the purpose of the modelling, the audience for the models andso on. Furthermore, this context changes with the progress of the modelling. Hence, the modeller needs guidance about appropriateapproaches at different points in the modelling programme.
This paper introduces a framework for business process modelling that provides such guidance without prescribing particular notations.This is achieved by describing business process modelling in terms of three iterative and generic categories or phases: Capture, Analysis andPresentation. The paper shows how different kinds of notational approaches can be used within these categories, discussing the choicesavailable to the modeller. The (CAP) framework is generally applicable, and is illustrated both by a simple theoretical example, and byexamples from industrial business process modelling.q 1998 Elsevier Science B.V. All rights reserved.
Keywords:Business process; Framework; Methods; Enaction; Measurement
1. Business process modelling and software development
Process modelling is an activity that is familiar to manysoftware engineers. Models of software development havebeen proposed in order to understand, guide and control thesoftware process. However, this paper specifically concen-trates on models of business processes, and on describing aframework for developing them. Hence, this first sectionargues why software developers should need to considerbusiness processes and how this may be used to improvethe software development process.
1.1. Software as a business process support system
Software developers are becoming aware of the need tounderstand and model the business processes of their clients,that is the organisations for whom they build software
systems. The business process is of relevance because soft-ware development may be viewed as producing supportsystems for business processes. Some of these business pro-cesses are easily discemed, for example, a Point of Salesystem clearly supports a retail business process. However,many other systems also support processes, which may beviewed as carrying out some business purpose. For example,an Air Traffic Management system supports the work of AirTraffic Controllers (among others) who are in the businessof ensuring the safe conduct of air traffic. Two importantways in which business process modelling has an impact onsoftware development will now be briefly described. Theseare areas in which there are significant research efforts fromboth industria1ists and academics, and which specificallyaddress the modelling of client business processes and itsimpact upon software development.
Strategic modelling is a term used by a number of soft-ware development methods [2]. The term refers to thoseactivities before analysis, which are used to understand,describe and validate business needs and the business con-text for the proposed system. The output from this strategicmodelling may also used within analysis and design. Forexample, role models, a common output of such strategic
0950-5849/98/$ - see front matterq 1998 Elsevier Science B.V. All rights reserved.PII: S0950-5849(98)00058-5
* Tel.: 44 1202 595133; fax: 44 1202 595314; e-mail: [email protected]
>An overview of this framework was presented at the Fifth InternationalConference on Re-Technologies for Information Systems in December 97[11], and the paper presented here shares the same industrial example.
Information and Software Technology 40 (1998) 731–744
INFSOF 3916
modelling, are helpful in identifying candidate objects, andthe likely interactions and dependencies among them. Inaddition, enactable versions of such role models may alsobe used to further experiment with the behaviour of theproposed business process, providing executable specifi-cations of business processes [3]. Hence, business processmodelling aids the software developer, by helping to reducethe problems associated with the e1icitation of systemsrequirements.
Strategic modelling suggests the use of models to under-stand the context for the development of new systems. Afurther use of business modelling is to tackle the problem ofchanging or evolving existing (legacy) systems. Here, theexisting system supports the current business process andthe client intends to make changes to that business process.The hypothesis is that by understanding the relationshipbetween the business process and the legacy system, suchchanges may be better compared, gauged and managed. Forexample, a change that affects only a small part of thebusiness may require changes throughout the supportingsystem. Hence, a number of projects have suggestedmodel1ing the business process and the legacy system andthen constructing a mapping between them [4]. This map-ping is used to see how (and where) proposed businesschanges will have an impact, and ultimately to improvethe evolution of the system.
In summary, business process modelling has an impactnot only upon the client’s business but also upon theprocesses and productivity of software developers. Hence,frameworks are needed which provide support for businessprocess modelling to a variety of audiences who have dif-ferent modelling needs.
2. Business process modelling methods
In considering ‘how to’ model business processes, twoimportant considerations are notation and method. In otherwords, what representation scheme (or schemes) should beused, and how does this fit within a methodological frame-work. This can be seen as essentially the same problem thatsoftware engineers have in carrying out analysis or design.One might choose to use structured analysis notations, alsochoosing some associated method. Hence, this section willfirst discuss notations for process modelling, and then sug-gest some implications for methods.
An important reason for consideration of notation is thatdifferent notations have different capabilities. One cannotmodel the same things using a data flow diagram as a petri-net. Hence, in choosing different approaches, the modelleris (often implicitly) attempting to satisfy different goals. Forexample, pragmatic approaches [5] are mostly concernedwith capturing and understanding processes. Conversely,rigorous paradigms are typically used for analysis of theprocess, [6,7], perhaps including some simulation or experi-mentation with process scenarios [8]. This suggests a need
for different notational approaches, for different modellingpurposes. However, if multiple models are required, then aframework is needed which allows them to be used togetherin some coherent way.
Existing business process modelling methods appear tofall into two camps. High level methods concentrate on thegeneral managerial activities that surround process model-ling [9]. These activities, such as getting proper backing forthe modelling, setting up workshops, and gatheringevidence are clearly important but can be considered asseparate from the modelling activity, and may often becarried out by a separate person or group. Consequentlyhigh-level methods give little consideration to the notationsused for modelling, and little guidance about how themodelling activity is best carried out. In contrast, thosemethods that do consider notations appear to be muchmore prescriptive, suggesting that a particular notationalapproach is superior, without considering the environmentfor the modelling [10].
This paper provides a methodological framework (CAP),which supports modelling activity without prescribing aparticular notational approach. To this end, a general frame-work is described, allowing the modeller to choose appro-priate notations, at different points within the modellingexercise. Modelling is described in terms of three genericphases (or categories), and examples of notations appro-priate for each phase are illustrated.
3. Evolution of the CAP framework
The (CAP) business modelling framework has evolvedfrom experience of applying the kinds of techniques usedwithin the software process to business process modelling[1,11,12]. For example, modelling business processes withformal notations such as Hoare’s [13] CSP [14,15]. Obser-vations from such undertakings can be distilled into anumber of lessons learned.
• Capturing the business process: business users are notprepared to invest time in understanding complex orformal modelling approaches. In order to have mean-ingful dialogue with such users, a readily understand-able, typically diagrammatic notation is required.
• Analysing the business process: formal or executablemodels do allow the modeller to gain a more thoroughunderstanding of the process than can be achieved usingsimple diagrammatic techniques. Furthermore, in order tocarry out process analysis it is necessary for the modellerto have more sophisticated mechanisms than qualitativeanalysis of static diagrammatic models. This paper willdescribe a number of alternative ways to achieve theadded rigour required for process analysis.
• Presenting the business process: even simple diagram-matic notations lead to complex models which users finddifficult to comprehend. The audience for models must
732 K.T. Phalp / Information and Software Technology 40 (1998) 731–744

be considered and approaches chosen that presentrelevant findings in a way that can be more easilyunderstood.
The CAP framework mirrors these observations aboutbusiness process modelling, with three distinct types ofmodel being produced for process ‘Capture’, ‘Analysis’and ‘Presentation’ (Fig. 1).
Initial process descriptions are produced (and validated)using Capture models. These Capture models are then usedas the basis for analysis. Analysis models (and the results ofanalysis) are used to produce models for presentation.Presentation models are used to clarify issues, to highlightareas of further interest, to discuss findings and so on. Use ofthe CAP framework is therefore iterative. Early iterationsfocus on increasing understanding and on producingaccurate descriptions of the existing process. Lateriterations are used to suggest where improvements will bemade, to experiment with different process scenarios and tochoose among alternative process redesigns. Finalised mod-els are then used to provide education about proposedchange, and to provide guidance once the new process isimplemented.
4. The CAP phases and framework
It is important to start the modelling programme by decid-ing what the models will be used for, and what issues theyshould highlight [16]. As with the selection of metrics, agoal-based approach seems appropriate. One could evenconstruct a hierarchy of goals (modelling purposes)questions and notations; similar to the way GQM [17]has a hierarchy of Goals Questions and Metrics. Thismay be rather an elaborate solution to deciding notations,however, and others [5] suggest a simpler goal-basedchecklist approach (GUIDE)2. Whatever selectionmechanism is used, it seems reasonable that choice of nota-tion should take into account the goals and context of themodelling.
This paper suggests that the goals, context and audiencechange for each ‘phase’ of the modelling. Consequently,different notations may be required for each phase, or atleast that the choice of notation needs to be reconsidered.Rather than prescribe specific notations CAP is intended tobe generally applicable, allowing modellers to choose var-ious notations. However, the paper illustrates the kind ofapproaches that are appropriate for each of these modellingphases. An additionial constraint is that the capture andanalysis notations should allow for information from cap-ture to be utilised within analysis, and subsequently withinpresentation. Although there is unlikely to be a completemapping from one phase to the next notations should beselected that can be used in a coherent manner, so thatmeaning is preserved in each transformation. (This issueof mapping will be further discussed in presenting examplesof capture, analysis and presentation models.)
The following sections describe each of the CAP phases.To illustrate these phases, a small artificial business processexample has been chosen. The example, taken from Ould[18], describes the interaction between three roles: a Divi-sional Director; a Project Manager and a Designer; allinvolved in ‘carrying out a design project’. For pedagogicreasons, only a single model of each type is given, thoughfor a genuine business process the application of CAP wouldbe far more iterative. Each category or phase would bevisited many times, and many versions of each type ofmodel would be produced.
4.1. A note about process support environments
A number of authors have extended the idea of enactablemodels in the attempt to build process support environments;and this quest has been an important motivation for muchprocess modelling work [19,20]. The idea has been to modelthe way users work and then to instantiate a model descrip-tion in the environment [21]. This running process descrip-tion allows (and controls) user access to the tools they requireto carry out their work.3 A number of impressive supportenvironments currently exist. For example, both ProcessWeaver [23,24] and SPADE [25] allow the modeller todescribe the process in a diagrammatic form (based uponPetri-nets), and to add detail to this description to supportenaction of the process model within the environment.
Fig. 1. CAP framework involves iteratively capturing, analysing and pre-senting process models.
2 The GUIDE checklist is used in order to specify the Goal, Use, Invest-ment, Deliverables, and Environment for the models. Ideally, goals shouldbe quantified, and questions attached which help to clarify the thinkingbehind the goal. Other categories are intended to clarify thinking aboutwhat would be an appropriate modelling approach. The ‘Use’ categoryaddresses the audience for the models, and how they are to be used. Thisalso has a significant impact upon choice of notation, particularly for pre-sentation. Further categories address the ‘Investment’ for the modellingprogramme (which clearly affect the feasibility of various modelling solu-tions), the ‘Deliverables’, and the ‘Environment’ (which includes theexperiences, attitudes, and aptitudes of those involved or affected).
3 A number of authors now believe that more flexible support may beachieved by using agents [22].
733K.T. Phalp / Information and Software Technology 40 (1998) 731–744
This paper considers the adoption (or otherwise) of suchtools as a special case of the selection of notation, indeed,one may see how modelling context has an impact. Forexample, such tools are a significant investment for anorganisation, and assume a level of control in the instan-tiated process that others argue is inappropriate [26]. Inaddition, for many the use of these tools would be beyondtheir budget, yet they may still improve their processes byusing some simple (low cost) modelling technology.
5. Capture
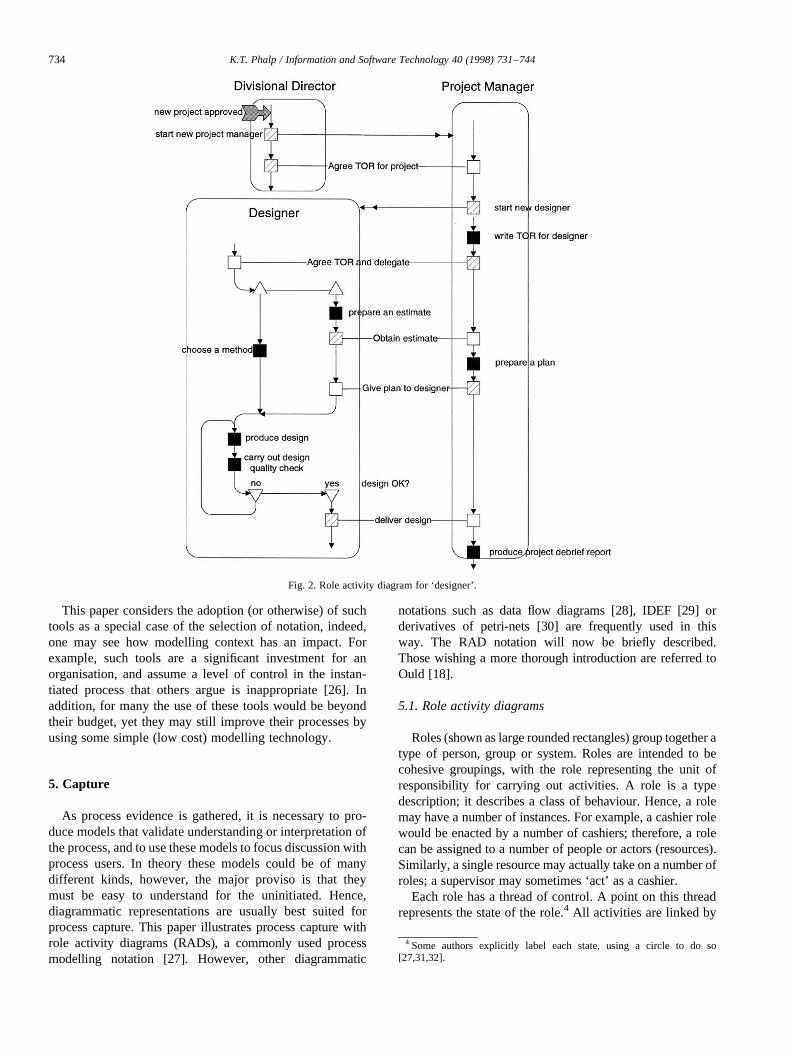
As process evidence is gathered, it is necessary to pro-duce models that validate understanding or interpretation ofthe process, and to use these models to focus discussion withprocess users. In theory these models could be of manydifferent kinds, however, the major proviso is that theymust be easy to understand for the uninitiated. Hence,diagrammatic representations are usually best suited forprocess capture. This paper illustrates process capture withrole activity diagrams (RADs), a commonly used processmodelling notation [27]. However, other diagrammatic
notations such as data flow diagrams [28], IDEF [29] orderivatives of petri-nets [30] are frequently used in thisway. The RAD notation will now be briefly described.Those wishing a more thorough introduction are referred toOuld [18].
5.1. Role activity diagrams
Roles (shown as large rounded rectangles) group together atype of person, group or system. Roles are intended to becohesive groupings, with the role representing the unit ofresponsibility for carrying out activities. A role is a typedescription; it describes a class of behaviour. Hence, a rolemay have a number of instances. For example, a cashier rolewould be enacted by a number of cashiers; therefore, a rolecan be assigned to a number of people or actors (resources).Similarly, a single resource may actually take on a number ofroles; a supervisor may sometimes ‘act’ as a cashier.
Each role has a thread of control. A point on this threadrepresents the state of the role.4 All activities are linked by
4 Some authors explicitly label each state, using a circle to do so[27,31,32].
Fig. 2. Role activity diagram for ‘designer’.
734 K.T. Phalp / Information and Software Technology 40 (1998) 731–744

this thread of control, and all have a ‘before’ and ‘after’state. Activities may be either actions (which are activitiesthat an instance of the role carries out in isolation) or inter-actions (activities which are carried out co-operatively). Anaction is shown as a dark (shaded) square. An interaction isshown as a horizontal line connecting clear (unshaded)squares. This paper adopts the convention of showing theinitiating (or driving) end of an interaction as crosshatched.
In carrying out an action, a role will move from its ‘before’state to its ‘after’ state. The consequence of an interaction isthat all roles involved move from the ‘before’ to the ‘after’state. Roles also have constructs corresponding to alternatechoices (case refinement) and concurrent or parallel activ-ities (part refinement). Concurrent or parallel threads arepreceded by a triangle, whereas alternate paths (threads)are denoted by an inverted triangle.
Fig. 3. Description of the role activity diagram (capture model) of the designer.
5 0 to n where ‘n’ is a natural number.
735K.T. Phalp / Information and Software Technology 40 (1998) 731–744
5.2. The ‘designer’ as a role activity diagram
The role activity diagram in Fig. 2 shows three roles‘Divisional Director’, ‘Project manager’, and ‘Designer’.Fig. 2 has no explicit labelling of states, but the vertical linesbetween actions and interactions implicitly represent states.
The textual description of the designer (Fig. 3) makesreference to these (implicit) states. The reader may choose toignore the details of this description, or the state based infor-mation it contains, since it is not necessary in order to under-stand how Role Activity Diagrams may be used as a capturemodel. It is included since both the analysis and presentationmodelsdescribed in followingsectionscan be mapped directlyfrom the RAD of designer. In particular the enactable presen-tation model makes explicit the states described, using them aspre and post conditions for actions and interactions.
6. Analysis
Analysis frequently requires a degree of rigour not foundin models used to elicit or understand processes (as incapture). This rigour may be gained in a number of ways.
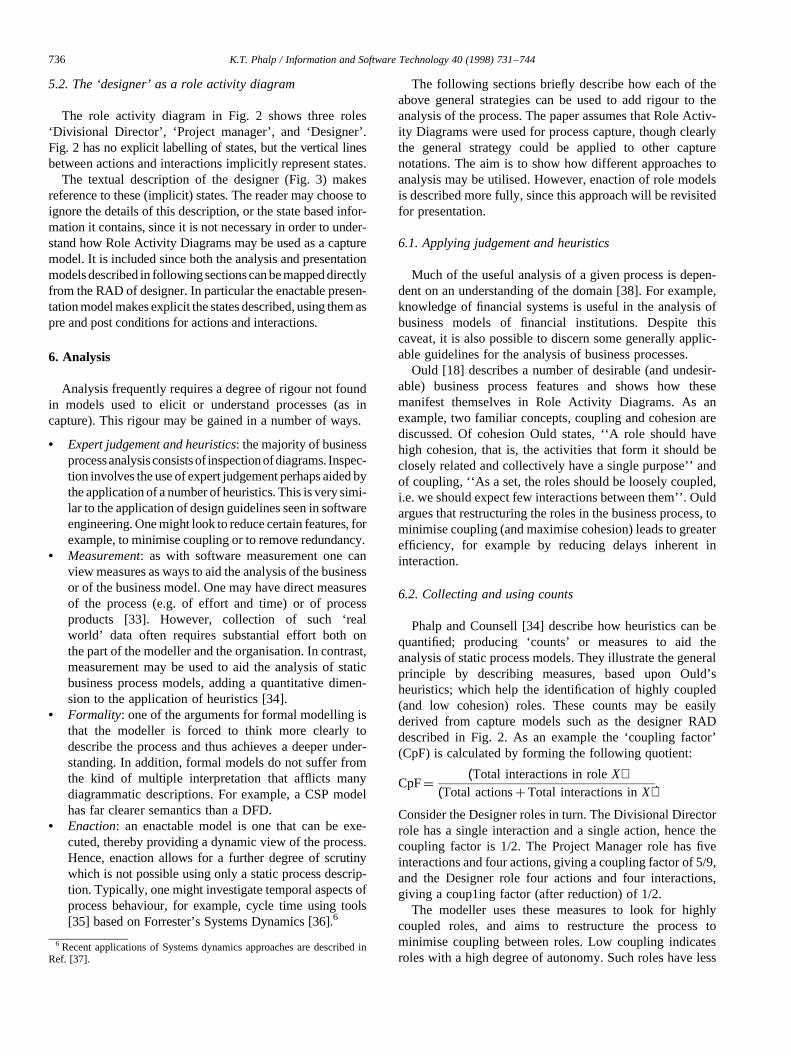
• Expert judgement and heuristics: the majority of businessprocessanalysisconsistsof inspectionofdiagrams. Inspec-tion involves the use of expert judgement perhaps aided bythe application of a number of heuristics. This is very simi-lar to the application of design guidelines seen in softwareengineering. One might look to reduce certain features, forexample, to minimise coupling or to remove redundancy.
• Measurement: as with software measurement one canview measures as ways to aid the analysis of the businessor of the business model. One may have direct measuresof the process (e.g. of effort and time) or of processproducts [33]. However, collection of such ‘realworld’ data often requires substantial effort both onthe part of the modeller and the organisation. In contrast,measurement may be used to aid the analysis of staticbusiness process models, adding a quantitative dimen-sion to the application of heuristics [34].
• Formality: one of the arguments for formal modelling isthat the modeller is forced to think more clearly todescribe the process and thus achieves a deeper under-standing. In addition, formal models do not suffer fromthe kind of multiple interpretation that afflicts manydiagrammatic descriptions. For example, a CSP modelhas far clearer semantics than a DFD.
• Enaction: an enactable model is one that can be exe-cuted, thereby providing a dynamic view of the process.Hence, enaction allows for a further degree of scrutinywhich is not possible using only a static process descrip-tion. Typically, one might investigate temporal aspects ofprocess behaviour, for example, cycle time using tools[35] based on Forrester’s Systems Dynamics [36].6
The following sections briefly describe how each of theabove general strategies can be used to add rigour to theanalysis of the process. The paper assumes that Role Activ-ity Diagrams were used for process capture, though clearlythe general strategy could be applied to other capturenotations. The aim is to show how different approaches toanalysis may be utilised. However, enaction of role modelsis described more fully, since this approach will be revisitedfor presentation.
6.1. Applying judgement and heuristics
Much of the useful analysis of a given process is depen-dent on an understanding of the domain [38]. For example,knowledge of financial systems is useful in the analysis ofbusiness models of financial institutions. Despite thiscaveat, it is also possible to discern some generally applic-able guidelines for the analysis of business processes.
Ould [18] describes a number of desirable (and undesir-able) business process features and shows how thesemanifest themselves in Role Activity Diagrams. As anexample, two familiar concepts, coupling and cohesion arediscussed. Of cohesion Ould states, ‘‘A role should havehigh cohesion, that is, the activities that form it should beclosely related and collectively have a single purpose’’ andof coupling, ‘‘As a set, the roles should be loosely coupled,i.e. we should expect few interactions between them’’. Ouldargues that restructuring the roles in the business process, tominimise coupling (and maximise cohesion) leads to greaterefficiency, for example by reducing delays inherent ininteraction.
6.2. Collecting and using counts
Phalp and Counsell [34] describe how heuristics can bequantified; producing ‘counts’ or measures to aid theanalysis of static process models. They illustrate the generalprinciple by describing measures, based upon Ould’sheuristics; which help the identification of highly coupled(and low cohesion) roles. These counts may be easilyderived from capture models such as the designer RADdescribed in Fig. 2. As an example the ‘coupling factor’(CpF) is calculated by forming the following quotient:
CpF¼(Total interactions in roleX)
(Total actionsþ Total interactions inX):
Consider the Designer roles in turn. The Divisional Directorrole has a single interaction and a single action, hence thecoupling factor is 1/2. The Project Manager role has fiveinteractions and four actions, giving a coupling factor of 5/9,and the Designer role four actions and four interactions,giving a coup1ing factor (after reduction) of 1/2.
The modeller uses these measures to look for highlycoupled roles, and aims to restructure the process tominimise coupling between roles. Low coupling indicatesroles with a high degree of autonomy. Such roles have less
6 Recent applications of Systems dynamics approaches are described inRef. [37].
736 K.T. Phalp / Information and Software Technology 40 (1998) 731–744

interaction (and synchronisation) with other roles and willtypically have less delay in the completion of their tasks.
A discussion of meaningful levels of outliers for rolecoupling is beyond the scope of this paper (see Phalp andCounsell [39]). Indeed, it is unlikely that any definitivelevels would be equally appropriate across all domains,or indeed all organisations within a domain. However,such measures help the modeller gain further insight,and aid identification of areas that need to be restructured.Phalp and Counsell report examination of a fragment of abusiness processes where of 10 roles depicted, eight had acoupling factor of one (i.e. there were only interactions —co-operative activity) and exceptionally of the 30 rolesexamined approximately 90% had a coupling factor greaterthan 4/5. This process exhibited many delays and theauthors described it as ‘‘…highly bureaucratic…wherefew actions could be carried out by roles independently,and where the key actors in the process spent at least 50%of their time in gaining approval for documents’’.
6.3. Formal models
This paper has noted the argument that being forced todescribe something formally forces the modeller to thinkmore clearly. The added rigour of the modelling exercise,coupled with the clear semantics of the formal notationleads to a more accurate and unambiguous description.However, the problems of validating such ‘difficult tounderstand’ models often preclude their use in businessmodelling.
Abeysinghe and Phalp [15] show how role activity dia-grams (as a user-facing notation), can be mapped to Hoare’snotation for communicating sequential processes (CSP)[13]. They argue that this provides the advantages of a sim-ple model for process capture, with the addition of a formalnotation for more rigorous process analysis. Their paperdescribes experience of using CSP to model a variety ofprocesses in this way, revealing an iterative approach toprocess modelling.
‘We have found the RAD to CSP mapping itself to bean iterative process, with the mapping to CSP forcingus to re-think the original depiction of the process inRADS. Indeed, the mapping enables us to makechanges in CSP, then go back and change the RADand to go round such a cycle until we reach a stableand agreed process description. This kind of processis vital to the process modeller. It enhances the under-standing of the process, and adds value to the processmodelling exercise.’
Henderson [40] describes a simple ‘stepper’ whichenables the modeller to ‘step through’ the states in amodel written CSP. Abeysinghe and Phalp show how useof this stepper provides some limited enaction of the formalmodel, but not in a form that is presentable to users. Hence,one strategy for analysis would be to map the capture model
(Role Activity Diagram) to CSP (providing a formaldescription of the process), with some enaction capabilityfor use solely by the modeller. A further example of the useof enaction within process analysis will now be described.
6.4. Enactable models
Enaction increases the rigour of the modelling activity.The modeller must describe the process with sufficientclarity that it is unambiguous to a computer (e.g. for com-pilation); and the experimentation with process behaviourengenders greater understanding. However, the main advan-tage of running a dynamic model is that it allows bothmodellers and representatives of the client organisation toexperiment with (or check) process understanding. Themodel can be tried (or run), problems encountered docu-mented, and the model adjusted or revised until a moresatisfactory process scenario is evolved. Hence, enactionis particularly useful in a presentation role. The main dif-ference in the kind of models suitable for analysis and pre-sentation being the extent to which the models can be madeaccessible to the end-user.
The enactable notation RolEnact will now be described.RolEnact may be used (with different interfaces) for bothanalysis and presentation of business processes, hence itssyntax is discussed here, whilst a simple interface isdescribed in the following section on presentation models.
6.4.1. RolEnact models and syntaxRolEnact syntax is based upon a condition–action para-
digm. Its primitives match those of Role Activity Diagrams,allowing a simple mapping from process capture. In RolE-nact, processes are described in terms of roles, the states ofthese roles, and the actions and interactions in which rolestake part. As with a Role Activity Diagram a description inRolEnact is of a type of behaviour. However, when runningan Enact scenario the modelling engine invokes instances ofroles, each which will then behave according to that general(type) description. By observing how these role instancesact when running in parallel and how they influence eachother, the user of the model is able to gain a thorough insightinto the process.
In brief, the syntax describes the creation of a new role, orthe invocation of an activity (action or interaction). The beha-viour of the process is dependent upon the rules (pre and poststates) of these activities. The general form of syntax for anactivity is as follows (keywords shown in bold):
Activity Role1.Activity
Me(before1 → after1)
Role2(before2 → after2)
. . .RoleN(beforen → aftern)
End
The driving role (Role1) moves from a before state to anafter state, as do any other roles involved in the activity. All
737K.T. Phalp / Information and Software Technology 40 (1998) 731–744

of the ro1es involved (Role2 to RoleN) must be in therequired ‘before’ state for the activity to be able to takeplace, and all move to their described ‘after’ state as a result.
This general form can be seen in the syntax for a two-roleinteraction.
Interaction Role1.Interaction
Me(before1 → after1)
Role2(before2 → after2)
End
A simple interaction, taken from the example process, isas follows:
Interaction Divisional_Director.agree_TOR
Me(manager_started → initial)
Project_Manager (initial → agreed_TOR)
End
Actions are a special case where only a single role isinvolved. The syntax for an action is:
Action Role.Action
Me(before → after)
End
A simple action, again from the example process, is:
Action Project_Manager.prepare_a_plan
Me(estimate_received → plan_prepared)
End
A full description of RolEnact and its syntax is given in arelated paper [3]. For the purposes of this paper, it is sufficientto see RolEnact as an example of a modelling notation, whichmay be used either for process analysis, or presentation orboth. A further (industrial) example will show a larger scaleversion of a presentation model that utilised RolEnact.
7. Presentation models
Presentation is used to highlight pertinent findings fromprocess analysis, and to suggest where changes should bemade. Presentation models are used to present processscenarios to end-users, to validate new (or desired)behaviour and to choose among altematives. Finally, pre-sentation models are used to educate process users aboutchange, before, and during implementation of the new pro-cess. As with capture, the presentation model is user facing,and understandability is of importance. However, the needto illustrate findings from (these often complex) analysesrequires further capability.
The following section concentrates on the use of enact-able models in presentation, and specifically RolEnact. Itshould be clear, however, that such models are often usedin conjunction with other, typically static, models. Forexample, one might describe the overall process with aRAD, and use RolEnact to highlight particular issues orconcems. Indeed, this is a strategy familiar to the author,
and the industrial example that follows used both static andenactable models to describe different aspects of the processto the client organisation.
7.1. RolEnact models
A dynamic scenario in RolEnact takes the form of a set ofwindows, where each window represents an instance of arole in the process, and where each of these role windowsacts as a separate Windows program. Each role instanceruns in parallel and communicates with other roles via aWindows DLL (see Refs. [3,41]). The separate windowsare each instances of a generic Windows program. Eachtime a role instance is created this program is parameterisedby information from the RolEnact description. The ro1einstance then acts according to the rules described for itsparticular role type.
It should be clear that the description of the process isseparate from the interface. Each RolEnact description iskept in a text file, which may then be changed withoutaltering the implementation of Role instances. Hence, it isvery easy to make changes or to run a different scenario byloading a different file.
A further consequence of this approach is that it is alsoextremely easy to change the interface of the model. Anumber of different RolEnact interfaces have been used topresent models to business users. The most common form ofinterface (of which again there are a number of slight varia-tions) is now described. This ‘raw’ interface has been foundto be acceptable to many (though not all) business users, andwas the most commonly used by a number of process mod-elling projects based at the University of Southampton[4,42,43]. This ‘raw’ interface has also been used by theauthor in teaching modelling to students (at BournemouthUniversity) and process modelling to industrial audiences.Where RolEnact is used primarily for analysis, again thissimple form of interface is prevalent.
7.2. The designer in RolEnact
Returning to the example process, the first role to be cre-ated would be the Divisional_Director. In the ‘raw’ RolEnactinterface, an instance of the role appears as shown in Fig. 4.
Each role may have a number of instances at any onetime. Each instance of the role is launched by the user andrepresented by a window. Hence, there may be any numberof instances of the role Divisional Director, or any otherrole, in any given scenario.
From Fig. 4, it can be seen that each role instance(window) consists of:
• The Role Instance name: This is the name of the roletype followed by an integer. The integer is the number ofroles of that type already launched in the currentscenario. Hence, the default7 numbering scheme is 0
738 K.T. Phalp / Information and Software Technology 40 (1998) 731–744

to n, where the first instance launched is roletype0, thenext roletype1 and so on (see Fig. 4). This allows formultiple instances of the same role type in the scenario.
• A state bar: which displays the current state of the roleinstance. All roles being launched in an ‘initial’ defaultstate.
• A ‘do’ button. This invokes a chosen event. If the eventis not enabled (available) then no action is taken. The‘do’ button can be ignored completely, and the user maydouble-click on events to invoke them.
• A list of all of the possible events that the role mayperform. Since events are governed by preconditionsthat take into account the state of the role, and otherco-operating roles, some events may never becomeavailable within any given running of a scenario.X When no events are available within a role instance,
then the role instance window is said to be inactive.The list of events is greyed out, to show that none ofthem can currently be invoked.
• Enabled actions: indicated by an arrow on the adjacentright of the entry in the list.
The list of events can be seen as similar to the idea of analphabet in CSP. It comprises all of the possible events(actions or interactions) which the role may take part in.The events, which are available, depend on the state ofthe running scenario (or system). This allows users toexperiment with a dynamic model showing how roleinstances co-operate with and affect each other.
Consider four8 role instances acting as described in the‘Designer’ example (Fig. 5). The possible events at thispoint are ‘choose a method’, an action of the designer;and ‘prepare_estimate’, an action of the Designer Estimator.The Project Manager is in a waiting state; its state bar is
white and its list of actions disabled. In addition, the Divi-sional Director may create a new project manager instance(currently highlighted by the user).
Suppose the user wishes to invoke an event, e.g., toprepare an estimate. A single click selects (and highlights)the action which may be invoked either with the ‘do’ buttonor with a double-click. The (enabled) action is thencarried out, and RolEnact updates the states and list ofenabled actions in all role-instances. For ‘prepare estimate’(an action) only the state of the Designer Estimator wouldchange. However, consequent1y, it would be possible tointeract with the Project Manager. Hence, the statechanges of both actions and interactions determine thoseavailable next. The user chooses available states andcontinues in this way, experimenting with the processbehaviour.
8. CAP applied to an industrial process
The scenarios above have all been produced by iteratingaround a number of cycles of production of static models,experimenting with process scenarios, revisiting staticmode1s and so on. The scale of the models presented thusfar is deliberately small, in order to present understandableexarnples. However, large complex and real businessprocesses have been modelled using the method described.
Fig. 4. A RolEnact: role instance window.
7 This has been found to be confusing for users, therefore, new imple-mentations of RolEnact will number role instances from 1 ton.
8 Note that parallel threads in a role activity diagram are represented by aseparate role. Hence, the parallel threads in the designer role activity dia-gram are shown as two separate role instances, Designer_Estimator andDesigner. For a full discussion of this mechanism for describing parallelthreads the reader is referred to Ref. [3]. Fig. 5. Co-operating role instance windows in a RolEnact scenario.
739K.T. Phalp / Information and Software Technology 40 (1998) 731–744
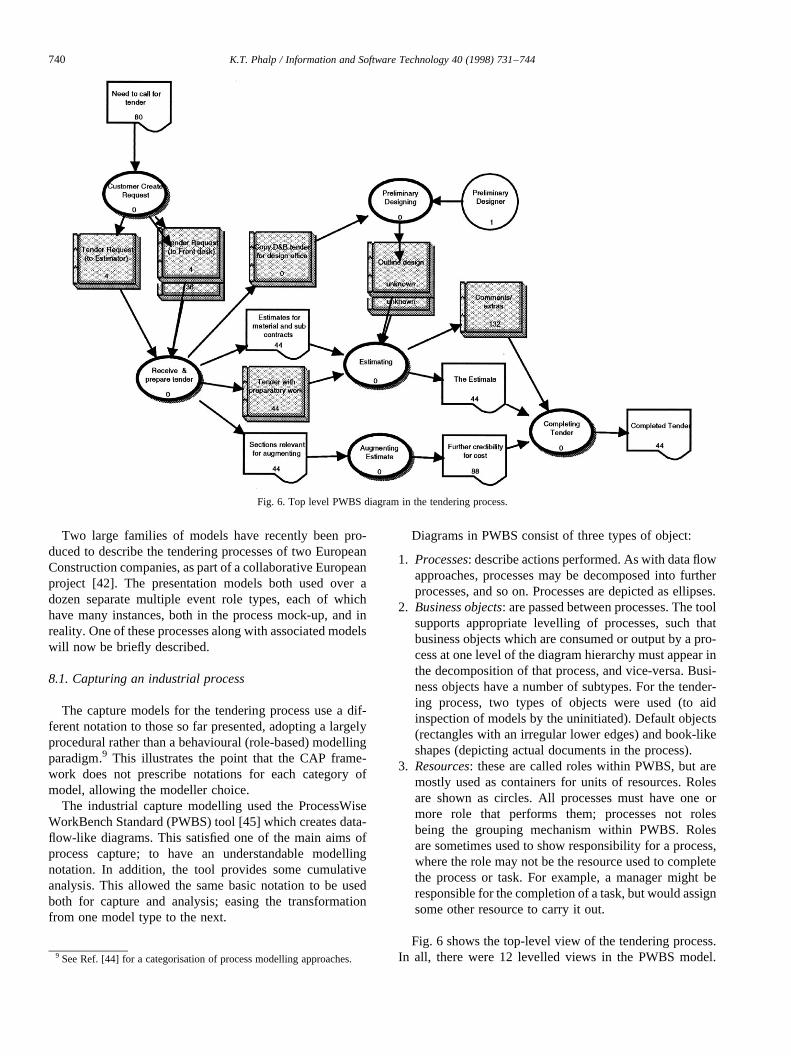
Two large families of models have recently been pro-duced to describe the tendering processes of two EuropeanConstruction companies, as part of a collaborative Europeanproject [42]. The presentation models both used over adozen separate multiple event role types, each of whichhave many instances, both in the process mock-up, and inreality. One of these processes along with associated modelswill now be briefly described.
8.1. Capturing an industrial process
The capture models for the tendering process use a dif-ferent notation to those so far presented, adopting a largelyprocedural rather than a behavioural (role-based) modellingparadigm.9 This illustrates the point that the CAP frame-work does not prescribe notations for each category ofmodel, allowing the modeller choice.
The industrial capture modelling used the ProcessWiseWorkBench Standard (PWBS) tool [45] which creates data-flow-like diagrams. This satisfied one of the main aims ofprocess capture; to have an understandable modellingnotation. In addition, the tool provides some cumulativeanalysis. This allowed the same basic notation to be usedboth for capture and analysis; easing the transformationfrom one model type to the next.
Diagrams in PWBS consist of three types of object:
1. Processes: describe actions performed. As with data flowapproaches, processes may be decomposed into furtherprocesses, and so on. Processes are depicted as ellipses.
2. Business objects: are passed between processes. The toolsupports appropriate levelling of processes, such thatbusiness objects which are consumed or output by a pro-cess at one level of the diagram hierarchy must appear inthe decomposition of that process, and vice-versa. Busi-ness objects have a number of subtypes. For the tender-ing process, two types of objects were used (to aidinspection of models by the uninitiated). Default objects(rectangles with an irregular lower edges) and book-likeshapes (depicting actual documents in the process).
3. Resources: these are called roles within PWBS, but aremostly used as containers for units of resources. Rolesare shown as circles. All processes must have one ormore role that performs them; processes not rolesbeing the grouping mechanism within PWBS. Rolesare sometimes used to show responsibility for a process,where the role may not be the resource used to completethe process or task. For example, a manager might beresponsible for the completion of a task, but would assignsome other resource to carry it out.
Fig. 6 shows the top-level view of the tendering process.In all, there were 12 levelled views in the PWBS model.9 See Ref. [44] for a categorisation of process modelling approaches.
Fig. 6. Top level PWBS diagram in the tendering process.
740 K.T. Phalp / Information and Software Technology 40 (1998) 731–744
Processes that are decomposed (expanded) in another vieware shown with a heavy outline.
8.2. Analysing an industrial process
The PWBS tool used for process capture also has a num-ber of analysis options. A description of these options isoutside the scope of this paper. However, in brief fourmain types of analysis may be carried out.
1. Volume analysis: enables the user to see how input busi-ness move through the process.
2. Resource analysis: is used to calculate the amount ofresource (staff) required for each role performing anactivity. Resource analysis requires information abouttotal volume for an activity, the time the activity takesto process a unit of volume (worktime) and the units ofeffort this will require from the supporting role.
3. Cost analysis: is used to calculate monetary costs foractivities, based on volumes, worktimes, and costs perworktime.
4. Elapsed time: calculates cumulative duration at eachpoint in the process.
For the tendering process, obtaining figures needed forthese kinds of analyses required considerable effort on thepart of the modellers, and extensive co-operation with theorganisation concerned. The main analysis effort was drivenby the needs of the organisation (resource levels were fairlyfixed) and focused upon volume, costs and time. In addition,it was found that it was necessary to manipulate the model in
order to gain the analyses required by the organisation, sincethe tool was highly constrained in the kind of calculations itallowed. This lack of flexibility (which would not be foundin say a spreadsheet) was to some extent compensated by theease of mapping from capture to analysis. However, a majorconcern was that the detail shown in the model often hidrather than highlighted analysis results, particularly thoserelated to costs (a theme that will be further discussed indescribing presentation of findings).
8.3. Presenting an industrial process
8.3.1. Presentation of sequencingDuring meetings with representatives of the organisation,
it became clear that there was a need to clarify and examinesequencing issues. RolEnact models were produced specifi-cally to address this need. These models were used primarilyin a presentation mode; as a vehicle for discussion and argu-ment about both the current and proposed process behaviour.
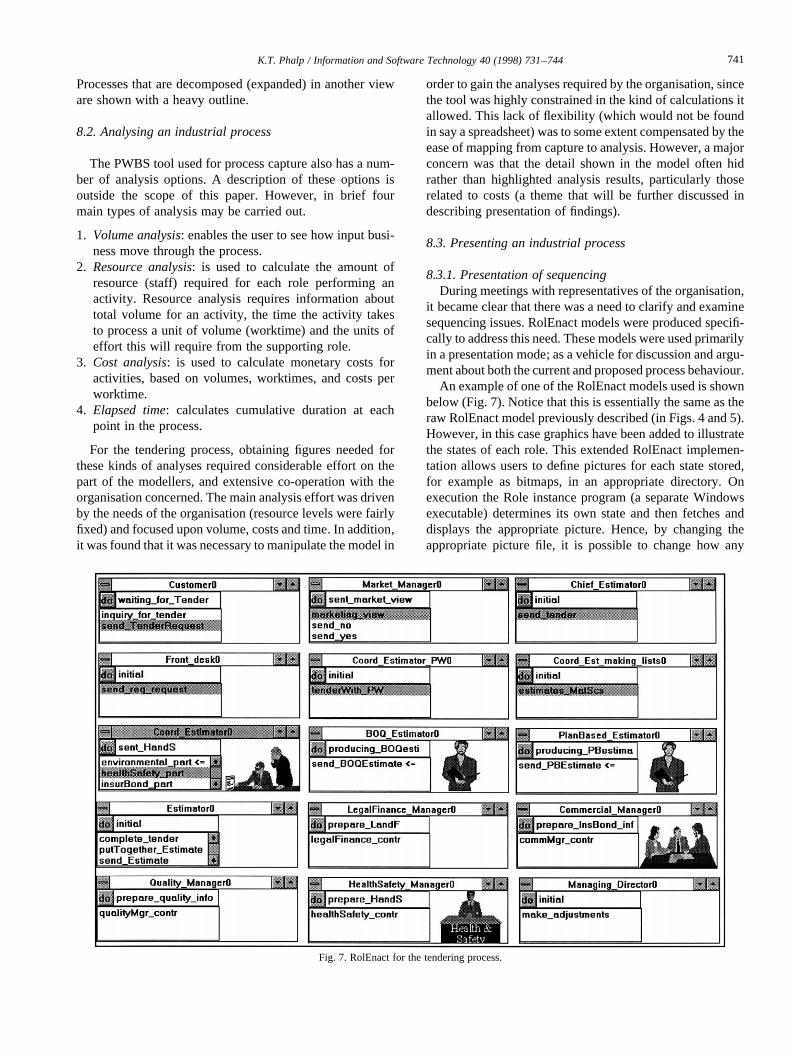
An example of one of the RolEnact models used is shownbelow (Fig. 7). Notice that this is essentially the same as theraw RolEnact model previously described (in Figs. 4 and 5).However, in this case graphics have been added to illustratethe states of each role. This extended RolEnact implemen-tation allows users to define pictures for each state stored,for example as bitmaps, in an appropriate directory. Onexecution the Role instance program (a separate Windowsexecutable) determines its own state and then fetches anddisplays the appropriate picture. Hence, by changing theappropriate picture file, it is possible to change how any
Fig. 7. RolEnact for the tendering process.
741K.T. Phalp / Information and Software Technology 40 (1998) 731–744

state is depicted, without needing to change the RolEnactdescription.
Representatives of the organisation found that this imple-mentation change made it easier for them to see statechanges, and to understand how for each different statethere would be a number of possible activities, determinedby the states of other roles. The most useful consequence ofthe RolEnact modelling was that it identified a number ofareas of misunderstanding, which led to further processchanges. This is because the RolEnact models explicitlyand dynamically showed those sequencing issues thatwere only implicit in capture and analysis models. Althougha number of personnel had agreed that PWBS models werean accurate depiction of their process, they had been inter-preting the models differently.
This illustrates how different approaches highlight differ-ent aspects of the process. For the tendering process, RolE-nact was used to highlight sequencing issues. However, afurther notation (POSD) was necessary in order to illustratefindings related to cost.
8.3.1.1. A note about interfaces and presentation.The use of RolEnact, with the addition of pictures to
represent states, reveals how simple changes to aninterface may have a significant impact upon users.Clearly, a discussion of human–computer interaction isbeyond the scope of this paper. However, changes to theinterface can be viewed as another example of the need toconsider the audience for each model; an essential reasonfor the adoption of the framework described.
8.3.2. Presentation of structure and findingsThe main reason for differentiating presentation models
from those used in analysis and capture is that conventionalmodels are hard to present to process users. Even withmodels like PWBS, which are relatively simp1e andwhich can be structured by hierarchical decomposition,users find that models quickly become too difficult to com-prehend. Hence, the overall process architecture, or processfindings cannot be easily discemed. In order to alleviate thiscomprehension problem, the PROCESS project (and otherassociated projects CORE and GISIP) have used a notationspecifically designed for presentation; Process OrientedSsystem Description (POSD) [46].
8.3.2.1. POSD notation.A significant advantage of using POSD is that it helps to
alleviate a phenomenon known as ‘wire syndrome’. Thisphenomena was first discussed in electronics whereprocessing units could be decomposed into otherprocessing units but where the number of connectionswould remain high. It may also be seen in other modellingapproaches, which allow only for decomposition of oneprimitive, typically process. Hence, high level diagramsoften consist of small numbers of processes with largenumbers of flows obscuring the overall structure.
Having mechanisms to guide the reader through complexmodels is not unique to software engineering. For example,in object oriented analysis [47] ‘subjects’ are used to grouptogether objects and classes into logical units. However,whereas subjects may either include or overlap with othersubjects POSD has a simple mechanism (called a ‘promise’) todescribe the interaction or inclusion of other behaviours. ThePOSD notation is described in Henderson and Pratten [46], andits use in process modelling in Abeysinghe et al. [48]. Thereader is referred to these papers for a full explanation ofPOSD; however, a brief description now follows.
POSD utilises a single primitive; called a ‘behaviour’. Aswith subjects, behaviours (typically represented as rectan-gles) may sometimes completely include other behaviours.Where behaviours overlap they are shown as touching, andthe shared details are not shown. Touching behaviours indi-cate a ‘promise’ that the shared behaviour will be describedsomewhere further down the model hierarchy. Often theshared behaviour includes simple interaction or informa-tion, but it may sometimes be a complex process in itsown right. For example, if the interaction were via electro-nic mail, then it is not necessary to describe the workings ofthe mail system to understand the high-level process. How-ever, if models were later to be used to move towards build-ing a support system then it might be necessary to describeaspects of this mechanism. Hence, a number of views of thesystem are possible, again depending on the purpose of themodel.
By moving unnecessary detail to lower levels the overallprocess structure may be more easily discerned (and thewire syndrome alleviated). In addition, behaviours mayalso be decomposed into other notations, as long as ‘pro-mises are kept’. Hence, a high level POSD picture of theprocess may include lower level detail in other notations, forexample, in the analysis notation from which it was derived.
8.3.2.2. Using POSD in the presentation of industrialprocesses
A mild example of wire syndrome can be seen in thePWBS model taken from the tendering process (Fig. 6).
Fig. 8. Top level POSD model of the tendering process.
742 K.T. Phalp / Information and Software Technology 40 (1998) 731–744

Note how the following POSD representation of the sametop-level process is far easier to understand (Fig. 8). All ofthe details of the interactions are still described, but havebeen moved down the model hierarchy.
In addition, numbers representing costs have been addedto the model. This allowed representatives of the organisa-tion to quickly discern not only the overall structure of theprocess but also the relative costs of each major component.
This increased ‘ease of use’ of POSD models led to a farmore productive relationship between the modeller and theend-users. Moreover as a general point it shows that what toa modeller may seem a trivial difference (both models offeressentially the same description) can have a significantinfluence. Hence, consideration must be given to the audi-ence for the modelling.10 Such consideration is made expli-cit by the categorisation described in this paper.
9. Conclusions
This paper has described ways in which business processmodelling has an impact on the efficiency of the softwaredevelopment process. The paper further argues that thechoice of notation has an impact on the efficiency of thisbusiness process modelling. Hence, that the modeller needsguidance as to suitable notations or approaches to adopt.
However, current methods either do not consider nota-tion, or they prescribe a particular approach, denying choiceto the modeller. This paper argues that different processmodelling notations are suitable, depending on the contextof the business modelling, its purpose and its progress.Notably, that not only the goals of the modelling but alsothe audience for the models should influence the choice ofnotation. Further, that these goals and audiences vary atdifferent stages (or phases) of the modelling programme.Three distinct modelling phases: Capture, Analysis andPresentation are described, and this forms the basis of aframework for business modelling; (CAP).
Different notations may be used within each CAP phase,but the paper suggests why those with certain characteristicsmay be most beneficial, and gives examples. A simple pro-cess example is used to illustrate the CAP framework,choices at each phase are illustrated and the problems ofmapping between phases are discussed. An industrial busi-ness process example is also described, showing how theframework is applicable to the larger scale.
By using the CAP framework, the business modeller isguided without being forced into a particular notationalapproach. This allows the modeller to target the modelling,within each phase, such that it more closely matches thegoals and experience of the client organisation. Hence, busi-ness process models will be produced which accurately
represent the client’s environment and needs, ultimatelyleading to greater efficiency in the production of the soft-ware that supports their business processes.
References
[1] G. Abeysinghe, P. Henderson, K. Phalp, R. Walters, An audiencecentred approach to modelling for business processes, FifthInternational Conference on Re-technologies for InformationSystems: RETIS97 Klagenfurt, Austria, OCG Schriftenreihe, 1997.
[2] E. Yourdon, Object-oriented systems design: an integrated approach,Prentice Hall, New York, 1994.
[3] K.T. Phalp, RolEnact: role based enactable models of business pro-cesses, Information and Software Technology 40(3) (1998) 123–133.
[4] PROCESS, modelling and mapping the business process, EPSRCproject, home page at: http://www.ecs.soton.ac.uk/,kp/process.html.
[5] K. Phalp, M. Shepperd, A pragmatic approach to process modelling,Proceedings of the Third European Workshop on Software ProcessTechnology, 1994, Vilard de Lans, near Grenoble, France. Springer,Berlin.
[6] J. Sa, B.C. Warboys, Modelling processes using a stepwise refinementtechnique, Proceedings of the Third European Workshop on SoftwareProcess Technology, 1994, Vilard de Lans, near Grenoble, France.Springer, Berlin.
[7] J.Y. Chen, C.M. Tu, An Ada-like software process language, Journalof Systems and Software 27 (1) (1994) 17–25.
[8] G. Hansen, Simulating software development processes, ComputerJan (1996).
[9] C. Coulson-Thomas, Business process re-engineering: myth and rea-lity. Kogan Page, London, 1994.
[10] T. Huckvale, M. McHugh, C. Roberts, Process Modelling Workshopfor the BCS Bristol Branch. Bristol University, Praxis Systems plc,1993.
[11] W. Scacchi, Business processes can be software too, Proceedings ofthe Third International Conference on the Software Process, 1994,Reston, Virginia. lEEE Computer Society Press, New York.
[12] P. Henderson, P. Software processes are business processes too, ThirdInternational Conference on the software-process, 1994. Reston,Virginia. IEEE Computer Society Press, New York.
[13] C.A.R. Hoare, Communicating Sequential Processes, Prentice-Hall,New York, 1985.
[14] M. Greenwood, A declarative approach to process modelling, IOP-ENER 1 (5) (1992) 7–8.
[15] G.A. Abeysinghe, K.T. Phalp, Combining process modellingmethods, Information and Software Technology 39 (2) (1997) 107–124.
[16] G. Tate, Software process modelling and metrics: a CASE study,Information and Software Technology, Software Process Modellingin Practice 35 (617) (1993) 323–330. Special Issue.
[17] V.R. Basili, H.D. Rombach. Tailoring the software process to projectgoals and environments, Proceedings of the 9th International Confer-ence on Software Engineering, Monterey, 1987.
[18] M.A. Ould, Business Processes: Modelling and Analysis for Reengi-neering and Improvement. Wiley, New York, 1995.
[19] R.A. Snowdon, A brief overview of the IPSE2.5 project, Ada User 9(4) (1988) 156–161.
[20] B. Warboys, The IPSE 2.5 project process modelling as the basisfor a support environment, in: N. Madhavji, W. Schafer, H.Weber (Eds), Proceedings of the First International Conferenceon System Development Environments and Factories. Pitman, London,1989.
[21] R.A. Snowdon, Tutorial: software process modelling, technicalaspects. Software Process Modelling in Practice. Kensington TownHall Conference Centre, London. Butterworth-Heineman, Oxford,1993.
10 The modeller may well decide to choose to present findings in a complexnotation, perhaps the same as was used for analysis, as long as this isappropriate for use with the end-users or representatives of the organisation(the audience).
743K.T. Phalp / Information and Software Technology 40 (1998) 731–744

[22] R.A. Snowdon, Active models and process support. Proceedings of theFifth European Workshop on Software Process Technology,EWSPT96, 1996. Lecture Notes in Computer Science 1149, Springer,Berlin.
[23] C. Fernstrom, Process centred environments, software process model-ling in practice, Kensington Town Hall Conference Centre, London.Butterworth-Heineman, Oxford, 1993.
[24] C. Fernstrom, PROCESS WEAVER: adding process support to Unix.Proceedings of the Second International Conference on the SoftwareProcess, Berlin, 1993.
[25] S. Bandinelli, M. Braga, A. Fiegetta, L. Lauerzza, The Architecture ofthe SPADE-1 Process Centred SEE, Proceedings of the Third Eur-opean Workshop on Software Process Technology. Vilard de Lans,near Grenoble, France. Springer, Berlin, 1994..
[26] M.M. Uhman, Some reservations on software process programming,Proceedings of the 4th International Software Process Workshop,1988. Moretonhampstead, Devon. ACM Press.
[27] D. Miers, Use of tools and technology within a BPR initiative, in:C. Coulson-Thomas (Ed.), Business Process Re-engineering: Mythand Reality, Kogan Page, London, 1994.
[28] E. Yourdon, Modern Structured Analysis, Prentice-Hall, New York,1989.
[29] W.E. Hefley, The cobbler’s children: applying total quality manage-ment to business process improvement, information engineering andsoftware engineering, ACM SIGSOFT Software Engineering Notes18 (4) (1993) 19–25.
[30] S. Bandinelli, E. Di Nitto, A. Fuggetta, Supporting cooperation in theSPADE4 environment, IEEE Transactions on Software Engineering22 (12) (1996) 841–865.
[31] C. Roberts, Modelling and co-ordinating change in business pro-cesses. Process Modelling Workshop for the BCS Bristol Branch,1993. Bristol University, Co-ordination Systems Limited.
[32] Co-ordination, RADitor version 1.5: Users Manual. Co-ordinationSystems, 1994.
[33] M. Shepperd, Products, processes and metrics, Information and Soft-ware Technology 34 (10) (1992) 674–680.
[34] K.T. Phalp, S.J. Counsell, Counts and heuristics for the analysis of
static models, Proceedings of the ICSE’97 Workshop on ProcessModelling and Empirical Studies of Software Engineering, Boston,1997.
[35] HPS, Stella, High Performance Systems, 1996.[36] J. Forrester, Industrial Dynamics, MIT Press, Massachusetts, 1961.[37] A.G. Rodrigues, T.M. Williams, System dynamics in software project
management: towards the development of a formal integrated frame-work, European Journal of Information Systems 6 (1997) 51–66.
[38] T. Rodden, V. King, J. Hughes, I. Sommerville, Process modellingand development practice, Proceedings of the Third European Work-shop on Software Process Technology, 1994. Vilard de Lans, nearGrenoble, France. Springer, Berlin.
[39] K.T. Phalp, S.J. Counsell, Using counts and heuristics for the analysisof static models, 1998. Available at http:www.xanadu.boumemouth.a-c.uk/staff/kphalp/usechasm.html.
[40] P. Henderson, The CSP Stepper in Enact — an Executable Specifi-cation, 1992. Available as an ftp source from ftp.ecs.soton.ac.uk inpub/peter/various/csp.ps.
[41] P. Henderson, Modelling Process Support in Enact, 1995. Available athttp://dsse.ecs.soton.ac.uk/,ph/cv.html.
[42] CORE, CORE: COnstruction Companies Process ReEngineering,1997. Project home page at http://iwi.uni-sb.de/forschungprojekte/core/core-e.html.
[43] GISIP, Geographical Information Systems Integration Process, 1996.Project home page at http://dsse.ecs.soton.ac.uk/,kp/gisip.html.
[44] B. Curtis, M.I. Kellner, J. Over, Process modelling, Communicationsof the ACM 35 (9) (1992) 75–90.
[45] ICL, Process Wise Workbench: Version 5.4 Users Guide, Inter-national Computers Limited, 1995 .
[46] P. Henderson, G. Pratten, P0SD: a notation for presenting complexsystems of spare processes. First lEEE International Conference onEngineering Complex Systems, IEEE Computer Society Press, 1995.
[47] P. Coad, E. Yourdon, Object Oriented Analysis. Prentice Hall, HemelHempstead, 1990.
[48] G. Abeysinghe, et al., Presentation of Business Process Models usingProcess oriented Systems Description, 1997. Available at http://www.xanadu.bournemouth.ac.uk/staff/kphalp/posd.html.
744 K.T. Phalp / Information and Software Technology 40 (1998) 731–744