Embed Size (px)
Citation preview

Canadian Securities Institute
The Canadian Financial Wealth Market: Adapting to Changing Household Priorities
Goshka Folda June 20, 2013
Anchoring the Discussion about the Future of Advice-giving
1
Consumers
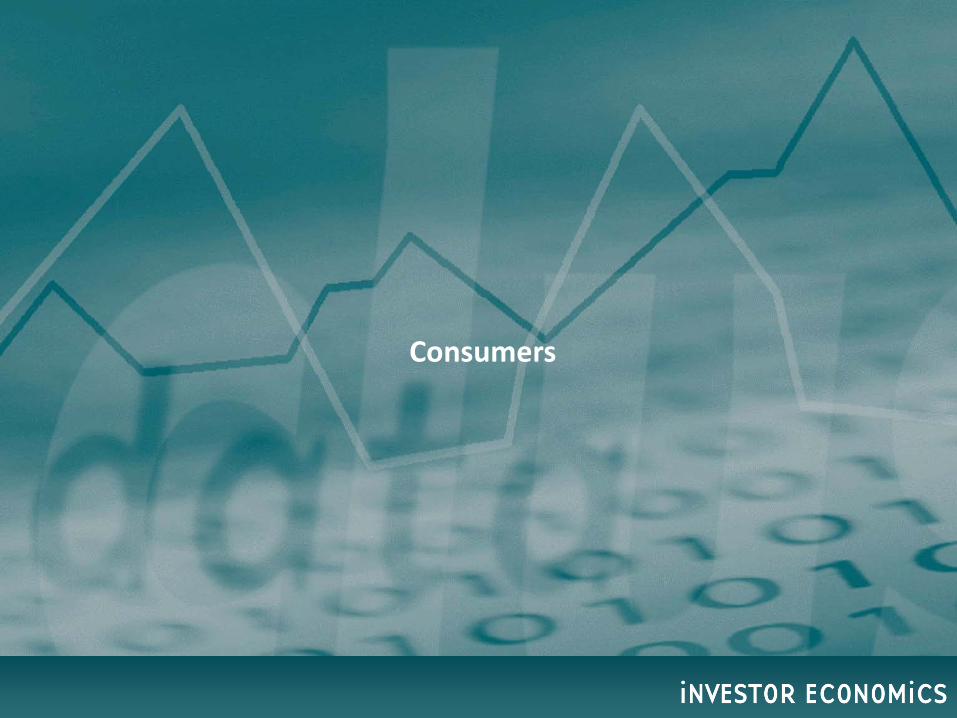
Absolute Growth Opportunity Vast but Pace of Expansion Slows Down In billions of dollars
2012 2012-2022
CAGR
Total assets
Financial wealth
Residential real estate
Credit
$9,871
$3,118
$3,464
$1,744
Source: Household Balance Sheet Report, 2013 Edition.
3
2022
$14,059
$5,449
$4,225
$2050
Assets
3.6%
5.7%
1.6%
2.0%
Total assets
Financial wealth
Residential real estate
Credit
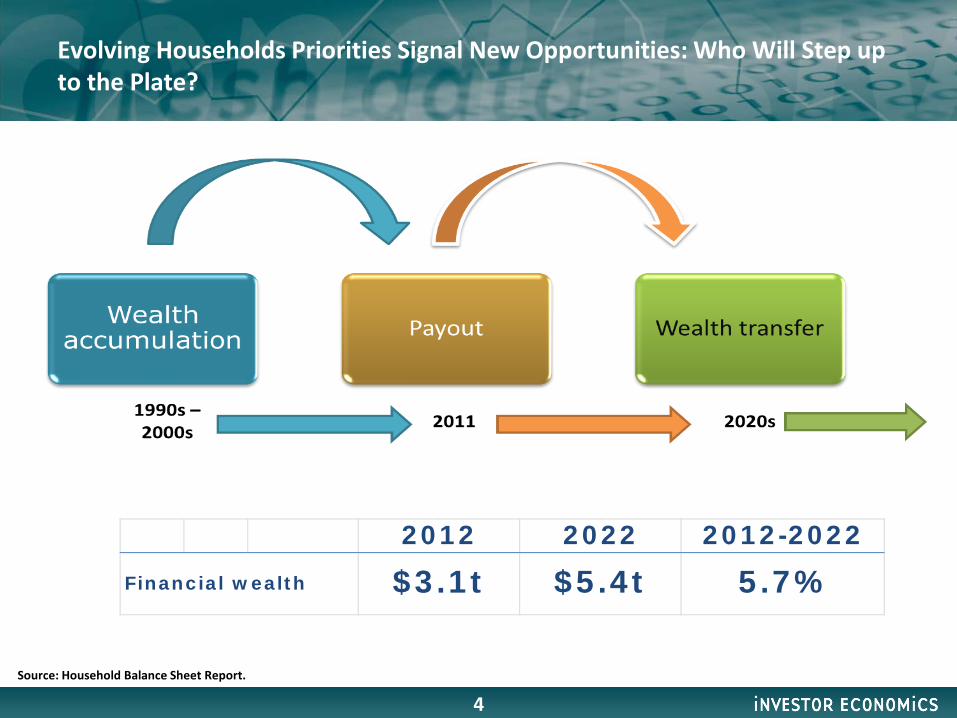
Evolving Households Priorities Signal New Opportunities: Who Will Step up to the Plate?
4 Source: Household Balance Sheet Report.
Financ ia l w ea lt h
2 0 1 2 2 0 2 2 2 0 1 2 -2 0 2 2
$3 .1 t $5 .4 t 5 .7%
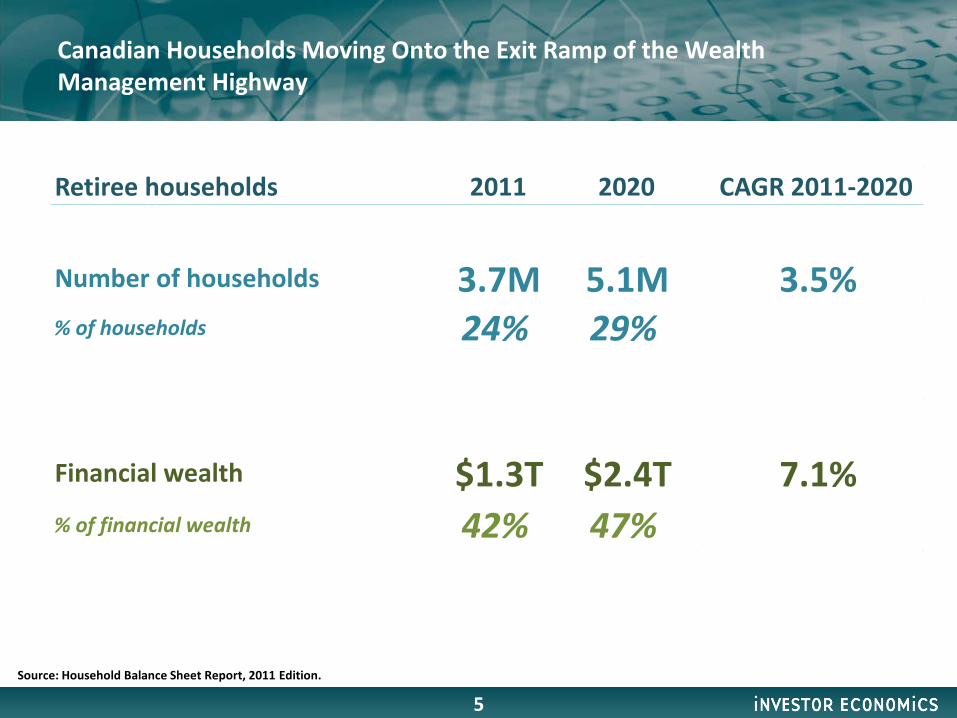
Canadian Households Moving Onto the Exit Ramp of the Wealth Management Highway
5 Source: Household Balance Sheet Report, 2011 Edition.
Retiree households 2011 2020 CAGR 2011-2020
Number of households 3.7M 5.1M 3.5% % of households 24% 29%
Financial wealth $1.3T $2.4T 7.1% % of financial wealth 42% 47%
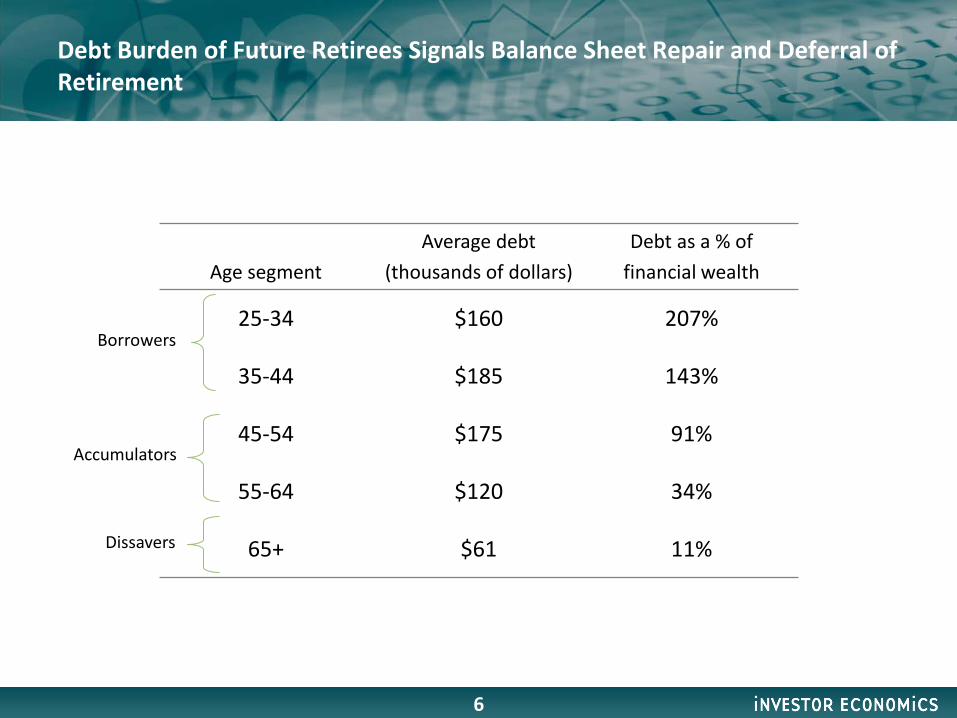
Debt Burden of Future Retirees Signals Balance Sheet Repair and Deferral of Retirement
Age segment Average debt
(thousands of dollars) Debt as a % of
financial wealth
25-34 $160 207%
35-44 $185 143%
45-54 $175 91%
55-64 $120 34%
65+ $61 11%
Borrowers
Accumulators
Dissavers
6

Households and Financial Wealth Assets by Asset Threshold Number of households in thousands, assets in billions of dollars
Households Assets
Mass market
Mid- market
Upscale market
Affluent market
7
Average financial wealth per household $195⇒$300K
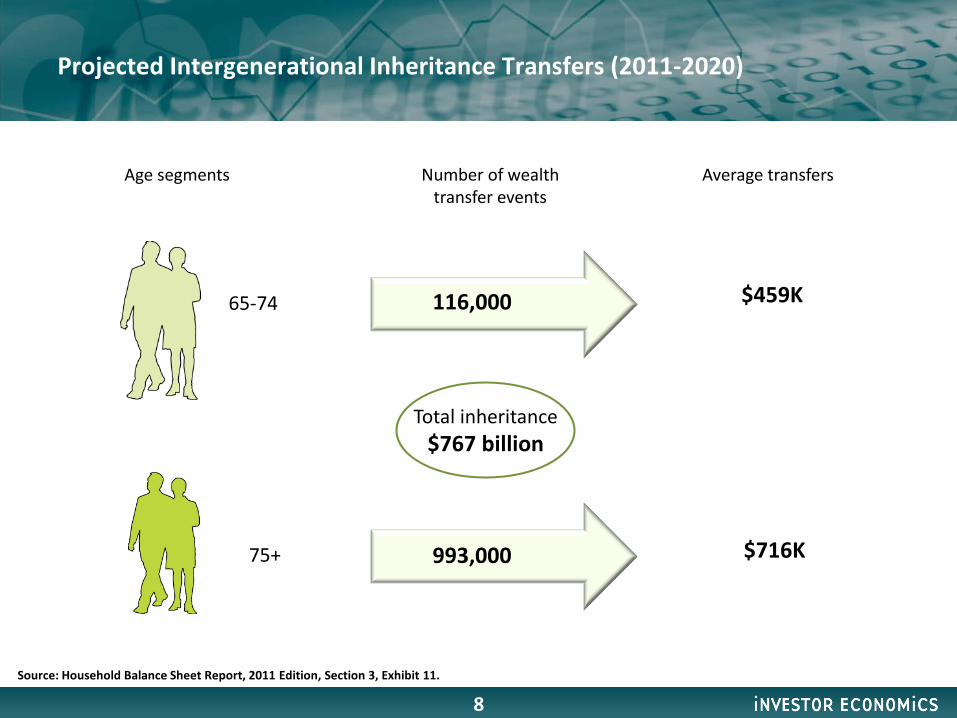
Projected Intergenerational Inheritance Transfers (2011-2020)
Average transfers
$459K
$716K
Number of wealth transfer events
Age segments
116,000
993,000
65-74
75+
Total inheritance $767 billion
8 Source: Household Balance Sheet Report, 2011 Edition, Section 3, Exhibit 11.
Products
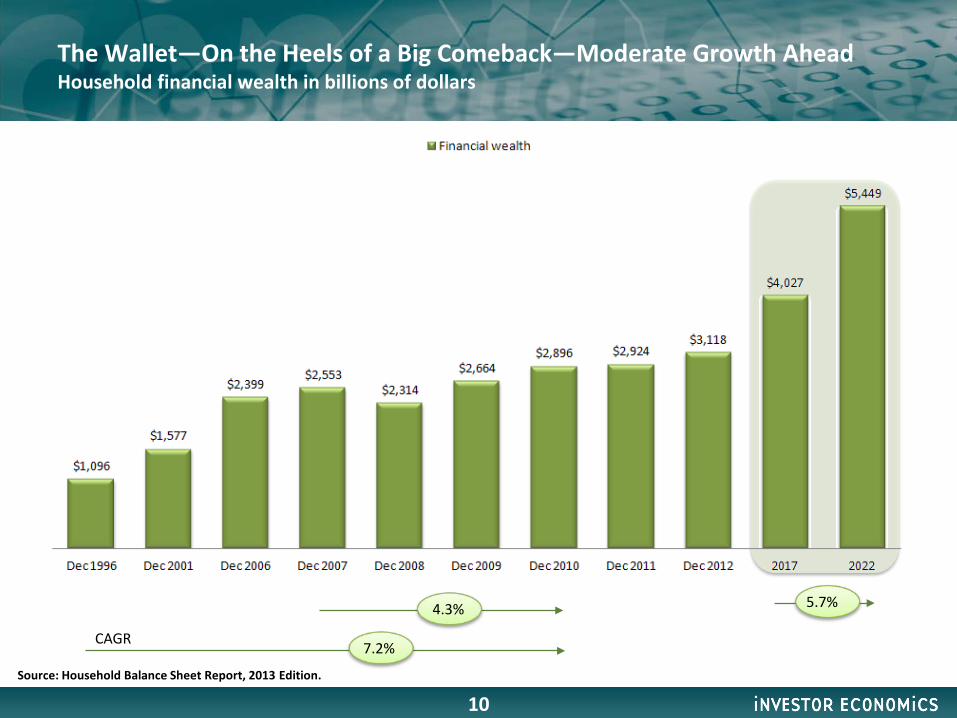
The Wallet—On the Heels of a Big Comeback—Moderate Growth Ahead Household financial wealth in billions of dollars
CAGR
5.7%
10
4.3%
7.2%
Source: Household Balance Sheet Report, 2013 Edition.
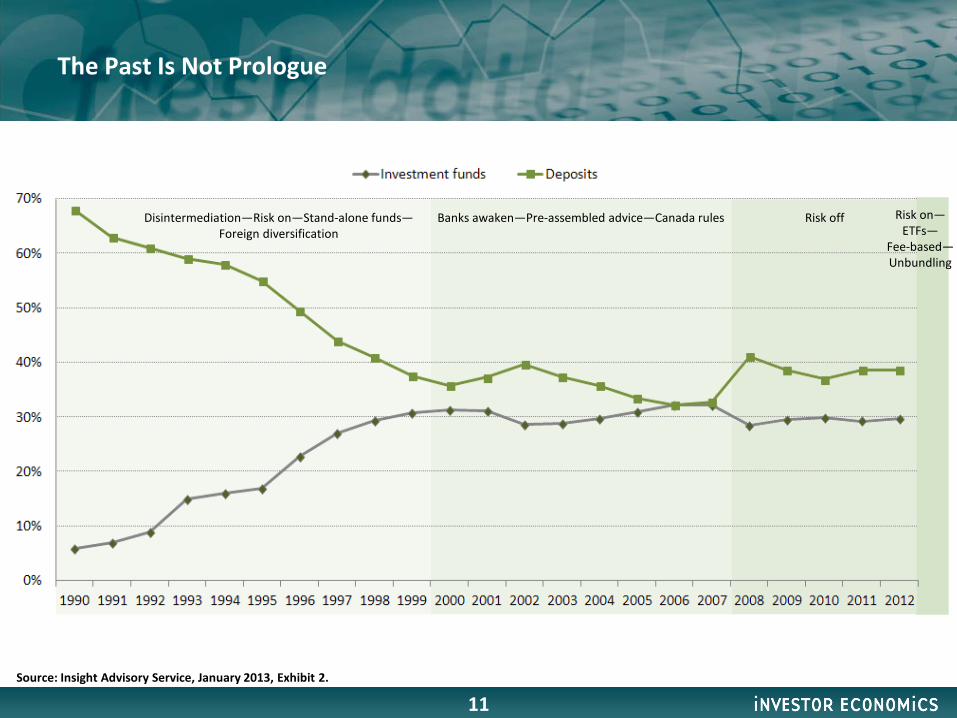
The Past Is Not Prologue
Source: Insight Advisory Service, January 2013, Exhibit 2.
Disintermediation—Risk on—Stand-alone funds— Foreign diversification
Banks awaken—Pre-assembled advice—Canada rules Risk off Risk on— ETFs—
Fee-based— Unbundling
11

Appetite For Risk-averse Vehicles Still Large and Growing; “Money on the Sidelines” Breaches $1 Trillion In billions of dollars
29% 29% 36% 34% 34% Total liquid instruments as a % of financial wealth
12

Fund Industry Flows Are on the Rise—with ETFs Leading the Charge Long-term investment fund net flows and ETF net creations in billions of dollars
Net flowsMarket effect Net flows
Market effect Net flows
Market effect Net flows
Market effect
Mutual funds 10.1% 4.8% 4.0% 6.0% 2.1% 2.0% 4.1% 7.0%Segregated funds 22.6% 4.3% 5.3% 5.2% 4.5% 0.7% 2.0% 4.6%ETFs – – 9.3% 14.0% 23.8% 2.7% 27.9% 2.2%
1997-2001 2002-2007 2008-2012As % of beginning assets
2012
Source: Insight Advisory Service, January 2013, Exhibit 3.
13

The Changing Asset Class Mix of Net Flows—Reprise of Foreign Diversification Long-term mutual fund net flows in billions of dollars
Canadian 96.3% 67.6% 72.5% 42.1% 41.8% 59.4% 39.0%
Foreign mandates 3.7% 32.4% 27.5% 57.9% 58.2% 40.6% 61.0%
Share of net flows
14

Growth of Fund Wraps Signals Importance of Pre-Assembled Advice Growth indexed to 1999, assets in billions of dollars
*Excludes ETFs.
Source: Insight Advisory Service, January 2013, Exhibit 9.
15
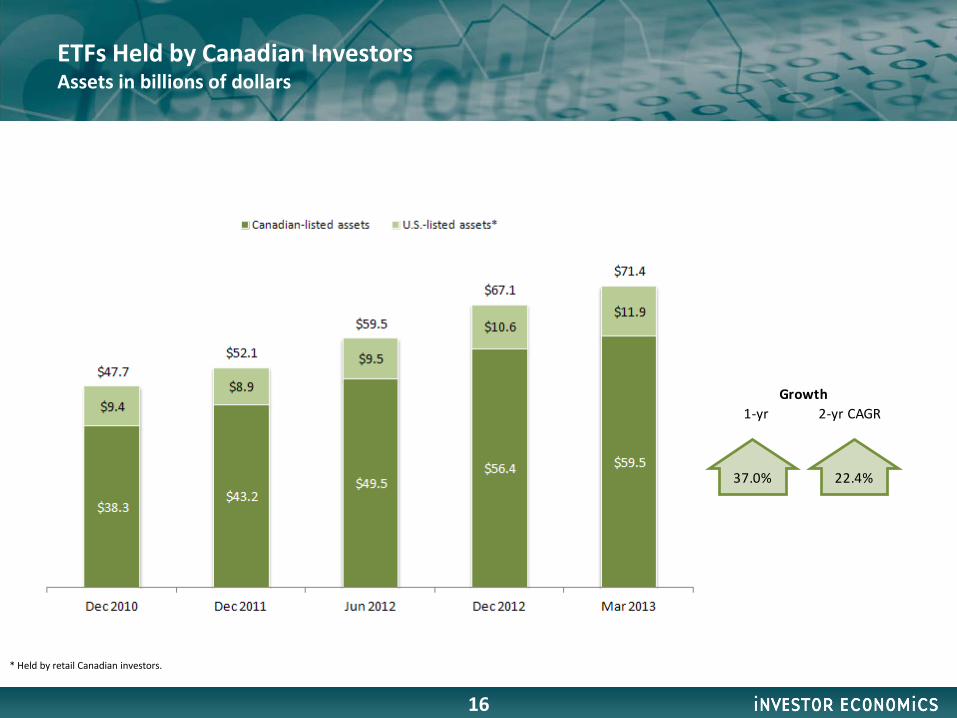
ETFs Held by Canadian Investors Assets in billions of dollars
* Held by retail Canadian investors.
16
1-yr 2-yr CAGRGrowth
22.4%37.0%

The Retirement Market Product Field – A 360° View
17
Hybrid retirement income solution
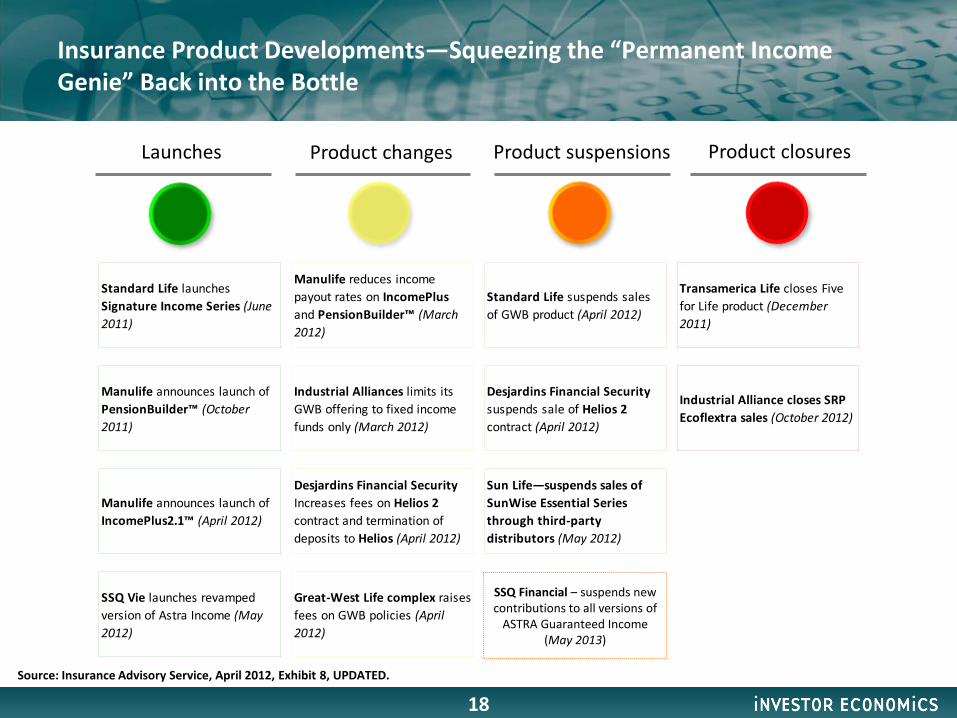
Insurance Product Developments—Squeezing the “Permanent Income Genie” Back into the Bottle
Launches Product changes Product suspensions Product closures
18
Standard Life launches Signature Income Series (June 2011)
Manulife reduces income payout rates on IncomePlus and PensionBuilder™ (March 2012)
Standard Life suspends sales of GWB product (April 2012)
Transamerica Life closes Five for Life product (December 2011)
Manulife announces launch of PensionBuilder™ (October 2011)
Industrial Alliances limits its GWB offering to fixed income funds only (March 2012)
Desjardins Financial Security suspends sale of Helios 2 contract (April 2012)
Industrial Alliance closes SRP Ecoflextra sales (October 2012)
Manulife announces launch of IncomePlus2.1™ (April 2012)
Desjardins Financial Security Increases fees on Helios 2 contract and termination of deposits to Helios (April 2012)
Sun Life—suspends sales of SunWise Essential Series through third-party distributors (May 2012)
SSQ Vie launches revamped version of Astra Income (May 2012)
Great-West Life complex raises fees on GWB policies (April 2012)
SSQ Financial – suspends new contributions to all versions of
ASTRA Guaranteed Income (May 2013)
Source: Insurance Advisory Service, April 2012, Exhibit 8, UPDATED.

2007 2008 2009 2010 2011 2012
PPNs PARNs
7.6%
8.3% 70.4%40.9%
25.5%15.7%
92.4% 91.7% 29.6%59.1%74.5%84.3%
467411
282261
375
485
Market-linked Notes Issued by Protection Type
19
Number of notes outstanding as of Dec 2012 2,276

Big Business—Group Retirement and Savings by the Numbers
20 Source: Group Retirement and Savings Report, January 2013.
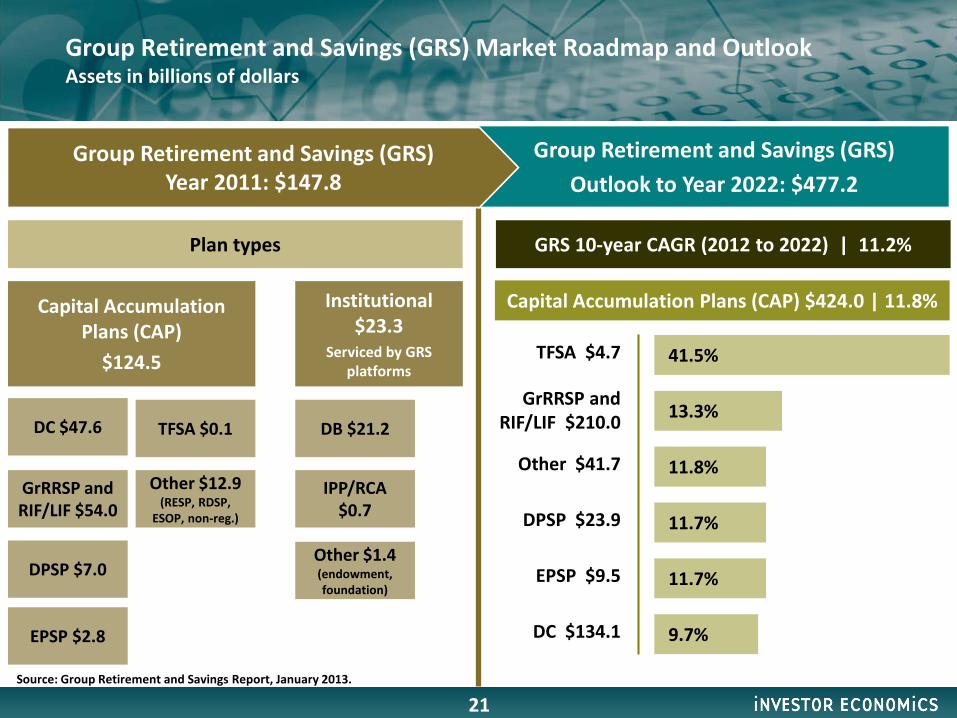
TFSA $4.7
GrRRSP and RIF/LIF $210.0
Other $41.7
DPSP $23.9
EPSP $9.5
DC $134.1
Group Retirement and Savings (GRS) Market Roadmap and Outlook Assets in billions of dollars
21
DC $47.6
GrRRSP and RIF/LIF $54.0
DPSP $7.0
EPSP $2.8
TFSA $0.1
Other $12.9 (RESP, RDSP,
ESOP, non-reg.)
Capital Accumulation Plans (CAP)
$124.5
Institutional $23.3
Serviced by GRS platforms
DB $21.2
IPP/RCA $0.7
Other $1.4 (endowment, foundation)
Plan types
GRS 10-year CAGR (2012 to 2022) | 11.2%
Group Retirement and Savings (GRS) Outlook to Year 2022: $477.2
Group Retirement and Savings (GRS)
Year 2011: $147.8
Capital Accumulation Plans (CAP) $424.0 | 11.8%
41.5%
13.3%
11.8%
11.7%
11.7%
9.7%
Source: Group Retirement and Savings Report, January 2013.

Distribution
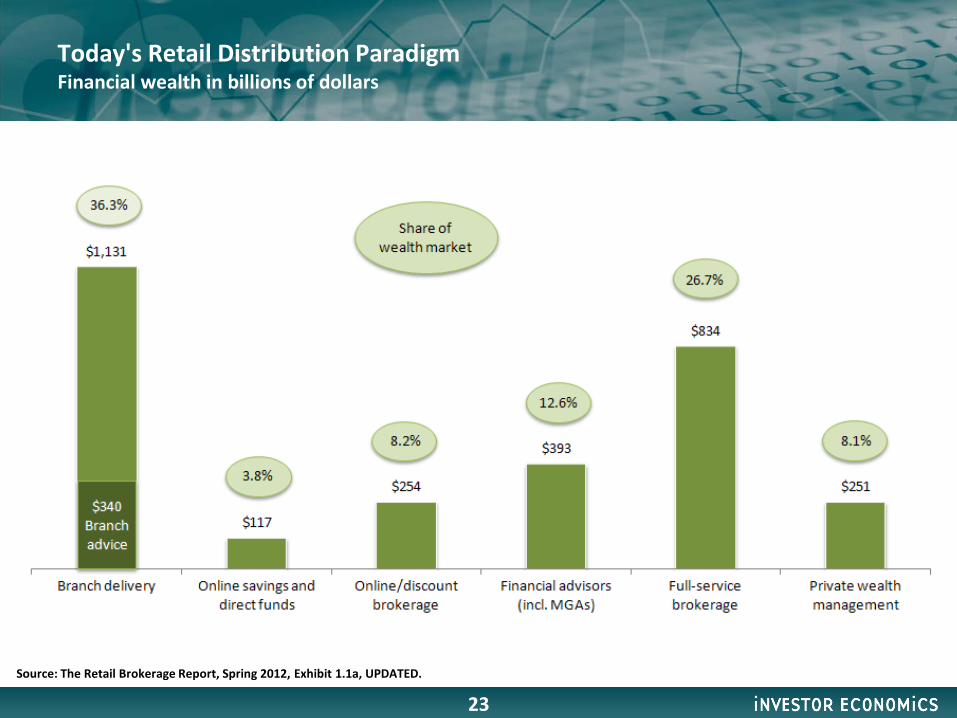
Today's Retail Distribution Paradigm Financial wealth in billions of dollars
Source: The Retail Brokerage Report, Spring 2012, Exhibit 1.1a, UPDATED.
23
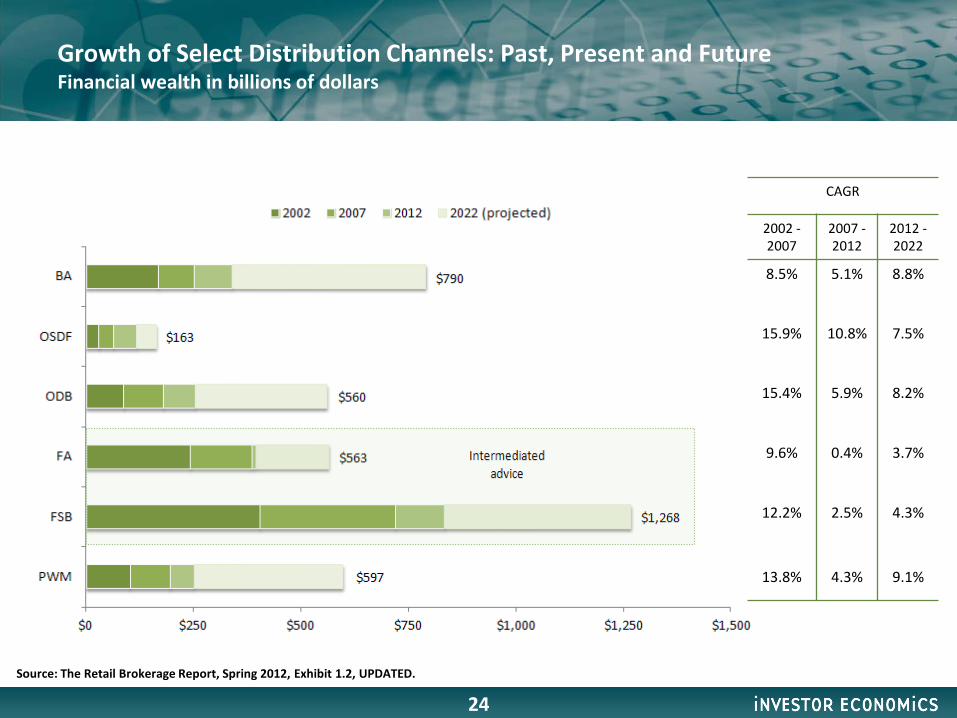
Growth of Select Distribution Channels: Past, Present and Future Financial wealth in billions of dollars
CAGR
2002 - 2007
2007 - 2012
2012 - 2022
8.5% 5.1% 8.8%
15.9% 10.8% 7.5%
15.4% 5.9% 8.2%
9.6% 0.4% 3.7%
12.2% 2.5% 4.3%
13.8% 4.3% 9.1%
Source: The Retail Brokerage Report, Spring 2012, Exhibit 1.2, UPDATED.
24
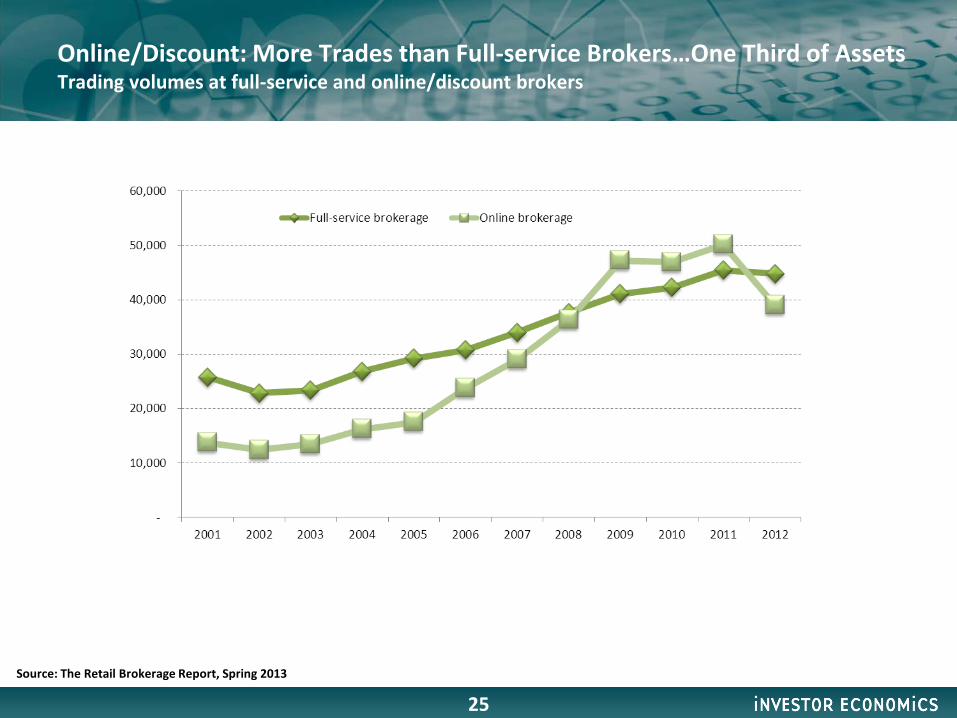
Online/Discount: More Trades than Full-service Brokers…One Third of Assets Trading volumes at full-service and online/discount brokers
Source: The Retail Brokerage Report, Spring 2013
25
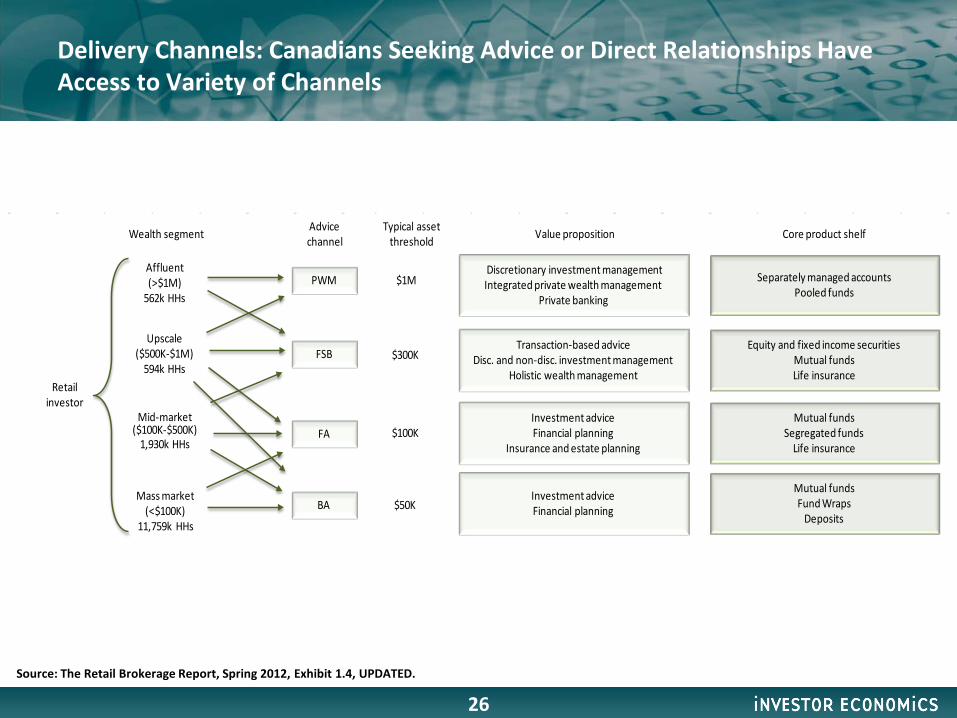
Delivery Channels: Canadians Seeking Advice or Direct Relationships Have Access to Variety of Channels
26
Retail investor
Affluent(>$1M)
562k HHs
Upscale($500K-$1M)
594k HHs
Mid-market($100K-$500K)
1,930k HHs
Mass market(<$100K)
11,759k HHs
PWM
FSB
FA
BA
$1M
$300K
$100K
$50K
Typical asset threshold
Separately managed accountsPooled funds
Core product shelf
Equity and fixed income securitiesMutual fundsLife insurance
Mutual fundsSegregated funds
Life insurance
Mutual fundsFund Wraps
Deposits
Value proposition
Discretionary investment managementIntegrated private wealth management
Private banking
Transaction-based adviceDisc. and non-disc. investment management
Holistic wealth management
Investment adviceFinancial planning
Insurance and estate planning
Investment adviceFinancial planning
Advice channelWealth segment
Source: The Retail Brokerage Report, Spring 2012, Exhibit 1.4, UPDATED.

Shift to Fee-based Pricing Models Poised to Accelerate in Intermediated Advice Channels Assets in billions of dollars
27
56% 57% 52% 53%
44%
10%14%
20%
28%
27%
34%29%
28%
16%
12%
$41$90
$140
$242
$625
2002 2005 2007 2012 2022
FBP/FBA
DWs
AM
FBB
Source: Household Balance Sheet Report, 2013 UPDATED.

Future of Advice-giving

Advisors Must Adapt to Changing Client Need and a Broader Competitive Landscape
• Adapt to evolving consumer needs by executing a “Growing with Your Customers” strategy and focusing on holistic wealth and insurance management
• Expand expertise in emerging areas, such as risk management, retirement income planning and estate planning
• Crystallize and articulate value of advice to combat competitive challenge from branch advisors
• Address time constraints and rising compliance and technology costs
• Develop new revenue opportunities and business efficiencies to strengthen economic model
29
1996: $10 million 2011: $23.4 million Advisor mutual fund book size needed to generate equivalent revenues