Embed Size (px)
Citation preview
The Buzz: Flexible Information Aggregation andPresentation for End Users
James R. [email protected]
John T. [email protected]
School of Interactive Computing & GVU CenterGeorgia Institute of Technology
Atlanta, GA 30332
ABSTRACTWe have presented The Buzz, a peripheral information aware-ness tool that allows end-users to exercise a rich degree ofcustomization over content and presentation. We describehow users can create their own information channels to ag-gregate and re-present media from a wide variety of sourceson the Internet.
INTRODUCTIONEvery day, people send over 60 billion email messages [14],make over 1.6 million blog postings1, and share over 32thousand videos on YouTube [8]. Every year, more than fourtimes the data in the entire U.S. Library of Congress is addedto the World Wide Web2. With such a flood of information,it can be a real challenge to keep afloat. We have created aresearch prototype, called The Buzz, to help people managethe deluge of information that inundates them.
The Buzz allows the user to create information channels togather and present information from a variety of informationsources. Additionally, users can subscribe to channels thatothers have already created. In this way, channels allow theuser to collect information from the various publishers on theInternet and present them in a different fashion, perhaps tai-lored to the individual’s own needs and interests. Thus, TheBuzz is akin to an RSS feed reader beyond the web browser,but with the ability to create such a feed when the publisherdoes not make one readily available. Additionally, it uses acollage-like presentation style that emphasises images overtext (although textual presentations are still available). Thus,the user can repurpose the publisher’s data for use in an in-formation awareness context.
1As of November, 2006, Technorati.com tracks an average of 1.6million daily posts to 60 million blogs.2Estimated using static, publicly accessible web pages, but not pri-vate or database-driven web pages [14].
Unlike traditional feed readers, the system provides exten-sive support for more flexible information acquisition, ag-gregation, and presentation. When RSS is readily available,support exists for the user to re-purpose the data and use itin a different fashion. For example, many RSS feeds provideincomplete information, or structure the data specifically foruse in a traditional feed reader, which may be at odds withthe information awareness context. The Buzz provides sup-port to extend and filter feed content, and a simple templat-ing mechanism to allow the user to create his or her ownrepresentations of the data.
In this context, the goal of The Buzz is to help users to con-solidate information from a wide variety of sources and topresent each data source in a fashion appropriate for main-taining overall information awareness. As access to informa-tion increases, the demands on attention increase, makingit all the more important to adequately manage our atten-tion [5]. Peripheral awareness systems which calmly [20]present information in the periphery can help convey infor-mation without the user’s explicit attention [17], helping theuser to better manage the interruptions that can interfere withone’s work [12].
Peripheral awareness systems have been used for a variety ofother tasks, ranging from monitoring the activities of friends,family [3, 16], and coworkers [21, 11, 6], to staying ap-praised of information with personal relevance [19, 2]. Al-though some of these systems focus on expressing informa-tion from a single source, as in [3], many fall into the broaderclass of data aggregators ([2, 11, 19], to name but a few).These aggregators assemble data from a variety of sourcesfor presentation.
Furthermore, information tends to be individual in nature—what is relevant to one person is often quite different fromwhat is relevant to another. Thus, customization is vital toenabling these systems to tailor their content and presenta-tion to support these individual differences. This tailoringcan be useful for many work-oriented and personal reasons,from promoting information access to helping express an in-dividual’s identity [1].
As display costs fall, the feasibility of using displays in moreubiquitous settings increases. By moving theses systems off
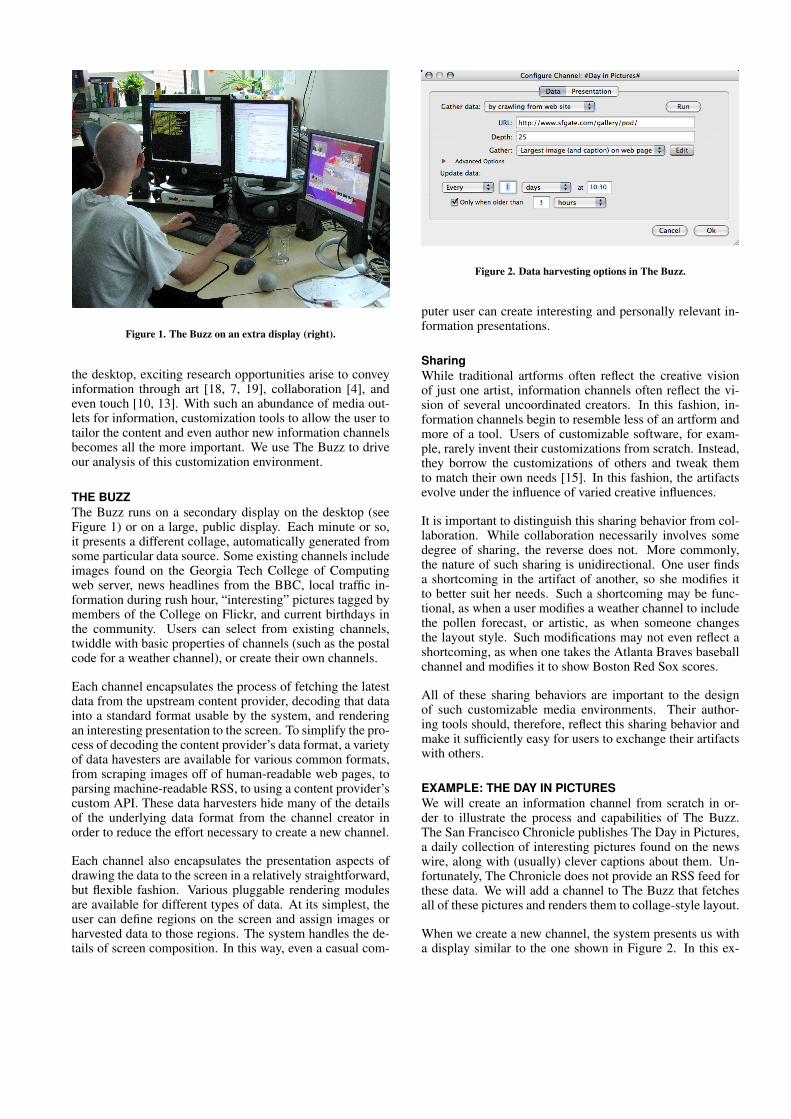
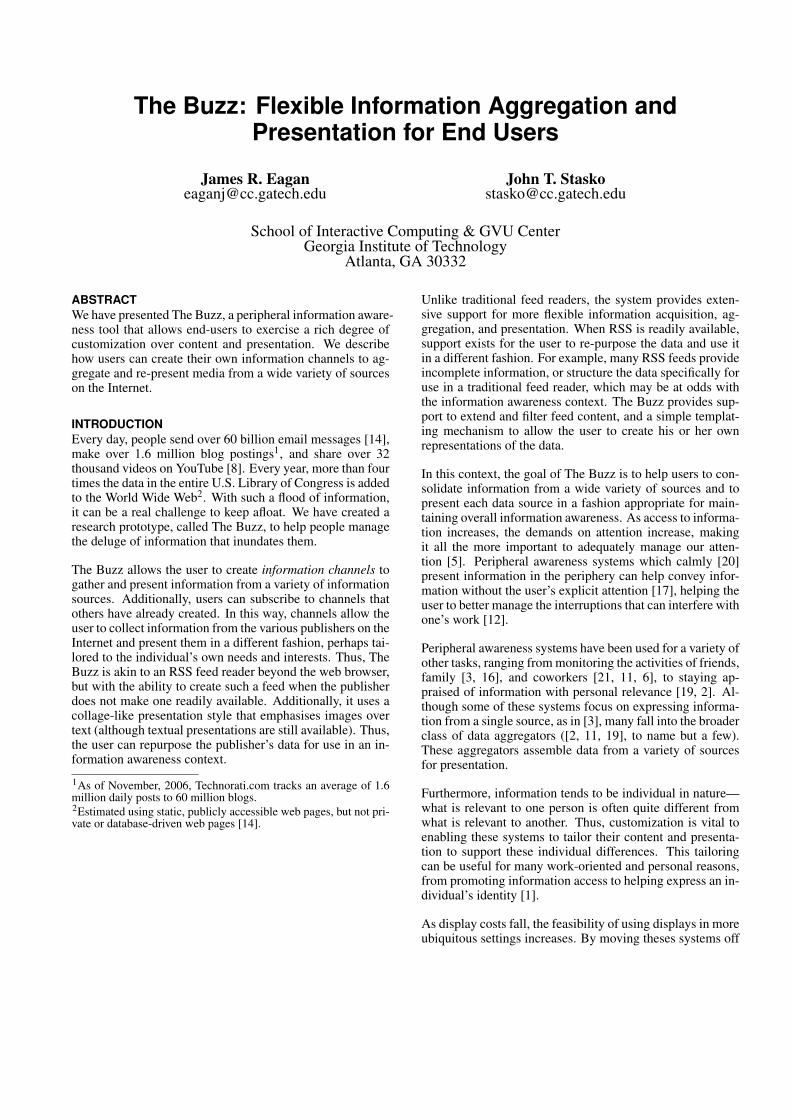
Figure 1. The Buzz on an extra display (right).
the desktop, exciting research opportunities arise to conveyinformation through art [18, 7, 19], collaboration [4], andeven touch [10, 13]. With such an abundance of media out-lets for information, customization tools to allow the user totailor the content and even author new information channelsbecomes all the more important. We use The Buzz to driveour analysis of this customization environment.
THE BUZZThe Buzz runs on a secondary display on the desktop (seeFigure 1) or on a large, public display. Each minute or so,it presents a different collage, automatically generated fromsome particular data source. Some existing channels includeimages found on the Georgia Tech College of Computingweb server, news headlines from the BBC, local traffic in-formation during rush hour, “interesting” pictures tagged bymembers of the College on Flickr, and current birthdays inthe community. Users can select from existing channels,twiddle with basic properties of channels (such as the postalcode for a weather channel), or create their own channels.
Each channel encapsulates the process of fetching the latestdata from the upstream content provider, decoding that datainto a standard format usable by the system, and renderingan interesting presentation to the screen. To simplify the pro-cess of decoding the content provider’s data format, a varietyof data havesters are available for various common formats,from scraping images off of human-readable web pages, toparsing machine-readable RSS, to using a content provider’scustom API. These data harvesters hide many of the detailsof the underlying data format from the channel creator inorder to reduce the effort necessary to create a new channel.
Each channel also encapsulates the presentation aspects ofdrawing the data to the screen in a relatively straightforward,but flexible fashion. Various pluggable rendering modulesare available for different types of data. At its simplest, theuser can define regions on the screen and assign images orharvested data to those regions. The system handles the de-tails of screen composition. In this way, even a casual com-
Figure 2. Data harvesting options in The Buzz.
puter user can create interesting and personally relevant in-formation presentations.
SharingWhile traditional artforms often reflect the creative visionof just one artist, information channels often reflect the vi-sion of several uncoordinated creators. In this fashion, in-formation channels begin to resemble less of an artform andmore of a tool. Users of customizable software, for exam-ple, rarely invent their customizations from scratch. Instead,they borrow the customizations of others and tweak themto match their own needs [15]. In this fashion, the artifactsevolve under the influence of varied creative influences.
It is important to distinguish this sharing behavior from col-laboration. While collaboration necessarily involves somedegree of sharing, the reverse does not. More commonly,the nature of such sharing is unidirectional. One user findsa shortcoming in the artifact of another, so she modifies itto better suit her needs. Such a shortcoming may be func-tional, as when a user modifies a weather channel to includethe pollen forecast, or artistic, as when someone changesthe layout style. Such modifications may not even reflect ashortcoming, as when one takes the Atlanta Braves baseballchannel and modifies it to show Boston Red Sox scores.
All of these sharing behaviors are important to the designof such customizable media environments. Their author-ing tools should, therefore, reflect this sharing behavior andmake it sufficiently easy for users to exchange their artifactswith others.
EXAMPLE: THE DAY IN PICTURESWe will create an information channel from scratch in or-der to illustrate the process and capabilities of The Buzz.The San Francisco Chronicle publishes The Day in Pictures,a daily collection of interesting pictures found on the newswire, along with (usually) clever captions about them. Un-fortunately, The Chronicle does not provide an RSS feed forthese data. We will add a channel to The Buzz that fetchesall of these pictures and renders them to collage-style layout.
When we create a new channel, the system presents us witha display similar to the one shown in Figure 2. In this ex-
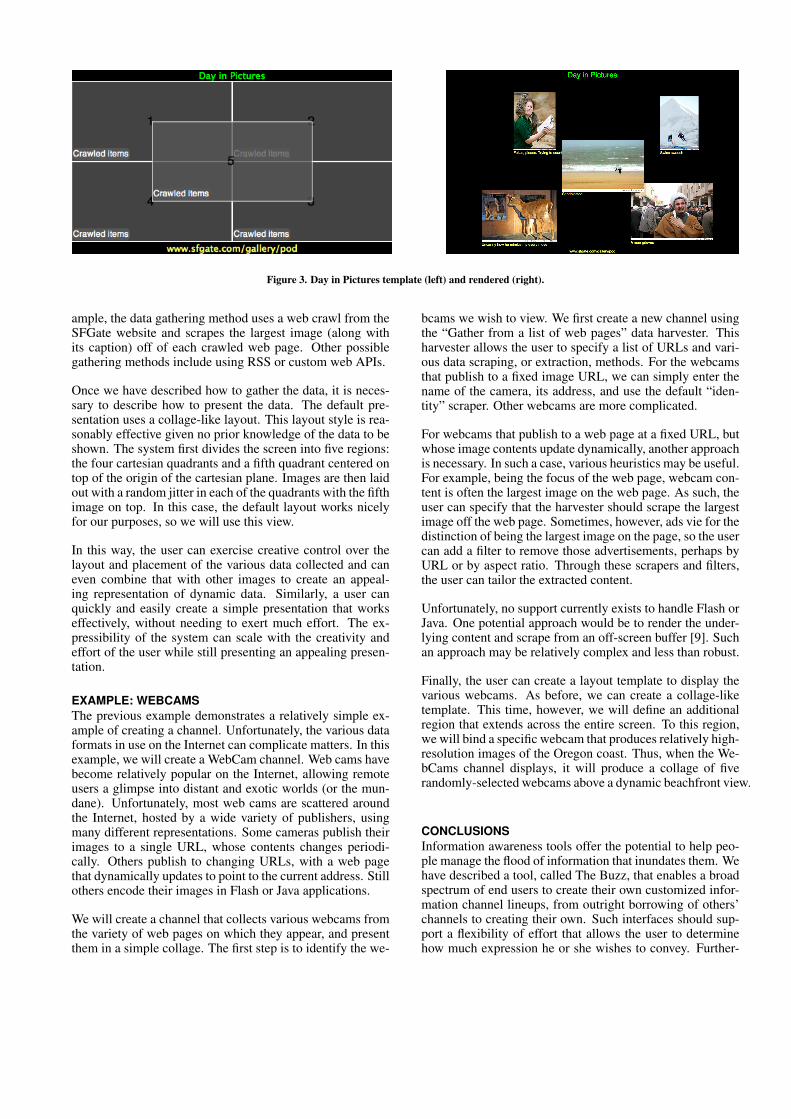
Figure 3. Day in Pictures template (left) and rendered (right).
ample, the data gathering method uses a web crawl from theSFGate website and scrapes the largest image (along withits caption) off of each crawled web page. Other possiblegathering methods include using RSS or custom web APIs.
Once we have described how to gather the data, it is neces-sary to describe how to present the data. The default pre-sentation uses a collage-like layout. This layout style is rea-sonably effective given no prior knowledge of the data to beshown. The system first divides the screen into five regions:the four cartesian quadrants and a fifth quadrant centered ontop of the origin of the cartesian plane. Images are then laidout with a random jitter in each of the quadrants with the fifthimage on top. In this case, the default layout works nicelyfor our purposes, so we will use this view.
In this way, the user can exercise creative control over thelayout and placement of the various data collected and caneven combine that with other images to create an appeal-ing representation of dynamic data. Similarly, a user canquickly and easily create a simple presentation that workseffectively, without needing to exert much effort. The ex-pressibility of the system can scale with the creativity andeffort of the user while still presenting an appealing presen-tation.
EXAMPLE: WEBCAMSThe previous example demonstrates a relatively simple ex-ample of creating a channel. Unfortunately, the various dataformats in use on the Internet can complicate matters. In thisexample, we will create a WebCam channel. Web cams havebecome relatively popular on the Internet, allowing remoteusers a glimpse into distant and exotic worlds (or the mun-dane). Unfortunately, most web cams are scattered aroundthe Internet, hosted by a wide variety of publishers, usingmany different representations. Some cameras publish theirimages to a single URL, whose contents changes periodi-cally. Others publish to changing URLs, with a web pagethat dynamically updates to point to the current address. Stillothers encode their images in Flash or Java applications.
We will create a channel that collects various webcams fromthe variety of web pages on which they appear, and presentthem in a simple collage. The first step is to identify the we-
bcams we wish to view. We first create a new channel usingthe “Gather from a list of web pages” data harvester. Thisharvester allows the user to specify a list of URLs and vari-ous data scraping, or extraction, methods. For the webcamsthat publish to a fixed image URL, we can simply enter thename of the camera, its address, and use the default “iden-tity” scraper. Other webcams are more complicated.
For webcams that publish to a web page at a fixed URL, butwhose image contents update dynamically, another approachis necessary. In such a case, various heuristics may be useful.For example, being the focus of the web page, webcam con-tent is often the largest image on the web page. As such, theuser can specify that the harvester should scrape the largestimage off the web page. Sometimes, however, ads vie for thedistinction of being the largest image on the page, so the usercan add a filter to remove those advertisements, perhaps byURL or by aspect ratio. Through these scrapers and filters,the user can tailor the extracted content.
Unfortunately, no support currently exists to handle Flash orJava. One potential approach would be to render the under-lying content and scrape from an off-screen buffer [9]. Suchan approach may be relatively complex and less than robust.
Finally, the user can create a layout template to display thevarious webcams. As before, we can create a collage-liketemplate. This time, however, we will define an additionalregion that extends across the entire screen. To this region,we will bind a specific webcam that produces relatively high-resolution images of the Oregon coast. Thus, when the We-bCams channel displays, it will produce a collage of fiverandomly-selected webcams above a dynamic beachfront view.
CONCLUSIONSInformation awareness tools offer the potential to help peo-ple manage the flood of information that inundates them. Wehave described a tool, called The Buzz, that enables a broadspectrum of end users to create their own customized infor-mation channel lineups, from outright borrowing of others’channels to creating their own. Such interfaces should sup-port a flexibility of effort that allows the user to determinehow much expression he or she wishes to convey. Further-
more, authoring environments should provide explicit sup-port for sharing and borrowing of such media artifacts.
ACKNOWLEDGEMENTSThis work has been supported in part by the U.S. NationalScience Foundation under grant IIS-0414667.
REFERENCES1. J. Blom. Personalization: a taxonomy. In CHI ’00
extended abstracts on Human factors in computingsystems, pages 313–314. ACM Press, 2000.
2. J. J. Cadiz, G. Venolia, G. Jancke, and A. Gupta.Designing and deploying an information awarenessinterface. In Proceedings of the 2002 ACM conferenceon Computer supported cooperative work, pages314–323. ACM Press, 2002.
3. A. Chang, B. Resner, B. Koerner, X. Wang, andH. Ishii. Lumitouch: an emotional communicationdevice. In CHI ’01 extended abstracts on Humanfactors in computing systems, pages 313–314, NewYork, NY, USA, 2001. ACM Press.
4. E. F. Churchill, L. Nelson, L. Denoue, J. Helfman, andP. Murphy. Sharing multimedia content with interactivepublic displays: a case study. In Proceedings of the2004 conference on Designing interactive systems,pages 7–16. ACM Press, 2004.
5. T. H. Davenport and J. C. Beck. The AttentionEconomy: Understanding the New Currency ofBusiness. Harvard Business School Press, Cambridge,MA, June 2001.
6. A. Fass, J. Forlizzi, and R. Pausch. MessyDesk andMessyBoard: two designs inspired by the goal ofimproving human memory. In DIS ’02: Proceedings ofthe conference on Designing interactive systems, pages303–311, New York, NY, USA, 2002. ACM Press.
7. J. Fogarty, J. Forlizzi, and S. E. Hudson. Aestheticinformation collages: generating decorative displaysthat contain information. In Proceedings of the 14thannual ACM symposium on User interface softwareand technology, pages 141–150. ACM Press, 2001.
8. L. Gomes. Will all of us get our 15 minutes on aYouTube video? The Wall Street Journal, 248(51):B1,August 2006.
9. S. Greenberg and M. Boyle. Generating customnotification histories by tracking visual differencesbetween web page visits. In GI ’06: Proceedings of the2006 conference on Graphics interface, pages227–234, Toronto, Ont., Canada, Canada, 2006.Canadian Information Processing Society.
10. S. Greenberg and C. Fitchett. Phidgets: easydevelopment of physical interfaces through physicalwidgets. In UIST ’01: Proceedings of the 14th annualACM symposium on User interface software andtechnology, pages 209–218, New York, NY, USA,2001. ACM Press.
11. S. Greenberg and M. Rounding. The NotificationCollage: posting information to public and personaldisplays. In CHI ’01: Proceedings of the SIGCHIconference on Human factors in computing systems,pages 514–521, New York, NY, USA, April 2001.ACM Press.
12. J. M. Hudson, J. Christensen, W. A. Kellogg, andT. Erickson. "I’d be overwhelmed, but it’s just onemore thing to do": availability and interruption inresearch management. In Proceedings of the SIGCHIconference on Human factors in computing systems,pages 97–104. ACM Press, 2002.
13. H. Ishii and B. Ullmer. Tangible bits: towards seamlessinterfaces between people, bits and atoms. In CHI ’97:Proceedings of the SIGCHI conference on Humanfactors in computing systems, pages 234–241, NewYork, NY, USA, 1997. ACM Press.
14. P. Lyman and H. R. Varian. How much information.Retrieved November 8, 2006 from http://www.sims.berkeley.edu/how-much-info-2003.
15. W. E. Mackay. Patterns of sharing customizablesoftware. In Proceedings of the 1990 ACM conferenceon Computer-supported cooperative work, pages209–221, New York, NY, USA, 1990. ACM Press.
16. E. D. Mynatt, J. Rowan, S. Craighill, and A. Jacobs.Digital family portraits: supporting peace of mind forextended family members. In CHI ’01: Proceedings ofthe SIGCHI conference on Human factors in computingsystems, pages 333–340, New York, NY, USA, 2001.ACM Press.
17. C. Plaue, T. Miller, and J. Stasko. Is a picture worth athousand words?: an evaluation of informationawareness displays. In Proceedings of the 2004conference on Graphics interface, pages 117–126.Canadian Human-Computer Communications Society,2004.
18. J. Redström, T. Skog, and L. Hallnäs. Informative art:using amplified artworks as information displays. InProceedings of DARE 2000 on Designing augmentedreality environments, pages 103–114. ACM Press,2000.
19. J. Stasko, T. Miller, Z. Pousman, C. Plaue, andO. Ullah. Personalized peripheral informationawareness through Information Art. In Proceedings ofUbiComp ’04, pages 18–35, Nottingham, U.K.,September 2004.
20. M. Weiser and J. S. Brown. Beyond calculation: thenext fifty years, chapter The coming age of calmtechnolgy, pages 75–85. Copernicus, 1997.
21. Q. A. Zhao and J. Stasko. What’s Happening?:Promoting community awareness throughopportunistic, peripheral interfaces. In Proceedings ofthe Advanced Visual Interfaces Conference, pages69–74, Trento, Italy, May 2002.