Embed Size (px)
Citation preview

1
Ed MorrisDirector, Mechanical Engineeringand ManufacturingCorporate Engineering & Technology
The Business of Aerospace and Defense
May 2011
1

2
Foster Informed Discussionof the Business Aspects
of the Aerospace and Defense Industry
Goal
3
Agenda
• Business Principles • A&D Evolution• A&D Contributions• A&D Unique Characteristics• Defense Contracting Considerations• Summary

4
Business Principles
5
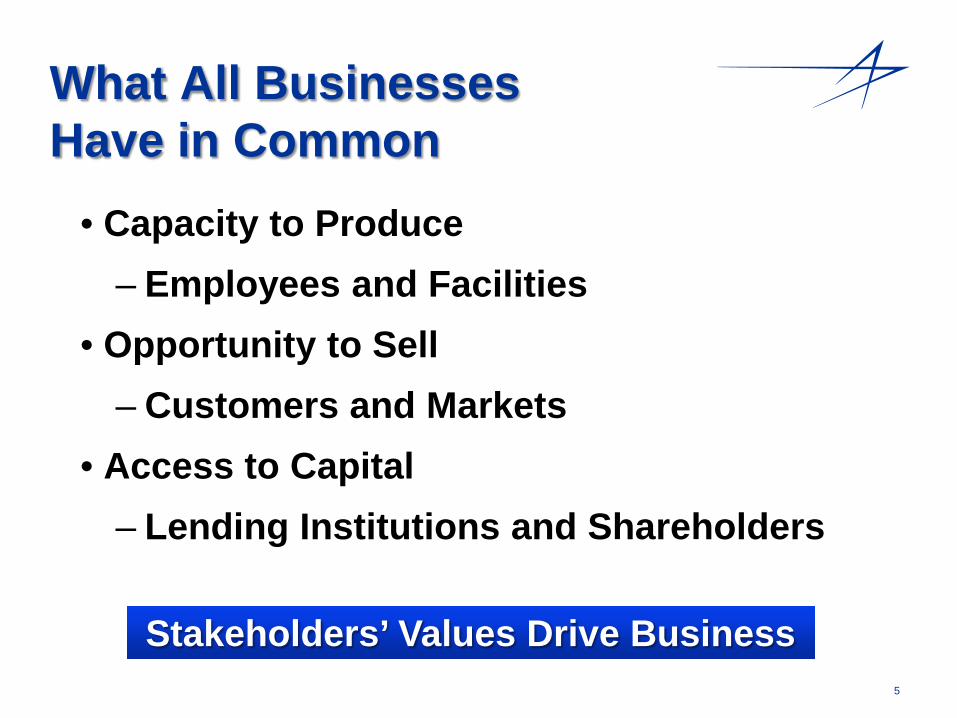
What All BusinessesHave in Common
• Capacity to Produce– Employees and Facilities
• Opportunity to Sell– Customers and Markets
• Access to Capital– Lending Institutions and Shareholders
Stakeholders’ Values Drive Business
6
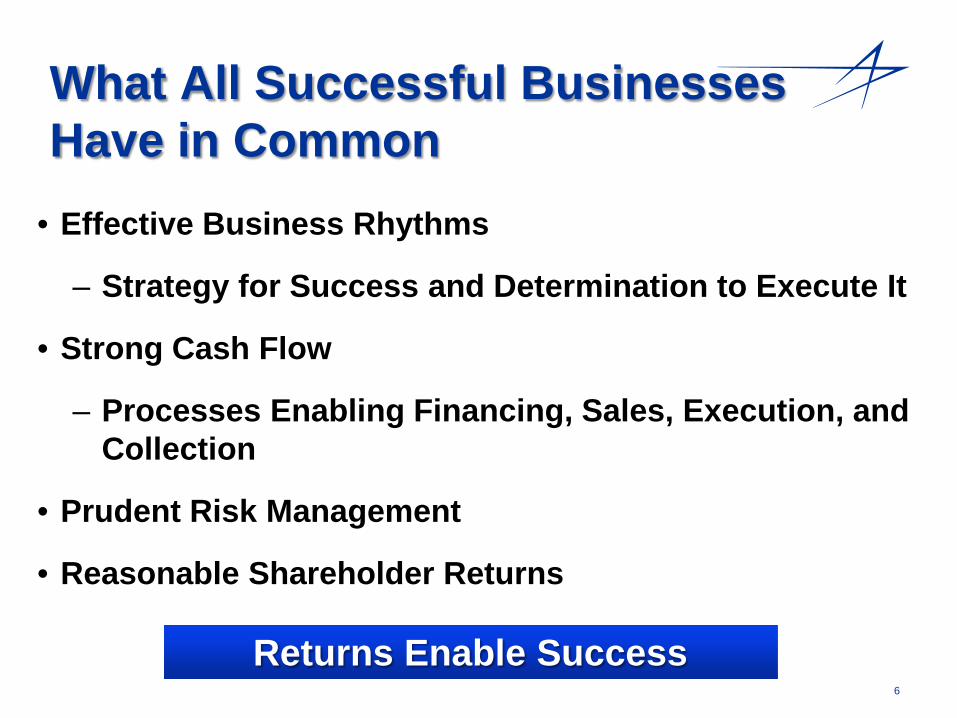
What All Successful BusinessesHave in Common
• Effective Business Rhythms
– Strategy for Success and Determination to Execute It
• Strong Cash Flow
– Processes Enabling Financing, Sales, Execution, and Collection
• Prudent Risk Management
• Reasonable Shareholder Returns
Returns Enable Success

7
Financial Flow
Development, Production & Delivery
Earnings Per Share
Sales
Order
Backlog
Operating Profit
Net Earnings
Minus Cost of Sales
Minus Interest and Taxes
Divide by # of Shares
8
A&D Evolution
9
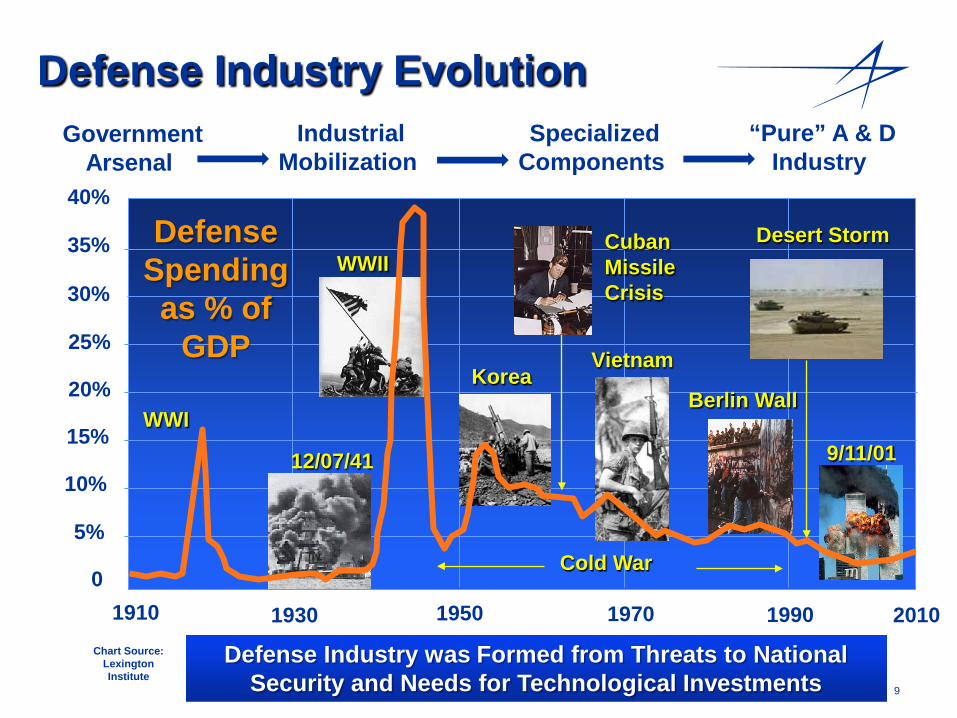
1910 1950 1970 19900
5%
10%
15%
20%
25%
30%
35%
40%
Defense Industry Evolution
Chart Source: Lexington Institute
1930
WWII
KoreaVietnam
Cold War
WWI9/11/01
Berlin Wall
12/07/41
CubanMissileCrisis
Desert Storm
Defense Industry was Formed from Threats to National Security and Needs for Technological Investments
Defense Spending as % of
GDP
GovernmentArsenal
IndustrialMobilization
SpecializedComponents
“Pure” A & DIndustry
2010

10
A&D Industry Consolidation
1986 1988 1990 1992 1994 1996 1998 2000 2002 2004 2006 2007 2008
LOCKHEED MARTINLockheedGD Ft. Worth
Martin MariettaGE Aerospace
GD SpaceLoral
LTV MissilesIBM Federal
Comsat
SAVIPAE
AcculightUnitech
ACS
NorthropGrumman
WestinghouseLogicon
LittonNewport News
TRWEssex
3001 Int’lRaytheon
BAe Corporate JetsE-Systems
GM-HughesGD Missiles
Texas InstrumentsBoeing Australia
Flight OptionsSarcos Research
SI GovtBoeing
RockwellMcDonnell Douglas
Hughes S&CAviallInsitu
General Dynamics
GulfStreamMotorola IISG
GM DefenseVeridian
United Defense
Anteon & FCBSSNC
Jet Aviation Group
NORTHROP GRUMMAN
RAYTHEON
BOEING
GENERAL DYNAMICS
Reduced Demand and Market Forces Reshaped the Primes10

11
7,581
Defense Systems Procured
Ship Procurement
1980 1985 1990 2000 2005
11
33 31
6
Missile Procurement
1980 1985 1990 2000 2005
18,466
87,11365,107
5,702
Aircraft Procurement
531497
337
138
1980 1985 1990 2000 2005
188
Source: DoD Procurement Programs P-1
81082009
14,661
2009
52009
Helicopter Procurement
124
353
243
1980 1985 1990 2000 2005
6628
248
2009

12
A&D Primes’ PortfoliosBoeing - $68B
General Dynamics - $32B
Northrop Grumman - $34BLockheed Martin - $45B
Raytheon - $25B
(2009 Sales)
AeronauticsSpace Systems
Electronic Systems
Information Systems & Global Services
Military Aircraft
Global Services & Support
Network & Space Systems
Integrated Defense Systems
Space & Airborne Systems
Missile Systems
Intel, Info, & Net Centric Systems & Technical Services
Aerospace Systems
Shipbuilding
Electronic Systems
Information Systems & Technical Services
AerospaceMarine Systems
Combat Systems
Information Systems & Technology
Commercial Aircraft
Primes are Adapting to Changing Market Demands
13
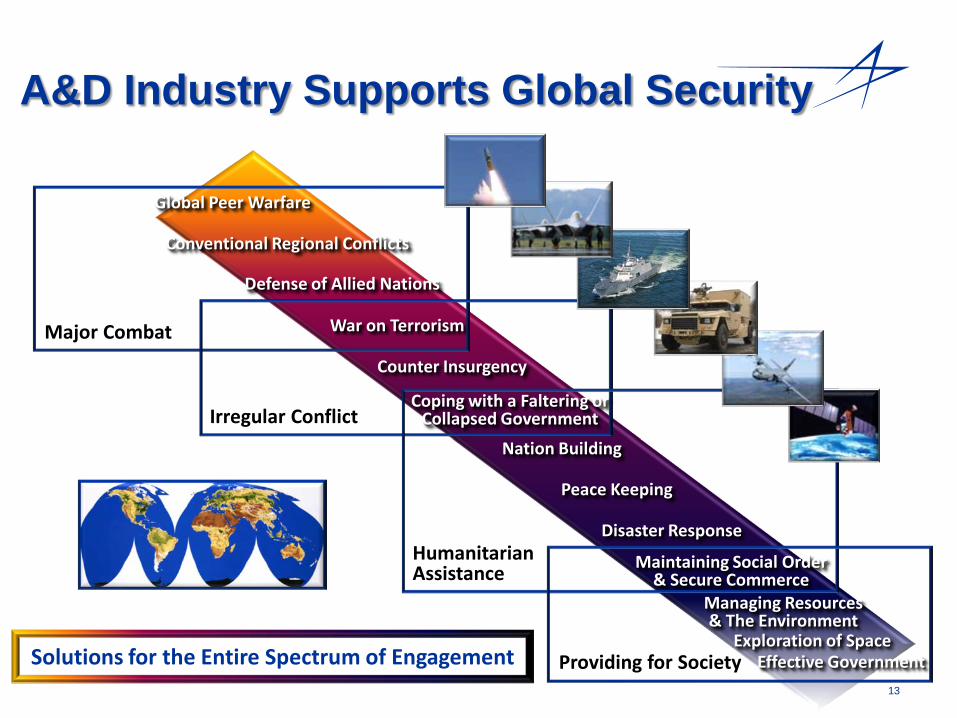
Major Combat
Irregular Conflict
Humanitarian Assistance
Providing for Society
Disaster Response
Nation Building
Conventional Regional Conflicts
Coping with a Faltering or Collapsed Government
Defense of Allied Nations
War on Terrorism
Counter Insurgency
Peace Keeping
Maintaining Social Order & Secure Commerce
Managing Resources & The Environment
Global Peer Warfare
Effective GovernmentSolutions for the Entire Spectrum of EngagementExploration of Space
A&D Industry Supports Global Security
14
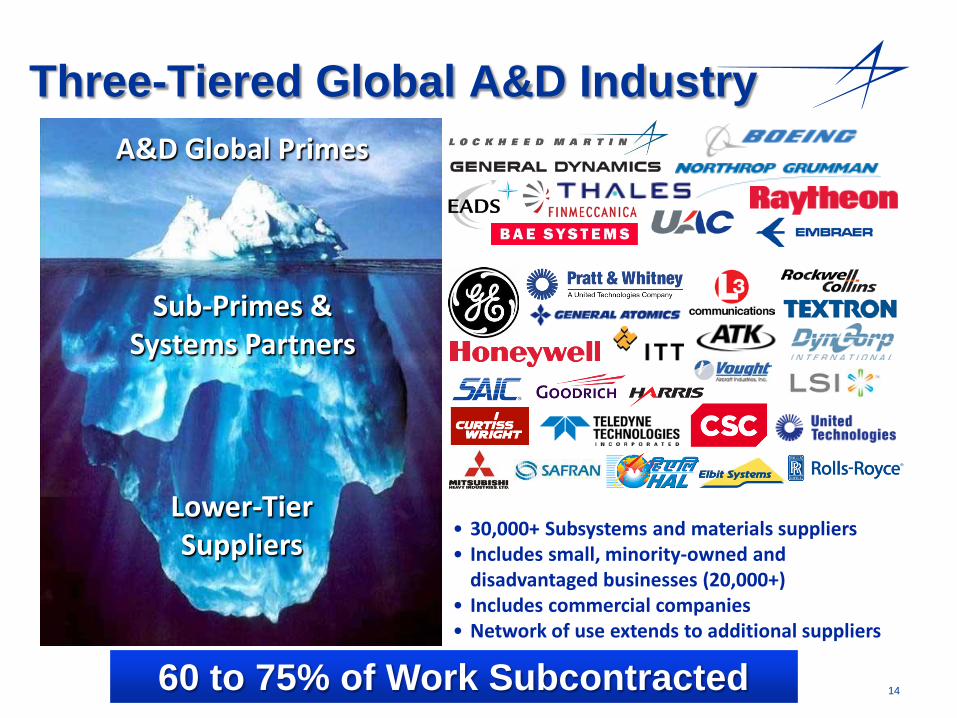
Three-Tiered Global A&D Industry
• 30,000+ Subsystems and materials suppliers• Includes small, minority-owned and
disadvantaged businesses (20,000+)• Includes commercial companies• Network of use extends to additional suppliers
Lower-Tier Suppliers
Sub-Primes & Systems Partners
A&D Global Primes
60 to 75% of Work Subcontracted

15
A&D Contributions
16
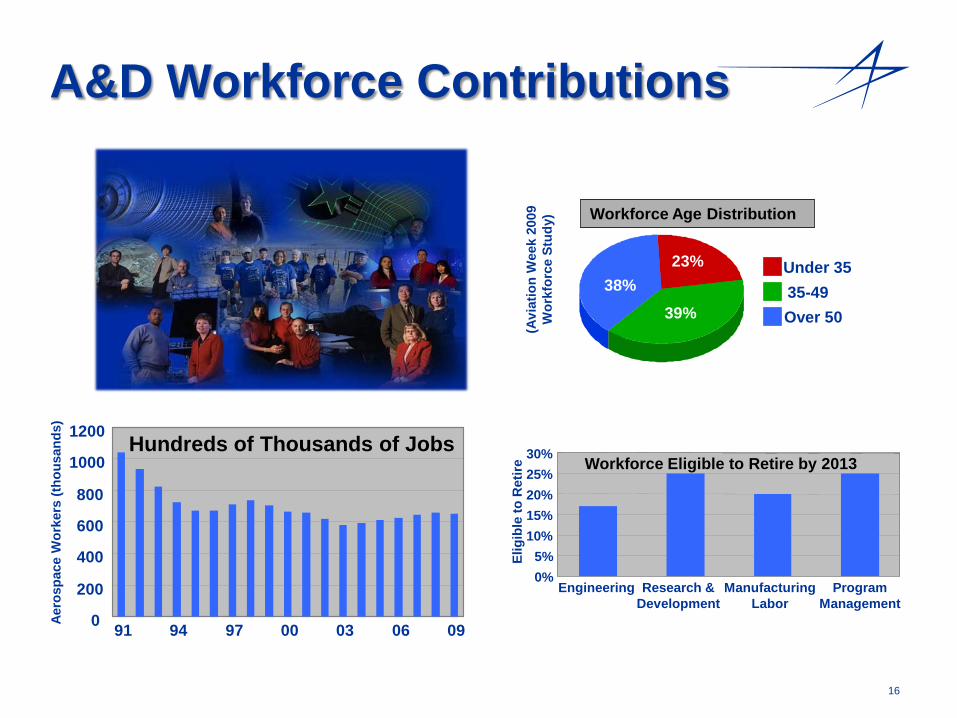
A&D Workforce Contributions
0
200
400
600
800
1000
1200
91 94 97 00 03 06 09
Aero
spac
e W
orke
rs (t
hous
ands
)
Hundreds of Thousands of Jobs
Workforce Age Distribution
Under 3535-49Over 50
38%
39%
23%
0%5%
10%15%20%25%30%
Engineering Research & Development
Manufacturing Labor
Program Management
Elig
ible
to R
etire Workforce Eligible to Retire by 2013
(Avi
atio
n W
eek
2009
W
orkf
orce
Stu
dy)
17
= 100 Jobs Cut
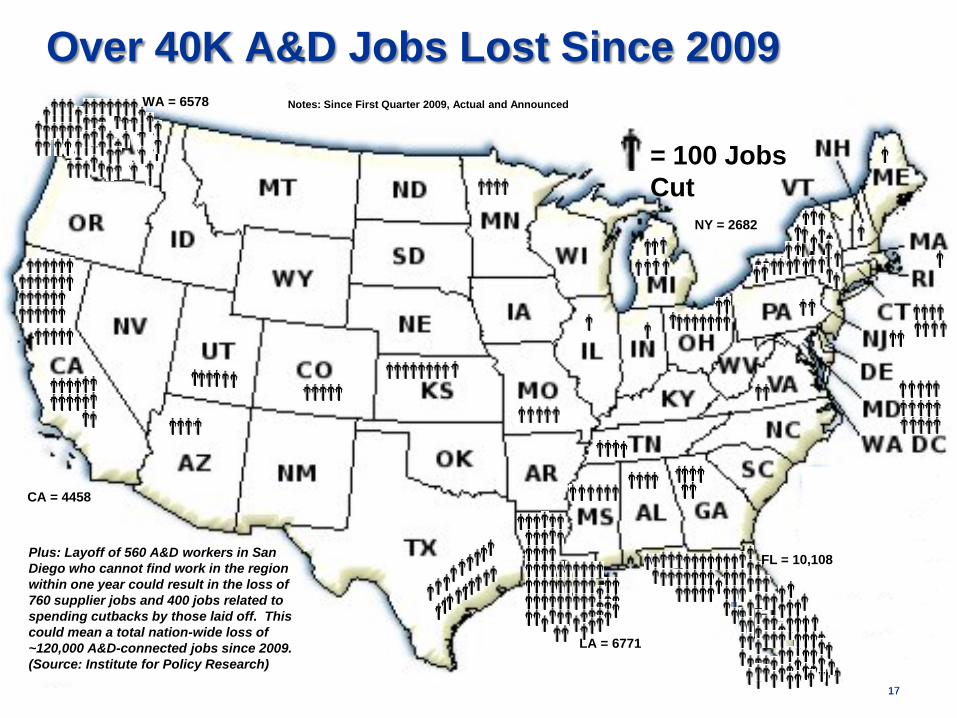
Over 40K A&D Jobs Lost Since 2009Notes: Since First Quarter 2009, Actual and Announced
Plus: Layoff of 560 A&D workers in San Diego who cannot find work in the region within one year could result in the loss of 760 supplier jobs and 400 jobs related to spending cutbacks by those laid off. This could mean a total nation-wide loss of ~120,000 A&D-connected jobs since 2009. (Source: Institute for Policy Research)
WA = 6578
CA = 4458
NY = 2682
FL = 10,108
LA = 6771
17
18
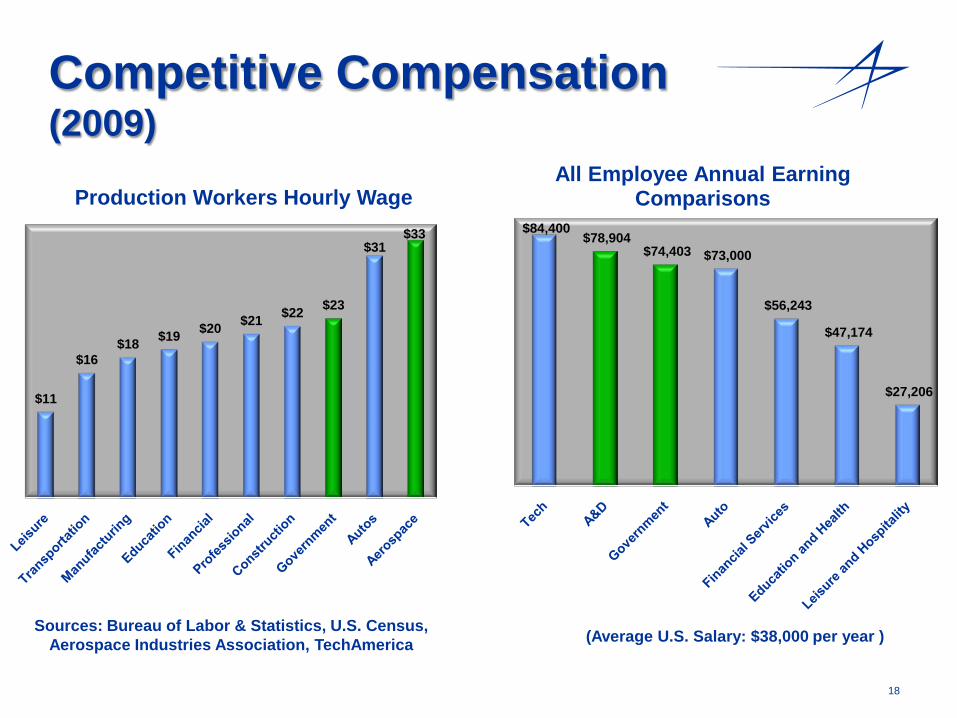
Competitive Compensation(2009)
$84,400 $78,904
$74,403 $73,000
$56,243
$47,174
$27,206
All Employee Annual Earning Comparisons
$11
$16$18 $19 $20 $21 $22 $23
$31$33
Production Workers Hourly Wage
Sources: Bureau of Labor & Statistics, U.S. Census,Aerospace Industries Association, TechAmerica (Average U.S. Salary: $38,000 per year )
19
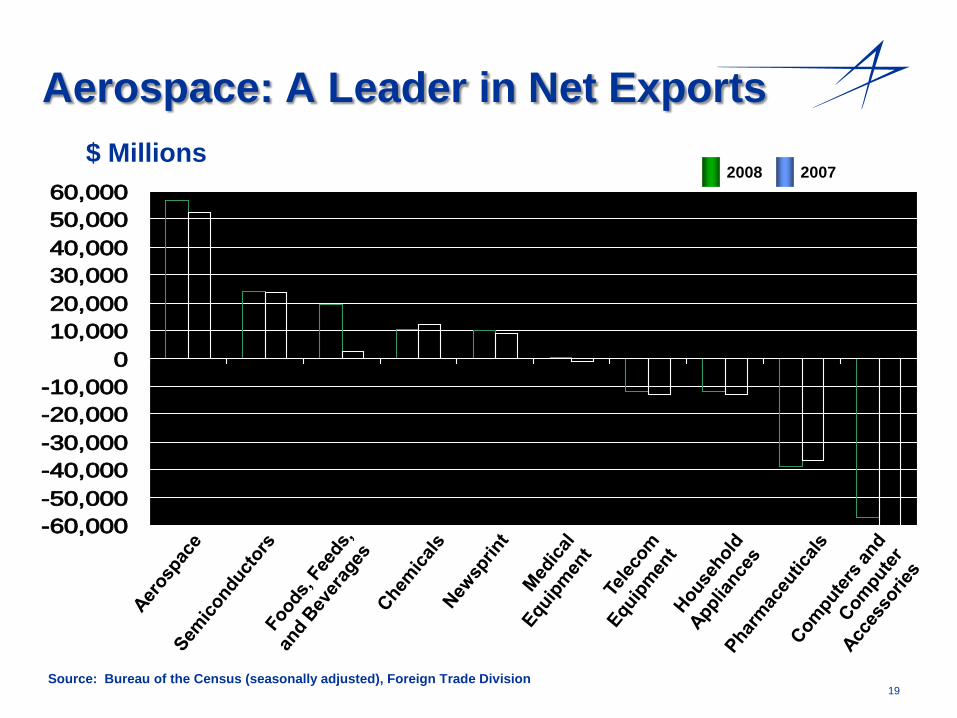
Aerospace: A Leader in Net Exports
-60,000-50,000-40,000-30,000-20,000-10,000
010,00020,00030,00040,00050,00060,000
$ Millions
Source: Bureau of the Census (seasonally adjusted), Foreign Trade Division
20072008
20
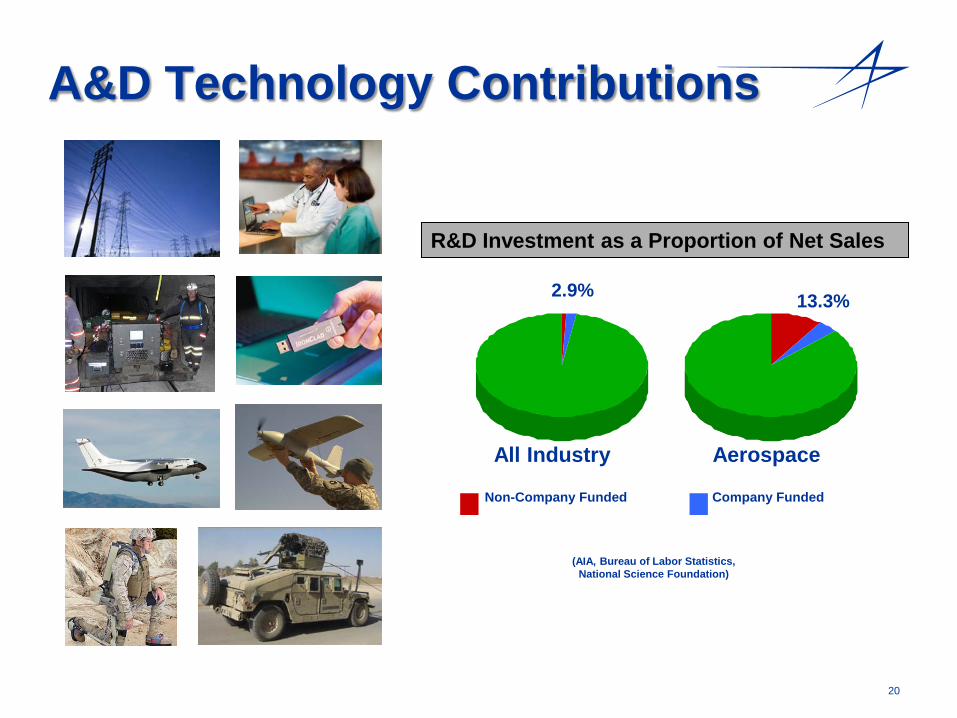
A&D Technology Contributions
(AIA, Bureau of Labor Statistics, National Science Foundation)
R&D Investment as a Proportion of Net Sales
AerospaceAll Industry
2.9% 13.3%
Non-Company Funded Company Funded

21
Airbags
Jeep
Internet
Hydraulic Brakes
Climate Monitoring
Nuclear Power
GPS
Air Traffic Control
Computers
SatelliteCommunications
Jet Engines
CordlessPowerTools
Traffic Cameras
Pagers
EZ Pass
Smoke Detectors
A&D Technology Contributions
Legacy of Innovation and Public Benefit
22
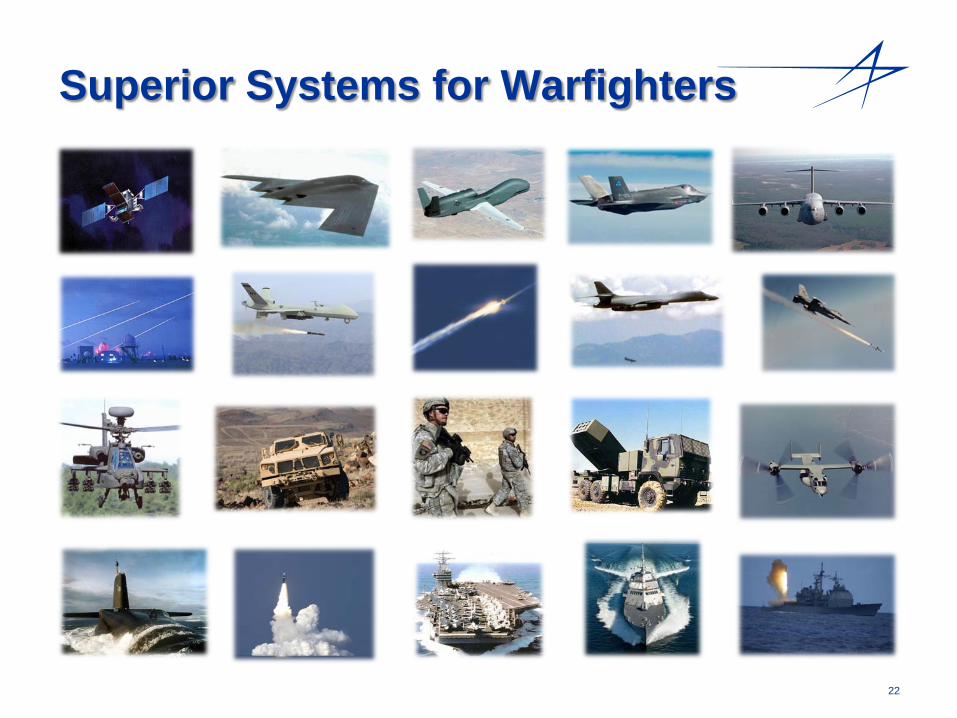
Superior Systems for Warfighters
23
A&D UniqueCharacteristics
24
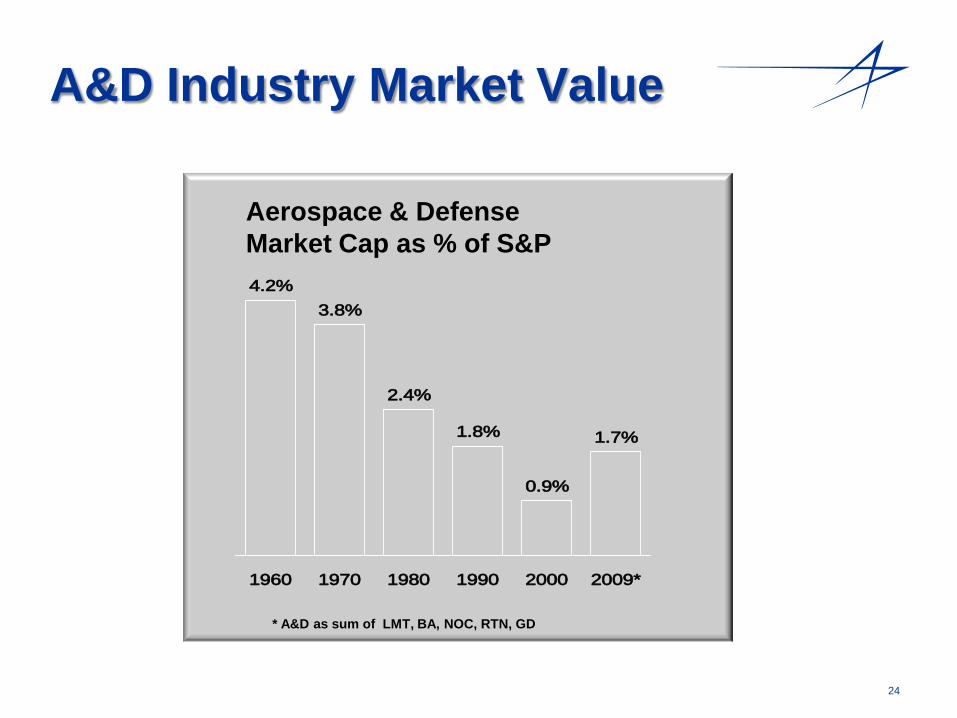
4.2%3.8%
1.8%
0.9%
1.7%
2.4%
1960 1970 1980 1990 2000 2009*
A&D Industry Market Value
Aerospace & Defense Market Cap as % of S&P
Sources: Company Reports, Morgan Stanley, Yahoo! Finance (Includes Commercial Aircraft)
* A&D as sum of LMT, BA, NOC, RTN, GD
25
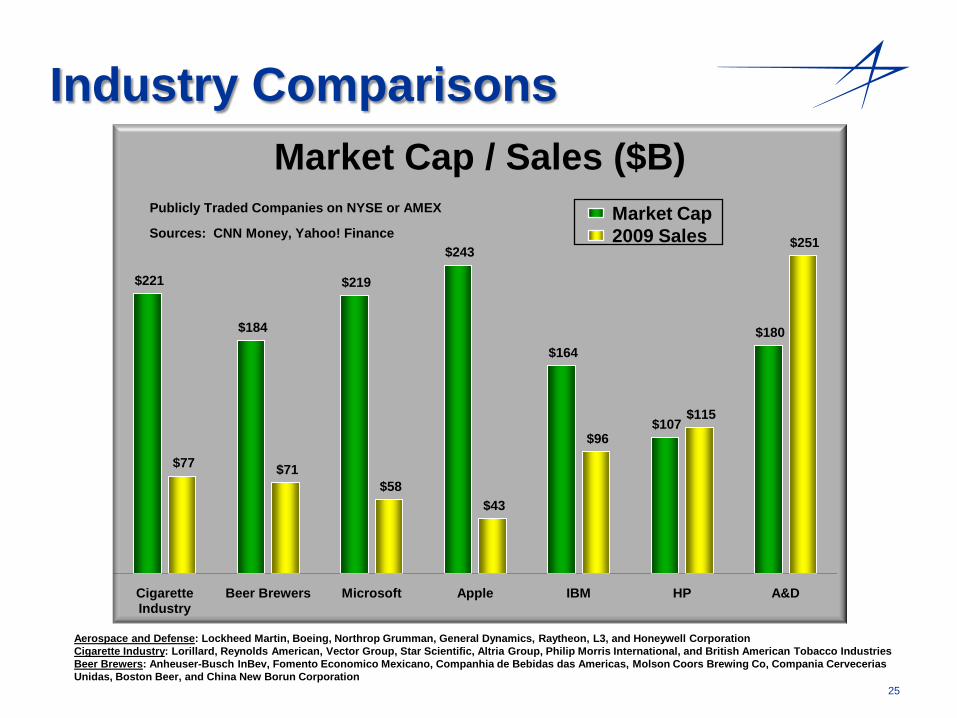
Industry Comparisons
$221
$184
$219
$243
$164
$107
$180
$77 $71 $58
$43
$96
$115
$251
Cigarette Industry
Beer Brewers Microsoft Apple IBM HP A&D
Market Cap / Sales ($B)Market Cap2009 SalesSources: CNN Money, Yahoo! Finance
Aerospace and Defense: Lockheed Martin, Boeing, Northrop Grumman, General Dynamics, Raytheon, L3, and Honeywell CorporationCigarette Industry: Lorillard, Reynolds American, Vector Group, Star Scientific, Altria Group, Philip Morris International, and British American Tobacco IndustriesBeer Brewers: Anheuser-Busch InBev, Fomento Economico Mexicano, Companhia de Bebidas das Americas, Molson Coors Brewing Co, Compania CerveceriasUnidas, Boston Beer, and China New Borun Corporation
Publicly Traded Companies on NYSE or AMEX

26
EBITDA Margin from 2007 – 20091
Gross Earnings Sector Comparisons
Aerospace and Defense Margins Lag Other Industries
0.0% 5.0% 10.0% 15.0% 20.0% 25.0% 30.0% 35.0% 40.0%
A&D
Industrials
Consumer Discretionary
Consumer Staples
Materials
Utilities
Healthcare
IT
Energy
Telecommunications
2007 2008 2009Source: CapitalIQ Note: (1) Analysis includes publicly-traded, US-based companies with revenues >$1B in CY2008
27
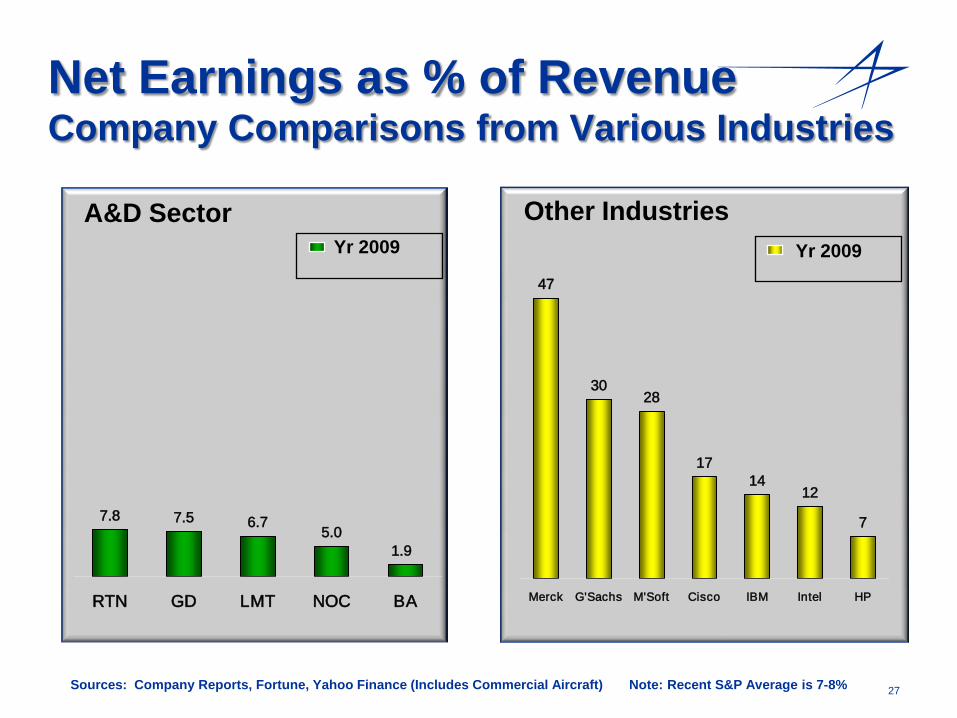
Net Earnings as % of RevenueCompany Comparisons from Various Industries
Sources: Company Reports, Fortune, Yahoo Finance (Includes Commercial Aircraft) Note: Recent S&P Average is 7-8%
Other IndustriesYr 2009 Yr 2009
A&D Sector
7.8 7.5 6.75.0
1.9
RTN GD LMT NOC BA
47
3028
1714
12
7
Merck G'Sachs M'Soft Cisco IBM Intel HP
28
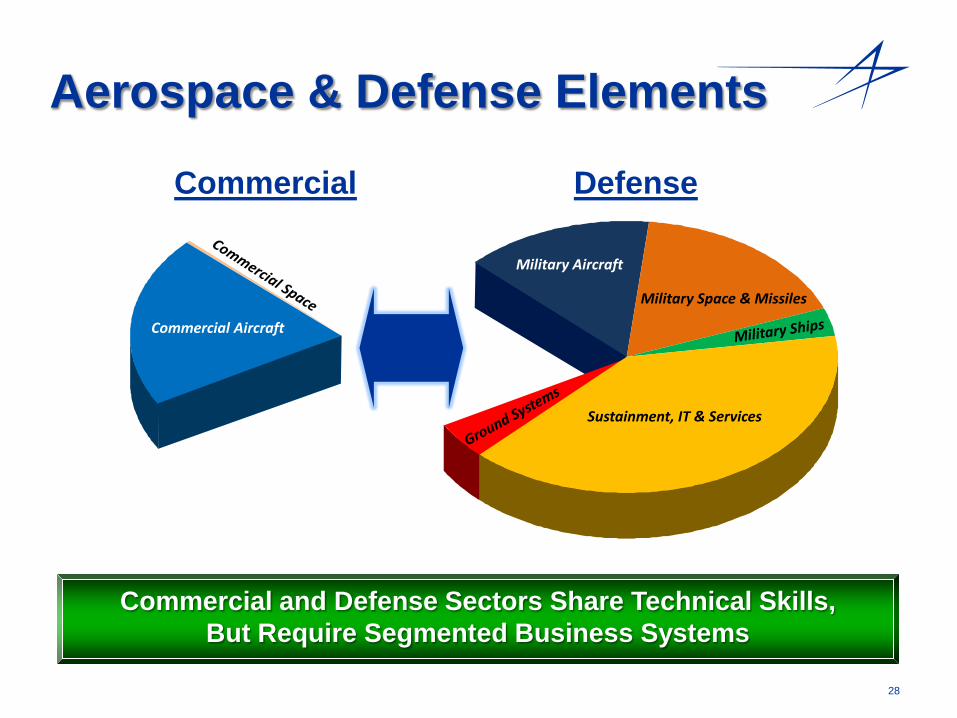
Aerospace & Defense Elements
Commercial Defense
Commercial and Defense Sectors Share Technical Skills,But Require Segmented Business Systems
Military Aircraft
Military Space & Missiles
Sustainment, IT & Services
Commercial Aircraft
29
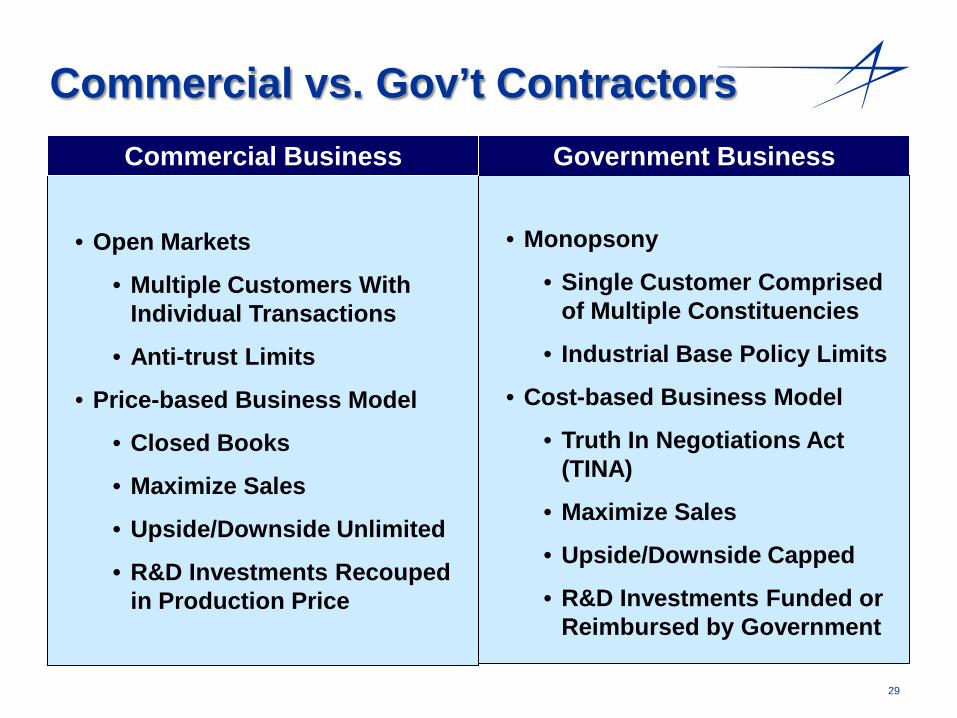
Commercial vs. Gov’t ContractorsGovernment Business
• Monopsony
• Single Customer Comprised of Multiple Constituencies
• Industrial Base Policy Limits
• Cost-based Business Model
• Truth In Negotiations Act (TINA)
• Maximize Sales
• Upside/Downside Capped
• R&D Investments Funded or Reimbursed by Government
• Open Markets
• Multiple Customers With Individual Transactions
• Anti-trust Limits
• Price-based Business Model
• Closed Books
• Maximize Sales
• Upside/Downside Unlimited
• R&D Investments Recouped in Production Price
Commercial Business

30
Commercial vs. Gov’t ContractorsCommercial Business Government Business
• Significant Government Oversight
• Subject To Federal Acquisition Regs
• Export Licenses Required to Sell Overseas
• Annual Funding; Government Policy Driven
• Limited Government Oversight
• Not Subject To Federal Acquisition Regs
• Limited Export Control
• Multi Year Projections; Consumer Driven
31
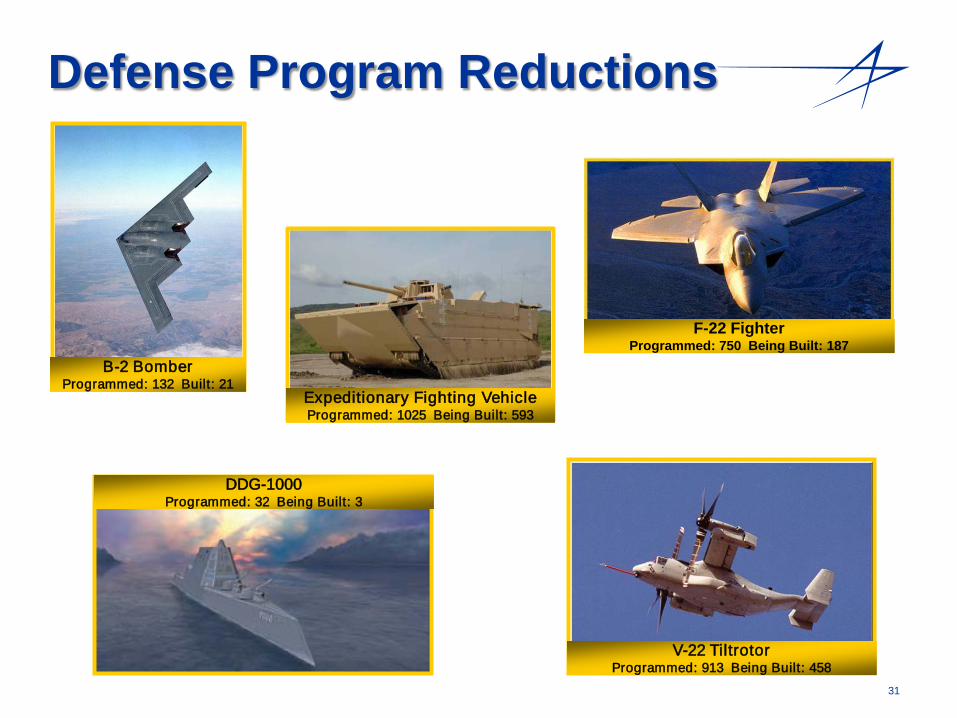
Defense Program Reductions
B-2 Bomber Programmed: 132 Built: 21
V-22 TiltrotorProgrammed: 913 Being Built: 458
F-22 Fighter Programmed: 750 Being Built: 187
DDG-1000 Programmed: 32 Being Built: 3
Expeditionary Fighting Vehicle Programmed: 1025 Being Built: 593
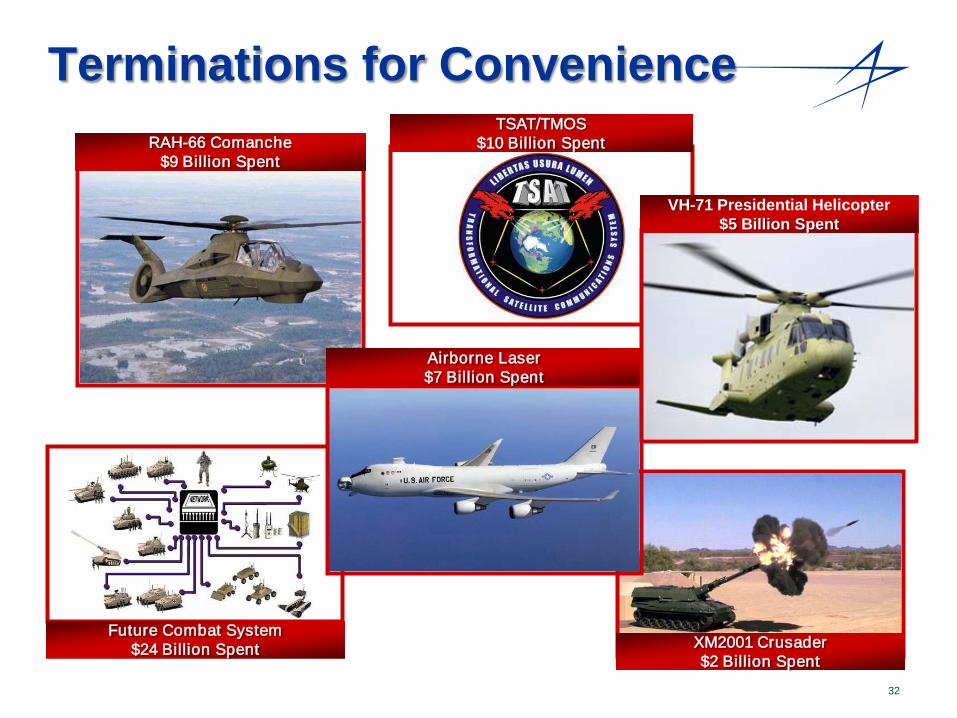
32
Terminations for ConvenienceRAH-66 Comanche
$9 Billion Spent
XM2001 Crusader $2 Billion Spent
Future Combat System $24 Billion Spent
TSAT/TMOS$10 Billion Spent
Airborne Laser $7 Billion Spent
VH-71 Presidential Helicopter$5 Billion Spent
33
Why Invest in the A&D Industry
• Reasonable Returns on Investment
• Strong Cash Flows
• Consistent Dividend Returns
• Longer Term Business Outlook
• Sustainable Revenue Streams
• Government Indemnification from Catastrophic Risk
• Counter Cyclic to the Market
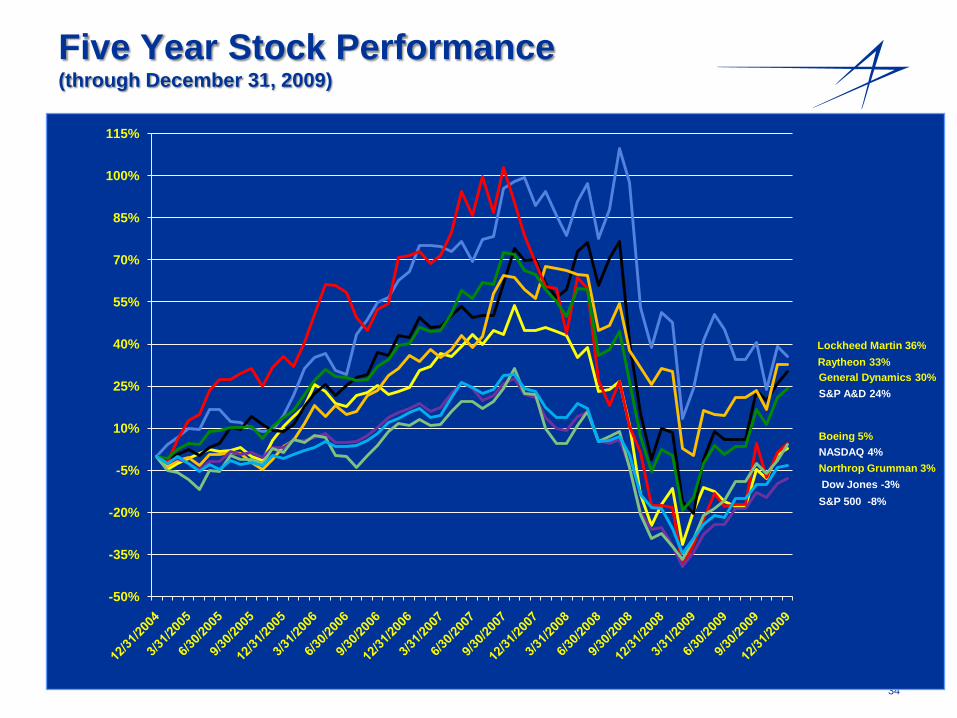
34
Five Year Stock Performance (through December 31, 2009)
General Dynamics 30%Raytheon 33%
S&P 500 -8%
Boeing 5%
Lockheed Martin 36%
Dow Jones -3%
S&P A&D 24%
Northrop Grumman 3%NASDAQ 4%
-50%
-35%
-20%
-5%
10%
25%
40%
55%
70%
85%
100%
115%

35
Defense Contracting Considerations
36
37
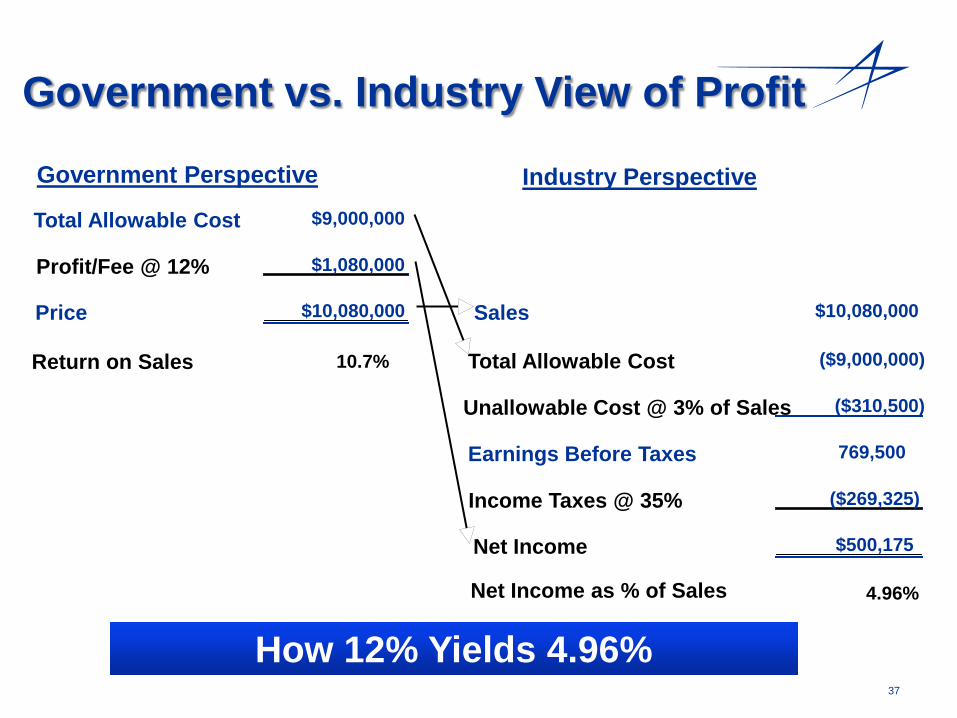
Government vs. Industry View of Profit
Government Perspective Industry Perspective
Total Allowable Cost $9,000,000
Profit/Fee @ 12% $1,080,000
Price $10,080,000 Sales $10,080,000
Total Allowable Cost ($9,000,000)
Unallowable Cost @ 3% of Sales ($310,500)
Earnings Before Taxes 769,500
Income Taxes @ 35% ($269,325)
Net Income $500,175
Net Income as % of Sales 4.96%
How 12% Yields 4.96%
Return on Sales 10.7%
38
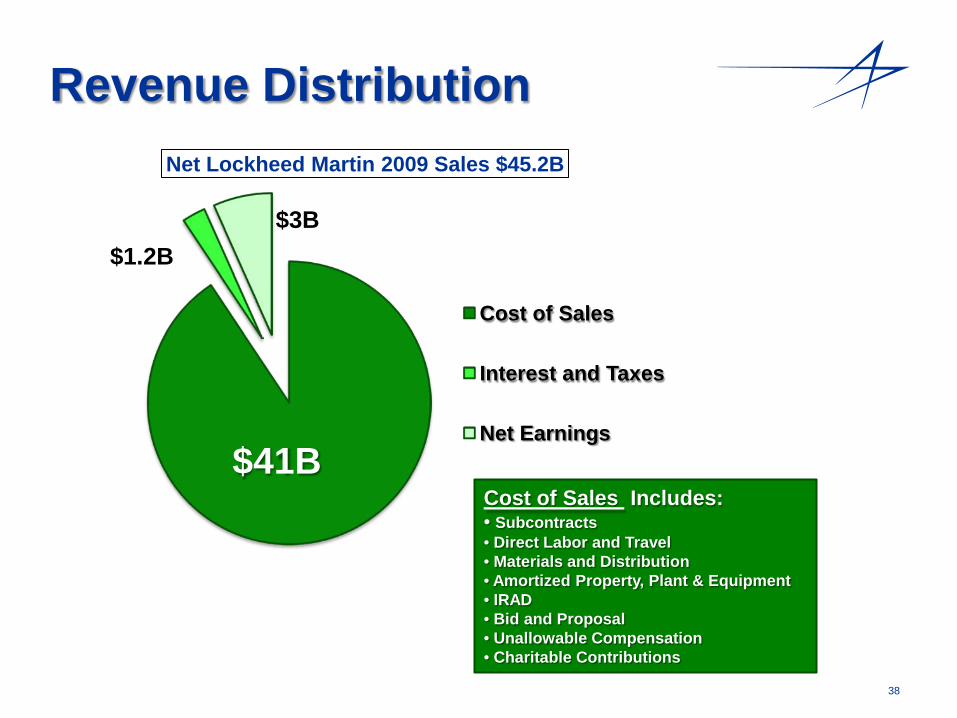
Revenue DistributionNet Lockheed Martin 2009 Sales $45.2B
Cost of Sales
Interest and Taxes
Net Earnings$41B
$1.2B$3B
Cost of Sales Includes:• Subcontracts• Direct Labor and Travel• Materials and Distribution• Amortized Property, Plant & Equipment• IRAD• Bid and Proposal• Unallowable Compensation• Charitable Contributions

39
Cash Deployment
Internal Investment
Debt Retirement
Acquisitions/ VenturesShare
Repurchase
Dividends
Internal Investment: Capital Expenditures (Property, Plant & Equipment)
Working Capital (Inventory, Accounts Receivable / Payable)Pensions
Debt Retirement: Return to Creditors
Dividends: Return to Shareholders
Share Repurchase: Return to Shareholders
Acquisitions: Increase Capabilities
and Capacities
Supports All Stakeholders

40
Summary
41
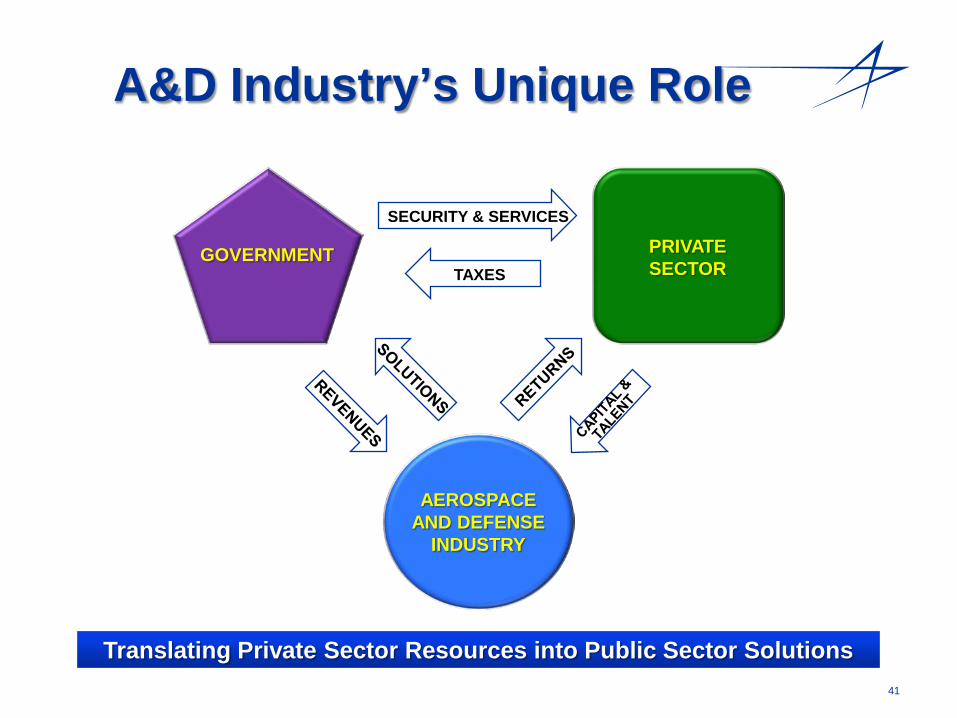
A&D Industry’s Unique Role
SECURITY & SERVICES
TAXESGOVERNMENT
AEROSPACE AND DEFENSE
INDUSTRY
PRIVATE SECTOR
Translating Private Sector Resources into Public Sector Solutions
42
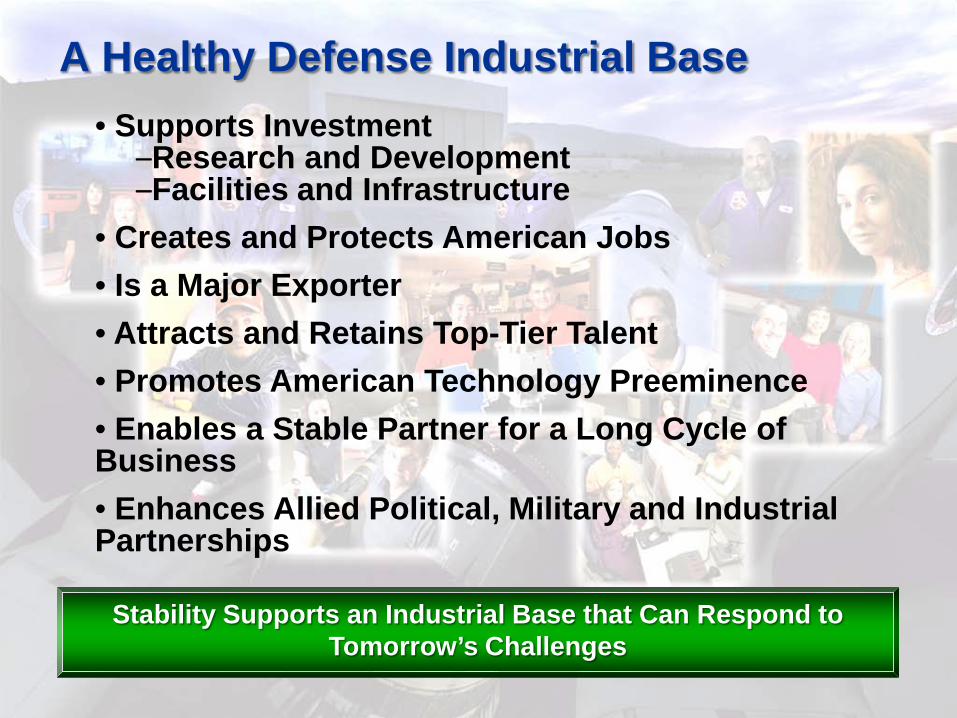
• Supports Investment–Research and Development–Facilities and Infrastructure
• Creates and Protects American Jobs• Is a Major Exporter• Attracts and Retains Top-Tier Talent• Promotes American Technology Preeminence• Enables a Stable Partner for a Long Cycle of Business• Enhances Allied Political, Military and Industrial Partnerships
A Healthy Defense Industrial Base
Stability Supports an Industrial Base that Can Respond toTomorrow’s Challenges