Embed Size (px)
Citation preview

The Business Case for Demand Response
Energy Efficiency Utility Summit Doubletree Hotel –
Portland
11 May 2011
Philip D. LuskPower Resources [email protected]

Today’s Topics
Background
Automated Metering Infrastructure Efforts
Rate Design Efforts
Demand Response Efforts
Outstanding Issues
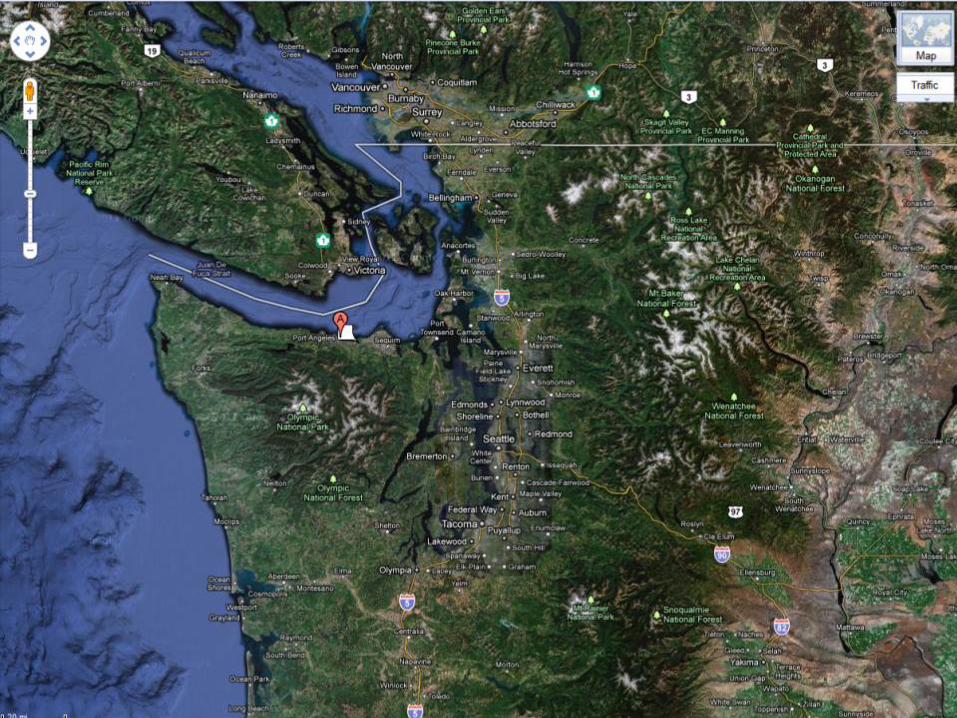


Port Angeles Distribution Utility Forecast
Distribution forecast used two load growth rates
Baseline (Status Quo)
Used historic annual consumption growth rates
Higher-priced "Tier 2" wholesale power purchases projected to start in 2017
Enhanced Conservation Alternate
Used growth rates equal to the Northwest Power and Conservation Council’s Sixth Northwest Conservation and Electric Power Plan goals
Higher-priced "Tier 2" wholesale power purchases projected to start in 2024
Avoided annual 10%-15% increase in wholesale power costs compared to baseline

Reduce Tier-2 with Two Priorities?
Seek all cost-effective conservation as the favored resource for meeting future loads
Least risk and most cost-effective
City Council directed a doubling of conservation program
Rate payer funds provided to help achieve policy objective
Seek additional BPA funding to accelerate the energy savings
Enhanced conservation scenario could also effectively reduce annual demand growth rate to 0%
Pursue renewable energy & cogeneration
Preference for resources located within City limit

Strengths, Weaknesses, Opportunities, Threats
Strengths
Conservation reduced City’s 2009 power purchases by 2.1%, directly saved customers $869,000 and created a net economic benefit of more than $2 million
Weaknesses
Limited current generation resources on the Peninsula
Opportunities
Automated metering infrastructure, enhanced conservation and new renewable choices within City’s service territory
Threats
Strong potential for significant increases in wholesale power costs and decreases in the BPA "Tier 1" power system

Port Angeles’
Dual Challenge
BPA raising regional electricity rates on October 1, 2011
Manage contract demand quantity, load shape, and critical peak periods
The City’s electric and water meters are wearing out
Many under measure what people use

What Port Angeles Needs To Do
Minimize the impact of BPA’s upcoming rate hikes
Give our customers more tools to manage their energy use

What’s the Sensible Next Step?
Replace the old meters with new ones that measure accurately
Provide customers the chance to use power when it’s the least expensive

Automated Metering Infrastructure Efforts
All electric and water meters in City’s service territory replaced with AMI by 2012
10,600 electric meters
8,400 water meters
"Turn-key" solution
Procure and install a complete AMI system using one Vendor with minimum City intervention

AMI System Overview
900 MHz
Mi.Host(SW + Server)
City Utility Billing Software
Customer Web BasedInterface
Customer PDA
Customer Cell
Phone
Metropolitan Area NetworkFiber optics
Water Heater Demand Response
Controller
SmartThermostat
Mi.NodeWater meter
900 MHzMi.Gate (Collector)
Mi.NodeElectric meter
Mi.NodeElectric meter
Mi.NodeWater meter

Immediate Benefits
AMI meters are highly accurate so everyone pays for what they use—it’s fair
The AMI system allows the City to run its electric and water utilities efficiently and at the lowest cost possible
Customers can have more control over their bill
By using power when it’s least expensive

Future-Ready Benefits
State-of-the-art meters will bring more conservation opportunities
In the future, smart appliances and technologies will become more commonplace


Time-of-Use Rate without demand for residential, general service, and non-profit customer classes
Customer base charge
Winter & summer seasons including peak period, off-peak period, and shoulder period energy charges
Demand response credits
Time-of-Use Rate with demand for general service demand and primary customer classes
Customer base charge
Winter & summer seasons including peak period, off-peak period, and shoulder period energy charges
Demand charges during peak period only
Reduced demand charges for demand response participants
New Electric Utility Rate Design

Time-of-Use retail electric rate design
Rate design incorporated into AMI System
BPA wholesale rate increase expected October 1, 2011
Retail rates determined Fall 2011
Retail rates effective 2012
Encourages all electric customers to
Reduce winter energy consumption
Shift peak period consumption to lower-priced shoulder and off-peak periods
Participate in voluntary demand response programs
New Rate Design Schedule
0%
10%
20%
30%
40%
50%
60%
70%
80%
90%
100%
6 7 8 9 10 11 12 13 14 15 16 17 18 19 20 21 22
Cum
ulat
ive
Rel
ativ
e Fr
eque
ncy
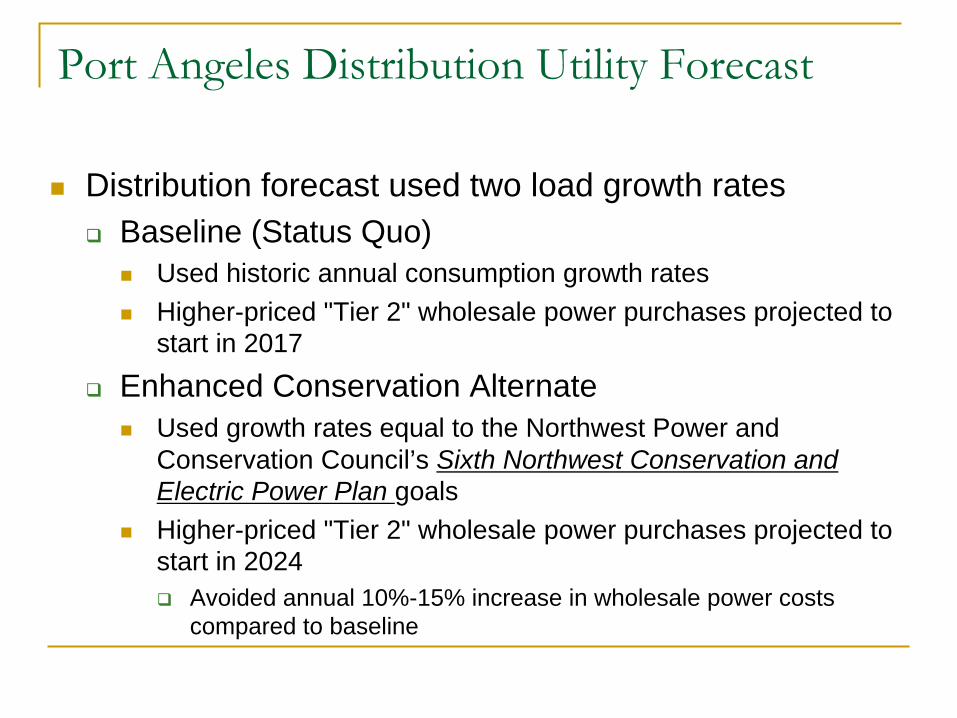
Peak Hours (6:00:00 am - 9:59:59 pm)
Distribution System Peak Demand (January 1990 - October 2010)
Shoulder HoursPeak Hours

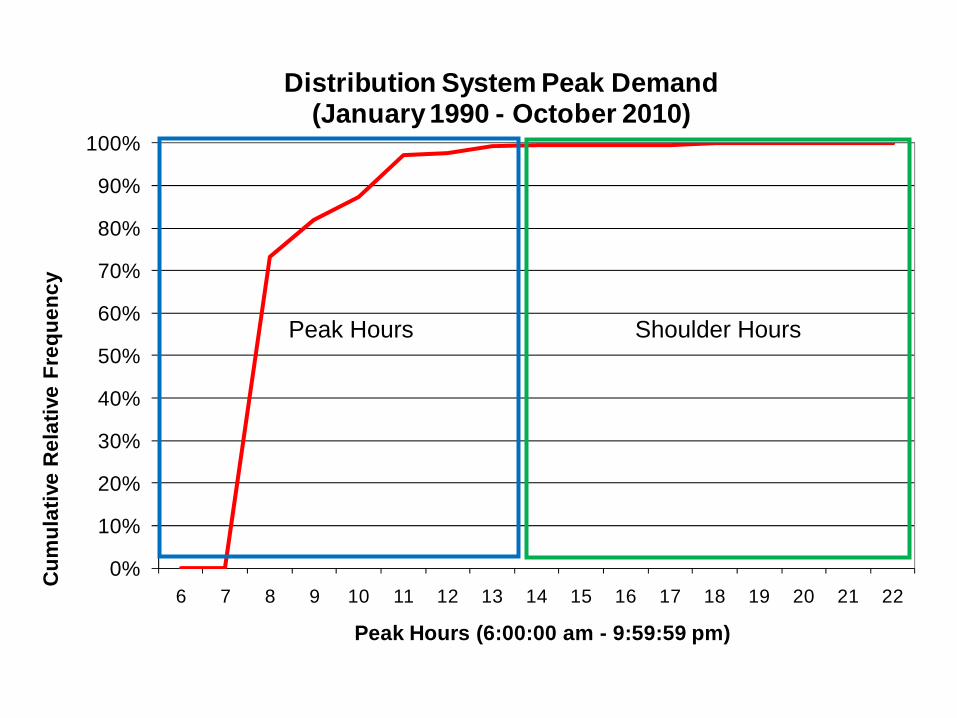
City Peak Hours, Shoulder Hours, Off-Peak Hours, and Demand via 24-Hour Timeclock
12
3
4
5
6
7
8
9
1011Noon13
14
15
16
17
18
19
20
21
2223 Mid
Sundays & NERC Holidays
Lowest CostOff-Peak Hours
Only Energy Metered
12
3
4
5
6
7
8
9
1011Noon13
14
15
16
17
18
19
20
21
2223 Mid
Highest CostPeak Hours
Energy & Demand Metered
Medium CostShoulder Hours
Only Energy Metered
Lowest CostOff-Peak Hours
Only Energy Metered
Monday Through Saturday

Voluntary Demand Response Efforts
Customer-Side*
Residential DR Pilot (600 customer units)
Water heaters, home area networks, thermal storage
Residential Wind Integration Pilot (41 customer units)
Water heaters, thermal storage
Commercial & Industrial DR Pilot (8 customers)
Open Automated Demand Response Communication Standards (OpenADR) communications protocol
Industrial Wind Integration Pilot (1 customer)
Utility-Side
Voltage Optimization (VO)
Use AMI to monitor and report lowest end-of-line feeder into City’s SCADA system
* Made possible with the support of the Bonneville Power Administration
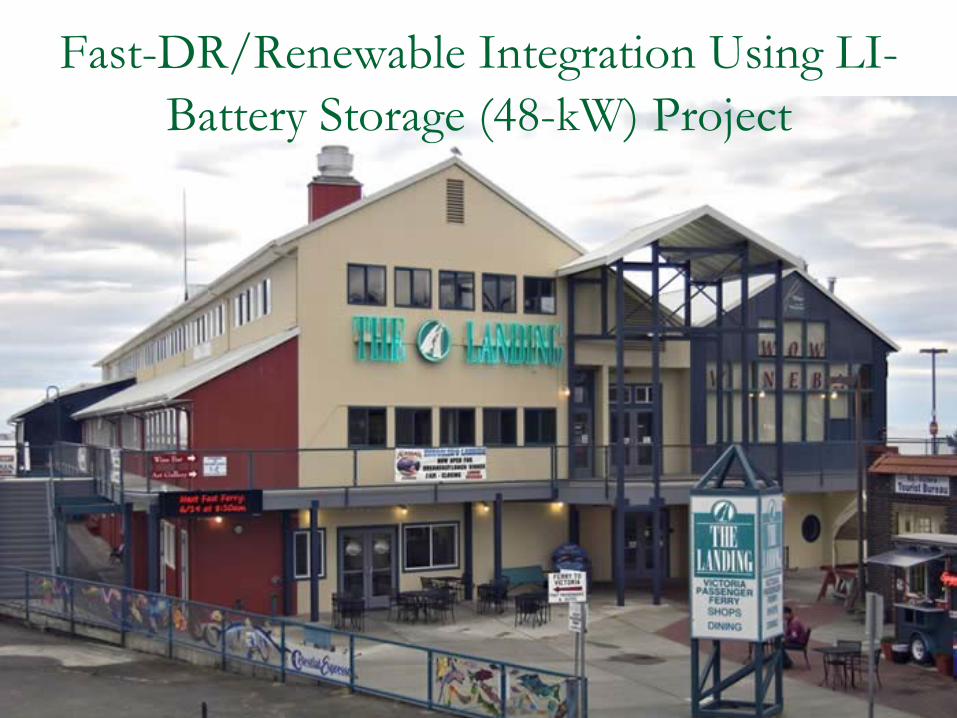
Fast-DR/Renewable Integration Using LI- Battery Storage (48-kW) Project

Inverter for LI-Battery Storage Project

Integrating Renewables
-——The Landing

Thermal Battery Energy Storage Projects
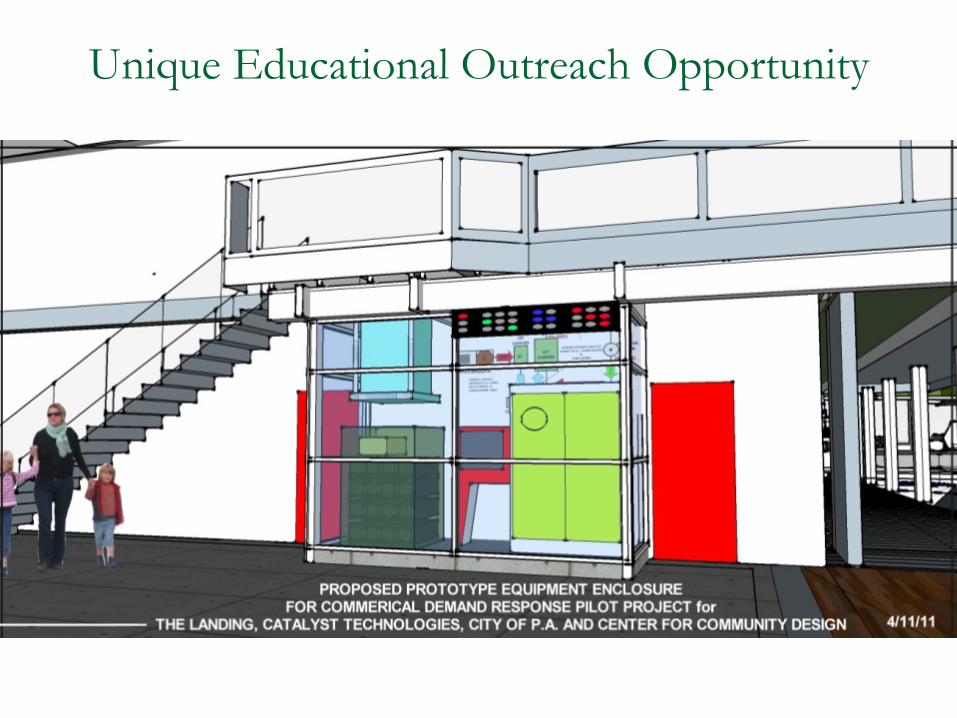
Unique Educational Outreach Opportunity


ISSUE: Current Demand Response Strategies
DR 1.0 - Load Shedding
Simple, shuts off a device during peak events, typically fewer than 10 times/year
DR 2.0 - Load Shifting
More sophisticated, moves loads away from heavy load hours and system demand peaks, sometimes by preheating or precooling, other times by delaying an activity (clothes dryers, dishwashers, etc.)

ISSUE: Load-Shape Nirvana?
DR 1.0 Load Shedding
Simple, shuts off a device during peak events, typically fewer than 10 times/year
DR 2.0 Load Shifting
More sophisticated, moves loads away from heavy load hours and system demand peaks, sometimes by preheating or precooling, other times by delaying an activity (clothes dryers, dishwashers, etc.)
DR 3.0 Load Shaping
Very sophisticated, constantly fine-tunes system consumption and demand in real time to resemble generation system load shape


ISSUE: Who’s The Change Agent?
Recent survey findings
73% of consumers surveyed would consider buying electricity from a company other than their local utility
A value-add opportunity for utilities?
Consumers also indicated they would consider buying in-home energy products and services from non-traditional providers
If utilities pair up with an outside services provider, could it be a win-win for both?
Another utility wake-up call: Consumers willing to shop around: http://www.smartgridnews.com/artman/publish/Business_Customer_Care/Another-utility-wake-up-call-Consumers-willing-to- shop-around-3617.html


ISSUE: What Customer’s Don’t Want?
The last thing I want is…
Power companies to monitor and potentially restrict the amount of energy consumed each hour of the day with ‘time-of-use’ billing
Not being provided with clearly understood information about the RF emissions of all devices, including smart meters and DR sub-equipment
Breach of privacy or security
Financial and billing hassles
Property damage risks


ISSUE: What Customer’s Want?
57% of consumers surveyed would use an electricity management program even if it didn't cut their utility bills
Almost a third would pay a little more
While cost is an issue
Consumers getting interested in convenience of automated energy management
Being able to download apps on their cell phone and have mobility to track their energy use
Another utility wake-up call: Consumers willing to shop around: http://www.smartgridnews.com/artman/publish/Business_Customer_Care/Another-utility-wake-up-call-Consumers-willing-to- shop-around-3617.html

ISSUE: What Customer’s Want?
Research in 2010 pointed to a focus on in-home displays as a high value-add product
The 2011 trend is moving to more set-it-and-forget-it convenience
A gender difference
Men tend to focus on technology channels, while women are more focused on solutions that are intuitive and easy to use

ISSUE: What Customer’s Want?
Consumer preferences driving the need for differentiated propositions and experiences
For utilities, this means "one size does not fit all"
Additionally, more than 60% of the surveyed customers do not want a heavy, hands-on management of their energy savings
Tailoring the programs, products and channels to match customer segments is most important

ISSUE: What Customer’s Want?
Consumers will respond to programs that consider their full spectrum of values and preferences
Programs that are easy to use, simple and convenient, and with some "uniqueness" or customization to fit their own personal needs

Phil LuskPower Resources Manager
Public Works & Utilities [email protected]
360.417.4703http://www.cityofpa.us


BPA Energy Efficiency Utility Summit
May 11, 2011
The Business Case for Demand Response
Rob CurrierCommercial Energy Services
Emerald People’s Utility DistrictEugene, OR

EPUD PowerSync Pilot: A Study in Residential Demand Response
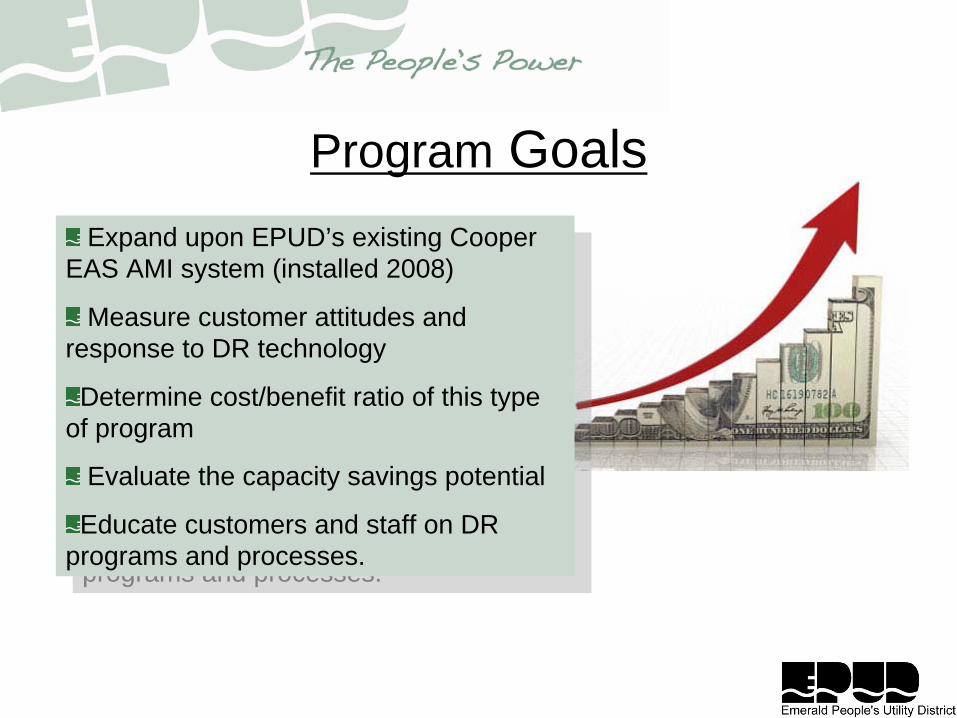
Program Goals
Expand upon EPUD’s existing Cooper EAS AMI system (installed 2008)
Measure customer attitudes and response to DR technology
Determine cost/benefit ratio of this type of program
Evaluate the capacity savings potential
Educate customers and staff on DR programs and processes.
Expand upon EPUD’s existing Cooper EAS AMI system (installed 2008)
Measure customer attitudes and response to DR technology
Determine cost/benefit ratio of this type of program
Evaluate the capacity savings potential
Educate customers and staff on DR programs and processes.

Program Details
200 Communicating Programmable Thermostats (UtilityPRO)
200 Water Heater Control Switches (LCR-5000)
10 Steffes Communicating In-Room Heaters
10 Steffes Water Heater Energy Storage Devices

Program DetailsOne-way radio frequency pagingDR Devices run in Cooper EAS Yukon Software
Cooper EAS Thermostat• Cycling and Ramping Controls
Cooper EAS Water Heater Switch• Timed On/Off Controls
All adjustments, or “demand savings events” pre-scheduledAbout 20 events per yearEvents to begin second half of June 2011Participants can opt out of any event as neededOne-time enrollment bonus in welcome kit.
One-way radio frequency pagingDR Devices run in Cooper EAS Yukon Software
Cooper EAS Thermostat• Cycling and Ramping Controls
Cooper EAS Water Heater Switch• Timed On/Off Controls
All adjustments, or “demand savings events” pre-scheduledAbout 20 events per yearEvents to begin second half of June 2011Participants can opt out of any event as neededOne-time enrollment bonus in welcome kit.
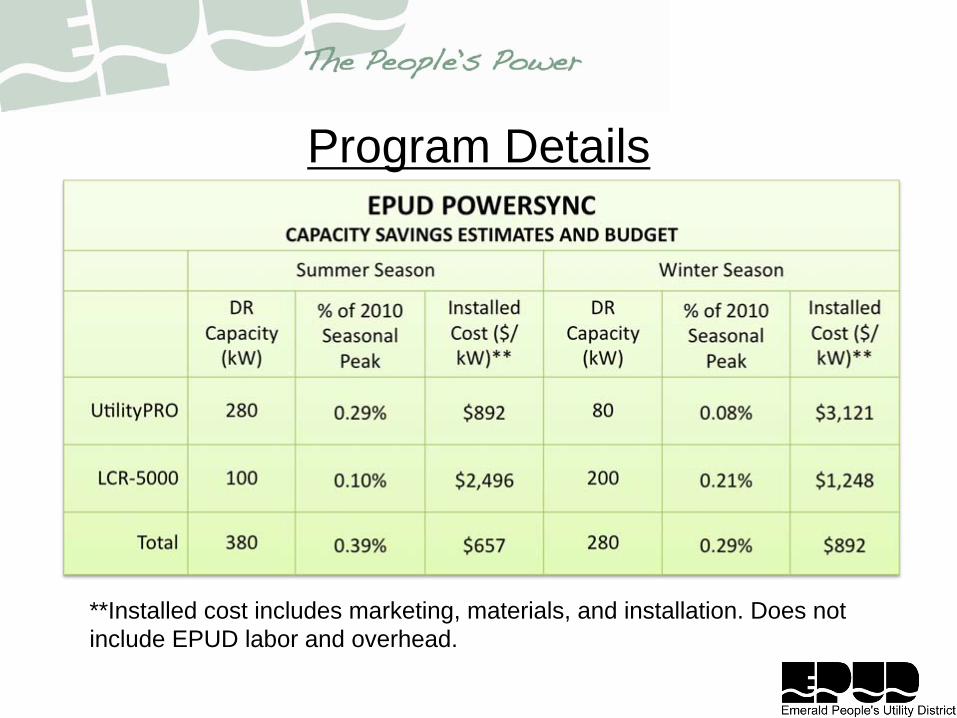
Program Details
**Installed cost includes marketing, materials, and installation. Does not include EPUD labor and overhead.

Marketing/Outreach
Webpage
News Release
Monthly Newsletter (to all customers)
Direct Mail (to target group)
Event Promotion
E-Blast (to electronic list)
Social Media Marketing
Webpage
News Release
Monthly Newsletter (to all customers)
Direct Mail (to target group)
Event Promotion
E-Blast (to electronic list)
Social Media Marketing

Public Response (Positive)

Public Response (Negative)

Marketing/OutreachChallenges
Response has been overwhelmingly positive, but negative response is VERY negative.
Complex messaging challenges
Next…?
Keeping the Momentum
Response has been overwhelmingly positive, but negative response is VERY negative.
Complex messaging challenges
Next…?
Keeping the Momentum
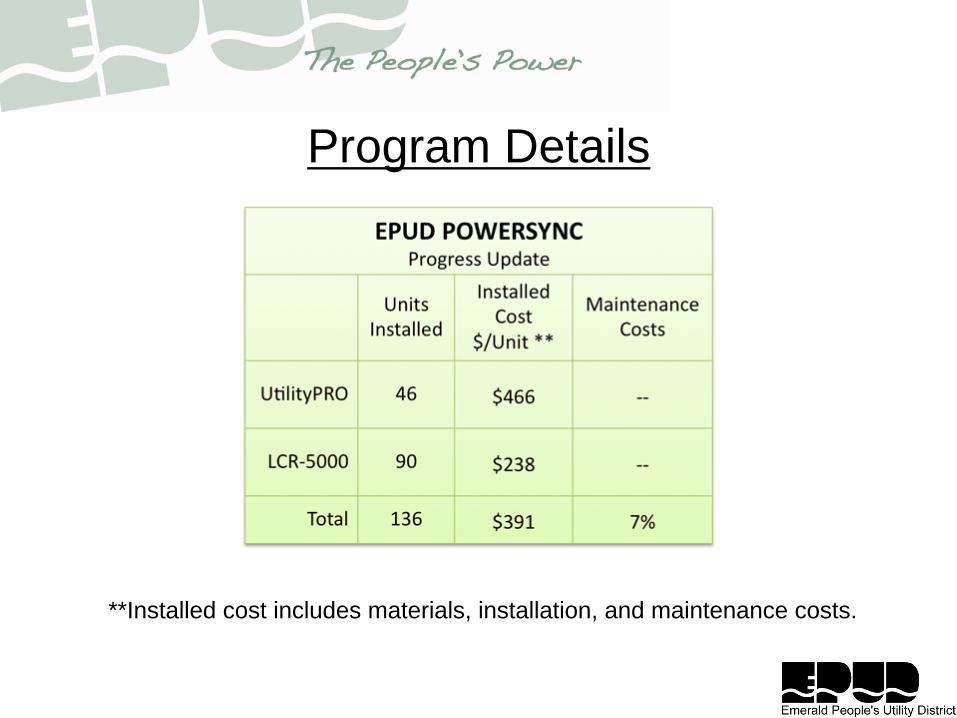
Program Details
**Installed cost includes materials, installation, and maintenance costs.

Installation ExperienceUpdated 5/2/2011
End Status CodesFailed-1: OSA Temp SensorFailed-2: Old/Broken ApplianceFailed-3: Customer refusedFailed-4: Wrong EligibilityFailed-5: Physical SpaceFailed-6: Ductless

Installation ExperienceChallenges
Installation scheduling has taken a long time.
Selection of installer was time consuming. Inadequate contractor response.
Thermostat not compatible with many late model heat pump installations. Outside air temperature sensor.
~ 30% of scheduled Tstat installs have been turned down.
Interesting and unexpected costs of residential installations.

Next StepsInstalls, Installs, Installs
Demand Savings Events Communication for June
Establishing plan for ongoing customer communicationSite MeetingsSpecialized Newsletter?
Installing some basic M&V equipment
Re-visiting EPUD internal DR organization
Full summer demand response season to begin June 2011
Installs, Installs, Installs
Demand Savings Events Communication for June
Establishing plan for ongoing customer communicationSite MeetingsSpecialized Newsletter?
Installing some basic M&V equipment
Re-visiting EPUD internal DR organization
Full summer demand response season to begin June 2011