Embed Size (px)
Citation preview

The Business Journal
Volume 3 Issue 2 July-December 2015 ISSN 2319-1740
UNNATI1. A Review of Literature on Employee Engagement in Organizations 1
Dr. Dharmendra Mehta, Dr Naveen K Mehta
2. Demography and Conflict Levels of Indian Managers 6
Aruna B.Bhat, Santosh Rangnekar, Mukesh Kumar Barua
3. Entrepreneurship Development in Indian Retail Sector: A Study of Business Models in the Global Context 14
Dr S.R. Subba Rao, Dr Y. Madhuri Srinivas
4. Strategic Design Information Systems for Increasing Competitiveness of Small Mexican Business: 21
Vision Based on the Theory of the Firm and Resources
Dr. Jose G. Vargas-Hernandez, Andres Jerson Millan-Lopez
5. A Study of Corporate Social Reporting of the Market Leaders 27
Dr. Sumita Shroff Goyal
6. Effect of FII on Indian Securities Market 44
Rajani B Bhat, Dr. Geetha C A
7. The Role of Islamic Finance in Enhancing Economic Growth-Insights from Literature 50
Mosab I. Tabash, Raj S. Dhankar
8. Green Ads and their Impact on Consumer Awareness towards Environment Protection 58
Dr. Leena Painter, Bhuvana Venkataraman, Sunita Bharatwal
9. Effect of Humorous Advertisements on Customer Behavior 65
Dharmesh Motwani, Khushbu Agarwal
10. Green Marketing - New Hopes and Challenges 70
Mohammed Naveed U, Syed Yaseen, Dr. Ghousia Khatoon
11. Emerging Dimensions in Accounting and Finance 74
Dr. Pushpkant Shakdwipee
12. Perception of Investors in Hilly Regions: Experiences from India and Bhutan 78
Shubhro Michael Gomes

Shri B.R. AgrawalChairperson
PAHER University
Prof. Mahima BirlaGroup Editor
Prof. Nawal KishorProfessor & DeanSOMS, IGNOU
New Delhi
Mr. Nikhil SanghaniAsst. Gen. Manager, Procurement
Larsen & Toubro LimitedMumbai
Shri Rahul AgrawalSecretary
PAHER University
Dr. Pallavi MehtaEditor - in - Chief
Prof. DPS VermaFormely Professor of Commerce
Delhi School of EconomicsDelhi University
Dr. Asha Galundia
Prof. Rajeev JainDean & Head
Faculty of Commerce & ManagementUniversity of Kota, Kota
Prof. G.M.K. MadaniProfessor Emeritus, Pacific University
Shri Ashish AgrawalFinance SecretaryPAHER University
Prof. Dipin MathurAssociate - Editor
Prof. C.P. ShrimaliProfessor HRM
Management Development InstituteDelhi University, Gurgaon
Prof. Kartik DaveAssociate Professor
School of Business PublicPolicy and Social Entreprencurship
Ambedkar, University, Delhi
Mr. Sharad KothariRegistrar
PAHER University
Prof. B.P. SharmaPresident
PAHER University
Patrons
Editorial Board
Advisory Board
Circulation Manager
All Rights Reserved.
ISSN 2319-1740
© Faculty of Management
Articles published in Unnati can not be reproduced or reprinted in any from, either in full or in part, without prior written permission from the Editor. Views and data published in Unnati are sole responsibility of authors.
Jurisdiction : All disputes are subject to Udaipur Jurisdiction only.
Published by : PACIFIC INSTITUTE OF MANAGEMENT & TECHNOLOGY
Printed by : YUVRAJ PAPERS, Near Bapu Bazar, Udaipur
FACULTY OF MANANGEMENTUnnati - The Business Journal
A Half Yearly Refereed research Journal on management, published by Faculty of Management. It brings you critical perspectives, case studies, research analyses, serving as an outlet for the best theoretical and research work.
A Half Yearly Refereed Journal of Management Published byFaculty of Management

A Review of Literature on Employee Engagement in Organizations
Dr. Dharmendra Mehta*, Dr Naveen K Mehta**
*Reader, FMS, Pt JNIBM, Vikram University, Ujjain, M.P ** Associate Professor MIT, Ujjain, M.P
Introduction
It is of extreme significance for an organization to identify the engagement levels among the employees. The concept of employee engagement is a measurement of how happy employees are with their respective jobs, working environment and how efficient their performance levels are. Managing high morale among employees can be of remarkable benefit to any organization, as actively engaged workers are more productive and stay loyal to the company. Companies that encourage or engage their employees to provide ideas and suggestions have consistently higher employee retention rates, productivity and job satisfaction. Organizations with high employee engagement levels are more productive and more profitable than those organizations with low levels of employee engagement.
Objectives & Research Methodology
The present paper aims to understand the basic concept of employee engagement and to study the different dimensions of employee engagement with the help of review of literature. This paper is based upon review of literature and secondary data collected from various websites, journals, magazines, newspapers and reference books. Literature review has shown prior research work done in this area.
Limitations
There are limitations to this review of the literature. Research was also limited to peer-reviewed business, organizational psychology, and management journals, online journals to identify the state of the employee engagement practices at work and to study the different dimensions of employee engagement with the help of review of literature.
Conceptual Contribution
Kahn (1990) defined employee engagement as “the harnessing of organization members' selves to their work roles; in engagement, people employ and express themselves physically, cognitively, and emotionally during role performances”. The cognitive aspect of employee engagement concerns employees' beliefs about the organization, its leaders and working conditions. The emotional aspect concerns how employees feel about each of those three factors and whether they have positive or negative attitudes toward the organization and its leaders. The physical aspect of employee engagement concerns the physical energies exerted by individuals to accomplish their roles. In 1999, the book 'First Break all the Rules' (Buckingham & Coffman) helped the term 'employee engagement' become popular in the corporate world.
Lockwood (2007) stated that employee engagement could be considered as cognitive, emotional and behavioral. Cognitive engagement refers to employees' beliefs about the company, its leaders and the workplace culture. The emotional aspect is how employees feel about the company, the leaders and their colleagues. The behavioral factor is the value added component reflected in the amount of efforts employees put into their work.
According to Maslach et al. (2001), six areas of work-life lead to either burnout or engagement: workload, control, rewards and recognition, community and social support, perceived fairness and values. They argue that job engagement is associated
The term 'employee engagement' has evolved out of the fairly long studies on traditional HR areas such as- job satisfaction, job involvement, work motivation, job enlargement & organizational commitment. Employees must be able to engage their cognitive, emotional and physical dimensions in their respective area of jobs. It is the focal point of employee engagement concept. Motivated and engaged employees tend to contribute more in terms of organizational productivity and support in maintaining a higher commitment level leading to the higher customer satisfaction. Employees Engagement permeates across the employee-customer boundary, where revenue, corporate goodwill, brand image are also at stake. This paper makes an attempt to study the different dimensions of employee engagement with the help of review of literature. This can be used to provide an overview and references on some of the conceptual and practical work undertaken in the area of the employee engagement practices.
Keywords: Organisation, Employees Engagement. Performance, Relationship
1

Recent Research Contribution
Sandeep Kular et al (2008) explored Five key areas: What does 'employee engagement' mean? How can engagement be managed? What are the consequences of engagement for organizations? How does engagement relate to other individual characteristics? How is engagement related to employee voice and representation? Gemma Robertson-Smith and Carl Markwick (2009) throw light on what engagement is and reveals that it is an important yet complex challenge, and there remains a great deal of scope for discussing the various approaches.
Simpson Michelle R. (2009) discussed that the current state of knowledge about engagement at work through a review of the literature. This review highlighted the four lines of engagement research and focuses on the determinants and consequences of engagement at work. Susi.S and Jawaharrani.K (2011) examined some of the literature on Employee engagement, explore work-place culture & work-life balance policies and practices followed in industries in order to promote employee engagement in their organizations to increase their employees' productivity and retain them. Work-life balance is key driver of employees' satisfaction.
Ram & Gantasala (2011) investigated the antecedents and consequences of employee engagement in Jordanian Industry. Neeta Bhatla (2011) focused on the need for such employees and how their presence can improve the progress and work efficiency of the organization as a whole. Also focused on the challenges faced by the HR managers to improve employee engagement for an organization's survival.
Tiwari S. (2011) reinforced the importance of employee communication on the success of a business. She revealed that an
with a sustainable workload, feelings of choice and control, appropriate recognition and reward, a supportive work community, fairness and justice, and meaningful and valued work.
Wellins and Concelman (2004) remarked that feelings and attitudes employees have towards their jobs and their organization is employee engagement. Robinson, Perryman and Hayday (2004) explained engagement as a positive attitude held by the employee towards the organization and its values. Development Dimensions International (DDI), (2005) highlighted Employee Engagement as the extent to which people value, enjoys and believes in what they do.
Macey and Schneider (2008) distinguished three broad conceptualizations of employee engagement, namely state, trait, and behavioral engagement. According to the conceptual framework of employee engagement as proposed after the research conducted by Blessings White and HR Anexi, engaged employees can be categorized into the following types depending on their satisfaction levels and contribution to the organization.
2
Table No. 1 : Employees' Satisfaction Levels & Segment Wise Contribution
Segment
The Engaged
AlmostEngaged
Honeymooners& hamsters
Crush & Burn
TheDisengaged
Satisfaction
High
Medium toHigh
Medium toHigh
Medium toHigh
Medium toLow
Medium toHigh
Low
Low
Low to medium Most disconnected to the organizational priorities. Engaged increating contagious environment.
Disillusioned and potentially exhanusted. These employees are high producers, but they grow bitter due to lack of personal satisfaction. They many become bitter about the fact that management is not making the right decision, or the collegues do not give them the right value.
1. Honeymooners are new to the organization or their rolc.This phase lasts for 12 to 18 months. Emplyees are satisfied with their work but people are still to find their stride and how to contribute fully to the organizational goal.2. hamsters are more tenured individuals, who may perceive them to be highly contributing to organizational goals, but in effect are "spinning their wheels", and contributing very little to the success of the organization.
These employees are among high performers, and are reasonably satisfied with their current job. They are great at risk taking.
These employees are at the apex, they contribute strongly to the organization, and find great satisfaction in their work. They are ready to take initiative and are committed to the organization.
High
Contribution Description
Source : www.blessingwhite.com

organization should realize the importance of employees, more than any other variable, as the most powerful contributor to an organization's competitive position. Sundaray, B.K. (2011) focused on various factors which lead to employee engagement and what should company do to make the employees engaged. Proper attention on engagement strategies will increase the organizational effectiveness in terms of higher productivity, profits, quality, customer satisfaction, employee retention and increased adaptability.
Abhijit & Roy (2012) explored implications for theory, further research and practices by synthesizing modern 'Employee Engagement' activities being practiced by the corporate with the review of findings from previous researches / surveys. Singh & Shukla (2012) tried to find out what variables are significant to create an engaged workforce. The study was exploratory in nature and the data has been collected from a tin manufacturing organization.
Key Drivers of Employee Engagement
There are some key drivers which lead to employee engagement. These drivers are common to all organizations, regardless of sector. These drivers develop a feeling of value and involvement among the employees.
In 2006, The Conference Board published an article 'Employee Engagement – A review of current research and its implication' on the basis of some major studies conducted by Gallup, Towers Perrin, Blessing White, The Corporate Leadership Council and others. It identified following key drivers related to employee engagement as:
· Trust and integrity – Managers should communicate well and go by their words.
· Nature of the job – Employees should find their job challenging enough to motivate themselves.
· Line of sight between employee performance and company performance – Employee should have clear understanding as to how they contribute to the company's performance.
· Career growth opportunities – Employees should have clear career path and growth.
· Pride about the company – Employees should feel esteemed by being associated with the organization.
· Coworkers/team members – Relationship with colleagues significantly increase employee engagement level.
Relationship between Employee Engagement Levels and Involvement
According to Deci and Ryan (1987) management which fosters a supportive work environment typically displays concern for employees' needs and feelings, provides positive feedback and encourage them to voice their concerns, develops new skills and solve work related problems. Purcell et al (2003) highlighted that employee engagement is only meaningful if there is a more genuine sharing of responsibility between management and employees over issues of substance. Their study also revealed that involvement in decisions affecting the job or work to be an important factor, which was strongly associated with high levels of employee engagement thus demonstrating it is an important driver.
Lucas et al (2006) viewed that employee voice can be defined as the ability for employees to have an input into decisions that are made in organizations. Robinson et al (2004) highlighted the importance of, feeling valued and involved as a key driver of engagement. Within this umbrella of feeling valued and involved there are a number of elements that have a varying influence on the extent to which the employee will feel valued and involved and hence engaged. Robinson et al (2004) stated that this can be a useful pointer to organizations towards those aspects of working life that require serious attention if engagement levels are to be maintained or improved.
Robinson (2006) recommended that there is considerable evidence that many employees are greatly under utilized in the workplace through the lack of involvement in work-based decisions. Beardwell and Claydon (2007) found that Employee involvement is seen as a central principle of 'soft' HRM, where the focus is upon capturing the ideas of employees and securing their commitment. Critics have argued that employee involvement has management firmly in control and very limited real influence is given to employees. According to Lawler and Worley (2006) for a high-involvement work practice to be effective and for it to have a positive impact on employee engagement, employees must be given power.
Managing Job Oriented Individual Perceptual Dissimilarities
Cooper (1997) explained that if emotions are properly managed rather than shut out at work, they can drive trust, loyalty and commitment and great productivity gains by individuals, teams and organisations. Buchanan and Huczynski (2004) defined perception as the dynamic psychological process responsible for attending to, organizing and interpreting sensory data. According to Robinson (2006) individuals categorize and make sense of events and situations according to their own unique and personal frame of reference, which reflects their personality, past experiences, knowledge, expectations and current needs, priorities and interests. May et al (2004) argued that employee engagement is related to emotional experiences and wellbeing. Wilson (2004) remarked that feelings connect us with our realities and provide internal feedback on how we are doing, what we want and what we might do next … Being in organizations involves us in worry, envy, hurt, sadness, boredom, excitement and other emotions.
3

doing, what we want and what we might do next … Being in organizations involves us in worry, envy, hurt, sadness, boredom, excitement and other emotions.
Schaufeli and Bakker (2004) opined that engaged employees are likely to have a greater attachment to their organization and a lower tendency to quit. Truss et al (2006) found that, overall, engaged employees are less likely to leave their employer. The Towers Perrin (2003) identified both emotions and rationality as core components. They found that emotional factors are linked to an individual's personal satisfaction and the sense of inspiration and affirmation they get from their work and from being a part of their organization. Moore (2004) & Crabtree (2005) found that family stress and work-related stress may be interlinked. According to Robinson (2006), employee engagement can be achieved through the creation of an organizational performance, lower employee turnover and better health.
Conclusion
Employee engagement is linked with the emotional, cognitive and physical aspects of work and how these factors integrated. The concept of employee engagement should not be regarded just another HR strategy. Employee's engagement is a long term process and linked to core tenants of the business like as, values, culture and managerial philosophy. Employees require to be adopting in a working environment which will lead them to display behaviour that organizations are looking for. An organization has to promote the factors which have a positive effect of engagement through every business activity that they do.
It is vital for top management to foster positive, effective people managers along with workplace policies and practices that focus on employee well-being, health and work/life balance. Highly engaged workforce will definitely make an organization more successful in terms of financial & nonfinancial parameters. Engaged employees give their companies crucial competitive advantages—including higher productivity, customer satisfaction and lower employee turnover. The relationship between employee engagement and organizational outcomes would be stronger if better measures were used. An organization should thus recognize employees, more than any other variable, as powerful contributors to its competitive position.
Mehta and Mehta (2013) in a study stated that organizations have to develop such cultures where employees are not scared to offer upwards feedback and have candid communication at all the levels. Employers need to understand their employee's expectations and future plans. This has important implications for job designers to ensure that the meaning and purpose of the role are clearly defined.
Finally, the research paper proposes a tentative 5 C's + 5 E's EEMM Model covering Culture, Communication, Commitment, Collaboration, Career Cycle and Employee, Ethical Behaviour, Empowerment, Empathy, Efficiency dimensions which may be useful for applications of Employee Engagement strategies in the organizations. The new age organizations that have career orientation are likely to achieve greater employee engagement gains leading to less attrition or switch over Improvised energy+ efficiency efforts may enable green organizations to cope with cut-throat global competition.
Proposed 5 C's + 5 E's EEMM Model
Source: Developed on Basis of Review of Literature
References
Beardwell, J. and Claydon, T. (2007) Human Resource Management, A Contemporary Approach. 5th ed. Harlow, Prentice Hall.
Bijaya Kumar Sundaray(2011) “Employee Engagement: A Driver of Organizational Effectiveness”, European Journal of Business and Management Vol 3, No.8.
thBuchanan, D. and Huczynski, A. (2004) Organizational Behaviour. An introductory text, 5 ed. Harlow, FT/Prentice Hall.
4
Empowerment
Collaboration
Culture
Empathy
Efficiency
EmployesCommitment CommunicationCommitment
Career Cycle
Collaboration

Crabtree, S. (2005) 'Engagement keeps the doctor away; A happy employee is a healthy employee, according to a GMJ survey', Gallup Management Journal, 13th January. Available at: www. Gmj.gallup.com Accessed on 19 December, 2012.
Cooper, R. (1997) 'Applying Emotional Intelligence in the workplace', Training and Development, Vol 51 No 12, pp31-38.
Deci, E.L. and Ryan, R.M. (1987) 'The support of autonomy and the control of behaviour',Journal of Personality and Social Psychology, 53, pp1024-1037.
Development Dimensions International, Inc., available www.ddiworld.com (accessed on October 30, 2011).
Gemma Robertson-Smith and Carl Markwick (2009) “Employee Engagement A review of current thinking” Institute for Employment Studies, University of Sussex Campus Brighton, UK.
Jain Amit Kumar, Employee Engagement, Saaransh , RKG Journal of Management, Vol.3, No.2, Janurary, 2012.
Lockwood, N. R. (2007). Leveraging Employee Engagements for Competitive Advantage: HRs Strategic Role. HR Magazine, 52(3), pp. 1-11.
Lucas, R., Lupton, B. and Mathieson, H. (2006) Human Resource Management in an International Context. London, CIPD.
Maslach, C., Schaufelli, W.B. and Leiter, M.P., (2001). 'Job burnout', Annual Review of Psychology, Vol 52, pp 397-422.
May, D.R. Gilson, R.L. and Harter, L.M. (2004) 'The psychological conditions of meaningfulness, safety and availability and the engagement of the human spirit at work', Journal of Occupational and Organisational Psychology, Vol 77, pp11-37.
Mehta Dharmendra & Mehta Naveen k (2013) “Employee Engagement: A Literature Review”, Economia. Seria Management Volume 16, Issue 2, 2013.
Moore, K. (2004) 'The healthy balance among work, family, and personal relationships: Fact or fiction?' Proceedings of the APS Psychology of Relationships Interest Group 4th Annual Conference, pp79-84.
Muhammad Ather & Ebad Baig (2011), “Employee Engagement – A Review of Literature and Academic Definition” Journal of Management, Economics and Finance, Vol. 1, Issue 1, July.
Neeta Bhatla (2011), “To study the Employee Engagement practices and its effect on employee Performance with special reference to ICICI and HDFC Bank in Lucknow”, IJSER Volume 2, Issue 8, August.
Purcell, J., Kinnie, N., Hutchinson, S., Rayton, B. and Swart, J. (2003) Understanding the People and Performance Link: Unlocking the Black Box. London, CIPD.
Purcell, J. (2006) Change Agenda, Reflections on Employee Engagement. London, CIPD.
Ram Padmakumar & V. Prabhakar Gantasala (2011), “The role of employee engagement in work-related outcomes”, Interdisciplinary Journal of Research in Business Vol. 1, Issue. 3, pp.47-61.
R.Wellins and J.Concelman www.ddiworld.com/pdf/ wps_engagement_ar.pdf accessed on Dec.v 8th, 2011.
Robinson, I. (2006) Human Resource Management in Organisations. London, CIPD.
Robinson D, S. Perryman and S. Hayday.The Drivers of Employee Engagement, Institute for Employment Studies, Brighton,2004 ,Report 408, retrieved on December 14th, 2011.
Sandeep Kular, Mark Gatenby, Chris Rees, Emma Soane, Katie Truss (2008), “Employee Engagement: A Literature Review” Kingston Business School, Kingston University Working Paper Series No 19, October 2008.
Schaufeli, W.B. and Bakker, A.B. (2004) 'Job demands, job resources, and their relationship with burnout and engagement: a multi-sample study', Journal of Organisational Behaviour, Vol 25, pp 293-315.
Siddhanta Abhijit & Debalina Roy (2012)”Employee engagement engaging the 21st century workforce”, Asian Journal of management Research.
Simpson Michelle R.(2009) “Engagement at work: A review of the literature International” Journal of Nursing Studies 46.
Susi.S & Jawaharrani.K (2011) “Work-Life Balance: The key driver of employee engagement” Asian Journal of management Research, Volume 2 Issue 1.
Tiwari Shashi (2011) “Employee Engagement - The Key to Organizational Success” ICOQM-10 June 28-30.
Towers Perrin (2003) „Working Today: Understanding What Drives Employee Engagement in www.towersperrin.com. Accessed on 21 December, 2012.
Truss, C., Soane, E., Edwards, C., Wisdom, K., Croll, A. and Burnett, J. (2006) Working Life: Employee Attitudes and Engagement 2006. London, CIPD.
Tulasi Das & Vijayalakshmi (2012) Employee Engagement Strategies For Enhancing Employee Competitiveness To Organizational Success Indian Journal of Applied Research Volume : 1 Issue : 12.
W. A. Kahn.Psychological conditions of personal engagement and disengagement at work. Academy of Management Journal.1990, 33 (4), pp 692-724.
W. H.Macey and B. Schneider. The Meaning of Employee Engagement. Industrial and Organizational Psychology. 2008, 1, pp3-30.
Wilson, F. (2004) Organisational Behaviour and Work, A Critical Introduction. 2nd ed. Oxford, Oxford University Press.
5

Demography and Conflict Levels of Indian Managers
Aruna B.Bhat*, Santosh Rangnekar**, Mukesh Kumar Barua***
*Research Scholar, Dept. of Management Studies, Indian Institute of Technology, Roorkee**Head & Asso.Professor, Dept. of Management Studies, Indian Institute of Technology, Roorkee***Asst. Professor, Dept. of Management Studies, Indian Institute of Technology, Roorkee
Introduction
“Indian executives are the best conflict managers in the world” according to DNA published on July 20, 2009. Observers have argued that Indian managerial conflict resolution tendency reflect Hindu norms of looking for a solution that please everyone, as well as British norms of active, mutual problem solving (Moran & Stripp, 1991).Conflict has long been a focus of organizational and team research (Jehn & Mannix, 2001; Pondy, 1967). A conflict can be defined as an awareness of opposition of goals, values, opinions, or activities by at least one party (Deutsch, 1973; Putnam & Poole, 1987; Rubin et al., 1994; Thomas, 1992). Conflict is understood as the process that occurs when a person or group perceives differences or opposition between itself and another person or group, due to interests, resources, beliefs, or values that matter to them (De Dreu & Gelfand, 2008).Conflict is bound to occur whenever there is interaction regarding differences in goals, values and policies between employees of organization. Conflict encompasses our organizational life (Whetton & Cameron, 2008) and remains an inevitable and commonplace phenomenon of social life as well. Conflict might rise and lead to nonproductive results, or conflict can be beneficially resolved and lead to quality final products. Therefore, learning to manage conflict is vital to any organisation. Conflict can also result because of miscommunication between people with regard to their needs, ideas, or even beliefs. Conflict cannot be resolved to its roots but learning how to manage conflicts can decrease the odds of nonproductive growth. Most of the literature on conflict calls for the resolution of conflict, rather than managing conflict. Managing conflict is easier than it is to control the people, places, and things that produce conflict (Algert & Watson, 2002). This study considers the conflict at individual (personal), group and organizational level and the relationship of all these conflict levels with the demographic variables in various organizations of India.
Purpose- The purpose of this paper is to investigate the difference in manager's conflict levels at their place of work across different age groups, hierarchical level and length of service. An understanding of conflict at a particular level and its resolution can help employees improve their relationships and work for the betterment of the organization. The word conflict conjures up a number of descriptions for many people. Some of us think of it as something to avoid while others think it can be healthy if managed well. Most of us assume that conflict is a negative force and has no place in a organization but a moderate conflict enhances working relationships and build a positive organizational climate.
Design/ Methodology- The data ware collected from 135 managers from various organizations of India through convenient sampling technique and was analyzed by SPSS 17.0. Conflict at various levels which includes interpersonal, group and organizational was measured through a standardized scale developed by Dhar U & Dhar S. (2003) comprising of twenty items on a four point scale.
Findings- Multivariate Analysis revealed that there is a significant difference in conflict at different levels adopted by managers of various organizations in India based on age groups and hierarchy but no difference has been found in terms of length of service. The findings of this study can be used for deciding the proper conflict management strategy at a particular level to handle the conflict constructively. Conflict, if not managed properly can increase antagonism level among employees of organizations, lead to tension, hampers normal channels of communication and also divert employee attention from organizations goals and mission.
Research Implications- This research paper does not sample respondents from across all types of organizations and future studies may investigate this further.
Originality/ Value- This paper can be useful for HR mangers and policymakers to formulate proper strategies for handing conflicts in organizations and the current study is a pioneering effort to bring this issue into light. This study will also help the strategists to find out the level at which maximum conflict is occurring and the ways to deal with such situations.
Keywords: Conflict Levels, Hierarchical Levels, Group Conflict, Individual Conflict
6

Individual Conflict: Conflict within organizations can result from many forces, such as intrapersonal struggles (Erikson, 1964; Lidz, 1968), interpersonal relationships (Walton, 1969; Glidewell, 1970), group dynamics (Redl, 1942; Bion, 1961), status and authority (Kabanoff, 1985), or structural characteristics (Weber, 1947; Dahl, 1970; Oshry, 1977). While conflict itself is neutral, it can be very disruptive or extremely enhancing depending on how it is used (Wall & Nolan, 1986; Lynch, 1987). It can be dealt with in ways that produce very negative outcomes, ranging from the extremes of withdrawal to attack (Mitchell & Mitchell, 1984). It can also be treated as a revitalizing opportunity to change that which has become en-trenched and stagnant (Stamatis, 1987).
Individual level conflict is divided into two types:
Intrapersonal conflict: A conflict or experience which takes place within an individual. It occurs when a major decision based on certain conditions or norms are involved. The actual reasons of conflict have to be found out so that the conflict can be managed properly. When the conflict is solved, the people involved in it feel more confident and bring about a positive change.
Interpersonal conflict: A conflict between individuals in the same organization. This conflict arises because of differences in attitude, personality, values, goals, experience etc. Though the employees in the organization work towards a common goal yet they have conflict over the issues arising in the organization which makes the fulfillment of goal difficult. In order to manage interpersonal conflict well, the proper adjustment have to be searched and implemented.
Group Conflict: Conflict within groups occurs because people have differences of opinion, different values and goals and attitude. In a group the fundamental task is to complete the project/ task. The past research on conflict and its resolution has stressed on situations in which group members have evident opposing goals (Cosier & Rose, 1977; Kabanoff, 1985; Thompson et al., 1988; Eisenhardt & Schoonhoven, 1990). Though group members work on the same project and have mutual interests in completing it, they still may experience conflict. Conflict theory and most research on conflict has primarily focused on disagreements about ends, but conflict can easily happen about means, even when ends are shared, mostly happening in organizational groups (McGrath, 1984). Kabanoff (1985) suggested that people have difficulty in working together though they generally agree on goals and know that they have work towards a common goal yet they experience conflicting situations.
Organizational Conflict: It has been described as bad and good, disruptive and productive. The breakdown in the standard mechanisms of decision-making—a dysfunction of the system (March & Simon, 1959). The conflict which is arising between the employees based on the organizational set up. These conflicting situations arise because of lack of resources, poor communication, no proper salary allocation, improper rules of promotions etc. Though conflict is viewed negatively in an organization yet it can foster innovation and teamwork. The organizational conflict can be due to opposition of needs, values and interests of employees working together in an organization.
Literature Review
Brewer et al. (2002) in their paper have examined the relationship between gender role, organizational status and conflict management behaviour of males and females of three similar industries. It has been suggested that individual's behaviour in an organization varies according to the position he or she holds in organizational hierarchy (Fagenson, 1990, Kenter, 1977).No difference was found in conflicting style of similar organizational status based on gender (Korabik et al., 1993).The authors have concluded that dominating conflict style was mostly associated with males while as avoiding style with females. No relationship was found between gender role and compromising conflict style.
For organizational learning and effectiveness, there should be moderate conflict maintained by altering the sources of conflict and relationship conflict should be minimized. Employees' intra-group conflicts affect the job performance negatively (Rahim & Psenicka, 2004). Interpersonal conflict involves negative emotions and it was found that interpersonal conflict affect project outcomes consistently and negatively even when managed well (Barki & Hartwick, 2001).According to Chaudhry et al. (2011) who have recommended that young employees choose compromising approach compared to other styles than older employees and the study can be used for mangers to make tailor fit the policies according to mission and vision of organization.
Munduate et al.(1997) in their paper have studied the styles of handling interpersonal conflict. Blake & Mounton (1964) model was used as a background for this study. The study revealed that the style of handling interpersonal conflict depends on whether the conflict is with the superior, subordinate or a peer. Dominating style is preferred with the subordinates( Philips & Cheston,1979;Lee, 1990) while as compromising style is adopted when there is conflict among peers(Rahim, 1983).When there is confrontation with the superiors, the employees tend to adopt obliging style (Drake et al., 1982). The authors have highlighted that there is significant difference between managers' perception of the way they act in conflict resolutions and their actual behavior.
7

Din et al. (2011) in their paper have investigated the strategies adopted by private and public sector organizations. The existence of conflict, its intensity, types and sources were studied and it was found that integrating, compromising and avoiding styles were mostly adopted by both the sectors of organizations. Conflict is one of the key problem in organizations and has become an important tool in the development of the organization if it is managed well (Cetin & Hacifazlioglu, 2004) and despite the different image of conflict in different minds, the management of conflict is difficult (Algert & Watson, 2002). According to Heffron (1989) who distinguished between public and private organizations stated that public organizations are less inclined towards efficiency because they are dependent on the revenues from government. They need not worry about clients. Employees have to work under strict formal setting hence fewer chances for innovation and improvement.
Justification for the Research
There is not simple or straight forward technique or skill to handle conflicts. In the organizations like manufacturing sector where the nature of the tasks involve interpersonal relationships between employees of different departments there is maximum chance of getting into conflict. Both the tasks and the state of the interpersonal relationships induce conflict in a complex way. In other sectors like IT and service industries where there the nature of task is working in groups or providing service to the customers and involve interpersonal relations, there are again chances of getting into conflict which can lead towards an undesired goal. In order to reduce this conflict to a moderate level, both the business system and good interpersonal relationships could induce or prevent the outbreak of conflict to a great extent. In this connection, the understanding of categorisation of tasks and finding out the level at which the conflict is occurring and the reasons related to the conflict may shed light on conflict formation and the application of appropriate management strategies to deal with them (Rahim, 1986).
Since this study involves the demographic characters and their relation with conflict level of Indian managers which has not been discussed so far in depth, there is a need to study the level at which conflict arises. Since the study of conflict and its related issues involves the fields of psychology and organisational behaviour, it can provide a relevant perspective to the issue of conflict and its three levels. As there is a relationship between conflict levels and the demographic characters, this study provides the tools for to prevent the outbreak of conflict and the means to resolve conflicts. Based on this relationship, the following hypotheses are framed:
Hypotheses
H : Different conflict levels of lower and upper age groups are different.1
H : Different conflict levels of managers differ in terms of their length of service.2
H : There is difference in conflict levels based on hierarchy.3
Method
The population of the research includes different nature of organizations like manufacturing, software, automation, hydropower and ground water surveys. Convenient random sampling was done to collect the data for the study. After collection of data, it was analyzed by using SPSS 17.0. To carry out the present study, the standardized questionnaire technique was used to obtain insight about the issues explored in the study.
Sample
The target population of the present study was comprised of middle and senior level managers from the selected business organizations in India. The employees from both public and private sector in manufacturing, software, hydropower and groundwater survey organizations of India participated in the study. A total of 200 employees were approached out of which, 125 responded to the questionnaire. The rest of the questionnaires were not found suitable due to incomplete information and hence were dropped. The information was collected during January 2012 – June 2012. The questionnaires were given to the employees taking into consideration their availability. Average age and average experience of the sample were found to be 34.57 years and 11.05 years respectively. The sample consisted of 119 males (95.2%) and 6 females (4.8%) aged between 21 years to 52 years. Education levels of sample also varied from diploma holders to graduates and finally to postgraduates. The work experience profile of the sample was: 5 years – 10 years (38.8%), 11 years- 20 years (47.6%) and more than 20 years (13.6%).
Research Instrument
Conflict level was measured by using the Organisational Conflict Scale developed by Dr. Upinder Dhar & Dr.Santosh Dhar (2003). The scale consists of twenty items in total which are based on three levels of conflict which occur in organizations: Individual conflict which consist of seven items, group conflict which consist of eight items and organizational conflict which consist of five items. Cronbach alpha value for the scale was found to be .74 which is well above the acceptable level of .70. All the 20 items were rated on a 4-point scale (1 = Never, 4 =Always). The factor analysis was carried out which resulted
8

in three main factors. The KMO of the scale was found out to be 0.829.
Which consist of five items. Cronbach alpha value for the scale was found to be .74 which is well above the acceptable level of .70. All the 20 items were rated on a 4-point scale (1 = Never, 4 =Always). The factor analysis was carried out which resulted in three main factors. The KMO of the scale was found out to be 0.829.
Results
The average score of conflict was found to be 42.48 (Table1), which indicates the existence of a large variation in conflict levels based on different levels and designations of the employees in the organizations under study. This may be because of the variation found in scores on the individual, group and organizational levels. Out of the three dimensions, at group level the conflict was found to have the highest average mean score of 16.94, followed by individual conflict with average mean score of 14.09. If we go for the item-wise analysis of means with highest score at group levels, the items identified are: “Performance appraisal system is seen by many as a deliberate effort to offset their career advancement” and “Some people purposely tends to block the opportunities for others” etc.
To check the first hypothesis that conflict at different levels adopted by the lower and upper age groups is different, Multivariate Analysis and Chi square test was carried out.
Table 1 shows the chi square value of .000 (less than .05) which supports our hypothesis (H1 that
there is difference in conflict levels on upper and lower age groups.
Table 2 show s
that the managers below the age of 40 show differences in their conflict levels as
compared to the upper group category. Hence our first hypothesis is accepted.
Table 1 : Mean and Chi Square Values of Three Conflict Levels: Individual Conflict (IC), Group Conflict (GC) and Organizational Conflict (OC).
Table 2 Age Categories of Managers and their Conflict Levels.
Table 3 Three Conflict Levels with Comparison to Length of Service.
9
Mean
CL
IC
GC
OC
42.48
14.09
16.94
11.50
56.80 18
16.831.248
Observed N Expected N ResidualAge Categories
21-30
17.831.24931-40
-7.231.22441-50
-27.231.2451 and above
125
Chi-square Value Df Asymp. Sig..000
.000
.000
48
18
19
14
42
56.80
73.74
98.58
58.35
IC
GC
OC
LOS
Total
.000
73.74 19 .000
98.58 14 .000
Chi-square Value Df Asymp. Sig.

Table 4 shows the chi square value of .000 (less than .05) which supports our hypothesis (H3) that there is difference in conflict levels based on hierarchy.
Discussion
This study on conflict management has shown that the managers at different age groups manage conflict differently. According to Çetin & Hacifazlioglu (2004), age was observed to be one of the main important variables that affect the way the conflict is handled as teachers and academics get older, they become more flexible and constructive in their dialogues with their peers. Phillips & Cheston (1979) studied business managers and found that senior age group managers were more likely to choose the use of competition with subordinates than vice versa. Several researchers have found junior managers to prefer the styles of withdrawing when in conflict with superiors, perhaps because of the risk of negative consequences, such as job loss (Kahn et al., 1964; Phillips & Cheston, 1979; Rahim, 1986).Our study is in contradiction with the results found out by Paulson's (1986) who states that the middle managers from the United States found no significant differences in managing conflicts according to the hierarchy. In managing conflicts, research conducted by Slabbert (2004) showed that there would be significant differences in the modes of conflict resolution at different organizational levels within traditional organizations.
It has been observed in the present study that there is difference in conflict management based on hierarchical levels. It is obvious that the way the conflict is resolved relate to the existence of a strict organizational hierarchy, with very little difference within both organizational groupings, i.e., middle and junior managers. In a study carried by Brewer et al. (2002) who revealed a significant difference between upper and lower status employees in relation to conflict management. There was a significant difference between upper and lower status employees in managing conflicts in organisation. A subordinate may not be willing to use any conflict style to oppose a superior, while a superior may have more freedom to use aggressive styles, particularly in order to meet company production goals (Rahim & Buntzman, 1989).
The differences in managing conflict are observed based on the levels. The individual conflict levels show much deviation in terms of the conflict management style. There are various styles adopted by managers in managing conflict. The study showed that those employees between 18-25 of age and had either high school or lower education preferred to use accommodating styles. On the other hand, the research conducted by Chan et al. (2006) showed that males and females did not differ significantly in terms of using conflict management styles. However, the results of t-tests revealed that females tend to avoid conflicts significantly more than males and males prefer the dominant style more than females. Organisational level doesn't play a major role in deciding the conflict management style adopted by Indian mangers.Also, Mc Kenna & Richardson (1995) found Singaporean male managers use the compromising style more than women, while female managers were more inclined to use the avoiding style.
Our study has shown that length of service doesn't play a significant role in deciding the conflict management style of managers. This study is in line with the findings by Sorenson & Hawkin (1995), who found no relationship between the tenure and the preferred way of conflict management by managers of organisations.
Managerial Implications
Although the results of this study revealed some differences in conflict management based on levels in relation to age groups and length of services, it is important that for conflicts to be managed functionally, a proper style may be more appropriate than another depending upon the situation (Rahim, 2001; Rahim & Bonoma, 1979; Thomas, 1976). The organisational policies biasness. The conflicts can lead to increased corporate control but also to increased creativity and innovation. In
Table 4 Conflict Levels with Comparison to Hierarchy
Chi-square Value Df Asymp. Sig.
.000
.000
.000
.000
18
19
14
2
56.80
73.74
98.58
40.76
IC
GC
OC
HRY
According to table 3, test statistic significant value is more than 0.05, which indicates that conflict at different levels according to length of service are not different. This means that whatever may be the conflict levels i.e. organizational, individual or group conflict, length of service doesn’t play a role.
10
order to pay attention to the destructive potential of conflict, attention should also be given to the opportunities that emerge from intra and inter-organisational conflict. Conflict must be considered an inevitable part of the organisations' life. Many employees consider conflicts as destructive collisions, incompatible, after which some gain at the expense of others but it is important to understand that a medium-level conflict is necessary to enable the development of organisational processes and provide a way for change as moderate conflict may lead to the motivation of solving problems that otherwise go unnoticed. In the future it is necessary for managers to have more knowledge about the possibilities of constructive settlement of conflicting situations and first finding out the proper level at which conflict is happening so that the way to manage the conflict is decided.
In order to manage conflicts constructively, that there be more regular formal meetings that include management and lower level employees from all departments where one can discuss stable employment conditions and their standardization and also the discussion regarding that professional development programs. The communication channels should be such that the proper and correct information is transferred to the concerned person. The employees of the organization could be given equal status and salary should be according to the performance and experience of candidate. A good thing to start would be by acknowledging diversity within the workforce. Training programmes should be conducted so as to directly address dysfunctional issues and proper strategies should be formulated and implemented so that the performance is improved and chances for conflicts are minimized.
Limitations and Scope for Future Research
Like all other research studies this study is also not free from limitations. Firstly, all the measures were based on self-reports, which is a concern for common method bias. Also the present study included only the relationship of demographic characteristics with conflict management levels. The study considered the impact of age, length of service and hierarchy only on conflict management levels while other demographic characteristics can also be considered. Another limitation may be that data was collected conveniently from only a few organisations consisting of employees from different levels-lower, middle and upper. Future studies may be designed to collect data randomly from a larger and a homogenous group to produce more valid results. A very small number of females participated in the survey and hence the sample size was overwhelmingly comprised of male respondents.
References
Algert, N. E., & Watson, K. L. (2002). Conflict management: Introductions for individuals and organizations. Bryan, TX: Centre for Change and Conflict Resolution.
Barki H., & Hartwick, J. (2001). Interpersonal conflict and its management information system development. MIS Q, 25(2), 195-228.
Bion, W. R. (1961). Experiences in Groups. London: Tavistock.
Blake, R.R., & Mounton, J.S. (1964). The Managerial Grid. Houston: Gulf Publishing.
Brewer, N., Mitchell, P., & Weber, N.(2002).Gender Role, Organizational Status, and Conflict Management Styles, The International Journal of Conflict Management, 13(1), 78-94.
Cetin M.O., & Hacifazlioglu O. (2004). Academics' conflict management styles. Dogus Univ. Journal, 5(2), 155-162.
Chan, C.C.A., Monroe, G., Ng, J., & Tan, R. (2006). Conflict Management Styles of Male and Female Junior Accountants. International Journal of Management, 23(2), 289-295.
Chaudhry, A.A., Sajjad M., & Khan, I. (2011). Employees' conflict management strategies and demography: A case of Pakistan. African Journal of Business Management, 5 (9), 3549-3555.
Cosier, R., & Rose, G. (1977). Cognitive conflict and goal conflict effects on task performance. Organizational Behavior and Human Performance, 19, 378-391.
Dahl, R. A. (1970). After the Revolution? Authority in a Good Society. New Haven, CT: Yale University Press.
De Dreu, C.K.W. & Gelfand, M.J. (2008). Conflict in the Workplace: Sources, Functions and Dynamics across Multiple Levels of Analysis. In C.K.W. De Dreu & M.J. Gelfand (Eds.), The Psychology of Conflict and Conflict Management in Organizations. New York: Lawrence Erlbaum Associates.
Deutsch, M. (1973). Conflicts: Productive and destructive. In Conflict resolution through communication, edited by F. E. Jandt. New York: Harper & Row.
Dhar, U. & Dhar, S. (2003). Organisational Conflict Scale, Agra, India: National Psychological Corporation.
11

Din,S., Khan, B., Rehman, R., & Bibi Z. (2011). An investigation of conflict management in public and private sector universities. African Journal of Business Management, 5(16), 6981-6990.
Drake, Zammuto & Parasuraman, (1982). Five conflict Styles: Factor structure and social desirability issues underlying the conflict mode instrument. Paper presented at the Annual Meeting of the American Institute for Decision Sciences.
Eisenhardt, K., & Schoonhoven, C. (1990).Organizational growth: Linking founding team, strategy, environment, and growth among U.S. semiconductor ventures, 1978-1988. Administrative Science Quarterly, 35, 504-529.
Erikson, E. H. (1964). Insight and Responsibility. New York: Norton
Fagenson, E.A. (1990). Perceived masculine and feminine attributes examined as a function of individual's sex and level in the organizational power hierarchy: A test of four theoretical perspectives. Journal of Applied Psychology, 75, 204-211.
Glidewell, J. (1970). Choice points. Cambridge, MA: MIT Press.
Heffron, F. (1989). Organizational Theory and Public Organizations. Prentice Hall.
Jehn, K.A. & Mannix, E.A. (2001). The Dynamic Nature of Conflict: Longitudinal Study of Intragroup Conflict and Group Performance. Academy of Management Journal, 44, 238-251.
Kabanoff, B. (1985). Potential influence structures as sources of interpersonal conflict in groups and organizations. Organization Behavior and Human Decision Processes, 36, 113-141.
Kahn, R.L., Wolfe, D.M., Quinn, R.P., & Snoek, J.D. (1964). Organizational stress: Studies in role conflict and ambiguity. New York: Wiley.
Kanter, R.M. (1977). Men and women of the corporation. New York: Basic.
Korabik,K., Baril, G.l.,& Watson, C.(1993). Managers' conflict management style and leadership effectiveness: The moderating effects of gender. Sex Roles, 29, 405-420.
Lee, Ch.W. (1990). Relative status of employees and styles of handling interpersonal conflict: An experimental study with Korean Managers. The Interpersonal Journal of Conflict Management. 1 (4), 327-340.
Lidz, T. (1968). The Person. New York: Basic Books.
Lynch, R. (1987). The shootout among the nonteam players." Management Solutions, 32, 5-12.
March, J. G and Simon, H. A. (1959). Organizations. New York: Wiley.
McGrath, J. E. (1984). Groups: Interaction and Performance. Englewood Cliffs, NJ: Prentice-Hall.
McKenna, S. & Richardson, J. (1995). Business Values, Management and Conflict Handling: Issues in Contemporary Singapore. Journal of Management Development, 11(4), 56-70.
Mitchell, R. C., & Mitchell, R. R. (1984). Constructive management of conflict in groups. Journal for Specialists in Group Work, 9, 137-144.
Moran, R.T. & Stripp, W.G. (1991). Dynamics of Successful International Business Negotiations. Houston, TX: Gulf Publishing.
Munduate,L., Luque, P., & Baron, M.(1997). Styles of Handling Interpersonal Conflict. Psicothema, 9 (1), 145-153.
Oshry, B. (1977). Power and Position. Boston: Power and Systems, Inc.
Philips, E., & Cheston, R. (1979).Conflict Resolution: What Works? California Management Review, 21 (4), 76-83.
Pondy, L.R. (1967). Organizational Conflict: Concepts and Models. Administrative Science Quarterly, 12, 296-320.
Putnam, L. L., & Poole, M. S. (1987). Conflict and negotiation. In F. M. Jablin (Ed.), Handbook of organizational communication (pp.549- 599). Newbury Park, CA: Sage.
Rahim, M.A. (2001). Managing Conflict in Organizations. Westport, CT. USA: Quorum Books.
Rahim, M.A.(1983). A Measure of Style of Handling Interpersonal Conflict. Academy Of Management Journal, 26,368- 376.
Rahim, M.A. (1986). Referent Role and Styles of Handling Interpersonal Conflict. Journal of Social Psychology, 126: 79-86.
Rahim, M. A., & Bonoma, T. V. (1979). Managing organizational conflict: A model for diagnosis and intervention.
12

Psychological Reports, 44, 1323-1344.
Rahim, M.A. & Buntzman, G.F. (1989). Supervisory Power Bases, Styles of Handling Conflict with Subordinates, and Subordinate Compliance and Satisfaction. Journal of Psychology, 123, 195-210.
Rahim MA, & Psenicka C (2004). Conflict Management Strategies as moderators or mediators of the relationship between intragroup conflict and job performance. Paper presented at the annual conference of the International Association for Conflict Management, Pittsburgh, PA.
Redl, F. (1942). Group emotion and leadership. Psychiatry, 5, 573-596.
Rubin,J.Z., Pruitt, D.G. & Kim, S.H.(1994). Social Conflict: Escalation, Stalemate and Settlement, New York:McGraw-Hill.
Slabbert, A.D. (2004). Conflict management styles in traditional organisations. The Social Science Journal, 41, 83-92.
Sorenson, P. & Hawkins, K. (1995). Gender, psychological type and conflict style preference. Management Communication Quarterly, 9, 115-127.
Stamatis, D. H. (1987). You've got to accentuate the positive. Personnel, 64, 47-50.
Thomas, K. W. (1976). Conflict and conflict management. In M.D. Dunnette (Ed.), Handbook of industrial and organizational psychology (pp. 889-935). Chicago: Rand McNally.
Thomas, K.W. (1992). Conflict and negotiation processes in organizations. In M.D. Dunnette and L.M. Hough (Eds.), Handbook of Industrial and Organizational Psychology (651-717). Chicago, IL: Rand Mc Nally.
Thompson, L. L., Elizabeth A. M., & Max H. B. (1988). Group negotiation: Effects of decision rule, agenda, and aspiration. Journal of Personality and Social Psychology, 54, 86-95.
Wall, V. D., and Nolan, L. L. (1986). Perceptions of inequity, satisfaction, and conflict in task-oriented groups. Human Relations, 39, 1033-1051
Walton, R. (1969). Interpersonal Peacemaking: Confrontations and Third-party Consultation. Reading, MA: Addison-Wesley.
Walton, R. (1969). Interpersonal Peacemaking: Confrontations and Third-party Consultation. Reading, MA: Addison-Wesley.
thWhetton, D. A., & Cameron, K. S. (2008). Developing management skills (7 ed.). New Delhi: Dorling Kindersley.
Weber, M. (1947). The Theory of Social and Economic Organization. New York: Free Press.
13
Entrepreneurship Development in Indian Retail Sector: A Study of Business Models in the Global Context
Dr S.R. Subba Rao*, Dr Y. Madhuri Srinivas**
* Professor, Dept. of Mgt. Studies, Bhavan's Vivekananda College of Sci., Humanities & Com., Secunderabad.** Asst. Professor, Bhavan's Vivekananda College of Science, Humanities and Commerce, Secunderabad.
Introduction
Entrepreneurship development has been given a big thrust by the Government of India through various policy measures announced and incentives offered, particularly since the initiation of economic reforms in 1991. The process of liberalization, privatization and globalization that emerged in the country has impacted positively the economic sectors, including the retail sector. The pros and cons to allow the foreign retailers into India have been debated in the Parliament of India and has discussed in the media. Some of them consider that liberalization of the policy of Foreign Direct Investment (FDI) will be beneficial to the Indian economy, while there are arguments against such measure considering it detrimental to the interests of the domestic retailers, particularly the unorganized sector. With this background, the present paper analyses the following issues in the case of India:
(a) Entrepreneurial development in the Indian retail sector.
(b) Government policy regarding Foreign Direct Investment (FDI) in retail sector.
(c) Business models and operational strategies of foreign retailers and their effect on the domestic retailers.
(d) Impact of foreign retailers on the Indian economy in terms of resource utilization and employment.
These four aspects have been dealt with in the following sections. The final section gives the concluding remarks. Some cases under single brand retail and Cash-and-Carry (c&c) formats are given in the annexure.
Entrepreneurship Development in the Indian Retail Sector
Entrepreneurial development has been given special attention by the Government of India (GOI) through various policies, schemes and programmes. Many institutions and agencies have been providing education and training in entrepreneurship. Some institutions have entrepreneurship development centers and incubators. Some conduct conferences, seminars, workshops and business ideas or business plan contests. Organizational support is given with conducive environment. These have been enabling people to become entrepreneurs who would not have taken that option otherwise (Subba Rao and Sirisha, 2006).
As per a survey, 30% of the students of 1979 batch of Indian Institute of Management (Ahmedabad) became entrepreneurs. About 40% of the graduates of Harvard Business School took to entrepreneurship, some time in their career (Rashmi, 2004).
Entrepreneurship development has been given an importance by the Government of India through various policy measures and incentives, as seen from the advent of economic reforms in the year 1991. The process of liberalization, privatization and globalization undertaken by the country has affected favorably the economic sectors, including the retail sector. The Government of India has been liberalizing the policy of foreign direct investment over the years in a phased manner. On assessing the potential of this sector, the global retailers are getting attracted towards India increasingly. There are different views regarding their entry, both favorable and unfavorable. This paper analyses the nature of entrepreneurial development in the Indian retail sector. The types of business models that have emerged in the process are examined. Then, the effects of global retailers operating in India, on the domestic retailers are examined. The liberalized policy of the Government is expected to benefit the economy in respect to modernization of the retail sector, employment and efficient use of resources, among other aspects. The business models and operational strategies of global retailers are expected to meet this objective without affecting adversely the unorganized sector. There are some studies related to these aspects. However, the retail sector in India is in the growing stage and dynamic in nature, making any further study such as the present one meaningful and useful. The analysis is based upon secondary data and case study approach. The study concludes that the presence of foreign retailers in India will be, in general, having a favorable impact on the Indian economy. Some cases relating to single brand retail and cash-and-carry formats have been covered in the paper.
Keywords: Global Retailer, Foreign Direct Investment, Domestic Retailer, Business Model, Resources
14
However, the general preference of many students who undergo entrepreneurship courses in India seem to experience as employees initially before thinking of becoming entrepreneurs.
The GOI has established the National Science & Technology Entrepreneurship Development Board in 1982 under the Department of Science & Technology. It promotes entrepreneurship through training and use of science & technology tools. It networks agencies of the support system, academic institutions, and research & development entities to encourage entrepreneurship with special focus on backward areas (www.dst.gov.in/scientific-programme/st-nstedb.htm). Institutional support for entrepreneurship development includes Entrepreneurship Development Cells, Science & Technology Entrepreneurship Development projects, Science & Technology Entrepreneurs Parks and Technology-based Incubators.
There are organizations and agencies, such as National Micro, Small and Medium Industry Service Institutions, National Small Industries Corporations, Industrial Development Corporations, State Finance Corporations, Technical Consultancy organizations and so on, assisting prospective and existing entrepreneurs in different ways.
The growth of retail sector is attributed to rising consumerism due to higher incomes, ability of the middle class to buy luxury items, globalisation resulting in exposure to branded goods, observance of multiple festivals and functions involving huge expenditures due to the different cultures and religions and family traditions in the country.
The retail sector is the second largest employer in India after agriculture. In 2007-08, it employed 7.2% of total workers and provided jobs to 33.1 million people, mostly non-farm (NSSO, 2008). India, in the global scenario, has the highest number of retail outlets (11,903) per million population and the lowest per capita retail space. Most of the stores are in rural areas (www.dnb.co.in). As per the Global Retail Development Index 2012, India ranks fifth in retail in the top 30 emerging markets. The size of India's retail sector in 2010-11 is estimated at around $450 billion, with organised retail having a share of about 5%. The retail sector is expected to grow at 10-12 % per annum, while the GDP growth is around 6% (Times of India, 2012).
Entrepreneurship has progressed in the retail sector with the establishment of enterprises of different types. Sole proprietorship units thrive to a major extent. There are partnership ventures operating mainly at the regional level. Private and public limited companies have emerged in the form of retail chains at national level.
Government Policy on Retail Sector
Before 1997, the Indian Government's policy on FDI required specific approval from the Foreign Investment Promotion Board for foreign retailers to operate in India and applications were considered on case-to-case basis. Applications were limited and approvals were minimal. Since 1997, 100% FDI has been allowed in C&C wholesale trading under Government's approval. From 2006, it is given automatic approval. In January 2006, permission for FDI was given up to 51% for single-brand retailing. The products have to be sold under the same brand name globally and should be branded in the manufacturing process. Retailing is not allowed for multi-brand items. (www.indiaretailing.com)
During April 2000-March 2010, FDI inflows in retail sector were US$ 1.8 billion (Rs.7,799 crore), i.e. 1.54% of the total FDI inflows. During January 2006-May 2010, 94 proposals were received for single brand retailing, of which 57 were approved with an FDI inflow of US$ 194 million (Rs.900 crore), i.e. 0.21% of the total FDI inflows (Government of India, 2010).
Since April 1, 2010, the front-end retail companies (taken together) of the Indian partner can source only 25% of the turnover of the C&C venture from the foreign partner for internal use only, while 75% should be for kirana stores. This makes the foreign retailer redefine strategies giving more weight to kirana stores, hotels, restaurants and caterers. The government's FDI policy aims at protecting small retailers (www.indiaretailing.com).
For single brand retail, the foreign direct investment (FDI) limit was raised from 51% to 100% in January 2012. But it did not result in investments in this area, though overall FDI increasing inflows into India went up to $16.74 billion by June-end 2012. In the first six months, FDI's share in single brand retail fell from 0.03% in December 2011 to 0.02% in June 2012, the critical issue being ownership and sourcing. As per a report of Knight Frank, a consulting firm, the effect of big foreign retail firms on domestic unorganised sector is envisaged to be positive and improved efficiency. Inefficient unorganised players may exit the retail sector and switch to other economic sectors. The relaxation in FDI limits will have a direct and positive impact on the commercial real estate sector, through reduction in vacant space, but its growth as well. Among the top Indian retailers, Pantaloon, Shopper's Stop and Trent have achieved a five-year average annual growth 30%, 27% and 26% respectively during 2007-2012. Their operating profits increased by 34% p.a. during 2007-12, and the operating profit margin grew from 7.9% in 2007 to 9.3% in 2012 (Business Line, 2012).
In China, FDI is permitted in retailing up to 49% since 1992, in six provinces and special economic zones, and since December 2004 this limit has been lifted. Consequently, the employment in the retail sector has increased from 4% to 7% of the total labour force, and the number of traditional retailers has risen by 30% during 1996-2001. Thailand allows 100% FDI
15

in retail sector, with no bar on the number of outlets, but the capital should be TBH 100 million; for each additional outlet TBH 20 million, and for wholesale outlet TBH 100 million are set. The entry of foreign retailers has helped the agro-food processing industry and exports to grow and develop the organised sector. Brazil, Argentina, Singapore and Indonesia allow unlimited FDI in the retail sector for equity holding, and Malaysia has set limits on equity. Most of these countries are benefited due to FDI in the retail sector (Government of India, 2010). Overall, in developing countries where foreign retailers are operating, domestic retailers were affected adversely initially, but later the retail sector has grown well benefiting the economy.
Global Retailers: Business Models and Strategies
In the USA, retail sales declined in January - June 2009 by 9.3% and in the European Union the sales fell in volume during January-May 2009, when compared to the position in the previous year (www.dnb.co.in). Facing saturation, major retailers of the developed countries have been entering the markets in emerging countries, including India.
Two business models have been adopted by the foreign retailer's viz., franchisees and cash and carry stores in India. For single brand retailing, franchisees are preferred. In this the lucrative category is the fast food market valued at about Rs.4,547 crore ($1 billion), which was planned to reach Rs.30,000 crore (about $6.3 billion) by 2011 (www.casestudyinc.com). Some franchisees sell foreign brands exclusively while some sell these brands along with others depending upon agreement. However, Private labels compete with these brands.
In the c&c format the foreign retailer owns the store or opts for joint venture arrangement with the domestic partner. The global players and their Indian partners have invested over Rs.2,500 crore for c&c business in India. The consumer has to buy a minimum quantity of products or value specified by the cash & carry retailer. The size of the store ranges from 1 lakh to 3 lakh sq. ft. (Business World, 2010a). It sells to the owners of restaurants, kirana and other small and medium sized retail stores, fruit and vegetable resellers, caterers, hoteliers, offices and institutions. There are no direct sales to consumers. About 90% of the products are sourced locally. For a c&c store, profitability is low or negative on food items which are compensated by higher margins from non-food products. For viability focus is laid on an effective supply chain management. Location, space productivity and merchandise management are given attention.
There are differences in the strategies of enterprises in terms of intensity of competition, nature of products dealt with, product differentiation or specialisation or diversification of products, skills, training and use of people, business networks (e.g. outsourcing of firms), mergers, acquisitions and use of resources.
Foreign Retailers' Impact on the Indian Economy
India being a vast country with varying cultures, regulations, licenses and tax systems across states and union territories, the foreign retailers face problems in setting up stores, particularly in metros where acquiring premises is difficult and rentals are high which can be surmounted by tie-ups with domestic retailers. There have been protests by traders, shopkeepers and farmers against the entry of foreign retailers.
The Indian entrepreneurs in the retail sector are depending upon the government for back-end infrastructure needs such as cold-storage units, big warehouses for large scale holding of inventory and logistics facilities such as economic transport network to take care of procurement and distribution needs of the goods and services dealt with. These back-end requirements involve huge investments which are beyond the capacity of even the Indian retail chains to operate effectively in the competitive market. For operational efficiency and competitive power, an efficient supply chain is needed linking suppliers through producers to consumers. Branding of products, customer relationship management, and software technology are needed to manage the enterprises. The major constraint on the part of the government and the domestic retailers is the availability of adequate finances to meet all these requirements. The fiscal deficit is hovering above the high level of 7% of Gross Domestic Product. Infrastructure deficiencies continue. Against this background, the government has preferred liberalising the FDI.
Foreign retailers have efficient supply chain management at the international level, applying high technology. They are financially strong with stores of large size. They sell products of reputed brands, and possess a competitive edge against the domestic entities. Big domestic firms may be able to face the competition from the foreign chains, but small firms do face problems.
With financial strength, foreign players can have stores of large size, procure materials and products of quality at low cost, engage the services of highly skilled manpower, use technology for operational efficiency and reap economies of scale. They can locate outlets in strategic locations and adopt aggressive marketing strategies. These improve their profitability position significantly.
16

Domestic retailers have to improve the quality of goods and services offered and their scale of operations to compete effectively with the foreign players. They have to enhance their profitability for survival as well as growth.
Shils and Taylor (1997) identified social and economic effects of FDI. Social effects include joblessness and socialization. Major economic effects include closure of small retail shops which cannot compete, loss of jobs including owners, called the "drain away" effect due to the moving of activities from small retailers to mega retailers. For entry, mega retailers' promise increased number of jobs, but the actual may fall short. For a new part-time job in a mega store, about 1.5 full-time jobs are lost in smaller stores.
Mega retailers pay minimum wage to most of their employees, with limited opportunity for growth or promotion. Most of them have no unions which is detrimental to majority of the employees. When they close down operations after some period, retail gap and higher unemployment occurs (Dalal et al, 1994).
Investment in the logistics of the retail sector is crucial. There are only 5,386 stand-alone cold storage units, with an aggregate capacity of 23.6 million metric tonnes and 80% of it is used for potatoes. Also, the farmers get only a third of the price paid by the final consumer due to intermediaries (Government of India, 2010). Inadequate storage facilities make farmers face wastage in quality and quantity of produce and incur losses. About 25-30% of fruits and vegetables and 5-7% of food grains are wasted in India (Government of India, 2007). Relaxing FDI norms facilitates investment in forward and backward infrastructure, viz., cold chains, warehouses and distribution centers which reduces wastages and food inflation. It facilitates growth of domestic retailers with technology up gradation and benefits agriculture and allied activities, food processing, manufacturing and packaging sectors. With multiplier effects, the related sectors and employment opportunities develop.
There are benefits to the domestic economy as well. While some big domestic retailers are forging ahead well, some others have set up joint ventures with foreign retailers to operate in India. Such joint ventures generate employment opportunities. Kirana stores serve the neighbourhood, offer home delivery, provide credit facility and maintain personal contact with customers and thus thrive despite competition from big retailers. Some foreign retailers have announced tie-up plans with local kirana stores.
The FDI inflow was US$ 25 billion in 2007-08, a growth of 56% over 2006-07, mainly in infrastructure sector and capital market. The inflow into the real estate sector has made it grow over 30% annually; facilitating the growth of big-size retail formats (Images F&R Research, 2009). The flow for single-brand retailing was US$ 194.69 million during April 2000-March 2010 (Government of India, 2010). Some global retailers (e.g. GAP, JC Penney, Tesco and Wal-Mart) have been sourcing from India and switching from third-party buying offices to wholly-owned or managed offices. When foreign retailers' net exports are positive, India gains. With global needs, they get better margins from big suppliers and pass on the benefit to consumers. On the flip side, they attract the high income group with premium brands, diverting resources from production of necessities which reduces social welfare. The operational expenses of small retailers are low due to low costs of labor and overheads and those who modernise survive and grow while the weak exit. Instead of buying from traders, distributors or middlemen if they buy from the cash & carry store their competitive strength improves.
Foreign retailers may like procuring products directly from farmers and manufacturers on large scale, eliminating intermediaries, for better margins. But, managing agricultural supply chain is difficult. Opportunities exist for domestic entrepreneurs in this area.
There are studies which indicate that foreign retails harm the interests of the domestic economy. Some studies (Beaumont, 1994; Stone, 1995; Stone and Artz, 1999) have found that mega retailers affect the nearby smaller retailers adversely in terms of sales and job losses in the short run. The study of Cotton and Cachon (2007) has concluded that small retailers experience a fall in gross sales when mega retailers enter the city and the decline is stronger within five miles of the mega retailers when compared to retailers located farther; they can identify their competitive advantages and disadvantages vis-à-vis those of mega retailers and plan innovative strategies to compete better. The sales and employment position of mega retailers will grow at the expense of the smaller ones and this impact is higher the closer the distance to mega stores.
On the other hand, some studies point out the positive effects of the foreign retailers on the domestic economy. Archer and Taylor (1994) found that small retailers can survive under the shadow of the big retailers through better customer service due to smaller size. Berry (2001) stated that retailers can survive and succeed by using five best practices, called the "Five Pillars of Retailing". These are: solving customers' problems, treating them with respect, emotional connection with them, setting the fairest (not lowest) price, and saving customers' time, which should be implemented in the same order for effectiveness. Mega stores provide better retail experience to customers which attract affluent customers. As per ICRIER (2008), unorganised retailers near malls and hypermarkets had a fall in sales and profit initially and this adverse impact weakened over time.
17
Overall, the positive effects on the economy could outweigh the negative effects. Foreign retailers introduce new technology and international standards in product quality and operational efficiency. This activates domestic units to compete on pricing, product range and service and makes the organised sector grow faster. Incomes of farmers increase significantly with better margins through direct selling to the organised retailers than from sales to mandis or intermediaries.
Conclusion
To conclude, relaxations of FDI norms have accelerated the progress of retail sector in developing countries. Indian Government is cautious in this respect with a view to protecting the unorganised sector. However, the number of foreign retailers operating in India is increasing and the domestic retailers have been adapting to the change. The FDI in the retail sector helps improving infrastructure, operational efficiency and employment opportunities. It activates the retail sector with better business models and competition. In sum, India benefits with the entry of foreign retailers.
Annexure 1: Single Brand Retail
The Players
Many foreign brands are sold in India (e.g. Nokia, Reebok and Rolex), through franchisees or joint ventures with Indian partners. Yishion(China) plans to have 125 sale points in India by 2012. Inditex(Spain), Europe's largest clothing retailer, opened in June 2010 a store in India. Max (Middle East) had 16 outlets and plans to have 53 by March 2011. Marks & Spencer Reliance India [joint venture between UK's Marks and Spencer (51%) and Reliance Retail (49%)], has 15 stores and plans to have 50 by 2014. Some retail brands (e.g. Puma, Tommy Hilfiger and United Colors) have factory outlets.
There are fast food chains such as McDonald's India, KFC and Pizza Hut of foreign retailers. Some are in the offing viz., Pizza Company and Spicchio Pizza(Thailand), Coffee Club(Australia) and Revive Juice Bars(UK). Yum! is a $12 billion global restaurant chain and has opened in India KFC(1995), Pizza Hut(1996) and Taco Bell(March 2010). As in December 2008 there were 147 Pizza Hut and 45 KFC restaurants in 35 and 14 cities respectively, and Taco Bell has one in Bangalore. Yum! Plans to open 100 more outlets by 2015. The case of McDonald's India is detailed below.
McDonald's India
McDonald's (USA) and two Indian companies, Hard castle Restaurants and Connaught Plaza Restaurants, have formed the 50:50 joint-venture McDonald's India(MI) in 1996 and started with two restaurants. The first Indian partner manages McDonald's restaurants in west and south India, and the second manages those in north and east India. The menu meets Indian tastes and culture and excludes beef and pork. Vegetarian and non-vegetarian food items are separated at procurement, cooking and serving stages. Affordably and value are considered in pricing. Quality is maintained through economies and cost optimization. The MI integrates into the community by working for locality development.
In 1940 Dick and Mac McDonald (brothers) opened McDonald's Bar-B-Que in San Bernardino, California. Called McDonald's since 1948, it became a successful chain serving burgers, fries and beverages. Ray Kroc joined it as a franchisee in 1954. In 1955 McDonald's Corporation emerged with a restaurant in Des Plaines, Illinois. In 1960 Kroc bought exclusive rights for McDonald's and expanded it through franchisees and suppliers. It has become a leading global chain, with over 32,000 restaurants serving over 60 million people in 118 countries daily with consistent food of quality and uniform methods of preparation in all restaurants.
The MI has 169 restaurants, all self-owned, in 30 cities, employing over 5,000 people. It serves about five lakh customers daily. The sale was increased by 35% in 2009. It intends adding 180 restaurants by 2015 and employing over 12,000 people. A restaurant requires an investment of around Rs.3 crore, and employs about 40 people. It exports to the Middle East. Its products are popularised through kitchen tours. It has introduced home delivery of meals in Mumbai in 2004 and later the web-based door delivery in Hyderabad and elsewhere. Though the footfalls in India are the highest in the world, the average bill amount is the lowest. The strategies of MI include bulk purchases, long-term vendor contracts, and efficient manufacturing. It sources over 90% of its products within India with backward integration to the farm level. As in October 2010, MI had eight drive-thrus in India which format is the most profitable globally.
Initially the marketing efforts focused on outlet design, opening new stores, public relations and Indian menu. In the year 2000, MI began TV advertising to establish an emotional link between the Indian family and the brand and projecting McDonald's as a familiar and comfortable place for families and kids. It guarantees one-minute service and propagate events in-store for mothers and children. In 2004, the Happy Price Menu was launched for youth. In 2008, in a campaign “Yesteryear's Prices”, MI used father-son film stars to emphasize that prices did not change in line with time. Tie-ups were made with Indian sports (e.g. IPL cricket tournament). In 2009, MI won the CNBC Awaaz Consumer Awards for the third time.
18

(Source: Financial Express, 2009; www.business.mapsofindia.com; www.casestudyinc.com; www.dnb.co.in; www.ibef.org; www.mcdonalds.com; www.mcdonaldsindia.com).
Annexure 2: Cash-and-Carry Format
The Players
Metro AG (Germany) and Wal-Mart (USA) have opened C&C stores for wholesale business in India and some others have planned to enter. They are detailed below.
Metro AG
Metro AG has established Metro Cash & Carry in India as a wholly owned subsidiary. Its first cash & carry (c&c) wholesale distribution centre, the first such format in India, was opened in Bangalore in 2003. It sells about 17,500 quality products in bulk at best prices in a space of 6,500 sq. mt. It sources produce from about 2,000 farmers in India for its stores. The two distribution centres and headquarters in Bangalore involved capital expenditure of Rs. 176 crore (€ 35 million) and employ around 300 people in the stores and 150 in the headquarters. Many employees were trained overseas.
Metro is the world's third largest retailer operating in 30 countries with 650 stores with a turnover of € 33.1 billion. It had five stores in India as in March 2010 (Bangalore (2), Mumbai, Hyderabad and Kolkata). It has signed a Memorandum of Understanding with Punjab government to open six stores with an investment of Rs.900 crore. Its marketing strategies include loyalty programmes for customers (e.g. Metro Bandhan).
Bharti Wal-Mart
Bharti Wal-Mart Pvt. Ltd. (BWPL) is a 50:50 joint venture between Bharti Enterprises, a business group of India in telecom, agri-business, insurance and retail, and Wal-Mart Stores Inc. (USA), the biggest global retailer. Their c&c stores are named 'Best Price Modern Wholesale'. Wal-Mart is reputed in efficiency, logistics, sourcing and supply chain management. The BWPL has started operations in 2009. As in September 2009 it had 544 associates and by October-end 2010 four Best Price stores (Amritsar, Chandigarh and Jalandhar in Punjab and Kota in Rajasthan). It offers about 6,000 items, at competitive prices. It employs over 200 people. It provides back-end supply chain management operations for farmers and manufacturers and minimizes wastage, especially of perishable items. It enables farmers and small manufacturers to become successful entrepreneurs. It supplies to its front-end 'Easy Day' stores (supermarkets and hypermarkets). Bharti Retail (a wholly-owned subsidiary of Bharti) has a franchise agreement with Wal-Mart for retail technology. It has 48 small and two medium stores in Punjab, Haryana, Rajasthan and Delhi to which BWPL supplies products. Wal-Mart has been procuring products in India valued at US$ 125-150 million, through its office Wal-Mart's Global Procurement in Bangalore, for global stores. Major categories include home textiles, apparel, footwear, leather accessories, jewellery and houseware (e.g. diningware and home-decor). The BWPL plans to open 10 more c&c stores in India during 2010-15.
The BWPL had invested about $25 million (about Rs.115 crore) in Punjab, and planned to open 10-15 outlets during 2010-13. It has intended sourcing from about 35,000 farmers during 2010-15 by providing expertise and technology to them for supply chain efficiency. During 2010, it procured fruits and vegetables from over 600 farmers in India. It expected to employ 6000-7000 people during 2010-13.
Others
Carrefour, the second-largest global retailer, and the largest in Europe, procures products worth about $2 billion from India for international outlets. It has two units in India viz., Carrefour WC&C India, a c&c venture and Carrefour Master Franchise Company for retailing. It is working with over 100 farmers in two villages in Delhi and Haryana to procure produce. Trent's Star Bazaar (of Tata group), with over 50 stores in India, was partnering with Tesco (UK), the third largest global retailer, for c&c business and support for back-end activities, to start by the end of 2010.
(Source: Business World, The Wall Street Journal, March 23, August 4, and Oct 27, 2010; 2010a and 2010b; www.metrogroup.de; www.walmartstores.com).
References
Archer, J.S. and D. Taylor. (1994). Up Against the Wal-Marts. New York: American Management Associations.
Beaumont, C.E. (1994). How Superstore Sprawl Can Harm Communities... And What Citizens Can Do About It. Washington: National Trust For Historic Preservation.
Berry, L.L. (2001). "The Old Pillars of New Retailing," Harvard Business Review, 79(4): 131-37.
Business Line, 'Retail sector needs back-end support to address technology gap', Oct. 4, 2012.
19

Business World. (2010a). Policy blow on cash & carry, May 24.
(2010b). Carrefour To Enter India, In Talks With Partner, February 19.
Cotton B., and J. Ch. Cachon. (2007). Resisting the giants: small retail entrepreneurs against mega-retailers - an empirical study, Journal of Small Business and Entrepreneurship 20(2): pp. 135-150
Dalal, M., J. Al-Khatib, M. DaCosta, and R. Decker. (1994). “Why do Small Towns Lose Retail Business?: An Empirical Investigation,” Mid-Atlantic Journal of Business, 3(3): pp. 241-252.
Financial Express. (2009). McDonald's India to open 180-190 more restaurants by 2015, May 26.
Government of India. (2010). Department of Industrial Policy and Promotion, Discussion Paper on Foreign Direct Investment In Multi-Brand Retail Trading, July 6.(2007).
Ministry of Agriculture, Department of Agriculture and Cooperation, Annual Report 2006-07.
Images F&R Research. (2009). India Retail Report, in www.indiaretailing.com
Indian Council for Research on International Economic Relations (ICRIER). (2008). Impact of Organised Retailing on the Unorganized Sector, May.
National Sample Survey Organisation (NSSO). (2008). Report No. 531, Employment and Unemployment Situation in India 2007-08.
Rashmi Bansal (2004), Game for entrepreneurship?, BusinessWorld, 4 September.
Shils, E., and G. Taylor. (1997). The Shils report: Measuring the economic and sociological impact of the mega retail discount chains on small enterprise in urban, suburban and rural communities. Wharton School of Business, University of Pennsylvania.
Stone, K.E. (1995). Competing with Discount Mass Merchandisers. Ames, IA: Iowa State University of Science and Technology.
Stone, K.E. and G.M. Artz. (1999). Iowa Retail Market Share of Various Size Towns. Ames, IA: Iowa State University of Science and Technology.
Subba Rao S.R. and Sirisha Kondepati (2006) Imparting Entrepreneurship Skills: A Study of Efforts and Achievements in India. Paper for the International Conference on Entrepreneurship and Management, University of Hyderabad, Hyderabad, July 26-28.
Times of India, Retail sector in India growing at phenomenal pace, June 26, 2012.
The Wall Street Journal. (2010). Bharti Wal-Mart to enroll 35,000 farmers, October 27.
Bharti Wal-Mart Opens Third Store in India, August 4.
Metro's business plan for India on right track: official, March 23.
www.business.mapsofindia.com
www.casestudyinc.com/case-study-mcdonalds-india-business-strategy, Jan. 8, 2010
www.dnb.co.in/IndianRetailIndustry/overview.asp
www.dst.gov.in/scientific-programme/st-nstedb.htm
www.ibef.org/industry/retail.aspx, last updated July 2010
www.indiaretailing.com
www.mcdonalds.com/us/en/our_story/our_history.html
www.mcdonaldsindia.com.pdf
www.metrogroup.de/servlet/PB/menu/1006697_l2/index.htm, October 20, 2003.
www.walmartstores.com/AboutUs/276.aspx
AT Kearney. (2009). Eighth annual Global Retail Development Index, June.
Business Standard. (2008). Govt mulls 100% FDI in single-brand retail, October 1.
CB Richard Ellis. (2009). CBRE Global Retail Report, April.
20

Strategic Design Information Systems for Increasing Competitiveness of Small Mexican Business: Vision
Based on the Theory of the Firm and Resources
Dr. Jose G. Vargas-Hernandez*, Andres Jerson Millan-Lopez**
*Research Professor, University of Guadalajara, Jalisco, México.** LAE, University of Guadalajara, Jalisco, México.
Introduction
In Mexico, According to the National Survey of Employment, Wages and Training in the Trade Sector (Encuesta Nacional de Empleo, Salarios'y Capacitación en el Sector Comercio), (ENESCOM, 2005), about 95% of establishments engaged in trade did not have systems for planning and decision making, or simply did not know them. 91% of business has no system to identify or create a customer portfolio and base and 88% do not have systems to identify their suppliers. This reflects one of the main issues which characterizes most Mexican companies "sail on a sea of uncertainty" added to the market imperfections (monopoly or oligopoly), the incorporation of global markets and the inefficiency of Mexican institutions and others factors in which it was not enriched, as it will focus on the point of the lack of culture of information in decision-making by the companies.
Good management of this resource could provide companies sustainable competitive advantage to meet the dynamic market changes. In this vein it can formulate the following question, what effects would be achieved in terms of competitiveness for SMEs if they seize and exploit low cost alternative information resources making them inexpensive business intelligence systems? It is noteworthy that these resources are from public sources and have had a strong but insufficient diffusion in academic and business sectors. So while the development of an entrepreneurial culture on the use of such intangible resources could provide further impetus to the development of entrepreneurial skills in addition to promoting competitiveness.
Importantly, the application and usefulness of this resource will be linked to economic activity and the enterprise carries to give treatment that achieves to create value, in other words, the development of strategies for competitive advantage depends on the skills and capabilities firms have to use.
Literature Review
Mexico has been influenced by the changes caused trade liberalization and integration of global
*Research Professor, University of Guadalajara, Jalisco, México.
** LAE, University of Guadalajara, Jalisco, México.
markets implicitly bringing advances in science and technology, which changes the environment in which companies operate in the production structure of our country. This means that each of these production units has to analyze in detail its position in the market, and in particular the obligation to take advantage of the large body of information technologies to realize it. According to Torres (2000) strategy formulation leads companies to thoroughly review its environment and its competitive scheme so they can define a competitive strategy.
In Mexico, the use and implementation of strategies related to information systems have not been consistently addressed a claim that can be applied to small, medium and even large companies. However, these firms and multinational companies also have achieved competitive advantage by their heavy investment in business intelligence systems. This study aims to inform the SME business sector resources that can be used as a basis for the development and creation of strategies to increase their competitiveness. The high costs of implementing such systems can be lessen with the use of existing information technologies. This paper will present the alternatives that small and medium producers can use to break into the culture of decision making based on information resources as well as inputs for the development of capacities for the development of strategies.
Keywords: Capacities, Competitiveness, Resource Information System, Value, Competitive Advantage, Strategy.
21

Nelson and Winter (1982) consider the promise and the problems that bring the evolution of the economic changes generated by globalization. They argue that economic analysis with the use of resources of a company engaged in the business strengthens their decision making, but more importantly highlights that companies should focus on a better understanding of technological change and the dynamics of competitive process.
In this context, the SME and overall Mexican company must constantly analyze their marketing and organizational plans to address these changes resulting from globalization. For most of the SMEs, globalization means a constant threat. However, there are companies with their capabilities, features and trade liberalization has meant making profits because they can export their products or import profitable products as the technology for commercialization. Unfortunately, most companies intend production to the domestic market of the country which makes it a threat.
Foreign Direct Investment and the entry of products have represented the extinction of many companies to take over the majority of the market. This reflects that growth and sustainability in the market is the major challenge faced by companies in this millennium. According to (Peng, 2006) the strategies that a company should propose, should be based primarily on a combination of planned and deliberate action on those activities that are not emerging, but the basic premise is to design strategies that SMEs can know themselves and know their opponents with an assessment of their forces (F) and weaknesses (D), as well as the opportunities (O) and threats (a) in the environment around them.
Be knowledgeable, capacity development, the use of equity by companies and government support represent some of the alternatives to address this challenge. Strategies to perform must consider social, political and governance factors. It is noteworthy that the regulation for market concentration by Mexican institutions has been poor, their lack of ethics and a high level of corruption in their structures has allowed national and multinational companies exploit these flaws as competitive advantages generating unfair practices. A recent example is the case WALMART occurred in April this year.
In this vein, to analyze the environment should lead to a result that defines what are the strengths and weaknesses of the company in relation to its current and future competitors, to make these sources of dynamic competitive advantage. Companies are different among them; their behavior is described in the theories of the firm on how to compete (Peng, 2006). There are three leading perspectives in which companies have to build and develop strategies to achieve competitive advantage known as the tripod strategy. The first is a vision based on the industry where it is suggested that a company should review first the forces driving competition in the sectors of economic activity with which it interacts.
Companies face competitors and prevail in a rivalry with them. These potential competitors are considered as a threat for its possible entry into the sector, displayed bargaining power of suppliers, the bargaining power of customers and the constant threat of the entry of substitute products (Porter, 1985). The second view is focused on the resources and capabilities of a company. The binding constraint on the rate of growth of a company is provided by the current management capabilities (Penrose, 1959).
It is therefore important to note that companies should have the ability to identify competitive forces and generic strategies through a model that highlights specific business activities in which they can better implement competitive strategies. If a small producer in the food sector develops its skills can add value to their product but with more emphasis on marketing activities using information on marketing and commercialization that could identify its clients in a certain area and more. Surely an information system for the producer will have a strategic impact.
The value chain considers a company as a series of activities where each margin adds special value to the products or services of a company (Porter, 1985). The skills and abilities of the entrepreneur or business managers are a key part of the strategic design to provide them with sustainable competitive advantages, but there are different capabilities in all human beings that can limit maximum utilization of resources bounded rationality (Simon, 1947).
The present information is an essential element for survival in a competitive environment. Its evolution has been in recent years "explosive" under the technological revolution that has become an affordable, everyday and indispensable tool because without it the permanence of a company in the market would be virtually impossible. According to Laundon (2008) an information system is a tool with which a company can process information and can be defined as a set of interrelated components that capture, process, store and distribute information to support decision-making and control an organization.
Firms need to emphasize work with intangible assets such as a particular technology, the intellectual and information resources. The latter are often invisible in a company and can be a real source of unique competitive advantage that can be sustained with time as set by Itami and Roehl (1987).
Research Methodology
To support the above assumptions it has used an analytical and exploratory method as well as the fieldwork. According to the data observed in the ENESCOM (2005), a random search was conducted in the National Directory of Economic Units
22

(Directorio Nacional de Unidades Económicas, DENUE) in the municipality of Zapopan in order to find a small or medium enterprise (SME). The high probability of finding a company with the required characteristics facilitated finding the candidate: PNEUMAX as the company selected for the experiment; lacks an information system that allows you to develop strategies to position themselves in the market. It was proposed to address the implementation of an information system.
To achieve this, it was examined and determined that the possessed information needs were and the proposal was based on the value added, that when using a geographic information system (GIS) as a tool for commercialization and generating marketing strategies in order to improve decision-making and achieve efficient resource management and reduce uncertainty that the company had on market characteristics. The implementation of this system required the organization and systematization of statistical and geographical data available.
Structured information in the proposed geographic information system (GIS), allowing administer, manage, analyze and model situations present in the geographical areas where there are launched the company strategies, which potentiates its use as a support tool in planning activities and decision making.
The resources used to implement the system are the following:
· IRIS GIS Software 4.2, Google Earth or Arc Map 10.
Digital geographic products: Digital urban maps, business directory geo-referenced DENUE 2011, national geo-statistical frameworks with a projection and a datum CCL ITRF92 reference. The cost was representative only, the following table shows:
Results and Discussion
Case: Distribution PNEUMAX of México
PNEUMAX is a marketer and distributor of pneumatic equipment: cylinders, valves, solenoid valves, hoses, pistons, drivers, etc. It also offers specialized services automation machinery. Currently the firm has two places in the country: the matrix, located in the city of Guadalajara and one in the State of Mexico.
This case study presents the results obtained by the company PNEUMAX of Mexico to implement a geographic information system that allowed it to develop properly and timely marketing strategy to position its product portfolio in the market. Also the system implemented by PNEUMAX was aimed to expand its market in other regions and gain greater market share.
· Location: Volcano Popocatepetl 1844 Colony The Urban Colli, Zapopan, Jalisco. C.P. 45070. Phone: 36 20 35 99.
· Activity: Wholesale of other machinery and equipment for general use, 435,419.
· Economic unit size: 15 employees.
· Mission: To be a leader in the domestic market of pneumatic elements offering customers products and services that meet their needs in price, quality and service.
· Vision: The Company has a very important purpose, the continually expanding in order to be the best company of pneumatic equipment, with criteria of competitiveness, quality products and services.
The recommendations to the company PNEUMAX are based on the following assumptions:
• To identify the information needs of the company.
23
Proposal
0
0
1,667
12,000
13,667
Urban mapping work zone
Google earth
Business directory 2012
Training
Total

• A training program for sales management, on management of GIS.
Consult and acquiring banks geo-referenced information requirements (business directory).
• Lower network GIS software Google Earth.
• Hardware for processing and output of information according to business needs: computer and printer.
The recommendation is centered on the implementation of a geographic information system (GIS) as it seeks to strengthen the marketing strategies for PNEUMAX more productive and therefore more competitive in the market.
Marketing Plan
For the definition of the working area began by identifying the geographic coverage in order to define the areas of sales.
Geo-referencing the establishments' directory by mapping to determine the distribution and concentration of more than 3035 companies in each State selected. This allows, from a spatial perspective, to observe the composition of the market and to determine the areas of sales, to establish clusters and get the database to develop the marketing plan.
Once kown the geographic distribution on the map, it begins to generate the cluster according to the activities and occupation. PNEUMAX handles profiles of services and products according to the characteristics of firms, depending on their activities and spin. This classification allows the firm to determine the needed profiles to be able to offer their products and service packages. So, the next step is to classify firms by size, but especially for their activities.
This procedure used spatial analysis tools of GIS support called ARC MAP, in order to structure and define the cluster. Note that this system will be good enough to convert formats, shape to formats. Kml, extensions that the system recognizes in Google Earth interface.
As seen in the maps above, the determination of cluster or clusters was based especially in the activities of the company. For example, it can be seen the concentration in the city of Guadalajara of companies engaged in furniture category with a blue pin and those involved in the food industry with a pin in the form of a factory.
The specificity of this information has added more value, as each geographical object representing a firm on a map is associated directly with a database that identifies and determines specific characteristics of each of the companies, such as its name and social registered name, address, email address and the name of its legal representative.
The system also features three dimensional pictures of the streets of the cities of the country, giving them a concrete picture of companies to visit.
Another important thing to mention is that the company can trace routes and visit sequences and determine which direction to take to get from one point to another.
Based on this information, management takes appropriate decisions to determine which vendors will cover the new market. Moreover, according to this analysis of the information obtained, it may be a need to hire new vendors that meet and attend the new outlets and sales points.
Now PNEUMAX geo-referenced has a directory that allows it to implement effective marketing strategies which can steer the company to achieve its objectives and to boost productivity and become a competitive company in the field of its product distribution.
Conclusions
The results are reflected primarily in the planning and organization functions: setting goals and the appropriate course of action to achieve them. By implementing a gevraphic information system, it has helped to define strategies to positioning in the market portfolio of products offered, the design- of a strategic plan for marketing based on a detailed analysis of the composition of potential customers in the metropolitan area of Guadalajara, Monterrey, Mexico City, Queretaro and Guanajuato.
The creation and implementation of an efficient logistics aims to set the procedure for promotion, sale and distribution of products. Moreover, the geographic information system allowed the organization to define the direction of human resources effectively, to implement strategies designed in order to achieve the goals: customer acquisition and increased volume of daily sales.
The information system allowed the company to have a control to ensure that activities conform to planned activities by management.
24

In short a good implementation of an information system can provide:
• Increased accuracy and effectiveness in the strategies developed.
• Reduced risks and uncertainty in decision making.
• Physical assessment of the current market.
• Physical assessment of the potential market.
• Placing a product in a chosen segment.
• Optimization vendors, outlets and sales routes.
• Exploration of new markets.
Now regarding the implementation costs are reduced significantly, the use of public information packets and software can be reduced from 70% to 90%.
Now it can be assumed that the high costs of implementation and access to information can be more limiting for companies who cannot have information systems. However it is observed that with affordable substitute products, costs can be used by companies as a strong business intelligence tools.
The importance of being able to develop a culture of information use and management, use of information technologies and systems focused on the business of small and medium entrepreneurs will have a direct impact on the competitiveness of SMEs
Increased government intervention mechanisms developed by institutions such as INEGI, Secretary for Economic Development, Chambers of Commerce and industry among others would be essential for the specialization of SMEs in development strategies.
References
Itami, H. A. (1987). Mobilizing Invisible Assets. Cambridge, Mass.: Harvard University Press.
Laundon, K. C. (2008). Sistemas de información gerencial administración de la empresa digital. Naucalpan, Edo de México: Pearson.
Nelson, R. R. and Winter (1982). An Evolutionary Theory of Economic Change. Cambridge, Mass.: Harvard University Press.
25
50,000
38,626
1,700
12,180
102,506
Urban mapping work zone
Commericial proposal
PNEUMAX SA de CV Price (pesos)
Arc Map 10
Directory of firms 2010
Training on ARC MAP by persons
Total
Alternative proposal
Urban mapping work zone
Google earth
Directory of business 2012
Training
Total
Sources : ESRI, INEGI.
0
0
1,667
12,000
13,667

Peng, M. W. (2010). Estrategia Global. México, DF: CENAGE Learning.
Penrose, E. T. (1959). The Theory of the Growth of the Firm. New York: John Wiley & Sons.
Porter, M. (1985). Competitive Advantage: Creating and sustaining superior performance.
New York: A. Division of Simon and Shuster Inc.
Simon, H. A. (1947). Administrative Behavior. New York, NY.: Macmillan.
ENESCOM (2005). ENESCOM. En S. d. Social, Encuesta Nacional de empleo, salarios y capacitación en el sector comercio.
Torres, H. A. (2000). Mercado y Agronegocios: Situación y perspectivas del gerenciamiento de las agroempresas. Revista Mexicana de Agronegocios , 44-58.
26

A Study of Corporate Social Reporting ofthe Market Leaders
IntroductionCorporate Social Responsibility (CSR) has become the matter of great concern amongst the policy makers the world around. It is increasingly dawning on the policy makers that the ruthlessness of the ways in which corporates are depleting the natural resources may lead to disruptive consequences of which global warming is the phenomenon which the world is already facing. CSR can be understood as the actions of corporates in which they discharge their roles as a social enterprise. The actions of the enterprises majorly affect all its stakeholders including government, suppliers, employees, community, customers and future generations. Thus, the responsibility of an entity towards all the stakeholders forms the subject matter of CSR. Thus, the affairs of firms should be managed to ensure harmony with society, customers, environment and community at large without compromising on the sustainability.
“Today we are talking about triple bottom line reporting which includes People, Planet, and Profit, wherein people relates to fair and beneficial business practices for human resources, the community and region where a firm carries out its business activities; planet refers to sustainable environmental practices whereas profit is the economic value created by the organizations after deducting the cost of all inputs, including the cost of the capital tied up”1.
Considering the growing significance of the need for every organization to be a social, caring and humble organization rather than just being driven by capitalist principles, a number of reporting guidelines or standards have been developed to serve as frameworks for social accounting, auditing and reporting by various foundations like, Fair Labor Association, Accountability's AA1000 standard, based on John Elkington's triple bottom line reporting, Global Reporting Initiative's Sustainability Reporting Guidelines, Earthcheck Certification / Standard, Social Accountability International's SA8000 standard, ISO 14001 Environmental Management Standard; ISO 18001 Occupational Health and Safety Standard, ISO 9001 Quality Standard etc.
Thus, it can be construed that CSR focuses on the effects of business activities on their employees, suppliers, customers, society, environment and energy consumption. CSR thus requires aligning business activities on the principles of trusteeship and stewardship which long seems to be lost in the din and clutter of capitalism. Over a period of time, the corporates across the globe are under the scanner of the government for fulfilling and discharging their roles as a social entity.
In this backdrop, the present study is organized into six sections. Section-1 introduces the theme. Section – 2 states the objectives of the study; Section – 3 presents methodology; Data analysis and interpretations are discussed in Section –4 and Section – 5 concludes the results. Section – 6 presents current developments in CSR in Indian context.
Objectives of the studyThe present study is conducted with the following objectives:
a. To analyze the CSR reporting practices of the market leaders.
b. To study the nature of voluntary CSR disclosures made by market leaders.
Dr. Sumita Shroff GoyalAssistant Professor, School of Commerce and Management
Central University of Rajasthan, Bandarsindri, Ajmer
Corporate social responsibility in today's times has gained much attention abroad as well as in India. The governments of the economies across the globe are taking measures to ensure that the economic activities are not flourishing at the cost of the society, environment and the stakeholders of an organization. In this back drop the current study attempts to examine the corporate social reporting practices of the selected BSE listed firms of India over a period of 5 years from 2008-09 to 2012-13. The analysis revealed that there has been rise in the corporate social reporting disclosures over the study period with major rise being in the environmental management group. Further, an attempt was also made to examine the determinants of the corporate social reporting for the sample firms by taking firm size, leverage, board size, independence of board and profitability as explanatory variables and the corporate social responsibility and disclosure score as response variable. The analysis reveals that CSR activities of the market leaders is independent of all these variables and it is concluded that the market leaders consider CSR as their duty and the same is ingrained in their DNA.
Key words : Corporate Social Responsibility Reporting Profitability Stake Holders.
27

c. To find out the variable of CSR on which disclosure is made by majority of sample.
d. To find out if the market leaders have prepared Business Responsibility Report as mandated by Ministry of Corporate Affairs (MCA).
e. To examine the impact of Board Independence, Board Size, Firm Size, Leverage and Profitability on CSR Performance of the market leaders.
Research methodology
Time Frame: A five year period from 2008-09 to 2012 -13 is selected for the study in order to find the CSR reporting practices over a period of 5 years.
Data: The secondary data was collected from the Annual Reports of the sample. The annual reports were used as the main source of data
Sample Selection: The present study aims to analyze the CSR reporting practices of market leaders because their practices would reflect the practices followed by the others in their respective industries as they are most exposed to the public as well as incessant oversight and hence are expected to be highly transparent by providing all information for decision making in the capital market. Also, they are subjected to the norms of both viz, The Ministry of Corporate Affairs (MCA) and Securities Exchange Board of India (SEBI), the market regulator. For identifying market leaders, 30 companies comprising the BSE SENSEX are selected for the study which forms the population of the study. Of these, annual report of 4 companies was not available on their respective websites and hence, it was not possible to carry out analysis on them. Since the impact of corporate characteristics on CSR performance is to be found out, the 3 companies belonging to banking sector were eliminated due to the specific nature of their business. Further, 5 government companies were also eliminated from the sample on the grounds that their CSR practices are to be far better than that of privately owned companies. Further, in case of 1 company a lot of irregularity was found in terms of accounting items and the matter reported in annual report and hence the same was eliminated. From the remaining 12 companies were selected randomly for the purpose of analysis which is listed in Table – 1.
Research TechniqueContent analysis is carried out in this study on corporate annual reports of study samples for the years 2009, 2010, 2011, 2012 and 2013 to measure the CSR information reported. Content analysis has become a principal technique to study CSR disclosures in corporate annual reports as it aids understanding of the meanings, motivations and corporate intentions as well as qualitative data. This technique has been used widely by many researchers and is used in present study it will help in revealing the nature, type and extent of CSR disclosures.
An index of 51 CSR parameters for CSR reporting was identified surveying the literature, in order to find out the actual disclosure practices of sample and is known as CSR Disclosure Index (CSRDI). This index is further sub-divided into six groups, i.e., i) General CSR; ii) Energy Conservation; iii) Environment Management; iv) Employees; v) Product Information and vi) Community Development, to find out the thrust of CSR disclosures by the market leaders which is given in Table – 2.
Further, an attempt has been made to quantify these parameteprs to enable quantitative analysis. According to Riffe et al2, “Quantitative content analysis is the systematic and replicable examination of symbols of communication, which have been assigned numeric values according to valid measurement rules and the analysis of relationships involving those values using statistical methods, to describe the communication, draw inferences about its meaning, or infer from the communication to its context, both of production and consumption”.
In order to facilitate the measurement, a disclosure is defined as any passage of written or any form on any CSR parameters identified in the Table – 2. Therefore, CSR disclosures were rated based on the presence or absence and the degree of specificity of each item. Level of extensiveness was measured and categorized into four groups according to the nature of CSR information disclosed, which is discussed as follows:
(1) General Information – General information may consist of 'a short' statement of either company's intention or general statements of 'the company will, the company does' nature on CSR or any general statement of a sentence of length and a score of 1 is assigned in this case.
(2) Qualitative Information – It includes any declarative/ narrative CSR information other than financial information in nature and may also contain 'a long' description on the CSR performance of the companies, wherein - 'long' means more than one sentence. It also includes pictorial information such as graphs and photos depicting specific environmental message or event and a score of 2 is assigned in this case.
28

3) Quantitative Information – It relates to disclosure of actual financial numbers or any quantifiable CSR information. For example, number of trees planted, expenditure on environment management programmes, number of beneficiaries due to health programmes, savings in cost due to environmental initiatives, number of environmental activities undertaken, savings in consumption due to conservation of water, paper or any other natural resource etc. A score of 3 is assigned in this case.
(4) A Combination of Qualitative and Quantitative Information – This means that the disclosure is made in the report in qualitative as well as quantitative terms and a score of 4 is assigned in this case.
Finally, the type of information disclosed was scored as follows:
1. The numerical values were assigned individually to all the selected identified CSR variables listed in Table – 2 to all the companies for all the years.
2. The sum was obtained for all the companies individually for the entire CSR variables for all the years.
3. In order to find out the reporting practice of market leaders with respect to each variable, score was obtained by summing up all the companies' scores for each item and mean scores were derived by taking arithmetic mean.
4. The scores so derived in (2) and (3) were termed as CSR Disclosure Score (CSRDS) which represents CSR Performance (CSRP).
5. The mean scores were also obtained group wise (6 Groups as discussed in Para 4.4) and year wise for the market leaders.
6. Then, the percentage of sample reporting on each variable was found out to analyze the most popular area of CSR disclosures by the market leaders.
Hypothesis of the Study and Specification of Model:Firm Size: Firth3 advocates that large firms will disclose more information to improve the reputation of the firm since they are more visible in the “public eyes”. Cowen et al4 observe that the larger companies are subject to more of stakeholder groups' attention and therefore they are more likely to receive greater pressure to report about their social responsibility Developments. The empirical studies of Trotman and Bradley5, Cowen et al4, Hossain et al6, Haniffa and Cooke7 and Ghazali8 have showen a positive relationship between firm size and the level of social disclosures. Firm size (Size) is measured by taking natural log of Sales of the sample. Based on the results of previous study the first hypothesis of the present study is:
H01: There is no significant impact of Firm Size on CSRD.p
Leverage: Purushothaman et al9 argued that highly leveraged companies may have closer relations with their creditors and hence these firms disclose more CSR information in their annual report narratives. Al Arrusi et al10 also supported the view by stating that when a firm is making a large use of debt, a monitoring problem arises between stockholders and creditors and so the firms solve this problem by increasing the level of voluntary disclosure. Previous empirical studies have produced mixed results. Belkoui and Karpik11 found a negative association between leverage and CSD level and explained that firms with a high leverage must adhere to strict debt covenants which reduce their ability to spend resources on CSR and disclose information about CSR. Similar results were reported by Hagerman & Zmijewski12, Dhaliwal et al13 and Cormier and Magnan14. Conversely, Reverte15 did not find any association between CSRD and gearing. Leverage (Lev) is measured by taking the ratio of Total Debt to Total Assets. Thus, the second hypothesis proposed is: H02: There is no significant impact of Leverage on CSRD.
Profitability: Haniffa and Cooke7 explained that profitable companies have the freedom and flexibility to implement and disclose social responsibility activities to stakeholders, in order to legitimize their existence. Prior research examining relationship between profitability and CSRD has produced mixed results. Preston16 concluded that a higher ROE leads to high CSR disclosures. Mills and Gardner17 also concluded in their analysis of the relationship between social disclosure and financial performance that companies are more likely to disclose social responsibility activities when their financial statements indicate favorable financial performance. However, Cowen et al4, Hackston and Milne18 and Echave and Bhati19 did not find any relationship between the two. The profitability (Prof) is measured by Return on Total Assets which is derived by dividing earnings before interest and tax by total assets. The third hypothesis of the study is:
H03: There is no significant impact of Profitability on CSRD.
Board Size: Aktaruddin et al20 found a positive association between board size and level of corporate voluntary disclosure. “Further, the ability of directors to control and promote value creating activities is more likely to increase with the increase of directors on the board. With more directors, the collective experience and expertise of the board will increase, and therefore, the need for information disclosure will be higher. Thus, Board size may influence the level of voluntary disclosure as the
29

level of disclosure is a strategic decision made of the board of directors.”21 Board Size (BS) is measured by taking the number of members on Board of the companies. Thus, the fourth hypothesis of the study is:
H04: There is no significant impact of Board Size on CSRD
Board Independence: Fama and Jensen22 observed that outside directors are seen as expert in decision controls. It is believed that the presence of independent directors on the board leads to greater disclosures including social information as they are to consider the stakeholders' perspective. Further, both stakeholder and legitimacy theory also predict that proportion of independent directors would be associated positively with the decision to disclose CSR and the extent of CSR disclosure. Study of Abdur21 also found a positive association between the two whereas Haniffa and Cooke7 found a negative association of board independence with CSR. Independence of board (BI) is measured by dividing number of independent directors by total number of directors on board. The fifth hypothesis of the study is as follows:
H05: There is no significant impact of Board Size on CSRD
Specification of Model: Multiple Regression Analysis is applied to examine the impact of selected explanatory variables on the CSRD. Further, the model adopted is as follows:
CSRD = α + β1Size + β2Lev + β3Prof + β4BS + β5BI + ut.
Further R2, Adusted R2 and F-test and p-values are used for the purpose of analysis.
Data analysis and interpretationThe results of analysis of annual reports are discussed as follows:
ISO Certification: ISO 14001 is the International Standard for Environment Management Systems and ISO 18001 is the International Standard for Occupation Health and Safety within the organizations. An attempt was made to find out if the market leaders have any such certifications and the results of the analysis is presented in Table – 3. The analysis of the table – 3 reveals the following:p
It is found that for the years 2009 and 2010 only 58% of the market leaders had ISO certification for Environment Management Systems which has increased to 91.67%, i.e., 11 companies in 2013. This trend reflects the growing sensitivity amongst the market leaders towards environmental issues and taking measures to reduce their footprints over environment and to move towards environmental sustainability.
It is also found that the 91.67% of the market leaders, i.e., 11 of 12 have Occupational Health & Safety Certification which indicates their commitment towards safety of the employees and reflects their caring attitude towards the important assets of the organization which may also be to curb losses to man hours due to accidents.
Analysis of nature of CSR Disclosure made by Market Leaders
The analysis was done by obtaining scores for each of the market leaders and computing arithmetic mean after aggregating these scores yearly for each company as well as for all the companies for a variable for all the years. The ranking of market leaders was also carried out based on their five year average CSRDS. Also, an attempt is made to find out the percentage of market leaders who report the relevant information each year over the study period. The computations are presented in Table – 4, 5 and 6 respectively.
Analysis of CSR Disclosure practices of Market Leaders:
The analysis of Table – 4 is interpreted group wise as follows:
General CSR Only 41.67% of the market leaders had a CSR policy in 2009 which has increased to 58.33% which is a positive sign.
However, still a good number of market leaders have not reported about their CSR Policy or incorporated the CSR principles in their vision, mission statement.
11 market leaders (MLs) in 2009, 2012 and 2013 and all MLs in 2010 and 2011 were observed to be committed to the cause of CSR. Further, the presence of CSR Department or CSR Committee was reported only by 33.33% of market leaders, i.e., only 4 MLs which indicates that the CSR activities of the market leaders are not organized. It is interesting to note that more than 50% of the market leaders have been appreciated for their efforts in CSR through awards and recognitions.
Energy Conservation It is interesting to note that all the market leaders are reporting on energy conservation in all the years. Also, 11 MLs have
reported on utilization of alternative sources of energy in all the years. The reason for both of them was identified to be mandatory reporting requirements as per Section 217(i) (e).
30

It is interesting to note that all the market leaders are improving their business processes to ensure energy savings. Also, almost 50% of the MLs have been identified for their effort in being energy efficient firms by Awards and Recognitions.
The market leaders are also conducting energy conservation awareness programmes which indicates their commitment to the cause.
Environment Management All the market leaders are disclosing on the Waste Management by 2013 indicating measures taken by them to minimize
waste and thereby pollution. By 2013, 83.33% of the Market Leaders have Effluent Water Treatment Plants to treat the waste water and recycle it for use. The reason for the non reporting of others is that water resource is not used in their processes so extensively as the others. Almost all the market leaders are taking care to control pollution in the conduct of their business operations. Almost all the market leaders are disclosing about their carbon footprints in their annual report by 2013. All the market leaders arep actively involved in conserving their natural resources which includes water, paper, air, land, biodiversity, forests and development of wasteland into green belt which again indicates their corporate citizenship. However, Air emissions disclosure is made by only one company and is found to be the least disclosed variable.
More than 50% of the MLs have been recognized for their commitment towards environmental management and sustainability through awards. Also, almost all of the MLs conduct environmental activities like Tree Plantations, celebration of World Environment Day, Green Day, etc. They also conduct environment awareness programmers and all of them have reported on their environmental friendly initiatives. MLs also carry out Environmental Research and Development to assess the ways in which they can achieve the goal of environment conservation and sustainability.
Employees Variable By 2013, 11 MLs are disclosing on their training and development programmes for the benefit and growth of employees.
All the market leaders except 1 have made disclosures with respect to Employee Stock Options. However, of these companies, Tata Steel and Cipla Ltd have not issued any stock options to their employees. Further, Bajaj Auto Ltd had not issued any stock options in 2009 whereas Reliance Industries Ltd had not issued any stock options in 2010.
Very less proportion of companies are disclosing on the programmes for employees or any benefits passed to the families of employees. Similarly not many market leaders have disclosed about their equal opportunity policy. All the market leaders are reporting on Employee Benefits and Welfare as it is required statutorily mandatory.
Also market leaders are getting recognized for their human resource practices in the form of awards and accolades.
Product Variable All the market leaders are reporting on the Product Research and Development activities and this is so because of the
mandatory requirement u/s 217 (i) (e) of the Companies Act, 1956.
At least 50% of the market leaders have ISO Certification for quality in processes and products.
Also majority of the firms are reporting on the product innovation, new technology and improved performance of their products which directly relates to the customers of their customers.
Market leaders have also received awards for their product innovation, quality and safety.
Community DevelopmentMarket leaders are actively involved in activities related to community development like promoting self reliance and livelihoods, education, community health and hygiene, rural development, social development, tribal development, infrastructure development, promoting child welfare, conducting community awareness programmes etc. Also, an interesting finding was that some of the market leaders are also involved in conservation of heritage, culture, and promotion of spiritual development.
Ranking of Market Leaders: The mean CSRDS was computed for all the Market Leaders for all the 51 variables for all the years and ranking of the same was done which is presented in Table – 5.
Based on the same, it is observed that Jindal Steel and Power Limited had made highest CSRD with a score of 152.4 followed by Hindalco Limited, Reliance Industries Limited, ITC Limited, Tata Steel and so on. Cipla Limited is ranked last and has the lowest score of 57.8 which is only 37.90% of the score of Jindal Steel and Power Limited.
Analysis of nature of CSR Reporting of Market Leaders:
The computations presented in Table – 6 are analyzed in this section. Further the analysis of Chart – 1 and 2 is also given here.
31

From the perusal of Chart – 1, it can be observed that there is a significant linear trend in the Mean CSR disclosure scores of the Market leaders over the study period indicating increased sensitivity and commitment or increased disclosure of such activities in their annual reports. The mean score has increased from 105.08 in 2009 to 127.58 in 2013.
From the perusal of Table – 6, it is noted that over the study period there is an increase in CSRD of market leaders on General CSR and in all the years it was found that the market leaders were committed to CSR.
Further from the perusal of Table – 6 and Chart -2, it is observed that there is a consistent rise in Environment Management Score (EMS), Employee Variable Score and Energy Conservation Score. However, Product Variable Score have shown fluctuations. The highest scores are for the category of community development followed by Environment Management.
The increase in EMS indicates an increased focus of market leaders on the environmental concerns. There however, has been decline in community development score in the last two years.
Thrust of CSR activities with special reference to Community Development: An analysis was done on the most focussed activity under community development by identifying 15 different activities. The result of analysis is presented in Table – 7.
From the perusal of Table – 7, it is noted that Health and Hygiene is the most focused activity of community development with 92% of the market leaders focusing their efforts on the same.
Next in order of importance are supporting economically weaker sections of society, rural development, other social activities which includes Blood donation camps, donations in cash to charitable institutions, Training the teachers, principals, hospital administrators or conducting workshops etc.
The same is followed by Education, Creating Livelihoods and Women Empowerment.
Business Responsibility Report: MCA has mandated the preparation of Business Responsibility Report (BRR) to top 100 companies based on Market capitalization on 9 principles of Ethics, Transparency and Accountability; Products Life Cycle Sustainability;Employee's well Being; Stakeholder Engagement; Human Right; Environment; Policy Advocacy; Inclusive Growth and Customer Value from the financial year 2012-13. Hence, an attempt was made to find out if the Market Leaders had prepared the BRR and if so, whether it was part of Annual Report or a separate BRR was prepared. Further, it was also found that whether BRR had substituted the CSR section generally reported by the market leaders or the BRR was over and above the CSR reporting. The result of this analysis after surveying the annual reports for the year 2013 is presented in Table – 8.
From the perusal of Table – 8, it can be noted that all the MLs have prepared BRR. However, 4 of them have prepared it separate from annual report and put up on company's website whereas remaining 8 have appended the same in their annual report.
Further, it was interesting to find that 9 of 12 MLs have given an account of their CSR activities as they normally used to do in past over and above BRR which implies that the MLs have not considered BRR to be a substitute for their CSR reporting and it can be construed that market leaders are committed to the cause of CSR.
Impact of Board Size, Board Independence, Leverage, Profitability and Firm Size on CSR Performance: The outcome of multiple regression analysis is presented in Table – 9.
From the perusal of Table – 9, it can be noted that none of the explanatory variables has any significant impact on the CSR Performance; hence all the five research hypotheses are accepted.
Thus it can be concluded that Firm Size of Market Leaders has no significant impact on the CSR Performance and is not consistent with the results of Trotman and Bradley5, Cowen et al4, Hossain et al6, Haniffa and Cooke7 and Ghazali8
Further, it is concluded that Leverage also has no significant impact on CSR Performance of Market Leaders and is consistent with the empirical results of Reverte15.
Profitability measured in terms of ROTA also has no significant impact on CSR Performance of Market Leaders and is consistent with the empirical results of Cowen et al4, Hackston and Milne18 and Echave and Bhati19.
Board Size also has no significant impact on CSR Performance of market leaders and the results are inconsistent with Aktaruddin et al20.
Board Independence also does not significantly affect CSR Performance of market leaders and the results are inconsistent with Abdur21, Haniffa and Cooke7.
Thus, in the case of market leaders, none of their financial characteristics or governance characteristics is found to have a significant role in deciding the CSR Performance. The reason for the same can possibly be that CSR is woven in the
32

organizational culture of the market leaders and thus it does not depend whether on firm size, profitability or leverage. Market leaders are committed to the cause of CSR and towards all their stakeholders and are discharging their roles as a social enterprise apart from being a business person independent of any factor.
Conclusion It is found that a majority of market leaders have ISO certification for Environment Management implying their growing
sensitivity towards environmental issues.
Also a caring attitude of Market leaders as employers is observed as all except one have Occupational Health & Safety Certification.
It is found that a majority of market leaders have received recognition in some form or other for their CSR activities comprising Environmental Sustainability, Energy Efficiency, Best HR practices, Quality products etc.
It is interesting to note that all the market leaders are reporting on energy conservation in all the years. Also, 11 MLs have reported on utilization of alternative sources of energy in all the years. The reason for the both of them was identified to be mandatory reporting requirements as per Section 217(i) (e).
It is concluded that the market leaders are taking steps towards minimizing waste through recycling and finding innovative and alternative ways to eliminate waste thereby minimizing pollution.
Almost all the market leaders are disclosing about their carbon footprints in their annual report by 2013. All the market leaders are actively involved in conserving their natural resources which includes water, paper, air, land, biodiversity, forests and development of wasteland into green belt which again indicates their corporate citizenship.
Very less proportion of market leaders are disclosing on the programmes for employees or any benefits passed to the families of employees. Similarly not many market leaders have disclosed about their equal opportunity policy. All the market leaders are reporting on Employee Benefits and Welfare and the reason for the same is statutorily mandated.
It is observed that Jindal Steel and Power Limited had made highest CSRD with a score of 152.4 followed by Hindalco Limited, Reliance Industries Limited, ITC Limited and Tata Steel.
Health and Hygiene was found to be the most focused activity of community development with 92% of the market leaders focusing their efforts on the same.
It is observed that from amongst all the groups, the reporting of market leaders is consistently on rise on environmental variables.
It was interesting to find that 9 of 12 MLs have given an account of their CSR activities as they normally used to do in past over and above BRR which implies that the MLs have not considered BRR to be a substitute for their CSR reporting and it can be construed that market leaders are committed to the cause of CSR.
The results of multiple regression analysis indicated that, in the case of market leaders, none of their financial characteristics or governance characteristics had a significant role in deciding the CSR Performance. The reason for the same can possibly be that CSR is woven in the organizational culture of the market leaders which is also found in the course of descriptive analysis and thus it does not depend whether on firm size, profitability or leverage. Market leaders are committed to the cause of CSR and towards all their stakeholders and are discharging their roles as a social enterprise apart from being a business person independent of any factor.
Current developmentsThe most awaited Companies Bill 2013 which was passed by Lok Sabha on 18th December, 2012 and in Rajya Sabha on 8th August, 2013 and received the assent of President on 29th of August 2013 is now the Companies Act, 2013. This act has legalized the Corporate Social Responsibility with the introduction of Section 135. According to this section, “every company having net worth of rupees five hundred crore or more or turnover of rupees one thousand crore or more or a net profit of rupees five crore or more during any financial year shall constitute a Corporate Social Responsibility Committee of the Board consisting of three or more directors, out of which at least one director shall be an independent director.23”
Further, the Board's report under section 134 (3) shall disclose the composition of the Corporate Social Responsibility Committee.
The Corporate Social Responsibility Committee shall,
(a) formulate and recommend to the Board, a Corporate Social Responsibility Policy which shall indicate the activities to be undertaken by the company as specified in Schedule VII;
33

(b) recommend the amount of expenditure to be incurred on the activities referred to in clause (a); and
(c) monitor the Corporate Social Responsibility Policy of the company from time to time.
The Board of every company shall ensure that the company spends in every financial year at least 2% of the average net profits of the company made during the three immediately preceding financial years in pursuance of its CSR policy.
Where the company fails to spend such amount, the Board shall in its report specify the reasons for not spending the amount. The approach is to 'comply or explain'.
Activities which may be included by companies in their Corporate Social Responsibility Policies are also identified and laid down in the statute which are listed as follows :
(i) Eradicating extreme hunger and poverty
(ii) Promotion of education
(iii) Promoting gender equality and empowering women;
(iv) Reducing child mortality and improving maternal health;
(v) Combating human immunodeficiency virus, acquired immune deficiency syndrome, malaria and other diseases;
(vi) Ensuring environmental sustainability;
(vii) Employment enhancing vocational skills;
(viii) Social business projects;
(ix) Contribution to the Prime Minister's National Relief Fund or any other fund set up by the Central Government or the State Governments for socio-economic development and relief and funds for the welfare of the Scheduled Castes, the Scheduled Tribes, other backward classes, minorities and women; and
(x) Such other matters as may be prescribed.
REFERENCES
http://en.wikipedia.org/wiki/Corporate_social_responsibility.
Riffe D, Lacy S, Fico FG (2008). Analyzing Media Messages: Using Quantitative Content Analysis in Research. Second Edition, Lawrence Erlbaum Associates, New Jersey, 2008, cited in Papaspyropoulos K. G., Blioumis V. and Christodoulou A. S. (2010), Environmental Reporting in Greece: The Athens Stock Exchange, African Journal of Business Management, Vol. 4(13), pp. 2693-2704, October, 2010.
Firth, M. (1979). The impact of size, stock market listing, and auditors on voluntary disclosure in corporate annual reports. Accounting and Business Research, 9(36), 273-280.
Cowen, S. S., Ferreri, L. B., and Parker, L. D. (1987). The impact of corporate characteristics on social responsibility disclosure: a typology and frequency-based analysis. Accounting, Organizations and Society, 12(2), 111-122.
Trotman, K. T., and Bradley, G. W. (1981). Associations between social responsibility disclosure and characteristics of companies. Accounting, Organizations and Society, 6(4), 355-362.
Hossain, M., Tan, L. M., and Adams, M. (1994). Voluntary disclosure in an emerging capital market: some empirical evidence from companies listed on the Kuala Lumpur stock exchange. International Journal of Accounting, 29(4), 334-351.
Haniffa, R., and Cooke, T. (2005). The impact of culture and governance on corporate social reporting. Journal of Accounting and Public Policy, 24(5), 391-430.
Ghazali, N. A. M. (2007). Ownership structure and corporate social responsibility disclosure: some Malaysian evidence. Corporate Governance, 7(3), 251-266.
Purushothaman, M., G. Tower, R. Hancock and Taplin, R. (2000). 'Determinants of corporate social reporting practices of listed Singapore companies', Pacific Accounting Review, 12 (2), 101–133.
Al Arussi, A. S., Selamat, M. H., and Hanefah, M. M. (2009). Determinants of financial and environmental disclosures through the internet by Malaysian companies. Asian Review of Accounting, 17(1), 59-76.
Belkaoui, A., and Karpik, P. G. (1989). Determinants of the corporate decision to disclose social information. Accounting, Auditing and Accountability Journal, 2(1), 36-51.
34
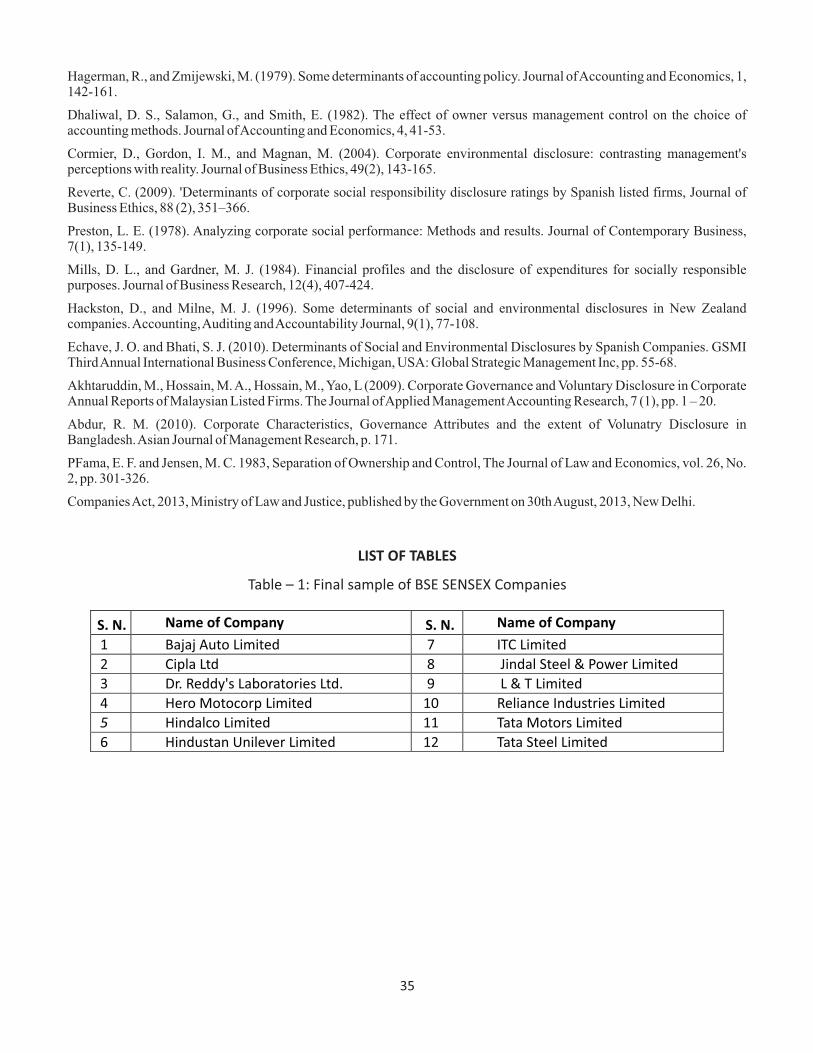
Hagerman, R., and Zmijewski, M. (1979). Some determinants of accounting policy. Journal of Accounting and Economics, 1, 142-161.
Dhaliwal, D. S., Salamon, G., and Smith, E. (1982). The effect of owner versus management control on the choice of accounting methods. Journal of Accounting and Economics, 4, 41-53.
Cormier, D., Gordon, I. M., and Magnan, M. (2004). Corporate environmental disclosure: contrasting management's perceptions with reality. Journal of Business Ethics, 49(2), 143-165.
Reverte, C. (2009). 'Determinants of corporate social responsibility disclosure ratings by Spanish listed firms, Journal of Business Ethics, 88 (2), 351–366.
Preston, L. E. (1978). Analyzing corporate social performance: Methods and results. Journal of Contemporary Business, 7(1), 135-149.
Mills, D. L., and Gardner, M. J. (1984). Financial profiles and the disclosure of expenditures for socially responsible purposes. Journal of Business Research, 12(4), 407-424.
Hackston, D., and Milne, M. J. (1996). Some determinants of social and environmental disclosures in New Zealand companies. Accounting, Auditing and Accountability Journal, 9(1), 77-108.
Echave, J. O. and Bhati, S. J. (2010). Determinants of Social and Environmental Disclosures by Spanish Companies. GSMI Third Annual International Business Conference, Michigan, USA: Global Strategic Management Inc, pp. 55-68.
Akhtaruddin, M., Hossain, M. A., Hossain, M., Yao, L (2009). Corporate Governance and Voluntary Disclosure in Corporate Annual Reports of Malaysian Listed Firms. The Journal of Applied Management Accounting Research, 7 (1), pp. 1 – 20.
Abdur, R. M. (2010). Corporate Characteristics, Governance Attributes and the extent of Volunatry Disclosure in Bangladesh. Asian Journal of Management Research, p. 171.
PFama, E. F. and Jensen, M. C. 1983, Separation of Ownership and Control, The Journal of Law and Economics, vol. 26, No. 2, pp. 301-326.
Companies Act, 2013, Ministry of Law and Justice, published by the Government on 30th August, 2013, New Delhi.
LIST OF TABLES
Table – 1: Final sample of BSE SENSEX Companies
S. N. S. N. Name of Company
Name of Company
1 Bajaj Auto Limited 7 ITC Limited
2 Cipla Ltd 8 Jindal Steel & Power Limited
3 Dr. Reddy's Laboratories Ltd. 9 L & T Limited
4 Hero Motocorp Limited 10 Reliance Industries Limited
5 Hindalco Limited 11 Tata Motors Limited
6 Hindustan Unilever Limited 12 Tata Steel Limited
35

Table – 2: CSR Disclosure Index
S.N. Name of Broad Category and its Variables S. N. Name of Broad Category and its Variables A General on CSR D Employees
1
Whether CSR (Environment, Sustainability, Social Resp. etc.) included in Mission Statement, Vision or any CSR Policy 6 Industrial Relations
2 Whether committed to CSR 7 Employee Benefits 3 CSR Department or CSR Committee 8 Employee Welfare 4 CSR Awards 9 Employee Assistance
B Energy 10 HR Awards for practices in HRM 1 Energy Conservation Disclosure E Products 2 Energy conservation awareness programmes 1 Research & Development 3 Use of alternative energy sources 2 Quality (ISO 9001)/ Quality Integration 4
Promotion of energy efficient processes
3
Safety
5 Energy Audit 4
Product innovation, new technology, improved performance
6 Energy Awards 5
Awards for product innovation, quality, safety etc.
C Environment F Community Development
1
Waste Management Disclosure (Recycling waste etc) 1 Promoting Self Reliance, Livelihoods
2
Installation of Effluent Water Treatment Plants
2
Promoting Education & Funding to research and educational activities
3
Pollution Control in the Conduct of the Business Operations
3
Promoting Community Health & Hygeine
4
Air Emissions Disclosure
4
Promoting Rural Development
5Conservation of natural resources (Water, Paper etc.) 5 Promoting Women Empowerment
6
Environmental Management Systems (ISO 14001)
6
Support to economically weaker sections of the society
7
Environment and or Natural Resource Conservation Awards
7
Conducting community awareness programmes
8
Environmental activities, awareness and education programmes
8
Development
in government sponsored community programmes
9
Environment friendly initiatives
9 Tribal Development
10
Environmental Research and Development
10 Trust formation for various CSR activities
D
Employees
11 Social Development
1
Employee Health & Safety Policy (OHSAS 18001)
12
Infrastructure Development
2
Employee Training and Development
13
Promoting Spiritual Development/ Heritage conservation
3
Employee Stock Option Schemes
14 Promoting Child Welfare
4
Awards programmes for employees or scholarships for children of employees
15
Promoting Arts/ craft / sports for the community development
5
Employment of minorities/ disabled / women/ socially & economically disadvantaged
16
Other Social Activities not covered under any of the above heads.
36

Table – 3: Number of companies with ISO 14001 and 18001 Certifications
Particulars 2009 2010 2011 2012 2013
Environment Management Certification ISO 14001 7 (58%)
7 (58%)
8 (66.67%)
10 (83.33%)
11(91.67%)
Occupational Health & Safety Certification ISO 18001 9 (75%)
7 (58%)
8 (66.67%)
11 (91.67%)
11(91.67%)
Table – 4: Analysis of CSR Reporting by Market Leaders over a period of time
S. N. Name of Broad Category and its Variables 2009 2010 2011 2012 2013
A General CSR
1
Whether CSR (Environment, Sustainability, Social Resp. etc.) included in Mission Statement, Vision or any CSR Policy
41.67% 50% 50% 58.33% 58.33%
2 Whether committed to the cause of CSR 91.67% 100% 100% 91.67% 91.67%
3 CSR Department or CSR Committee 25% 33.33% 33.33% 33.33% 33.33%
4 CSR Awards 58.33% 58.33% 66.67% 58.33% 66.67%
Mean Percentage of Market Leaders reporting on CSR 54.17% 60.42% 62.50% 60.42% 62.50%
B Energy Conservation
1 Energy Conservation Disclosure 100% 100% 100% 100% 100%
2 Energy conservation awareness programmes 58.33% 75% 75% 50% 58.33%
3 Use of alternative energy sources 91.67% 91.67% 100% 91.67% 91.67%
4 Promotion of energy efficient processes 91.67% 100% 100% 100% 100%
5 Energy Audit 50% 33.33% 41.67% 25% 41.67%
6 Energy Awards 41.67% 50% 50% 50% 58.33%
Mean Percentage of Energy Disclosures made 72% 75% 77.78% 69.44% 75%
C Environment Management
1 Waste Management Disclosure (Recycling waste etc) 75% 91.67% 91.67% 100% 100%
2 Installation of Effluent Water Treatment Plants 66.67% 75% 75% 83.33% 83.33%
3 Pollution Control in the Conduct of the Business Operations
83.33% 91.67% 100% 91.67% 91.67%
4 Air Emissions Disclosure 75% 75% 75% 83.33% 91.67%
5 Conservation of natural resources (Water, Paper etc.) 91.67% 100% 100% 100% 100%
6 Environmental Management Systems (ISO 14001) 58.33% 58.33% 66.67% 91.67% 91.67%
7 Environment and or Natural Resource Conservation Awards
58.33% 66.67% 58.33% 66.67% 83.33%
8 Environmental activities, awareness and education programmes
75% 75% 100% 91.67% 91.67%
9 Environment friendly initiatives 83.33% 100% 100% 100% 100%
10 Environmental Research and Development 75% 91.67% 75% 91.67% 91.67%
37

Mean Percentage of Environment M anagement
Disclosure 74.17% 82.50% 84.17% 90% 92.5%
D Employees
1 Employee Health & Safety Policy (OHSAS 18001) 75% 58.33% 83.33% 91.67% 91.67%
2 Employee Training and Development 83.33% 91.67% 83.33% 91.67% 91.67%
3 Employee Stock Option Schemes 91.67% 91.67% 91.67% 91.67% 91.67%
4 Awards programmes for employees or scholarships for children of employees
16.67% 8.33% 0 0 8.33%
5 Employment of minorities/ disabled / women/ socially & economically disadvantaged
16.67% 16.67% 25% 33.33% 41.67%
6 Industrial Relations 75% 91.67% 83.33% 75% 75%
7 Employee Benefits 100% 100% 100% 100% 100%
8 Employee Welfare 91.67% 100% 100% 100% 100%
9 Employee Assistance 41.67% 50% 50% 50% 75%
10 HR Awards for practices in HRM 41.67% 58.33% 75% 58.33% 58.33%
Yearly Mean of Percentage Employees Related
Disclosure 63.33% 66.67% 69.17% 69.17% 73.33%
E Product Variables
1 Research & Development 100% 100% 100% 100% 100%
2 Quality (ISO 9001)/ Quality Integration 50% 58.33% 33.33% 50% 50% 3 Safety 16.67% 41.67% 41.67% 50% 41.67%
4
Product innovation, new technology, improved performance
91.67% 100% 83.33% 75% 83.33%
5 Awards for product innovation, quality, safety etc. 66.67% 91.67% 50% 50% 83.33%
Yearly Mean of Percentage Product variable disclosure 65% 78.33% 61.67% 65% 71.67%
Table – 5: Analysis of CSR Reporting by Market Leaders over a period of time
S. N.
Name of Broad Category and its Variables
2009
2010
2011
2012
2013
F Community Development
1
Promoting Self Reliance, Livelihoods
66.67%
83.33%
91.67%
83.33%
83.33%
2
Promoting Education & Funding to research and educational activities
83.33%
83.33%
83.33%
83.33%
91.67%
3
Promoting Community Health & Hygeine
83.33%
91.67%
91.67%
91.67%
100%
4
Promoting Rural Development
91.67%
91.67%
100%
91.67%
91.67%
5
Promoting Women Empowerment
75%
91.67%
83.33%
83.33%
75%
6
Support to economically weaker sections of the society
91.67% 83.33% 91.67% 91.67% 83.33%
7
Conducting community awareness programmes
75% 75% 100% 91.67% 75%
8Development in government sponsored community programmes
66.67% 66.67% 83.33% 58.33% 58.33%
9 Tribal Development 33.33% 33.33% 33.33% 41.67% 25%
10 Trust formation for various CSR activities 41.67% 41.67% 41.67% 33.33% 50%
38

Table – 6: Ranking of the Market Leaders based on their Mean CSRDS:
Name of Company
Avg. CSRDS Rank
Jindal Steel and Power Limited 152.4 1
Hindalco Limited
146
2
Reliance Industries Limited
140
3
ITC Limited
132.6
4
Tata Steel
132.4
5
Dr. Reddy's Laboratories
128.2
6
Tata Motors
112.2
7
Bajaj Auto Limited
103.6
8
Hindustan Unilever Limited
98.6
9
L&T Limited
95.2
10
Hero Motocorp Limited
94.2
11
Cipla Limited 57.8 12
14
Promoting Child Welfare
58.33%
58.33%
66.67%
75%
83.33%
15 Promoting Arts/ craft / sports for the
community development 25%
41.67%
58.33%
50%
33.33%
16 Other Social Activities not covered under any
of the above heads.
91.67%
91.67%
83.33%
83.33%
83.33%
Yearly mean of Percentage Community care disclosure
60.94%
65.11%
72.40%
68.23%
66.67%
11 Social Development 58.33% 66.67% 75% 75% 75%
12 Infrastructure Development 25% 25% 41.67% 33.33% 33.33%
13
Promoting Spiritual Development/ Heritage conservation
8.33%
16.67%
33.33%
25%
25%
39

Table – 7: Analysis of CSR Disclosure Scores of Market Leaders
S. N. Name of Broad Category and its Variables 2009 2010 2011 2012 2013
A General CSR
1
Whether CSR (Environment, Sustainability, Social Resp. etc.) included in Mission Statement, Vision or any Policy 0.83 1.08 1.00 1.17 1.17
2 Whether committed to CSR 3.17 3.67 3.67 3.33 3.33 3 CSR Department 0.67 1.00 1.00 1.00 1.00 4 CSR Awards 2.33 2.33 2.67 2.33 2.67
(A) General CSR Score 7.00 8.08 8.33 7.83 8.17 B Energy Conservation
1 Energy Conservation Disclosure 3.50 3.50 3.33 3.67 3.67 2
Energy conservation awareness prog rammes
1.25
1.42
1.17
0.92
1.25
3
Use of alternative energy sources
2.58
2.92
2.92
3.33
3.42
4
Promotion of energy efficient processes
2.67
2.58
2.83
3.42
3.67
5
Energy Audit
1.67
1.00
0.91
0.83
1.50
6
Energy Awards
1.67
2.00
2.00
2.00
2.33
(B) Energy Score
13.33
13.42
13.16
14.17
15.83
C
Environment Management
1
Waste Management Disclosure (Recycling waste etc)
2.25
2.67
2.42
3.00
3.33
2
Installation of Effluent Water Treatment Plants
1.42
1.92
1.42
1.92
2.33
3
Pollution Control in the Conduct of the Business Operations
1.83
2.50
2.75
2.75
3.08
4
Air Emissions Disclosure
2.00
2.33
2.25
2.42
3.25 5
Conservation of natural resources (Water, Paper etc.)
3.42
4.00
2.92
3.83
4.00
6
Environmental Management Systems (ISO 14001)
2.33
2.33
2.67
3.50
3.67
7
Environment and or Natural Resource Conservation Awards
2.33
2.67
2.33
2.67
3.33
8
Environmental activities, awareness and education programmes
2.08
2.33
2.00
2.17
2.67
9
Environment friendly initiatives
2.50
3.33
2.83
3.17
3.58
10
Environmental Research and Development
2.08
2.08
1.83
2.50
3.00
(C) Environment Management Score
22.25
26.17
23.42
27.92
32.25
D
Employees Variable
1 Employee Health & Safety Policy (OHSAS 18001) 3.00 2.33 2.92 3.67 3.67
2 Employee Training and Development 2.08 2.58 2.67 2.83 2.92
3 Employee Stock Option Schemes 2.75 2.58 2.83 2.83 2.58
4 Awards programmes for employees or scholarships for children of employees 0.25 0.17 0.00 0.00 0.17
5 Employment of minorities/ disabled / women/ socially & economically disadvantaged 0.50 0.67 0.83 1.00 1.33
6 Industrial Relations 1.33 1.75 1.50 1.33 1.33
7 Employee Benefits 4.00 4.00 4.00 4.00 4.00
8 Employee Welfare 2.83 3.08 3.08 3.08 3.08
9 Employee Assistance 0.67 0.92 0.92 1.08 1.50
10 HR Awards for practices in HRM 1.67 2.17 3.00 2.33 2.33
(D) Employee Disclosure Score 19.08 20.25 21.75 22.17 22.92
40

E Product Variables
1 Research & Development 4.00 4.00 4.00 4.00 4.00
2 Quality (ISO 9001)/ Quality Integration 2.00 2.33 1.33 1.67 1.67
3 Safety 0.50 0.75 0.75 0.92 0.75
4 Product innovation, new technology, improved performance 2.42 2.00 1.75 1.75 1.92
5 Awards for product innovation, quality, safety etc. 2.67 3.67 2.00 1.83 3.33
(E) Product related Score 11.58 12.75 9.83 10.17 11.67
Table – 8: Analysis of CSRDS of Market Leaders over a period of time
S. N. Name of Broad Category and its Variables 2009 2010 2011 2012 2013
F Community Development
1 Promoting Self Reliance, Livelihoods 2.67 3.00 3.08 3.00 2.83
2 Promoting Education & Funding to research and educational activities 2.75 2.75 2.75 2.67 3.25
3 Promoting Community Health & Hygeine 3.00 3.17 3.33 3.17 3.58
4 Promoting Rural Development 2.91 3.09 3.36 3.27 3.17
5 Promoting Women Empowerment 2.73 3.09 2.73 2.73 2.50
6 Support to economically weaker sections of the society 2.58 2.50 2.83 2.67 2.83
7 Conducting community awareness programmes 2.08 2.67 2.92 3.00 2.33
8 Development in government sponsored community programmes 2.00 1.50 2.17 1.83 1.83
9 Tribal Development 0.75 1.17 1.17 1.33 0.83
10 Trust formation for various CSR activities 1.50 1.50 1.50 1.33 1.83
11 Social Development 2.00 2.33 2.50 2.67 2.50
12 Infrastructure Development 1.00 1.00 1.67 1.33 1.33
13 Promoting Spiritual Development/ Heritage conservation 0.17 0.50 1.00 0.67 0.67
14 Promoting Child Welfare 2.17 2.17 2.50 2.83 3.08
15 Promoting Arts/ craft / sports for the community development 0.83 1.33 1.75 1.67 1.17
16 Other Social Activities not covered under any of the above heads. 3.17 3.17 2.83 2.83 3.00
(F) Community Care 32.30 34.93 38.09 37.00 36.75
41

2009 2010 2011 2012 2013
General CSRScore
40.00
35.00
30.00
25.00
20.00
15.00
10.00
5.00
0.00
EnergyConservation
Score
EnvironmentManagement
Score
EmployeeVariable
Score
ProductVariable
Score
CommunityDevelopment
Score
Chart 2 : Yearly Mean CSR Scores Group Wise
Chart 1 : Corporate Social Reporting Disclosure140
120
100
80
60
40
20
0
Year 2009 2010 2011 2012
42

Table – 9: Thrust of CSR activities with special reference to Community Development
S.N.
Focus areas for CSR activities: Community Development
%
1
Health and Hygeine
92%
2
Supporting Economically Weaker Sections of Society
88%
3
Rural Development
87%
4
Other Social Activities
87%
5
Education includes Primary, Secondary, Bridge Course,
Vocational training etc.
85%
6
Creating livelihoods - Self Reliance
83%
7
Women Empowerment
78%
8
Support to NGOs and Govt sponsored programmes
73%
9
Social Development
70%
10
Children
65%
11
Promotion of Art / Crafts / Sports / Culture
52%
12
Activities through trusts
45%
13
Tribal Development
35%
14 Infrastructure Development 27%
15 Conservation of Heritage and Spiritual Dev 22%
Table – 10: Business Responsibility Report (BRR) and CSR
Name of Company BRR posted on
Website BRR as a part of
Annual Report CSR reported over
and above BRR
Bajaj Auto Limited Yes No Yes
Cipla Limited Yes No Yes
Dr. Reddy's Laboratories No Yes No Hero Motocorp Limited No Yes No Hindalco Limited No Yes No Hindustan Unilever Limited Yes No Yes ITC Limited No Yes Yes Jindal Steel and Power Limited No Yes Yes L&T Limited No
Yes
Yes
Reliance Industries Limited
No
Yes
Yes
Tata Steel
Yes
No
Yes
Tata Motors
No
Yes
Yes
Total Companies
04
08
09
Table – 11 : Results of Multiple Linear Regression on CSR Performance
Explanatory Variable
R2
2
Adj. R
Intercept
Slope
p-value
F-Statistic
Size
0.191
-0.484
-196.219
6.191
0.657
0.282
(0.906)
Lev
57.20
0.665
Prof
-49.89
0.643
BS
2.795
0.529
BI
171.28
0.560
43

IntroductionCapital markets play a vital role in channelizing the savings of individuals for investment in economic development in country. The investors are not constrained by their individual abilities but by the abilities of the companies which in turn enhance the savings and investment in the country. Liquidity of capital market is an important factor affecting the growth. Since projects require long term finance, but on the other hand investors may not like to relinquish the control over their savings for a long time. A liquid stock market ensures a quick exit without incurring heavy losses or cost. Thus the development of efficient capital market is essential for encouraging investment and economic growth. The Indian Equity market and Debt market together form the Indian Capital Market.
The Indian Equity Market primarily consists of Mutual Funds, Financial Institutions and FIIs mainly in the form of venture capital funds and private equity funds. Portfolio investment flows from industrial countries have become increasingly important for developing countries in recent years. The Indian situation has been no different. In the year 2000-01 portfolio investments in India accounted for over 37% of total foreign investment in the country and 47% of the current account deficit. The corresponding figures in the previous year were 59% and 64% respectively. A significant part of these portfolio flows to India comes in the form of Foreign Institutional Investors' (FIIs') investments, mostly in equities.
Ever since the opening of the Indian equity markets to foreigners, FII investments have steadily grown from about Rs. 2600 crores in 1993 to over Rs.11,000 crores in the first half of 2001 alone. India opened its stock markets to foreign investors in September 1992 and has, since 1993, received considerable amount of portfolio investment from foreigners in the form of Foreign Institutional Investor's (FII) investment in equities. This has become one of the main channels of international portfolio investment in India for foreigners. In order to trade in Indian equity markets, foreign corporations need to register with the SEBI as Foreign Institutional Investors (FII). SEBI's definition of FIIs presently includes foreign pension funds, mutual funds, charitable/endowment/university funds etc. as well as asset management companies and other money managers operating on their behalf.
Literature ReviewA study conducted by the World Bank in 1997 reports that stock market liquidity improved in those emerging economies that received higher foreign investments. Kumar (2001) investigated the effects of FII inflows on the Indian stock market represented by the Sensex using monthly data from January 1993 to December 1997 and inferred that FII investments are more driven by fundamentals and do not respond to short-term changes or technical position of the market. In testing whether
Indian bourses, both securities & commodities, are amongst the favourite hunting spots for foreign investors betting on India's growth story. These businesses appeal to investors as they have long term horizons and signify bets on the country's growth. However, there is a lot of apprehension regarding the volatile nature of such flows thereby raising questions about the need to encourage FII flows in Indian Securities Market. But, given the ability of FII flows to augment the sources of funds in the Indian Capital Markets, strengthen the market liquidity and efficiency, advocate modern ideas in market design and sound corporate governance practices, and exposure of the Indian investors to modern financial techniques and international best practices and systems, it can be effectively argued that the role of foreign investors in developing and strengthening the functioning of Indian capital markets cannot be underplayed. In fact, the Indian policy makers must adopt a cautious approach while further liberalizing the FII policy by instituting built-in-cushion within the system against the possible destabilizing effects of sudden reversal of FII flows. The paper makes an attempt to study the relationship and effect of FII on Indian Securities Market using statistical measures such as correlation coefficient and multiple regression model. The study is based on twelve years of data i.e. from 2000- 01 to 2011- 12 with Sensex and Nifty taken as representative for stock market movements.
Key words : FII, Impact, Nifty, Sensex
Effect of FII on Indian Securities MarketRajani B Bhat*, Dr. Geetha C A**
*Asst. Professor, PG & Research Department of Commerce, The Cochin College, Cochin.**Asso. Professor, PG & Research Department of Commerce, The Cochin College, Cochin.
44

Net FII Investment (NFI) has any impact on Sensex, a regression of NFI was estimated on lagged values of the first difference of NFI, first difference of Sensex and one lagged value of the error correction term (the residual obtained by estimating the regression between NFI and Sensex). Similarly, regression with Sensex as dependent variable showed that one month lag of NFI is significant, meaning that there is causality from FII to Sensex.
The finding of the above study is in contradiction with the findings of Rai and Bhanumurthy (2003) who did not find any causation from FII to return in BSE using similar data between 1994 and 2002. However, Rai and Bhanumurthy have also found significant impact of return in BSE on NFI. Chopra (2002) examines the effect of policy reforms on the FDI in India. The analysis has been carried out with the help of annual data from 1980-2000. The research includes policy related variables such as the degree of openness of the economy, debt-service ratio, foreign exchange rate and GDP as the explanatory variables of FDI inflows in India. Empirical result shows that GDP is an important factor which motivates FDI in the country.
Stanley Morgan (2002) has examined that FIIs have played a very important role in building up India's FOREX reserves, which have enabled a host of economic reforms. Secondly, FIIs are now important investors in the country's economic growth despite sluggish domestic sentiment. According to Morgan Stanley report FIIs strongly influence short-term market movements during bear markets. However, the correlation between returns and flows reduces during bull markets as other market participants raise their involvement reducing the influence of FIIs. Research by Morgan Stanley shows that the correlation between foreign inflows and market returns is high during bear and weakens with strengthening equity prices due to increased participation by other players.
Agarwal(1997), Chakrabarti(2001) have found in their research that the equity return has a significant and positive impact on the FII. But given the huge volume of investments, foreign investors could play the role of market makers and book their profits, i.e., they can buy financial assets when the prices are declining thereby jacking-up the asset prices and sell when the asset prices are increasing. Hence, there is a possibility of bi-directional relationship between FII and the equity returns.
Prasanna P K (2008) has examined the contribution of foreign institutional investment particularly among companies including Sensex of Bombay Stock Exchange. It examined the relationship between foreign institutional investment and firm specific characteristics in terms of ownership structure, financial performance and stock performance. It is observed that foreign investors invested more in companies with a higher volume of shares owned by the general public. The promoters' holdings and the foreign investments are inversely related. Foreign investors choose such companies where family shareholding of promoters is not very substantial. The financial performance variables which influenced the financial decisions of FII include share returns and earnings per share.
Bansal and Pasricha(2009) studied the after impact of opening market to FIIs on Indian stock market behavior. They empirically analyze the change of market return and volatility after the entry of FIIs to Indian capital market and found that there is no significant change in the Indian stock market average returns. The volatility got significantly reduced after India unlocked its stock market to foreign investors.
Objectives
The objective of the study can be stated as:-1. To study the trend of foreign capital inflow into India as FII.
2. To study the effect of Foreign Institutional Investment on Sensex.
3. To study the effect of Foreign Institutional Investment on Nifty.
The Hypothesis formulated to test second and third objective respectively is:-
H01: There is no impact of the flow of FIIs on Sensex.
H02: There is no impact of the flow of FIIs on Nifty.
Research Methodology The study is based on secondary data which has been collected from various sources like Bulletins of RBI, publications from Ministry of Commerce, Govt of India etc . For the purposes of studying the first objective, a period of twelve years starting from 2000 -01 to 2011- 2012 has been taken into consideration. For achieving the second and third objective, Sensex and Nifty, are considered as market representatives, mirroring the price movements of the securities market. The statistical tools, correlation and multiple regression ordinary least squares model and ANOVA test is being applied to test the hypothesis.
45

Results and Discussions
1. Trends of Foreign Capital Inflow into India as FIIThe current paper proposes to study the linear relationship between variables such as FII and Sensex & Nifty. For achieving the above purpose, correlation is applied. The following table reveals a picture regarding the inflow of FII as well as Sensex and Nifty.
Table 1: Trends in FII, Sensex and Nifty for a period of 2000-01 to 2011-12
Source : 1. FII from Fact Sheet on FDI from April 2000 to February 2012
Year FII(US$million) BSE Sensex S&P CNX Nifty
2000 -01 1847 4269.68 1334.76
2001 -02 1505 3331.94 1077.02
2002 -03 377 3206.28 1037.22
2003 -04 10918 4493.53 1427.5
2004 -05 8686 5740.98 1805.26
2005 -06 9926 8280.08 2513.44
2006 -07 3225 12277.32 3572.44
2007 -08 20328 16568.88 4896.59
2008 -09 -15017 12365.55 3731.02
2009 -10 29048 15585.21 4657.76
2010 -11 29422 18605.18 5583.54
2011 -12 17365 17422.88 5242.74
CAGR 20.53%
2. NSE Fact Book 2012
From Table 1, a clear picture of trend depicted by FII is evident. FII shows fluctuating trend depicting a growth rate of 21% for FII.
3. Correlation between FII, Sensex and Nifty
Table 2 provides a picture of relationship calculated between FII, Sensex and Nifty. Correlation is applied to study the statistical relationship of the variables FII, BSE Sensex and CNX Nifty. The following table presents the output, when correlation is run to the twelve years data considered.
Table 2: Correlation Coefficient
FII(US$million) Sensex Nifty
FII(US$million) 1 0.586 0.591
Based on the results it can be concluded that , it is found that there is a moderate positive correlation between FII & Sensex and FII & Nifty.
46

4. Impact of Flow of FII on BSE Sensex
For the purposes of analysis of data in this case, multiple regression method has been adopted, considering FII as independent variable and Sensex as the dependent variable. The table given below represents the Model Summary relating to this.
Table 3: Model Summary
Model R R Square Adjusted R
Square
Std. Error of the Estimate
Durbin - Watson
1 .586a
.344 .278 5051.13149 0.645
a. Predictors – constant, FII (US $ million)
b. Dependent variable – BSE Sensex
The table 5.3 reports the strength of the relationship between the model and the dependent variable. R, the multiple correlation coefficients, is the linear correlation between the observed and model predicted values of the dependent variable. Its large value indicates a strong relationship. R Square, the coefficient of determination, is the squared value of the multiple correlation coefficients. The value of R2 is 0.344 ; it shows that the model explains 34 % of the variation. In other words the dependent variables FDI and FII are able to explain around 34 % the variation of the dependent variable, Sensex. Durbin-Watson static informs us whether the assumption of independent errors is tenable. The closer to 2 is the value, the better and for the data it was 0.645 which is not even close to 2 which indicates a positive serial correlation and a small inflation in test statistic.
The below given table represents the results of the ANOVA test conducted to test the hypothesis.
Table 4: ANOVA
a. Predictors: (Constant), FII
b. Dependent Variable: Sensex
Model Sum of Squares df Mean Square F Sig.
1 Regression 1.336E8 1 1.336E8 5.237 .045a
Residual 2.551E8 10 2.551E7
Total 3.888E8 11
The ANOVA table 4 tests the acceptability of the model from a statistical perspective. The Regression row displays information about the variation accounted for by the model. The Residual row displays information about the variation that has not been accounted for by the model. The regression is much less than residual sums of squares, which indicates that around 34 % of the variation in SENSEX is explained by the model. Since, the calculated value is much higher than the table value, the null hypothesis stands rejected at 5% level of significance.
5. Impact of flow of FDI and FII on S&P CNX NiftyAnalysis of the data is done in this case using multiple regression OLS Model considering FDI and FII as independent variable and S & P CNX Nifty as the dependent variable. The model summary given below relates to this relationship.
47

Table 5: Model Summary
a. Predictors – constant FDI and FII (US $ million)
b. Dependent variable – S & P CNX Nifty
Model R R Square Adjusted R
Square
Std. Error of the
Estimate Durbin -Watson
1 .591a .349 .284 1472.87130 .658
The table 5 reports the strength of the relationship between the model and the dependent variable. R, the multiple correlation coefficients, is the linear correlation between the observed and model predicted values of the dependent variable. Its large value indicates a strong relationship. R Square, the coefficient of determination, is the squared value of the multiple correlation coefficients. The value of R2 is 0.349; it shows that the model explains 35 % of the variation. In other words the dependent variables FDI and FII are able to explain around 35 % the variation of the dependent variable, NIFTY. Durbin-Watson static informs us whether the assumption of independent errors is tenable. The closer to 2 is the value, the better and for the data it was 0.658 which is not even very close to 2 which indicates a positive serial correlation and a small inflation in test statistic.
The below given table represents the results of the ANOVA test conducted to test the hypothesis.
Table 6: ANOVA
a. Predictors: (Constant), FII
b. Dependent Variable: Nifty
Model Sum of Squares df Mean Square F Sig.
1 Regression 1.161E7 1 1.161E7 5.354 .043a
Residual 2.169E7 10 2169349.878
Total 3.331E7 11
The ANOVA table 6 tests the acceptability of the model from a statistical perspective. The Regression row displays information about the variation accounted for by the model. The Residual row displays information about the variation that has not been accounted for by the model. The regression is much less than residual sums of squares, which indicates that around 35 % of the variation in Nifty is explained by the model. Since, the calculated value is much higher than the table value, the null hypothesis stands rejected at 5% level of significance.
Findings
The findings of the study can be summarised as follows:-1. The flow of FII also has depicted a varying trend where the rate of growth is 21%.
2. There is a moderate positive correlation between FII & Sensex and FII & Nifty.
3. Flow of FIIs into India and BSE Sensex trend are dependent.
4. Flow of FIIs into India and CNX Nifty trend are dependent.
Conclusion
In the last one decade, the pace of economic growth and progressive policy liberalization has made India an attractive destination for investment from all parts of the world. US is the foremost in the investment in India and strengthening the partnership between two largest democracies in the world. This partnership will grow in coming years. US technological
48

innovation will help skilled resources of India. Due to the strategic investment of US, India's large middle class consumer will be benefitted. This partnership will be the regulatory regime in India and US both. In the last few years, India's FDI policy has become more and more liberal. The most preferred sector for FDI is service sector which will definitely help India realize its potential of economic growth to the world level.
The flow of FDI and FII accelerated the Indian economy and also gave opportunities to Indian industry for technological up-gradation, gaining access to global managerial skills and practices, optimizing utilization of human and natural resources and global competitive advantage with greater efficiency. Most importantly FDI is central for India's integration into global production chains which involves production by MNCs spread across locations all over the world. From the current study it is evident that there is a moderate positive correlation between FII & Sensex and FII & Nifty. Hence it can be concluded that the effect of flow of FII on the Indian Securities Market is significant.
References
Agarwal, R.N. (1997). “Foreign Portfolio Investmen
t in some Developing Countries: A study of Determinants and Macroeconomic Impact”, Indian Economic Review, Vol,32, Issue 2, pages 217-229.
Anand Bansal, & J. S. Pasricha, Foreign Institutional Investors Impact on Stock Prices in India. Journal of Academics Research in Economics, 1(2), 181-189. 2009.
Chakrabarti, Rajesh. (2001). “FII Flows to India: Nature and Causes.” Money and Finance “Vol. 2, No. 7, October-December, pages 61-81.
Kumar, S.S. “Indian Stock Market in International Diversification: An FIIs Perspective” Indian Journal of Economics, Vol. lxxxii, No-327, April, pages 85-102. 2002.
Prasanna, P.K, Foreign Institutional Investors: Investment Preferences in India, JOAAG, Vol 3, No-3.2008.
Rai. K. and Bhanumurthy, N.R.“Determinents of Foreign Institutional Investments in India: The Role of Return, Risk and Inflation” . 2003.
Stanley Morgan, "FII's Influence on Stock Market", Journal: Journal of Impact of Institutional Investors on Ism. Vol. 17 Publisher: Emerald Group Publishing Limited. 2002.
Sultana Syed Tabassum and Pardhasaradhi. S. ”Trend of Flow of FDI & FII on Indian Stock market”, Finance Research,Vol 3 July 2012.
49

The Role of Islamic Finance in Enhancing Economic Growth-Insights from Literature
Mosab I. Tabash*, Raj S. Dhankar**
Islamic finance is one of the fastest growing sectors of the global banking industry and has risen to prominence recently through its distinctive characteristics. The emergence of Islamic finance can be traced back to 1963 in Egypt, while its importance comes to the global financial system only after the global financial crisis in 2008. However, despite the increasing importance of Islamic finance, particularly in developing economies in the Middle East and South-East Asia, religious and social complexity has acted against a holistic understanding of it by policymakers, researchers and practitioners. The main focus of this paper is to provide a review of Islamic finance principles and its modes in economic growth. Also, this paper takes insights from the literature related to the relationship particularly between Islamic finance and economic growth. We find that the Islamic finance principles and modes are conducive to the growth of economy as they help in reducing inflation, poverty, and unemployment, besides achieving social justice and optimum allocation of resources. Furthermore, studies have showed that there is a positive association between Islamic finance and economic growth in the long term as well as short term. The findings of research will be of interest to western and Islamic financial practitioners, policy makers and academicians who are interested in Islamic finance industry.
Keywords : Islamic Finance, Economic Growth, Social Justice, Policy Makers
Introduction
Islamic finance is growing as a source of finance for Islamic and other investors around the world. During the past years, one of the rising stars in the world of finance has been Islamic finance. The year 2012 marked a turning point for Islamic finance growth, as new markets and new regulations in the Mid East helped the sector flourish. According to Ernst and Young, globally the assets of Islamic finance managed in line with Shariah will reach in 2013 to 1.8 trillion US $, from 1.2 trillion U.S. $ in 2012. Neither the ongoing turmoil in the Middle East nor the Euro Zone debt crisis could prevent Islamic banks in the Middle East from reaching out to new markets and more business. This rapid growth has been fuelled by surging demand for Shariah-compliant products not only from financiers in the Middle East and other Muslim countries, but also by investors globally, thus making it a global phenomenon.
It is a field of growing importance for conservative Muslims, especially in the Middle East and large Muslim population in South-Eastern Asia countries, who are uncomfortable with Western-style of financial system and banking that involve explicit payments of interest. Lately, the Vatican (2009) noted that Western banks should look at the rules of Islamic finance to restore confidence amongst their clients at a time of global economic crisis. Despite the financial crisis which has plagued the economies of both industrialized and developing nations, the Islamic finance industry has been flourishing and has enjoyed a 29 per cent growth in assets to reach more than 600 billion $ in 2008 (Figure1).
The performance and relative stability of Islamic financial institutions during the financial crisis that hit the world in 2008 stem from the distinctive features of the modes they offer. Islamic finance emphasizes asset backing and the principle of risk sharing, ensuring a direct link between financial transactions and real sector activities. The return on savings and investment is closely linked (determined by the real sector, not the financial sector); giving Islamic finance modes a flexible adjustment mechanism in the case of unanticipated shocks. The adjustment mechanism ensures that the real values of assets and liabilities will be equal at all points in time, and prohibits excessive risk taking, thereby avoiding several forms of complicated securitization (Chapra, 2008).
*Research Scholar, Faculty of Management Studies ,University of Delhi, Delhi**Dean and Professor of Finance, Faculty of Management Studies, University of Delhi, Delhi
Fig.1 Global Shariah-Compliant Financial Assets (2000-2011)
2000 2001 2002
-- Exponential growth trend
US
$ B
illio
n
2003 2004 2005 2006 2007 2008 2009 2010 2011
1200
1000
800
600
400
200
0
50
Despite the rapid growth of Islamic finance and its importance in the global financial finance, many financial researchers and policy makers don't understand the key principles and Islamic modes of financing and their advantages on the whole economy. The present study tries to explore the importance of Islamic finance in economic growth. The paper is organized as follows. Section two presents the main principles of Islamic finance and its advantages on economic growth. Section three presents the key modes of Islamic finance and its advantages to economic growth. Section four illustrates the literature review on the relationship between Finance and economic growth particularly, Islamic finance and economic growth. Finally, Section five presents the conclusions of the paper.
Research ImportanceThe importance of this study emanates from the fact that it addresses an important sector in the World economy and particularly in Middle East economies, namely the Islamic finance industry. It touches everyone in the society and has a great effect on any economy positively or negatively. Muslims represent about a quarter of the world's population, and there is greater awareness of and demand for Islamic-based financial products by Muslim and Non Muslim consumers as well. This paper gives a clear picture on how Islamic finance principles and instruments contribute to economic growth.
Research Problem and ObjectivesMany studies have focused on the impact of finance on economic growth. However, few studies have examined the impact of Islamic finance on economic growth. To fill this gap in literature, this paper investigates the potential effects of Islamic finance principles and its instruments on economic growth. We believe that the results of this paper will help decision makers and finance scholars to understand the advantages of Islamic finance principles, instruments, and their role in enhancing growth of economy of any nation.
Research MethodologyThe qualitative method and theoretical analysis have been used. The qualitative approach is used to review the existing literature from all resources such as academic, scholarly journals, magazines, documents, workshops, and other related literature of Islamic finance industry.
Islamic Finance DefinitionThe term Islamic finance refers to a system of financing that is consistent with the principles of the Islamic Shariah, which in turn is based on the Quran (the holy book of Islam) and the Sunnah (the recorded life, times and deeds of Prophet Mohammad). All forms of Islamic financing must comply with certain Islamic Shariah principles. Most notably, Islamic Shariah prohibits riba (interest) and particularly the payment or receipt of interest. Warde (2000) defines Islamic finance as, roughly, “all financial practices that are based, in their objectives and operations, on Qu'ranic principles”. This is a broad definition, but it captures the essential nature of Islamic economics as an attempt to reconcile religious principles with economic activities. This goes far beyond interest-free banking to include, for example, refusing to do business with companies that operate in morally impermissible sectors (such as gambling). That said, in the actual operations of Islamic financial institutions, and for the purposes of this paper, the essential defining feature of Islamic finance is the explicit prohibition of transactions that involve riba (interest).
The Development of Islamic Finance in the WorldSince the mid-fifties, a debate on the possibility of a finance model consistent with the Shariah law (Shariah compliant) has been opened in Muslims societies. Islamic finance originated in the Egyptian village of Mit Ghamr. It was the year 1963 when an agricultural bank, created to copy German agricultural banks, started to provide small private entrepreneurs with micro loans, thus also promoting the individual habit of saving. Both the recipient of funds and the investor were members of the bank and shared its profits in accordance with Islamic ethics. The economist Ahmad El Najjar founded the first religious oversight board composed of ''ulama'' (i.e. Muslim legal scholars). The first oil crisis in 1973-1974 provided Arab countries with the necessary capital to found Islamic financial institutions. In 1975, the Islamic Development Bank was created by the Organization of Islamic Conference.
The aim was to promote the development of all Muslim communities in accordance with the principles of Shariah. In the same year, the Dubai Islamic Bank, the first Islamic commercial bank not owned by a government, was established. Other Islamic banks were then established in Arab countries, the Philippines, Malaysia and so on. Today, there are more than 20 traditional institutions offering Islamic products in London. In addition, there are several Islamic credit banks in the US.
51

During the last three decades, the number of Islamic financial institutions has risen from one institution in one country in 1963 to over 300 institutions operating in more than 75 countries worldwide (Qorchi, 2005). The sector is increasingly open, innovative, sophisticated and competitive. In short, the importance of Islamic finance in the world depends on its extraordinary growth rate and its management model, which is subordinate and/or competitive with the traditional one.
The key Principles of Islamic FinanceIslamic finance theory promotes economic development in three main ways: its direct link to the real economy and physical transactions, its prohibitions against harmful products and activities, and its promotion of economic and social justice. Islamic finance cannot support such conventional finance activities as debt rescheduling, debt swap, speculation, and other purely monetary or financial activities that do not add to the real economy (Kahf, 2007).
The following are the main principles of Islamic finance:1. Prohibition of Riba (Interest): Riba is an Arabic word for “growth” or “increase” and denotes the payment or receipt of
interest for the use of money. The Qur'an expressly forbids riba, which includes any payment of interest (not only excessive interest) on monetary loans. The Quran states, “O You who believe! Fear Allah and give up what remains of your demand for usury, if you are indeed believers.” Usury encompasses any payment of interest. Muslim scholars have interpreted riba to mean any fixed or guaranteed interest payment on cash advances or on deposits (Mahmud, 2004). In prohibiting riba, Islam seeks to foster an environment based on fairness and justice. A loan with a fixed return to the lender, regardless of the outcome of the borrower's course of action is viewed as unfair. Riba is also believed to be exploitative and unproductive because it is considered to represent sure gain to the lender without any possibility of loss as well as a reward in return for no work. These factors are believed to lead, in turn, to inflation and unemployment and to stifle the social and infrastructural development of a nation.
2. Risk and Return Sharing: Shariah prohibits Muslims from earning income by charging interest but permits income generation through the sharing of risks and rewards between the parties to a transaction (no pain no gain strategy). This profit sharing mechanism is believed to encourage people to become partners and work together rather than to enter into a creditor–debtor relationship. Partnership promotes mutual responsibility for the outcome of the financed project, which is believed to increase the likelihood of success of the venture. A tangential aim of the partnership approach is to help increase the growth of successful projects, also provide stimulus to the economy. On the basis of “z-scores” analysis, Cihák and Hesse (2008) proved that Islamic financial system is financially stronger and less risky than conventional banks.
3. Avoidance of Gharar: Shariah prohibits financial transactions that involve Gharar, which is often translated as “deception,” “excessive risk,” or “excessive uncertainty”. Gharar refers to any transaction of probable items whose existence or characteristics are not certain, due to lack of information, ignorance of essential elements in the transaction
to either party, or uncertainty of the ability of one party to honor the contract.
4. Shariah Approved Activities: Islamic finance integrates Islamic moral and ethical principles and, as such, prohibits financing harmful products and activities. For example, Islamic banks prohibit financing to such industries as alcoholic beverages, tobacco, casinos, and pornography. Islamic banks do not participate in financing activities that are harmful to society and that would consequently hinder development.
5. Sanctity of Contract: Islam views contractual obligations and the related full disclosure of information as a sacred duty. Full disclosure is intended to reduce financial speculation (gambling), which is strictly prohibited by Islam, by providing as much information as possible for investors to make accurate assessments about the risks and rewards of an investment (Shanmugam, 2009).
6. Paying and Collecting of Zakah (payments to the poor): Metwally (2006,) provides a comprehensive definition of Zakah as follows: “Zakah is the cornerstone of the financial structure in an Islamic economy”. Literally, Zakah means purification. Technically, it means a contribution of a proportion of wealth for the use of the poor and needy people. Also it's important to notice the experience of Islamic banks in alleviating poverty through the use of Zakah funds to improve the socio-economic development in the society. This is by either making the poor and needy people more productive, which in turn contribute to the economic development, financing human welfare activities. Based on the above principles, the Islamic finance system has the following advantages over the conventional finance
52

system as shown in figure 2.
Key Islamic Modes of Financing Central to Islamic finance is the fact that money itself has no intrinsic value. As a matter of faith, Muslims cannot lend money to, or receive money from someone and expect to benefit. This means that interest is not allowed and making money from money is forbidden. Money must be used in a productive way, by which wealth can only be generated through legitimate trade and investment in assets. The principal means of Islamic finance are based on trading. Any gains relating to the trading are shared between the party providing the capital and the party providing the expertise. As a result, the Islamic banks have developed six main Islamic financing techniques which are: Mudaraba, Musharaka, Murabaha, Ijara, Istisna and Salam (Karim, 2002).
1. Mudarabah (Trust financing): Contracts are profit-sharing agreements, in which a bank provides the entire capital needed to finance a project, and the customer provides the expertise, management and labour. The profits from the project are shared by both parties on a pre-agreed (fixed ratio) basis, but in the cases of losses, the total loss is borne by the bank (Schaik, 2001).
2. Musharakah (Partnership): Contracts are similar to joint venture agreements, in which a bank and an entrepreneur jointly contribute capital and manage a business project. Any profit-and-loss from the project is shared in a pre-determined manner. The joint venture is an independent legal entity, and the bank may terminate the joint venture gradually after a certain period or upon the fulfillment of a certain condition (Alam, 2003).
3. Murabahah (Cost-plus mark-up): Murabaha financing is based on a mark-up (or cost plus) principle, in which a bank is authorized to buy goods for a customer and resell them to the customer at a pre-determined price that includes the original cost plus a negotiated profit margin. This contract is typically used in working capital and trade financing (Suleiman, 2000).
4. Ijara (Sale and leaseback): A bank buys an asset for a customer and then leases it to the customer for a certain period at a fixed rental charge. Shariah (Islamic law) permits rental charges on property services, on the precondition that the lessor (bank) retains the risk of asset ownership.
5. Salam (Future delivery): Salam is structured and based on a forward sale concept. This method allows an entrepreneur to sell some specified goods to a bank at a price determined and paid at the time of contract, with delivery of the goods in the future.
6. Istisna (Construction / manufacturing): Istisna contracts are based on the concept of commissioned or contract
Source: Developed by the researcher
Fig.2: Islamic Finance Principles Advantages
More Efficent
Moral Hazard Reduction
More Stable
Conductive toPoverty Alleviation
Islamic FinancePrinciples
53

manufacturing, whereby a party undertakes to produce a specific good for future delivery at a pre-determined price. It can be used in the financing of manufactured goods, construction and infrastructure projects.
The Main Characteristics of Islamic Modes of financing There are some characteristics of Islamic modes of financing over the conventional banking system (Goaied and Sassi, 2009).
The Productive CharacteristicsThe essential characteristic of Islamic modes of financing is their direct and un-detachable link to the real economy or physical transactions: Musharakah and Mudarabah are only possible for productive companies which contribute to real-life businesses that increase the production and improve the quality. Murabahah and others Sale-based modes must involve a physical transaction of commodities or provision of services. The same thing also apply to leasing where leased assets are the pivotal thing around which financing is built. So, all Islamic modes of financing must pass through the production and/or exchange of real goods and services. In contrast to conventional banks, which focus only on the ability of the entrepreneur to repay loans, Islamic banks concentrate on the profitability of the project which is the necessary condition. Consequently, Islamic banks lead economic growth by promoting productive projects and supporting the trade of commodities and services. Another advantage for this foremost characteristic of the Islamic Modes of financing is that they are incompatible and unsuitable for debt rescheduling, debt swap, speculative transfers, and other purely monetary activities that make a substantial part of contemporary activities of conventional banks.
The Ethical and Moral CharacteristicsThe second developmental characteristic of Islamic finance is the incorporation of ethical and moral values in their modes of financing; it can't ignore ethical/moral considerations in project selection process. Regardless of the legality in a given country, Islamic banks don't finance harmful goods such as alcoholic beverages and tobacco or morally unacceptable services such as casinos and pornographies. Such products and activities are indeed profitable, but they have a high social and economic cost and a harmful long term effect on the productivity in the economy. The ethical and moral loyalty of Islamic banks is manifested in another form: they grant zero-interest credits from social funds in cases of dire needs or unexpected circumstances for a poor and needy person. These funds are principally financed by yearly Zakah paid by Muslim people. In other words, although profit maximization is equally essential to Islamic banks as other businesses, the underlying philosophy of these institutions is conducive toward social commitment and activities that usually cannot be interpreted by the profit motive.
The Relational CharacteristicsThe third developmental characteristic of Islamic banks is found in the nature of their relationship with depositors and employees. Since Islamic banks deal with their depositors on investment grounds, the competition is higher between Islamic banks than between conventional banks which receive current and timed deposits against fixed interest. The competition among Islamic banks drives the profitability to its maximum in both the short run that concerns depositors and the long run that concerns shareholders which make them all more aware and attached to the real market. But the financial performance of the bank isn't the only criteria of competition; the ability to keep and to raise deposits of Islamic bank depends on a good reputation. For that, Islamic banks launch “cultural programmes” to instruct their employees on the religious dimensions of their activity. The knowledge of the Shariah combined to a high level of cultural aptitude reinforces the credibility of the bank and generates a competitive advantage. So, the relational characteristic of Islamic banks accomplishes double results. On the internal plan, it reaches the synergy, cooperation, the efficiency and especially the internal legitimacy. On the external plan, it reinforces corporate image of the bank and therefore, its external legitimacy towards corporate shareholder. At the end, all this leads to financial performance and real productivity.
Islamic Finance and Economic Growth StudiesThe relationship between financial development and economic growth has been extensively analysed in the literature. The relationship between financial development and economic growth is a controversial issue. Some authors consider finance an important element of growth (Goldsmith, 1969; McKinnon, 1973, King and Levine (1993), whilst for others it is only a minor growth factor (Robinson, 1952, Lucas, 1988). Schumpeter (1934) sees the banking sector as an engine of economic growth through its funding of productive investment. Beck et al (2000), Bekaert et al (2001) and Levine (2005) strongly support the
54

idea that there is a positive relationship between financial development and economic growth causality between finance and growth. Also, there is no doubt, if a country's banking system is efficient, effective and well-disciplined , it brings about rapid growth in the various sectors of the economy through promoting capital formation, providing credit facilities, investment in new enterprises; promotion of trade, industry and agriculture, promoting export, and implementation of monetary policy. This suggests that banks' role in economic development rests chiefly on their role as financial intermediaries. In this capacity, banks help drive the flow of investment capital throughout the marketplace.
Islamic finance can have a positive impact on economic growth. Some economists even believe that because of the elimination of interest (riba), working according to Profit and Loss Sharing (PLS) and its similarity to universal banks, Islamic finance has a more important role than conventional finance systems in this regard.
Abduh and Chowdhury (2012) investigated the long run and dynamic relationship between Islamic banking development and economic growth in the case of Bangladesh. The quarterly time-series data of economic growth, total financing and total deposit of Islamic banking from Q1:2004 to Q2:2011 are used in their study. Using cointegration and Granger's causality method, Islamic bank financing is found to have a positive and significant relationship with economic growth both in the long and short run. It implies that the development of Islamic banking is one of the policies, which should be considered by the government to improve their income.
Abduh and Omar (2012) have examined the short-run and the long-run relationships between Islamic banking development and economic growth in the case of Indonesia. They used quarterly data (2003:1-2010:2), and they utilized the bound testing approach of cointegration and error correction models, developed within an autoregressive distributed lag (ARDL) framework. The results demonstrated a significant relationship in short-run and long-run periods between Islamic financial development and economic growth. The relationship, however, is neither Schumpeter's supply-leading nor Robinson's demand-following. It appears to be bi-directional relationship.
Tajgardoon and Noormohamadi (2012) have examined causality relationship between FDI and Islamic banking. Panel unit root tests show that the variables are stationary at level. Pedroni test indicates that there is long run relationship between FDI and Islamic banking. Nine countries from Organization Islamic Conference (OIC) over the period 1995-2010 have been chosen. The results show that there is bidirectional relationship between Islamic banking and FDI. It means that FDI reinforce Islamic banking and Islamic banking attracts foreign direct investment. For FDI attraction, governments should devote attention to Islamic banking.
Oliver Agha (2012) explained that Islamic finance should serve as a stabilizing force in the global economic order, because deposits in Islamic banks (which are not loans but true investment deposits on a Mudaraba basis) are reinvested in the real economy for goods/services without any artificial money expansion. In the conventional system, banks increase credit in good times on the fractional reserve banking system principle -- for each dollar deposited (loaned) to a bank, the bank may loan out many more. The "choking" of such credit, in a downturn, can go down as evidenced by the financial crises, and therefore, the equity-based constructs inherent in the Islamic system are likely to serve as a stable pillar of the economic system particularly in these times.
Nidal El-Ghattis (2011) have shown that in contrast to conventional methods of financing, Islamic financing is not centred only around creditworthiness of the client but rather on the worthiness and profitability of the project to be financed. Therefore, recovering the principal becomes a result of profitability and worthiness of the actual project. The Islamic profit sharing concept helps to foster economic development by encouraging equal income distribution, which results in greater benefits for social justice and sustainable growth. The profit and loss sharing (PLS) scheme improves capital allocation efficiency as a return on capital depends on productivity and profitability of the financed project.
Furqani and Mulyany (2009) examined the dynamic interactions between Islamic banking and economic growth of Malaysia by employing the Cointegration test and Vector Error Correction Model (VECM) to see whether the financial system influences growth and growth transforms the operation of the financial system in the long-run. They used time series data of total Islamic bank financing (IBFinancing) and real GDP per capita (RGDP), fixed investment (GFCF), and trade activities (TRADE) to represent real economic sectors. They found that in the short-run, only fixed investment that granger cause Islamic bank to develop for 1997:1-2005:4. Where as in the long-run, there is evidence of a bidirectional relationship between Islamic bank and fixed investment and there is evidence to support demand - following hypothesis of GDP and Islamic bank, where increase in GDP causes Islamic banking to develop and not vice versa.
55
Janbota & Anju (2007) have examined the performance of Islamic banks in profitability, liquidity risk and solvency; and efficiency for the period 2000-2004 in the UAE where the Islamic funds are highly concentrated. The study found that the UAE Islamic banks are relatively more profitable, less liquid, less risky, and more efficient compared to the UAE conventional banks. Authors associated this performance with the profit-and-loss sharing paradigm.
Iqbal and Molyneux (2005) showed that the economic development of Islamic countries can be greatly enhanced by the Islamic financial system due to the mobilization of savings that are being kept away from interest-based banks and the development of Islamic capital markets. This motivation to invest in Islamic banks may also stem from the fact that research shows that the share in the banks' profit may at time be higher than the fixed rate of interest given by conventional banks. Islamic banking promotes innovation by financing anyone who has a good idea. If a small and medium entrepreneur has a better project, he has the possibility of getting financed and he will not be held back by the fear of tremendous risk since innovation involves a huge risk. Islamic banking system results in a better risk distribution since the risk is distributed between the financier and the entrepreneur.
Iqbal, Munawar and al. (1998) tested the performance of Islamic banks; they used a panel of the first 10 banks in the world, the first 10 banks in Asia, the first 10 banks in the Middle East and finally the first 10 Islamic banks. They proved the performance of Islamic banks in a capitalistic environment where the conventional system dominates, and supposed that and they supposed that in a purely Islamic environment, the performance of the Islamic banking industry becomes higher.
ConclusionIn this paper, we have explained the role of Islamic finance in economic growth by reviewing and taking insights from the literature. It explains the key principles, advantages and key modes of Islamic finance industry. The main principles of Islamic finance include the prohibition of Riba (interest), Gharar, Speculation, and encompassing the full disclosure of information and removal of any asymmetrical information in a contract. Islamic finance theory promotes economic development through its direct link to the real economy and physical transactions, its prohibitions against harmful products and activities, and its promotion of economic and social justice.
From Islamic finance and economic growth studies ,we have revealed that the Islamic finance industry is more stable, efficient, less moral hazard, and conducive to poverty alleviation than conventional finance, due to its principles of prohibition of interest, Gharar and use the risk and return sharing in any form of transactions. Islamic modes of financing like Murabahah, Mudharabah have many advantages for the society by enhancing trade and production, creating new jobs, reducing unemployment and achieving poverty alleviation. Furthermore, studies have shown that there is a positive association between Islamic finance and economic growth in long term and short term as well. The findings of research will be of interest to western and Islamic financial practitioners, policy makers and academicians, who are interested in Islamic finance industry.
ReferencesAgha, Oliver (2012), Is Islamic Finance a Failure? An Assessment. Retrieved December 10, 2012, from http:// reuters.com/article/islamicfinance
Alam, M.., (2003), Micro Credit through 'Bai-Mujjal', Mode of Islamic Banking Financing System, conference of SANABEL (Canada).
Beck, T., Levine, R. and Loayza, N.(2000), “Finance and the Sources of Growth”, Journal of Financial Economics, Vol. 58, pp.261–300.
Bekaert, G. Harvey, C. and Lundblad, C. (2001), “Emerging Equity Markets and Economic Development”, Journal of Development Economics, Vol.66, pp. 465–504.
Chapra, U. (2008), The Global Financial Crisis: Can Islamic Finance Help Minimize the Severity and Frequency of Such a Crisis in the Future, Paper for the Forum on the Global Financial Crisis, held at the Islamic Development Bank, Jeddah.
Cihák, Martin and H. Hesse, (2008), Islamic Banks and Financial Stability: An Empirical Analysis, International Monetary Fund (IMF), Working Paper 08/16.
Deutsche Bank, (2011), “Global Islamic Banking Report”, November, London, UK.
El-Ghattis, Nedal (2011), Islamic Banking's Role in Economic Development: Future Outlook.
56

Goaied, Mohamed and Seifallah Sassi (2010) “Financial Development and Economic Growth in the MENA Region: What about Islamic Banking Development”, working paper.
Goldsmith, R. (1969), “Financial Structure and Economic Growth in Advanced Countries”, National Bureau Committee for Economic Research, Capital Formation and Economic Growth, Princeton, University Press.
Hafas Furqani and Ratna Mulyany (2009), Islamic Banking and Economic Growth: Empirical Evidence from Malaysia, Journal of Economic Cooperation and Development, 30, 2 (2009), 59-74
Iqba, Munawar and Molyneux, Philip, (2005), Thirty Years of Islamic Banking: History, Performance and Prospects, pp. 34-35, Palgrave Macmillan, UK.
Iqbal. Z, (1997), Islamic Financial System, Finance and Development, pp. 42-45.
Janbota M. and Anju, K. (2007). “Comparative Financial Performance of Islamic versus Conventional Banks in the UAE ”. Paper presented at 2006-2007 Annual Student Research Symposium & First Chancellor's Undergraduate Research Award at UAE University.
Kahf, M. (2007), Islamic Banks at the Threshold of the Third Millennium, Thunderbird International Business Review, 41, 4, 6-16.
Karim, A. and Simon, A. (2002), Islamic Finance: Innovation and Growth, Euro Money Books. London
Levine, R. (2005),” Finance and Growth: Theory and Evidence”, In: Handbook of Economic Growth, ed. by P. Aghion and S. Durlauf, vol.1, pp.865-934, Elsevier.
Levine, R. and king (1993), “Financial Development and Economic Growth: Views and Agenda”, Journal of Economic Literature, Vol. 35(2), pp. 688-726.
Lucas R.E., (1988),”On the Mechanics of Economic Development”, Journal of Monetary Economics, Vol. 22(1), pp. 3-42.
Mahmud, Ahmed, (2004), Islamic versus Traditional Banking in Arab Region: Premises and Promises. Paper submitted to the international seminar on “The Prospect of Arab Economic Cooperation” in Alexandria, Egypt (16–18 June).
McKinnon R.I., (1973), “ Money and Capital in Economic Development”, the Brookings Institution, Washington, DC.
Metwally, M. (2006), Economic Consequences of Applying Islamic Principles in Muslim Societies, Journal of Islamic Banking and Finance 23(1): 11-33.
Muhamad Abduh, Mohd Azmi Omar, (2012),"Islamic banking and economic growth: the Indonesian experience”, International Journal of Islamic and Middle Eastern Finance and Management, Vol. 5 Iss: 1 pp. 35 – 47.
Muhamad Abduh1, and Nazreen T. Chowdhury (2012), Does Islamic Banking Matter for Economic Growth in Bangladesh? Retrieved Nov. 2, 2012,
Osservatore, Vatican (2009), Islamic Banking May Help Overcome Crisis, Press Release.
Qorchi, M. (2005), Islamic Finance Gears Up, Finance Development IMF magazine.
Robinson, J. (1952), “The Generalization of the General Theory in the Rate of Interest and Other Essays”, London: Macmillan.
Schaik, D. (2001), Islamic Banking, the Arab Bank Review, 3, 1, 45-52.
Schumpeter J.A, (1934).The Theory of Economic Development, Cambridge, MA, Harvard University Press.
Shanmugam, B. (2009), A Primer on Islamic Finance, p. 8, first edition, Lois Carrier.
Suleiman, M. (2000), Corporate Governance in Islamic Bank, Islamic Banking, 1, 1, 99-116.
Warde, I. (2000), Islamic Finance in the Global Economy, Edinburgh University Press, Edinburgh.
“The Path”, term of Islamic law consists of Islamic instructions based on the Holy Quran and Sunnah).
These statistics can be reached through the website www.global-islamic-finance.com.
57

Introduction
Green marketing refers to the marketing of products and services that are harmonious with the natural resources and are manufactured ethically. With the growing awareness of environmental protection and global warming, the concept of Green Marketing has emerged. Green Marketing takes into account the wider relationship of the organization and its products with the environment. It is about an approach that integrates the strategic link between the company, the environment and the marketing. Such approach is more aware, targeted and sensitive. According to the American Marketing Association (AMA), green marketing is the marketing of products that are presumed to be environmentally safe. It incorporates a broad range of activities, including product modification, change of production process, packaging changes, as well as modifying advertisement styles and strategies (Heena Dua, 2013). Green Marketing is also known as Environmental Marketing or Ecological Marketing.
The concept of green marketing is the business practice that considers consumers concerns with regards to preservation and conservation of the natural environment (Coddington, 1993). Green marketing that has been previously and primarily focused on the ecological context has been shifted to more sustainability issues in the marketing efforts and main focus now is in socio-economic and environmental context. Whereas, green market is identified as a part of market segments based on the greenness' of the consumer (Mohanasundaram, 2012).
There are various reasons why firms have increased the use of Green Marketing. The possible reasons are listed as follows:
Organizations consider green marketing as an opportunity to fulfill their moral obligation towards social responsibility.
Organizations seek to achieve their objectives by perceiving environmental friendly activities.
Government agencies are forcing firms to become social-environmentally responsible.
Green Ads and their Impact on Consumer Awarenesstowards Environment Protection
Dr. Leena Painter*, Bhuvana Venkataraman**, Sunita Bharatwal
Green marketing refers to the marketing of products and services that are harmonious with the natural resources and are manufactured ethically. With the growing awareness of environmental protection and global warming, the concept of Green Marketing has emerged. Green Marketing takes into account the wider relationship of the organization and its products with the environment. It is about an approach that integrates the strategic link between the company, the environment and the marketing. It incorporates a broad range of activities, including product modification, change of production process, packaging changes, as well as modifying advertisement styles and strategies. Green Marketing is also known as Environmental Marketing or Ecological Marketing. The present study is designed with the following objectives: to understand the meaning and evolution of "Green Marketing"; and to understand consumer's perception towards GreenAd's and its impact on their purchasing habits.
Findings of the present study show that although majority of the respondents (60 per cent) feel that Green Ad's are overall effective, only 30 per cent respondents agree that environmental factors affect their purchase decisions and only 36 per cent respondents agree to pay more price for eco-friendly products. Purchasing decision of the consumers is more affected by factors like cost and quality of the product. Therefore green marketers should understand this fact that they need to fulfill two basic objectives to attract the consumers. One improved quality and second customer satisfaction. A balanced approach will prove beneficial and overemphasizing of either may result in fatal results for the company.
Keywords: Green Ad's, Green Marketing, Consumer Perception
*Assistant Professor, DRP & RBP Commerce College, Surat, Gujarat **Assistant Professor, St. Thomas College, Bhilai, Chhatisgarh ***Assistant Professor, TIT&S College, Bhiwani, Haryana
58

Environmental friendly activities of competitors are pressurizing firms to adopt green marketing.
Cost factors are also forcing organizations to modify their products and procedures make it eco-friendly.
Green marketing help build brand equity and win brand loyalty.
Green marketing is taken as an opportunity to access new markets and gain advantages over competitors that are not advocating this.
As per Polonsky (2005), green marketing can be defined as, "All activities designed to generate and facilitate any exchange ntended to satisfy human needs or wants such that satisfying of these needs and wants occur with minimal detrimental input n the national environment."
Evolution of Green Marketing
The concept of green marketing has evolved over more than three decades now. In late 1960's and early 1970's, a concern about the social responsibility of business and their impact on environment was created. In mid 1970's this concern heightened and in 1975 the American Marketing Association (AMA) held its first workshop on "Ecological Marketing". In 1980's Corporate Social Responsibility (CSR) as a supplement of financial report were introduces and this is when the term green marketing' came into prominence. According to Pattie (2001), the evolution of green marketing has three phases. The first phase termed as "Ecological" green marketing. In this phase, all marketing activities were concerned to help environmental problems and provide remedies for environmental problems. "Environmental" green marketing was the second phase. In this phase the focus shifted on clean technology that involved designing of innovative new products, which take care of pollution and waste issue. The third phase is "Sustainable" green marketing.. It came into prominence in late 1990's.
Benefits of Green Marketing
Nayan Sinha quotes that today's consumers are becoming more and more conscious about the environment and are also becoming socially responsible. Therefore, more companies are responsible to consumers' aspirations for environmentally less damaging or neutral products. Many companies want to have an early-mover advantage as they have to eventually move awards becoming green. Some of the advantages of green marketing are:
It ensures sustained long-term growth along with profitability.
It saves money in the long run, thought initially the cost is more.
It helps companies market their products and services keeping the environment aspects in mind. It helps in accessing the new markets and enjoying competitive advantage.
Most of the employees also feel proud and responsible to be working for an environmentally responsible company.
Objectives
The present study is designed with the following objectives :
To understand the meaning and evolution of "Green Marketing"
To understand the growing need and importance if Green Marketing.
To understand consumer's perception towards Green Ad's and its impact on their purchasing habits.
Research Methodology
The present paper is based on primary as well as secondary data. Primary data is collected from 50 respondents residing in Surat city of Gujarat. A questionnaire was designed for the survey. The secondary data is collected from various sources like articles in journals, magazines and newspapers and also on various websites.
Examples of Companies Going for "Green Campaigns"
1. A green marketing initiative was launched in India by Nokia, named 'Planet ke Rakhwale.' The company is encouraging its customers to give back their old, unused, broken mobile handsets and chargers for recycling. This take-back campaign of Nokia was aimed at educating people on necessity of reducing e-waste through recycling.
2. Blue star is one of the largest sources for air-conditioner equipments in India, offering wide range of products. The company has completely phased out use of CFC's (chlorofluorocarbons) in their centrifugal chillers. Blue-star is now
59

pre dominantly using HCFC's (Hydrocholorofluorocarbons) which have much less ODP (Ozone Depletion Potential).
3. Samsung – a company manufacturing consumer durables has introduced LED TV's in India which are claimed to be mercury free and lead free. This has helped in energy consumption by 40%+ in LED TV's as compared to traditional televisions of similar size. Samsung has also launched solar power cell phones- the solar guru (guru E1107) in the Indian market.
4. Coco-cola have invested large sum of money in recycling activities. They have also modified their packaging to minimize its environmental impact. The company has also innovated a new technique. It started pumping syrup directly from tanks instead of plastic, which minimizes the use of plastic and also help the company save millions of pounds per year.
5. Philips CFL lamps are technologically designed to consume less electricity and save power consumption.
6. Tata- India's oldest industrial house- is making several efforts to reduce its carbon footprints across its value chain. Right from its manufacturing process to distribution network using eco-friendly products and processes.
7. Panasonic is another giant organization which has been working to highlight the issue of global warming. It has taken initiatives in reducing its green house gas emissions. The company has developed new products which are energy saving and technologically advanced. Also Panasonic is globally working to promote its eco-friendly ideas. The brand slogan 'Ideas for life' goes with the eco-idea theme of the company. The company has announced the "Panasonic 'eco ideas' Declaration" which is committed to the society and the key initiative of the company as to reduce carbon dioxide (CO2) emissions through combinations of greener products and factories, encourage resources conservation and promote eco friendly individual actions.
8. ONGC- the company has accelerated investments in clean cola technologies like underground coal gasification (UCG). It is applying bio-remediation of oil contamination sites for preserving soil. The company has grabbed various projects under Clean Development Mechanism (CDM) to earn certified emission reduction points under Kyton Protocol. The company's in-house institute of Drilling technology (IDT) is successful in development of a Green Drilling Fluid. It also adopted an eco friendly process for de-slugging crude-oil storage tanks.
Results and Discussion
In primary data collected from the respondents is presented in the following section of the paper. The various attributes of the respondents are analysed and presented in tabular form as follows.
Table 1 : Respondents-Gender
Figure 1 : Respondents- Gender
Gender
Males 20 40
Females 30 60
Total 50 100
No. of Respondents
Males
Females
No. of Respondents Per cent
60

Table 2 : Respondents - Age
Figure 2 : Age of Respondents (years)
Table 3 : Education Level of Respondents
No. of Respondents Per cent
2
4
38
46
10
100
01
12
19
23
05
50
Illiterate
Primary
Secondary
Graduate
Post Graduate
Total
Education
Figure 3 Respondents- Education
61
34
10
30
36
10
06
100
07
05
12
18
05
03
50
<25
26-35
36-45
46-55
56-65
>65
Total
Age (Years) No. of Respondents Per cent
<25
26-35
36-45
46-55
56-65
>65
Illiterate
Primary
Secondary
Graduate
Post Graduate

Table 4 : Best Source of Green Ad's
Figure 4 Best Source of Green Ad's
Table 5 : Kind of Eco- product that appeal most
Figure 5 : Kind of Eco-products that appeal most
Source Frequency Per cent Television 22 44 Newspaper 15 30 Hoardings/ Billboard 05 10 Exhibitions 04 08 Shopkeepers/Dealers 03 06 Others 01 02 Total 50 100
Product Type Frequency Per cent Vehicles 13 26 Food Products 06 12 Cosmetics 11 22 Soaps/Detergents 04 08 Clothing 04 08 Electrical/ Electronic Gadgets 12 24
Total 50 100
62
Telev
ision
25
20
15
10
5
0
New
spap
er
Hoa
rdin
gs/..
Exhib
ition
s
Shopk
eepe
rs/D
eal..
Oth
ers
Vihicles Food Products Cosmetics Soaps/Detergents Clothing

Table 6 : Features of Eco-products advertised that appeal most
Figure 6 : Features of Eco-products that appeal most
Table 7 : Response for other factors
Table 8 : Overall Effectiveness of Green Ad's
Features Frequency Per centBetter Quality 12 24 Cost effective 18 36 Attractive Packing 04 08 Less Energy/ Fuel consumption 12 24 Brand Name 04 08
Total 50 100
Response Willing to pay more for Eco -products
Awareness regarding Eco-markets
Awareness regarding Green shopping
Environmental Factors affecting Purchase Decision
Frequency Per cent
Frequency Per cent
Frequency Per cent
Frequency Per cent
Yes 18 36 28 56 32 64 15 30 No 32 64 22 44 18 36 35 70
Total 50 100 50 100 50 100 50 100
Response Frequency Per cent
Effective 30 60 Ineffective 20 40 Total 50 100
63
Better Quality
Cost effective
Attractive Packing
Brand Name
Less Energy / Fuelconsumption

Findings And Conclusion
Analysis of table 1 show that majority of the respondents 60 per cent (N= 30) were female respondents. As per table 2, 36 per cent (N=18) respondents belonged to age group 46-55 years followed by 30 per cent (N=12) of age group 36-45 years. Figures of table 3 indicate aggregate 98 per cent of the respondents are educated.
Further it is revealed that television, 44 per cent (N=18), is found to be the best source of advertising the Eco-products. This must be due to the fact that majority of the respondents were female. Newspapers are considered to be the next best source for Green Ad's. Analysis of table 5 show that Green Ad's for eco-products like vehicles, cosmetics/ soaps & detergents, electrical/electronic gadgets are more appealing compared to food products and clothing.
Analysis of table 6 makes it very clear that 36 per cent (N=18) respondents feel that 'Cost effectiveness' is the feature of eco-products that appeal the respondents the most. This is followed by 'Better quality' and 'less energy/ fuel consumption at 24 per cent (N=12). These figures also reveal the fact that consumers are ready to buy eco-products only if they are cost effective and at the same time qualitative.
Analysis of table 7 further show that 56 per cent (N=28) of the respondents are aware of the Eco- markets and 64 per cent (N=32) are aware of green shopping. It can be concluded that greater the awareness towards environment among the customers, higher is the probability of them to buy to buy green products. However price of the green product plays an important role in the buying decision. Table 7 shows that only 36 per cent (N=18) respondents are willing to pay higher price for the green products. Also it is evitable from table 7 that only 30 per cent (N=15) respondents agree that environmental factors affect their purchase decisions, though they are aware towards environment protection and very well know the concept of green shopping. Thus government agencies, NGOs and other voluntary organizations should come forward to create more awareness through the use of media and advertising, regarding issues like environment and global warming.
When the respondents were asked to rate the overall effectiveness of the Green Ad's it was found that 60 per cent (N=30) respondents feel that Green Ad's are effective and has a positive impact. Consumers are aware of concepts like 'Eco-markets' and 'green-shopping' and also such advertisements increase the concern of the consumers towards environment. Even then there are other factors that affect the buying decision. Therefore companies should try and make greener products more cost effective and qualitative for attracting buyers towards it.
Consumers understanding of 'Green Marketing' are still in very infant stage. Though there is awareness of environmental protection and green campaigns, consumers purchase decisions are still influences by other factors. Therefore green marketers should understand this fact that they need to fulfill two basic objectives to attract the consumers. One improved quality and second customer satisfaction. A balanced approach will prove beneficial and overemphasizing of either may result in fatal results for the company.
References:
Coddington, W. (1993). Environmental marketing. New York: McGraw-Hill.
Heena Dua (2013), Green Marketing – The Growing marketing Mantra, VSRD International Journal of Business and Management Research, Vol. III Issue X October 2013, pg 447
Peattie, Ken (2001). Towards Sustainability: The Third Age of Green Marketing. Marketing Review. Vol. 2, No. 2, pp. 129-147.
Polonsky, M. J. (2005). A stakeholder theory approach to designing environmental marketing strategy. Journal of Business & Industrial Marketing, 10(3), 29-46.
Sonu and Lavina (2013), GREEN MARKETING- A NEW CORPORATE SOCIAL RESPONSIBILITY", ASM's International Journal of Ongoing Research in Management and IT, ISSN- 2320-0065, Pg 1-8, downloaded from http://www.asmgroup.edu.in/incon/publication/incon13-mkt-022.pdf
V.Mohanasundaram (2012), Green Marketing – Challenges And Opportunities, International Journal of Multidisciplinary Research Vol.2 Issue 4, April 2012, ISSN 2231 5780, downloaded on January 25, 2013 from www.zenithresearch.org.in 66
http://blogs.siliconindia.com/nayan/WHY_IS_GREEN_MARKETING_CHOSEN_BY_MOST_MARKETERS-bid-uQo5nC9M60452203.html
http://www.deccanherald.com/content/7368/samsung-launches-low-cost-solar.html
http://www.durofy.com/introduction-to-green-marketing/
http://www.ijmra.us/project%20doc/IJMIE_MARCH2012/IJMRA-MIE760.pdf
http://www.ebtc.eu/pdf/130614_REP_Potential-of-clean-coal-technologies-in-India_An-SME-perspective_Web.pdf
http://www.scribd.com/doc/196559701/Green-Marketing
http://www.slideshare.net/guestacd5bd/company-analysis-of-blue-star-3023765
www.wikipedia.com
http://www.zenithresearch.org.in/images/stories/pdf/2012/April/ZIJMR/6_ZIJMR_APRIL12_VOL2_ISSUE4.pdf
64

Effect of Humorous Advertisements on Customer Behavior
Dharmesh Motwani*, Khushbu Agarwal**
Humor has universal language. It doesn't need degrees in obscure languages, hardly ever in Clinical Psychology and it is one of the few devices used to make people smile and think at the same time. Humor has been widely used in advertising. However, while humor has attained popularity in advertising, its use is continuously being debated. The reason for this debate is that there are a number of both positive and negative effects which can be attributed to the use of humor.
The purpose of this research paper is to answer following questions :-
a) The impact of gender & age on the degree of affection to the ads.
b) The effect of humor appeal in Ads, on the consumer's buying decision.
To develop the conclusions exploratory & descriptive research designs are used. Primary data are collected with the help of Focus group technique & questionnaire method & data is analyzed with the help of various statistical techniques.
The conclusions of this paper help in clarifying the dilemma of humorous advertisements.
Introduction Advertising is one of the critical marketing variables which marketers use to differentiate products in a cluttered marketplace. In order to increase the effectiveness of advertising for a product, advertising messages should be unique and meaningful. This concurs with the von Restorff effect, which concludes that interference is minimized by the presentation of a unique item in a group of similar items. Companies have attempted to use many vehicles to create this differentiation effect. One such vehicle is the employment of humor.
In order to have a better understanding, we need to further explore the world of advertisements, the appeals used, the targeted decision making components and the effects of Ads on the targeted consumer as a whole.
There are two main components advertisers aim to effect; the affective component, where affective message strategies are applied by invoking feelings and trying to match them with the product or service offered in an effort to increase the likeability of the product, and also the cognitive components, where the Ad focuses on the attributes and benefits of the product, encouraging the consumer to buy it. Such components are affected by the leverage points in an Ad; these are the features in the Ad that helps the consumer transfer the advertised message into personal value.
In order to achieve that, over the years, advertisers have attempted a wide variety of advertising approaches, there are seven main ones; fear, humor, sex, music, rationality, emotions and scarcity. Advertisers use one or combine several of these appeals to ensure that their targeted audiences receive their message.
However, nowadays, humor appeal is being used extensively sometimes combined with others, but most of the time it is strong enough to be used solely. Humor in advertising constitutes billions of dollars in spending each year (Campbell et al. 44).
A variety of benefits have been suggested for humorous appeals including:
1) Humor attracts attention.
2) Humor can increase retention of the advertising message.
3) Credibility of the source can be enhanced with humor.
4) Attitude toward the ad can be enhanced with the use of humor.
5) Counter arguments may be minimized with the use of humor because it acts to distract the audience from making cognitive responses.
Furthermore, the popularity of humor is evident in the fact that 24.4% of television advertisements attempt to be humorous (Alden & Hoyer 29). However, while humor has attained popularity in advertising, its use is continuously being debated. The reason for this debate is that there are a number of both positive and negative effects which can be attributed to the use of humor. Throughout the literature of this paper, the debatable effect of this appeal is discussed.
*Asst. Professor, Pacific Business School, Udaipur.
**Asst. Professor, Pacific Business School, Udaipur.
65

Literature Review: There has been numerous researches proving that advertisement with humorous appeal can gain consumers likability. A strong positive correlation is also found between the degree of how well an advertisement is liked with the likability to the brand advertised (e.g., Gelb & Pickett, 1983; Haley & Baldinger, 1991; Weinberger & Campbell, 1991; Zhang, 1996). In short, adding humorous elements can enhance one's likability of an advertisement and eventually increase liking to the brand advertised.
Defining Humor Humor has been widely used in advertising. It has been suggested that 24.4% of prime time television advertising in the U.S. is intended to be humorous (Weinberger & Spott, 1989). Regarding to advertising budget, 10% to 30% out of the total expenditure of $150 billion in the U.S. national media, is paid for the placement of advertisements that are having humorous content (Spotts, Weinberger & Parsons, 1997). Operationally. humor is defined, according to Sternthal and Craig (1973), as "heightened arousal, smiles, and laughter exhibited by an audience in response to a particular message" (p.13). Moreover, humor can be defined in terms of how well the audience perceive the level of humor and it can be administered by pencil and paper test to measure how the audience perceive a particular message is humorous and funny or not.
Humor in Advertising and Its Effect The reason why humor has been widely used in advertising is due to its power of create liking towards the advertisement by from the consumer. It has been found by Weingerber and Spotts (1989) that advertising practitioners coming from the U.S. and U.K. are generally favor in the use of humor on advertising. A couple of reasons are found and supported by many other researches that humor can enhance one's favorable attitude towards an advertisement. It is reviewed by Weingerber and Gulas (1992) that ten advertising studies and seven non-advertising studies report a positive effect of humor on liking while only two advertising studies and three non-advertising studies report neutral or mixed findings.
Objectives The purpose of this research paper is to answer following questions:-
a) The impact of gender & age on the degree of affection to the ads.
b) The effect of humor appeal in Ads, on the consumer's buying decision.
Research Methodology(a) Research Design : To have a better understanding about the issue exploratory research design was used. Two focus groups (i.e. one for each gender) were conducted to get the in depth insights about the topic. Each group consisted of 7 persons.
Further descriptive research design was used to get the primary data with the help of close ended questionnaire.
(b) Sample Design : 70 respondents were selected through convenience sampling.
(c) Analysis : The data collected was analyzed with the help of various statistical tools like Chi-square test, ANOVA etc.
Results & Disscussions
(a) Exploratory research results :
(I) Focus Group (A)
It consisted of 7 males who were asked to provide views on the issue. It was a general opinion that to make the ad interesting & creative there is in no harm in using humor appeal in ad but one also considered it purely offensive. They were also agreed on the fact that some time they buy the product because ofAd effect but product attributes are also equally important.
(II) Focus Group (B)
It consisted of 7 females who were asked to provide views on the issue. A contradiction in views was seen; half of them believed that humor appeal increases the liking of ads while rest treated it offensive or unaffected. 70% of them said that advertisements don't affect the purchase decision.
(b) Descriptive research results: -
1. 54% of the respondents were male & rests were female. 24% of the respondents were from less than 30 years age group & 76% were from more than 30 years age group.
2. 55% of the respondents admitted that their intuition or the way they feel about the product finalize their decision of purchasing the product, 35 % considered advertisement of product as the basis of purchase decision and rest purchase the product because of the attributes of product.
3. 62% indeed admitted that they have purchased the product just because they liked the commercial. Both results indicate the affect of advertisements on the purchase decision of customers.
4. When asked what they look for in an Ad; 45% believed the most important attribute of an ad is creativity, followed by 26% who believed it was the endorsers used & how they relate to them.
66

5. 56% of the respondents believed that, the use of humor content in advertisements is acceptable for products as long as it's within certain limits. 27% found it offensive & rest said that humor appeal increases the creativity of ads.
6. Four print advertisements containing humor appeal (Refer Appendix) were shown & respondents were asked to disclose their views. The results were as follow:-
Therefore organizations are now capitalizing on this need and are realizing the value of CRM application.
58% of the customers found the advertisements Creative & nice while very few respondents treated it offensive or unethical, which indicates that respondents are taking advertisements in positive manner.
7. Majority of Respondents (i.e. 75%) replied that they would purchase the product based on the advertisements & the humor appeal used in ads changed their purchase decision.
(c) Hypothesis Testing: -
Ho01 = There is no association between degree of affection to the ads & gender of respondents
H„ = There is an association between degree of affection to the ads & gender of respondents.
The result of the study shows that the null-hypothesis holds to be valid thus there is no association between degree of affection to the ads & gender of respondents.
H02 = Degree of affection towards the ads will be the same irrespective of the age of respondents.
H12 = Degree of affection towards the ads will not be the same irrespective of the age of respondents.
The analysis supports the null-hypothesis that degree of affection towards the ads will be the same irrespective of the age of respondents. In other words age was found to have no significant differences on the degree of affection to the ads.
67
0
16
36
10
6
2
70
12
16
19
10
13
0
70
19
59
84
78
26
14
280
7
16
5
29
7
6
70
0
11
24
29
0
6
70
7%
21%
30%
28%
9%
5%
100%
Offensive
Interesting
Creative
Really Nice
Unethical
Unaffected / Bored
Total
Response Ad 1 Ad 2 Ad 3 Ad 4 Total Percentage
Degree of Affection
Gender Smart /Creative
Inappropriate /Unethical
Correctwhereneeded
Total
383270
221739
81119
8412
CalculatedValue
Degree ofFreedom
Level ofSignificance
TabulatedValue
5.995%21.94
2 testx
MaleFemaleTotal

The analysis provides enough evidence to reject the null Hypothesis. In other words Humor appeal affects the buying decision of respondents.
Conclusions:
It is a big question in the marketing area that how humor appeal used in advertisements, is perceived by respondents. In the same line this research was conducted and following conclusions were drawn:-
H03 = Humor appeal doesn't affect the buying decision of respondents.
H13 = Humor appeal affects the buying decision of respondents.
68
Degree of Affection
Age
< = 30 Years
ANOVA (F - ratio)
CalculatedValue
Degree ofFreedom
Level ofSignificance
TabulatedValue
18.5015%(1, 2)1.66
> 30 Years
Total
1
11
12
11
8
19
5
34
39
17
53
70
Smart /Creative
Inappropriate /Unethical
Correctwhereneeded
Total
2 test
TabulatedValue
Level ofSignificance
Degree ofFreedom
CalculatedValue
10.52 1 5% 3.841
TotalDisagreeAgree
Yes
No
Total
102
19
121
107
52
159
209
71
280
Decision ChangeProduct Purchase
x
1. Humor appeal was not taken in negative manner by respondents if it was used in a limit for the relevant products to make the ad creative.
2. Exploratory research shows that there is a thin line difference between the opinion of males & females but as per the chi-square there is no significant difference in the views of males & females towards the advertisements.
3. Respondents of every age group having the same views on the issue.
4. Humor appeal used in advertisements motivated the respondents to purchase the product but attributes of the product also plays a significant role in buying decision.
References
Belch, G. E., Belch, M. A., & Villareal, A. (1987). Effects of advertising communications: Review of research. In J. Sheeth, ed., Research in Marketing, IX, (p.59-1 17) . New York: JAI Press.
Cheng, Benjamin Ka Lun Duo, Christine Zhi Qun The Advertising Effectiveness of Projecting Humorous Elements into Sexual Advertising Appeals.
Gelb, B. D., & Pickett, C. M. (1983). Attitude toward the ad: Links to humor and to advertising effectiveness. Journal of Advertising, 12, 34-42.
Gelb, B. D., & Zinkhan, G. M. (1986). Humor and advertising effectiveness after repeated exposures to a radio commercial. Journal ofAdvertising, 15, 15-20.
Spotts, H. E., Weinberger, M. G., & Parsons, A. L. (1997). Assessing the use and impact of humor on advertising effectiveness: A contingency approach. Journal ofAdvertising, 24(3), 17-32
69

Introduction
Although environmental issues influence all human activities, few academic disciplines have integrated green issues into their literature. This is especially true of marketing. As society becomes more concerned with the natural environment, businesses have begun to modify their behavior in an attempt to address society's "new" concerns. Some businesses have been quick to accept concepts like environmental management systems and waste minimization, and have integrated environmental issues into all organizational activities. Some evidence of this is the development of journals such as "Business Strategy and the Environment" and "Greener Management International," which are specifically designed to disseminate research relating to business' environmental behavior.
One business area where environmental issues have received a great deal of discussion in the popular and professional press is marketing. Terms like "Green Marketing" and "Environmental Marketing" appear frequently in the popular press. Many governments around the world have become so concerned about green marketing activities that they have attempted to regulate them (Polonsky 1994a). For example, in the United States (US) the Federal Trade Commission and the National Association of Attorneys-General have developed extensive documents examining green marketing issues [FTC 1991, NAAG 1990]. One of the biggest problems with the green marketing area is that there has been little attempt to academically examine environmental or green marketing. While some literature does exist [Carlson, Grove and Kangun 1993, Davis 1992, Davis 1993], it comes from divergent perspectives.
What is Green Marketing
Unfortunately, a majority of people believe that green marketing refers solely to the promotion or advertising of products with environmental characteristics. Terms like Phosphate Free, Recyclable, Refillable, Ozone Friendly, and Environmentally Friendly are some of the things consumers most often associate with green marketing. While these terms are green marketing claims, in general green marketing is a much broader concept, one that can be applied to consumer goods, industrial goods and even services. For example, around the world there are resorts that are beginning to promote themselves as "ecotourist" facilities, i.e., facilities that "specialize" in experiencing nature or operating in a fashion that minimizes their environmental impact [May 1991, Ingram and Durst 1989, Troumbis 1991] .
Thus green marketing incorporates a broad range of activities, including product modification, changes to the production process, packaging changes, as well as modifying advertising. Yet defining green marketing is not a simple task. Indeed the terminology used in this area has varied, it includes: Green Marketing, Environmental Marketing and Ecological Marketing. While green marketing came into prominence in the late 1980s and early 1990s.
Green marketing is a phenomenon which has developed particular important in the modern market. This concept has enabled for the re-marketing and packaging of existing products which already adhere to such guidelines. Additionally, the development of green marketing has opened the door of opportunity for companies to co-brand their products into separate line, lauding the green-friendliness of some while ignoring that of others. Such marketing techniques will be explained as a direct result of movement in the minds of the consumer market. As a result of this businesses have increased their rate of targeting consumers who are concerned about the environment. These same consumers through their concern are interested in integrating environmental issues into their purchasing decisions through their incorporation into the process and content of the marketing strategy for whatever product may be required. This paper discusses how businesses have increased their rate of targeting green consumers, those who are concerned about the environment and allow it to affect their purchasing decisions. The paper identifies the three particular segments of green consumers and explores the challenges and opportunities businesses have with green marketing. The paper also examines the present trends of green marketing in India and describes the reason why companies are adopting it and future of green marketing and concludes that green marketing is something that will continuously grow in both practice and demand.
Keywords: Phenomenon, re-marketing, green-friendliness, environment
Green Marketing - New Hopes and Challenges Mohammed Naveed U*, Syed Yaseen**, Dr. Ghousia Khatoon***
*MBA, UGC NET, Faculty, HKBK College of Engineering, Department of Management Studies, Bangalore **MBA, (M.Com), (Phd), Faculty, Al-Arneen Institute of Management Studies, Bangalore "**Professor, Department of Management Studies, HKBK College of Engineering
70

The Green Marketing Mix
A model of a green marketing-mix should, of course, contain all 4P's:
• Product: A producer should offer ecological products which not only must not contaminate the environment but should protect it and even liquidate existing environmental damages.
• Price: Prices for such products may be a little higher than conventional alternatives. But target groups like for example LOHAS are willing to pay extra for green products.
• Place: A distribution logistics is of crucial importance; main focus is on ecological packaging. Marketing local and seasonal products e.g. vegetables from regional farms is more easy to be marketed "green" than products imported.
• Promotion: A communication with the market should put stress on environmental aspects, for example that the company possesses a CP certificate or is ISO 14000 certified. This may be publicized to improve a firm's image. Furthermore, the fact that a company spends expenditures on environmental protection should be advertised. Third, sponsoring the natural environment is also very important. And last but not least, ecological products will probably require special sales promotions.
Green Products and its Characteristics
The products those are manufactured through green technology and that caused no environmental hazards are called green products. Promotion of green technology and green products is necessary for conservation of natural resources and sustainable development. We can define green products by following measures:
• Products those are originally grown,
• Products those are recyclable, reusable and biodegradable,
• Products with natural ingredients,
• Products containing recycled contents, non-toxic chemical,
• Products contents under approved chemical,
• Products that do not harm or pollute the environment,
• Products that will not be tested on animals,
• Products that have eco-friendly packaging i.e. reusable, refillable containers etc.
Golden Rules of Green Marketing
1. Know your Customer: Make sure that the consumer is aware of and concerned about the issues that your product attempts to address, (Whirlpool learned the hard way that consumers wouldn't pay a premium for a CFC-free refrigerator because consumers dint know what CFCs were.).
2. Educating your customers: isn't just a matter of letting people know you're doing whatever you're doing to protect the environment, but also a matter of letting them know why it matters. Otherwise, for a significant portion of your target market, it's a case of "So what?" and your green marketing campaign goes nowhere.
3. Being Genuine & Transparent: means that a) you are actually doing what you claim to be doing in your green marketing campaign and b) the rest of your business policies are consistent with whatever you are doing that's environmentally friendly. Both these conditions have to be met for your business to establish the kind of environmental credentials that will allow a green marketing campaign to succeed.
4. Reassure the Buyer: Consumers must be made to believe that the product performs the job it's supposed to do-they won't forego product quality in the name of the environment.
5. Consider Your Pricing: If you're charging a premium for your product-and many environmentally preferable products cost more due to economies of scale and use of higher-quality ingredients-make sure those consumers can afford the premium and feel it's worth it.
6. Giving your customers an opportunity to participate: means personalizing the benefits of your environmentally friendly actions, normally through letting the customer take part in positive environmental action.
7. Thus leading brands should recognize that consumer expectations have changed: It is not enough for a company to green its products; consumers expect the products that they purchase pocket friendly and also to help reduce the environmental impact in their own lives too.
71

Green Marketing cases:
Phillips's "Marathon" CFL light bulb
Philips Lighting's first shot at marketing a standalone compact fluorescent light (CFL) bulb was Earth Light, at $15 each versus 75 cents for incandescent bulbs. The product had difficulty climbing out of its deep green niche. The company re-launched the product as "Marathon," underscoring its new "super long life" positioning and promise of saving $26 in energy costs over its five-year lifetime. Finally, with the U.S. EPA's Energy Star label to add credibility as well as new sensitivity to rising utility costs and electricity shortages, sales climbed 12 percent in an otherwise flat market.
Car sharing services
Car-sharing services address the longer-term solutions to consumer needs for better fuel savings and fewer traffic tie-ups and parking nightmares, to complement the environmental benefit of more open space and reduction of greenhouse gases. They may be thought of as a "time-sharing" system for cars. Consumers who drive less than 7,500 miles a year and do not need a car for work can save thousands of dollars annually by joining one of the many services springing up, including ZipCar (East Coast), I-GO Car (Chicago), Flex Car (Washington State), and Hour Car (Twin Cities).
Electronics sector
The consumer electronics sector provides room for using green marketing to attract new customers. One example of this is HP's promise to cut its global energy use 20 percent by the year 2010. To accomplish this reduction below 2005 levels, The Hewlett-Packard Company announced plans to deliver energy-efficient products and services and institute energy-efficient operating practices in its facilities worldwide.
Products & Services
Now companies are offering more eco-friendly alternatives for their customers. Recycled products for example, are one of the most popular alternatives that can benefit the environment. These benefits include sustainable forestry, clean air, energy efficiency, water conservation, and a healthy office. One example, is the E-commerce business and office supply company Shoplet which offers a web tool that allows you to replace similar items in your shopping cart with greener products.
Wipro's Green Machines (In India Only)
Wipro Infotech was India's first company to launch environment friendly computer peripherals. For the Indian market, Wipro has launched a new range of desktops and laptops called Wipro Greenware. These products are RoHS (Restriction of Hazardous Substances) compliant thus reducing e-waste in the environment.
Present Trends in Green Marketing in India
Organizations are Perceive Environmental marketing as an Opportunity to achieve its objectives. Firms have realized that consumers prefer products that do not harm the natural environment as also the human health. Firms marketing such green products are preferred over the others not doing so and thus develop a competitive advantage, simultaneously meeting their business objectives.
Organizations believe they have a moral obligation to be more socially responsible. This is in keeping with the philosophy of CSR which has been successfully adopted by many business houses to improve their corporate image. Firms in this situation can take two approaches:
• Use the fact that they are environmentally responsible as a marketing tool.
• Become responsible without prompting this fact.
Governmental Bodies are forcing Firms to Become More Responsible. In most cases the government forces the firm to adopt policy which protects the interests of the consumers. It does so in following ways:
• Reduce production of harmful goods or by products
• Modify consumer and industry's use and /or consumption of harmful goods; or
• Ensure that all types of consumers have the ability to evaluate the environmental composition of goods.
Competitors' Environmental Activities Pressure Firms to change their Environmental Marketing Activities. In order to get even with competitors claim to being environmentally friendly, firms change over to green marketing. Result is green marketing percolates entire industry. Cost Factors Associated With Waste Disposal or Reductions in Material Usage Forces Firms to Modify their Behavior. With cost cutting becoming part of the strategy of the firms it adopts green marketing in relation to these activities. It may pursue these as follows:
72
• A Firm develops a technology for reducing waste and sells it to other firms.
• A waste recycling or removal industry develops
Conclusion
Green marketing should not neglect the economic aspect of marketing. Marketers need to understand the implications of green marketing. If we think customers are not concerned about environmental issues or will not pay a premium for products that are more eco-responsible, think again. We must find an opportunity to enhance our product's performance and strengthen your customer's loyalty and command a higher price. Green marketing covers more than a firm's marketing claims.
Green marketing is still in its infancy and a lot of research is to be done on green marketing to fully explore its potential. Think of a refrigerator for example. While we may have had to be convinced in the 1950s to buy a refrigerator, we would have wanted the great white box to look cool in the 1970s, but in today's uncertain world, we might ask ourselves about the impact of the chlorofluorocarbons (CFCs) that our refrigerator is emitting and demand a more environmentally friendly refrigerator.
So, if today's successful marketing is about appealing to personal values and delivering consumer empowerment, then surely the time is right to inject sustainable development into the marketing mix to help address some of the gritty issues currently facing our planet. Green marketing methods produce highly effective results. They apply all of the steps you need to cut costs, raise response rates and increase growth in the most important marketing metric we are all held accountable for—the bottom line.
References
"An Introduction To Green Marketing" Electronic Green Journal 1(2), Polonsky, Michael Jay, University of Newcastle, 1994, Electronic Green Journal, UCLA Library, UC Los Angeles.
Business Strategy and The Environment, Bus.Strat.Env.II, pg 285-297. Ottoman, J.A. et al, "Avoiding Green Marketing Myopia", Environment, Vol-48, June-2006
Chopra, S. Lakshmi (2007), "Turning Over a New Leaf", Indian Management, Vol-64, April-2007
Green Marketing: An Overview, Dr. Sandhya Joshi , Graphic Era University, Dehradun, India, IJSTM Vol. 2, Issue 1, February 2011
Mishra etal. /Journal of Engineering, Science and Management Education/Vol. 3, 2010/9-14.
Ottoman, J A (Jan2004) "empower to the people "In business
Prakash, A. (May2002) "Green Marketing, public policy and managerial strategy
http://en.wikipedia.org/wiki/Green_marketing
www.coolavenues.com
73

The environment of business and economy has totally changed during last decade. This has given rise to certain new issues and challenges emerging out of this changing environment. Accounting in this reference has attained due attention in this fast changing business scenario.. The advent of information and technology has drastically changed the reporting patterns of information related to business and commerce. Internationally much of the emphasis has been laid to develop a new version of reporting system that is accepted worldwide with respect to accounting standards, principles and practices. It is evident from corporate scandals like Satyam, Worldcom and Enron that the traditional practices of accounting and auditing are needed to be reshaped through proper and credible accounting information system. The global economic meltdown to a greater extent was caused due to unfair reporting of assets and liabilities. The banks were not able to recover their debt, since the assets were overvalued in terms of their book values. In such a scenario, the emergence of appropriate measurement of assets and liabilities had attained a higher attention.
As concerned to ethics in accounting information the reporting made by accountants should be significantly efficient, reliable, genuine and prompt for the reason that interest of stakeholders is highly involved in it. The fast growing integration of various economies due to liberalization, privatization and globalization has created a need to set up specific common standards for trade and commerce. The new policy regime in India and political changes had experienced certain drastic changes in national economy. The corporate world had been refurbished and the stock exchange indices have touched new heights. The major issue confined to the above discussion is the reporting system of the companies in a global format that is widely accepted keeping in line with the concept of true and fair. From the investors point of view the company is required to present its statement on the basis of fair value accounting and the same need is felt at the time of mergers and acquisition. The two revolutionary changes hat the accounting world has experienced is the emergence of International Financial Reporting Standards (IFRS) and Extensible Business Reporting Language (XBRL) that are discussed in detail.
International Financial Reporting Standards
Accounting is a systematic method for recording, reporting and analyzing the financial transactions of the- business. The preparation of accounts of the companies depends on the Generally Accepted Accounting Principles (GAAP) that offers various methods of accounting and reporting. The reports are then provided to its users for various purposes. An effective decision making system from the point of view of stakeholder depends on the company's abilities and adequacy to provide information to its end users. The information sharing mechanism in this regard plays a vital role.
The reporting system tends to understand the information needs of the investors in the right prospective and have satisfied em. Accounting disclosure practices as a part of free and fair accounting system has been criticized for its deficiencies like 191 lime liners, difficult to access by users, window dressing, cost, lack of additionally and comparability etc. The new system that is IFRS tends to minimize such restrains.
Background
In order to maintain the uniformity in financial reporting throughout the world international accounting standard committee has been set up.'The objective of the committee was to formulate international accounting standards for various accounting treatment. Similarly Accounting Standard Board has been set up with the objective to formulate accounting standards in India. Accounting standards are written policy documents issued by expert accounting body covering the various aspects of recognition, measurement, treatment, presentation and disclosure of accounting transactions in the financial statements. Such accounting standards are designed for the uniformity in the accounting system, but each country has its own accounting standards as a result it is found that there is difference in treatment in various items in financial statements which are prepared by different countries all over the world. With the fast moving phase of globalization, a need has arisen to review the present System and converge various accounting standards all over the world to establish uniformity in treatment of various items in financial statements. Recent years have seen major changes in the financial reporting worldwide, the adaptation of IFRS were one of it.
Global Adaptation
IFRS and IAS are related to the entire body of standards that are under the names of international accounting standards and the newer international financial reporting standards. IFRS are issued by International Accounting Standard Board are the ,tandards in which financial information of a concern is to be reported. It provides a common platform in the form of
Emerging Dimensions in Accounting and Finance
Dr. Pushpkant Shakdwipee*
*Assocate Professor, Pacific Business School, Udaipur
74

globalized reporting system that makes the financial information comparable for the investors and stake holders. All the international accounting standards that are not replaced by new IFRS and still hold a valid position for the reporting purposes. IASB holds the key responsibility for various tasks associated with IFRS, that includes:
Modifying existing TAS and IFRS
Issuing new IFRS for existing list and suspending the existing TAS or IFRS.
Issuing new IFRS in new existing areas of accounting.
On July 19, 2002, the European Union (EU) Parliament passed a regulation that requires all companies listed in the EU to adopt International Financial Reporting Standards (IFRS) for fiscal years starting after January 1, 2005. Widespread adoption of IFRS will result in a fundamental change in the business environment, prior to 2005, companies followed a variety of country specific Generally Accepted Accounting Principles. Accounting theory argues that financial reporting reduces information asymmetry by disclosing relevant and timely information. Because there is considerable variation in accounting quality a economic efficiency across countries, international accounting systems provide an interesting setting to examine the economics, consequences of financial reporting. Although IFRS adoption was not mandatory until 2005, in the late 1990's, firms in son d European countries were allowed to use lAS as a substitute for domestic accounting standards various countries of the world had adopted IFRS. In India it was decided to adopt IFRS by April, 2011 but still no sign of implementation is in progress. There are various benefits associated with its implementation; one of it is to improve earnings quality through monitoring by investors, whose costs of acquiring expertise is reduced. Adopting IFRS in various countries reduces the cost of company firms across borders. It also reduces the investor cost to evaluate the quality of financial reports between two firms. The implementation of IFRS had a prolonged discussion, since initiation. The problem faced is with the alignment of IFRS with the Indian Accounting Standards. The difficulty arising out of it is the lack however not much can be predicted since the implementation part is still due but discussions are on from all the pros and cons of the issues under consideration.
Reporting under IFRS
Annual reports to be produced under IFRS include some or all of the following documents:
Chairman's letter for shareholders
Operational review
Director's report
Financial statements including; accounting policies, balance sheet, cash flow statement, notes to accounts auditors report.
The above listed document must be taken into consideration in combination not in isolation. The financial statement alone are not in the position to clear and accurate inference for a decision making purpose. The disclosures included in accounting policies and notes of accounts are able to convey lesser quantum of information. The operational review highlights the reasons behind capital expenditure that affects the future production capacity of the concern. The chairman's letter provides an independent view about the situation and performance of the company to its shareholders. It is assumed that this letter is going to present the true and fair picture of the company.. The director's report provides business review and corporate government. The business review part provides the financial performance and situation of the entity. The corporate governance section explains the process of supervision and control of the company affairs. It assures to the stakeholders that entity is bound follow certain rules for sound management. The notes of accounts are also considered as an integral part of the financial statement and represents explanatory remarks about how certain figures and values have been obtained and what the represent in more details. The notes often include information that is mandatorily required along with information provided, fulfill the principle of fairness in the representation in financial statements. Finally the auditor's report represents the opinion that the auditors have stated about the validity of the accounts and their compliance with the standards.
Fair Value Accounting
Fair value accounting had captured an immediate attention in the global finance, due to turmoil in the credit market. The need for reporting and measuring the fair value of assets and liabilities was felt. Fair value accounting applies to assets that are not traded on visible liquid market. This approach of accounting overcomes the traditional historical cost accounting in which assets are carried on balance sheet for whatever price the company has paid for them. The accounting treatment depends not on the nature of the asset but on what the company plans to do with it. Trading assets are accounted for at the fair value and changes in their value affect the profit and losses. The concept of fair value is defined in various terms with the same meaning. Fair value of an asset is the price that can be fetched from the open market, if that asset intended for sale. It is the potential mark price of an asset. Under US GAAP, fair value is the amount at which the asset would be sold or bought in a current transaction between willing parties or transferred to an equivalent part other than in a liquidation Sale. The FASB defines fair value an amount at which as assets and liabilities periodically and the effect or changes are recorded in the form of income this gives a better balance sheet that reflects the fair value of assets and liabilities of the company.
75
Advantages
A key benefit of fair value accounting is that it provides truthful asset and liability assessment on a continuing basis to stakeholders of a company's reported financial information. When the price of an asset or liability has increased or is expected to increase, the company marks up the value of the asset or liability to its current market price to reflect what it would receive if it sold the asset or would have to pay to relieve itself form the liability. On the other hand, the company marks down the value of an asset or liability to reflect any decrease in the market price. Fair value accounting limits a company's aptitude to influence its reported income. Sometimes management may intentionally arrange certain asset sales, for example, to use gains or losses from any price change for an asset or liability are reported in the period in which they occur. While an increase in asset value or a decrease in liability value adds to net income, a decrease in asset value or an increase in liability value reduces net income. Since fair value reflects the current market price in provides comparability of the value of various financial instruments.
Extensible Business Reporting Language (XBRL): An introduction
Advance information and technology has changed the way of doing business. This advancement had given new directions and revolutions in the field of electronic commerce and accounting information system was no exception to it. Accounting information system had played a vital role in decision making process of by internal and external issues. Digital technology has added more relevance to it, since it had become an integral part of reporting system. A global language (XBRL) for communication is developed that gives a common platform to compare the financial statement of various companies. XBRL is the language used for business communication of business and financial data. The beneficiaries and users of financial statement require such language, reporting system to extract quality information out of it to assist them for the investment decisions. This would be also beneficial for the companies to raise the funds for their financial requirement. This is because an investor would seek for companies who maintain for information is 'scheduled formats with a global perspective. An attempt has been made to deliver the financial information with the same meaning as intended by the creator of the information. This means the system bridge the gap between the creator and issue of the information as the understanding of the information is concern believe both the parties.
Fundamental
XBRL (Extensible Business Reporting Language) is a language based on XML for communicating business information. It mainly emphasizes an improve analytical and discloser practices of the financial information. XBRL as a language for the electronic communication of the business had revolutionized business reporting around the world. The benefit of this language its easy preparation, analysis and communication. It also offers greater efficiency and improved accuracy as well as reliability to all those involved in supplying or using financial data.
The current system of financial reporting is in word, Excel or HTML format. The basic drawback of these reporting formats, to a greater extent does not support automatic analysis and are not capable enough to process as per the requirement of the user. Although this language is an XBL based but the software is user friendly, requiring no previous knowledge of XML and IT and background. XBRL enables source data to be electrically tagged, that makes data machine readable. Thus, the user can automatically take out the information without the need for copy-pasting or keying -in. XBRL enables tagging of numbers, quantitative data and textual information. XBRL makes the data machine readable, with the help of two documents-taxonomy and XBRL instance document. Taxonomy defines the elements and their relationships. Using the relevant taxonomy, a company can map data and create an XBRL document.
The benefits of XBRL go beyond compliance since any data collation process can be streamlined using electronic tags. This language is being developed with collaborative efforts of major companies, organizations and government agencies. It has already being rapidly implemented by various companies world wide.
Implications
The circulars issued by ministry of corporate affairs, mandate certain companies to file their financial statements by using XBRL format. The circulars attained importance with regard to insuring XBRL compliance in India. At the initial phase it applied to all the listed companies in India, companies having paid up capital of rupees five crores and above and companies having turnover of hundred crores and above. The above list does not includebanking, financial and non financial companies. The reports cover financial statements, director's report and auditor's report. Accordingly, XBRL implementation does not change any requirements relating to preparation of the financial statements, but merely reflects a change in the manner which the financial statements will be transmitted to the regulators. However at the later stages the implication of XBRL was kept at the hold due to various technical reasons.
Implications challenges
However it not going to be easy task for the companies to adopt this new model of reporting. Companies need to quickly prepare themselves to this new reporting challenge and also to gain benefits from the broader business uses of XBRL. Some of the key challenges that companies might encounter as they adopt XBRL reporting are:
The training ofthe accountants and persons responsible for reporting the financial transactions.
The training is confined to understand XBRL and how it needs to be implemented in various aspects, including matt like timely tagging and validation processes.
76
Identifying various software tools to be used for the purpose of tagging.
The first -time efforts involved in tagging and resolving errors identified by validation checks.
Smooth and timely closure of reporting within the prescribed timelines.
To make sure about various security check ups.
XBRL and IFRS conclusively are going to lay high standards for recording and reporting the financial reporting of the business in the most transparent manner. XBRL as a recording and reporting language with IFRS as reporting standards will put synergy effect for an effective accounting information system. This will deliver major gains in efficiency, improving the process of accounting and reporting that would make the accounting information more comparative for stakeholders.
References
Barth, M., Clinch, G. and Shibano,.T. (1999) : "International accounting harmonization and global equity markets", Journal of Accounting and Economics, 26(1-3).
ebarshi Bhattacharya (2014) : " Emergence of IFRS towards fair value accounting system and its adoptability in India Scenario", Chartered Secretary,Vol.XLIV,no.9 Sept.
Kamalpreet Kaur Saini(2014): "Potential benefits of corporate through web-A study of small investors", Journal Commerce and Accounting Research, Vol.3,issue 1,Jan,Publishing India Group, New Delhi.
Ashutosh Verma(2014): "Data protection law in India: A business perspective", Journal of Commerce and Account Research,Vol.3,issue 1,Jan,Publishing India Group, New Delhi.
Ball, R., Kothari, S.P. and Robin, A. (2000): "The effect of international institutional factors on properties of account earnings", Journal of Accounting and Economics, 29(1).
Fakhruddin Badshah, Dhiraj Jain(2014): "Adaptability towards digital technology-A study on generation I", Research Sustainable Business", Exel India Publishers, NewDelhi.
K.Sanal Nair, Anupama Jhala, Dhiraj Jain(2014): "Indian Accounting Standards-Is -there a need of IFRS ?",Research a Sustainable Business",Exel India Publishers, NewDelhi.
Pallavi Jain, Jai Kishore Tyagi (2014) "A web based DSS for selection ,implementation and evaluation of ERP system", Journal of IPEM, Vol.8, issue no.2, July-Dec., Institute of Professional excellence & Management, Ghaziabad.
77

Perception of Investors in Hilly Regions: Experiences from India and Bhutan
Shubhro Michael Gomes*
IntroductionThe investment decisions have been greatly influenced by the changes in finance. The investment behaviour of individuals differs from various perspectives. The small and retail investors by number have increased manifold. The investment opportunities have also multiplied over the last decade. The capital markets along with its various components have also undergone changes. The small and retail investor character and behaviour in hilly regions of North Eastern India are quite similar to that of the Bhutanese. The study is an attempt to discover whether there are differences in investment behaviour of residents in India and Bhutan. The commonality considered was the hilly nature of the place – North Eastern region of India – Darjeeling, Gangtok and Shillong were selected from India, which has similar characteristics with that of Thimphu in Bhutan. The study is based on behaviourial finance literature and relates whether the small and retail investors are rational, overconfident and conservative, affected by disposition and cognitive dissonance, and are regret investors.
Objectives The principal objective of the study is to find out whether there are differences in investment behaviour of Indian and Bhutanese small and retail investors. The secondary objectives are to determine whether the small and retail investors are –
(i) Rational, overconfident and conservative;
(ii) Affected by disposition effect and cognitive dissonance; and
(iii) Regret investors.
Research MethodologyThe study is based on primary data collected from individuals who are resident of the hilly regions of North Eastern India and Bhutan. The important cities and towns were selected for the study – Darjeeling from West Bengal, Gangtok from Sikkim, Shillong from Meghalaya and Thimphu from Bhutan. The small and retail investor database from the places – Darjeeling, Gangtok, Shillong and Thimphu is quite difficult to populate. The technique of snowball sampling was applied to draw a sample of 100 investors from each place. The study includes 400 respondents – 300 from India and 100 from Bhutan. The respondents were served a questionnaire and were also interviewed. The response rate was maintained at 100% and there were no rejections for incompleteness of responses or any other reason.
The various tools and techniques used for the study include bar and column diagrams, percentage analysis, z-test and chi-square test.
The limitations of the present study are that it includes a comparatively small sample. The population includes only four places – three from India and one from Bhutan. The author had no personal bias in selection of respondents and also applied parametric tests which assume the samples to be randomly chosen.
Literature Review The study of investment behaviour of small and retail investors is an area of behavioural finance. Behavioural finance attempts to explain and understand the reasoning patterns of investors, including the emotional processes involved and the degree to which they influence the investment decision-making process. Essentially, the behavioural finance attempts to explain from a human perspective 'what', 'why', and 'how' of finance and investment.
The two building blocks of behavioural finance are cognitive psychology and the limits to arbitrage (Ritter, 2003). Cognitive refers to how people think and the limit to arbitrage when market is inefficient. The basic theories of behavioural finance concern with a series of new concept under the general heading of 'bounded rationality,' which is a term associated with Herbert Simon (1947 and 1983) and it relates to cognitive limitations on decision-making. As a result of which humans behave on the basis of simplified procedures or heuristics (Tversky and Kahneman, 1974). It is consistent with the study
*Asso. Professor (Colombo Plan), Royal University of Bhutan, GCBS, Gedu, Chukha, Bhutan
India and Bhutan although being friends share many similar characteristics. The author relates the hilly character and investment behaviour of residents. The paper is an attempt to discover whether there are differences in perception of investors in India and Bhutan – considering Indian capital markets to be mature enough as against Bhutanese capital market. The author attempts to devise strategies to develop the nascent and young capital markets in SAARC nations.
Keywords: Capital Markets, Investor Behaviour, SAARC nations, Hilly Regions
78
conducted by Slovic (1972) on investment risk-taking behaviour where he found that man has limitations as a processor of information and show some judgmental biases which lead people to overweight information.
People also tend to be over-reacting to information (DeBondt and Thaler, 1985 and 1987).
Shiller (1999) surveys some of the key ideas in behavioural finance, including Prospect theory, Regret theory, Anchoring and Market over-and under-reaction.
Prospect theory introduced by Khaneman and Tvernsky (1979, 1981, and 1986) suggests that people respond differently to equivalent situations depending on whether it is presented in the context of a loss or a gain.
"Regret theory" (Larrick and Boles, 1995) is another theory that deals with people's emotional reaction to having made an error of judgment.
Anchoring (Yates, 1990), is a phenomenon in which, in the absence of better information, investors assume current prices are right.
Market over-or under-reaction (DeBondt and Thaler, 1985), is the consequence of investors putting too much weight on recent news at the expense of other data. People show overconfidence. They tend to become more optimistic when the market goes up and more pessimistic when the market goes down. Hence, prices fall too much on bad environment.
Ricciardi and Simon (2000) discussed some general principles of behavioural finance including the overconfidence, financial cognitive dissonance, the theory of regret, prospect theory and compare it with the efficient market hypothesis and modern portfolio theory.
Raiffa (1968) introduced three approaches for analyzing decision making of investors –
i. The Normative Analysis which is the rational solution to the decision problem;
ii. The Descriptive Analysis is the way in which real people actually make decisions; and
iii. The Prescriptive Analysis is which is concerned with practical advice and help that people could use to make more rational decisions.
Kahneman (1998) explained the concept of beliefs, preferences and biases of investment which investment advisors should know about.
It has long been recognized that a source of judgment and decision biases, such as time, memory, and attention are limited, human information processing capacity is finite. Thus, there is a need for imperfect decision-making procedures, or heuristics (Simon, 1955, Tversky and Kahneman ,1974).
Hirshleifer (2001) argues that many or most familiar psychological biases can be viewed as outgrowths of heuristic simplification, self-deception, and emotion-based judgments.
A study conducted by Kent, Hirshleifer and Subrahmanyan (2001) had found the evidence for systematic cognitive errors made by investors and these biases affect market prices.
According to Kent, et al. (2001), the most common behaviour that most investors do when making investment decision are -
i. Investors often do not participate in all asset and security categories;
ii. Individual investors exhibit loss-averse behaviour;
iii. Investors use past performance as an indicator of future performance in stock purchase decisions;
iv. Investors trade too aggressively;
v. Investors behave on status quo;
vi. Investors do not always form efficient portfolios;
vii. Investors behave parallel to each other; and
viii. Investors are influenced by historical high or low trading stocks.
The present study concentrates on rationality, over confidence, conservatism, disposition effect, cognitive dissonance and regret. The above behavioural characteristics have been discussed as below.
Rationality A rational decision is one that is not just reasoned, but is also optimal for achieving a goal or solving a problem (Murthy et. al, 2012)
Overconfidence Overconfidence defines as "an overestimation of the probabilities for a set of events by Mahajan, J. (1992). Operationally, it is reflected by comparing whether the specific probability assigned is greater than the portion that is correct for all assessments assigned that given probability." (Murthy et. al, 2012)
79

Conservatism Conservative is simply means traditional. Conservatism as psychological attitude means human being has some excess attachment to the things which they have already with them and something new offer to them then they are not ready to accept that new thing or slowly and gradually they are accept that new thing (Murthy et. al, 2012). Edward (1962) explains conservatism bias. It means "Investors are too slow (too conservative) in updating their beliefs in response to recent evidence. This means that they might initially under react to news about a firm, so that prices will fully reflect new information only gradually. Such a bias would give rise to momentum in stock market returns."
Disposition Effect The common behaviour of investors to hold looser stocks too long and sell the winner stock too early is called disposition effect (Grinblatt and Han, 2002). Investors may rationally, or irrationally, believe that their current losers in future will outperform their current winners. They may sell winners to rebalance their portfolios or they may refrain from selling losers due to the higher transactions costs of trading at lower prices (Murthy et. al, 2012).
Cognitive Dissonance As individuals, we attempt to reduce our inner conflict (decrease our dissonance) in one of two ways –
i. We change our past values, feelings, or opinions, or,
ii. We attempt to justify or rationalize our choice.
This theory may apply to investors or traders in the stock market who attempt to rationalize contradictory behaviors, so that they seem to follow naturally from personal values or viewpoints. Goetzmann and Peles (1993) explain the cognitive dissonance. According to them, an individual try to reduce his/her inner conflict by changing their past values, feelings or opinion or he/she attempt to justify his/her choices. (Murthy et. al, 2012)
RegretAccording to Investopedia "simply regret theory deals with the emotional reaction people experience after realizing they've made an error in judgment. Faced with the prospect of selling a stock, investors become emotionally affected by the price at which they purchased the stock. So, they avoid selling it as a way to avoid the regret of having made a bad investment, as well as the embarrassment of reporting a loss." (Murthy et. al, 2012)
Results and DiscussionThe percentage analysis of the responses has been presented in table 1 as below.
Table 1: Percentage Analysis of Responses
Category Darjeeling Gangtok Shillong Thimphu Overall
Rational 38.67 37.33 36.33 40.33 38.17
Over-Confidence 40.67 34.67 35.33 40.00 37.67
Conservative 68.50 62.00 61.50 64.50 64.13
Disposition Effect 77.00 74.33 75.00 80.00 76.58
Cognitive Dissonance 41.00 37.00 34.00 38.00 37.50
Regret 50.67 45.33 46.33 50.67 48.25
The table 1 reveals that the proportion of small and retail investors who are rational ranges between 36.33 to 40.33. The proportion of small and retail investors who are overconfident ranges between 34.67 to 40.67. The proportion of small and retail investors who are conservative ranges between 61.50 to 68.50. The proportion of small and retail investors who are affected by disposition ranges between 74.33 to 80.00. The proportion of small and retail investors who are affected by cognitive dissonance ranges between 34.00 to 41.00. The proportion of small and retail investors who can be considered as regret investors ranges between 45.33 to 50.67.
80

The graph 1 above reveals the similarities and marginal differences in response according to place considering the averages.
The null hypothesis framed for each category and respective place was: The proportion of respondents is not more than 51%
The results of the z-test conducted are presented in table 2 below.
Table 2: Results of Z-test Category
Statistic
Darjeeling
Gangtok
Shillong
Thimphu
Overall
Rational
Zcal
-2.4672
-2.7339
-2.9339
-2.1338
-2.5672
P value
0.0136
0.0063
0.0033
0.0329
0.0103
Null Hypothesis
Accepted
Accepted
Accepted
Accepted
Accepted
Significance
SS
VSS
VSS
SS
SS Over-Confidence
Zcal
-2.0671
-3.2673
-3.1340
-2.2004
-2.6672
P value
0.0387
0.0011
0.0017
0.0278
0.0076
Null Hypothesis
Accepted
Accepted
Accepted
Accepted
Accepted
Significance
SS
VSS
VSS
SS
VSS Conservative
Zcal
3.5007
2.2004
2.1004
2.7005
2.6255
P value
0.0005
0.0278
0.0357
0.0069
0.0087
Null Hypothesis
Rejected
Rejected
Rejected
Rejected
Rejected
Significance
ESS
SS
SS
VSS
VSS Disposition Effect
Zcal
5.2010
4.6676
4.8010
5.8012
5.1177
P value
0.0001
0.0001
0.0001
0.0001
0.0001
Null Hypothesis
Rejected
Rejected
Rejected
Rejected
Rejected
Significance
ESS
ESS
ESS
ESS
ESS Cognitive Dissonance
Zcal
-2.0004
-2.8006
-3.4007
-2.6005
-2.7005
P value
0.0455
0.0051
0.0007
0.0093
0.0069
Null Hypothesis
Accepted
Accepted
Accepted
Accepted
Accepted
Significance
SS
VSS
ESS
VSS
VSS Regret
Zcal
-0.0667
-1.1336
-0.9335
-0.0667
-0.5501
P value
0.9468
0.2570
0.3506
0.9468
0.5822 Null Hypothesis
Accepted
Accepted
Accepted
Accepted
Accepted
Significance NSS NSS NSS NSS NSS
81
Graph 1 : Percentage Analysis of Responses
Rat
ional
Reg
ret
Ove
r-co
nfiden
ce
Conse
rvat
ive
Dis
positio
n effe
ct
Congniti
ve D
isso
nance
80.0070.00
60.050.0040.0030.0020.0010.00
0.00

Population Proportion: p = 0.51, Z = 1.96 at 95 % level of significance; ESS: Extremely statistically significant; VSS: tab
Very statistically significant; SS: Statistically significant; NSS: Not statistically significant
The small and retail investors are not rational as compared against a population proportion of 51%. In fact the study indicates in all the places it is much less than 51%. The results were similar when their confidence was tested and the results show that they are not over confident, on the other hand much less than 51% of the small and retail investors are over confident. The results indicate that much more than 51% of the respondents are conservative. A similar result was obtained when testing whether they are affected by disposition effect was found out. In case of the cognitive dissonance, much less than 51% of the respondents are affected by it. However, the small and retail investors seem to regret investors.
2The results of the z-test revealed a similar trend in all the places and a chi-square (Χ ) test of independence was conducted. The null hypothesis was that variable A (each category - regret, over confidence, conservative, etc. taken individually) and variable B (place – Darjeeling, Gangtok, Shillong and Thimphu) are independent.
2The results of the chi-square (Χ ) test are presented in table 3 below.
In all the cases the variables are found to be independent, since the p value is more than 0.05. This brings to light that the places whether in India (like Darjeeling, Gangtok or Shillong) or be it in Bhutan (like Thimphu) – the basic small and retail investor behaviour are similar as because all places are from hilly regions.
Conclusion
The small and retail investors of hilly regions of the North Eastern India and Bhutan share similar investor behaviour. The investors are not rational in nature. They are found not to be over confident (perhaps less confident). They are basically very conservative minded. They are affected by disposition effect but not by cognitive dissonance. In general about 51% of them are regret investors.
The study brings to light the basic nature of small and retail investors. The interview highlighted some interesting facts about their investment decisions – they is lack of awareness and investor education programmes, there is dearth of financial and investment consultants, they are unable to make best possible use if internet due to connectivity problems and there are problems in transacting investment business.
There is a lot of scope for future research in the related area. There can be more places included with in the study. A comparative study of hilly and non-hilly regions can be made. It is also possible to include more SAARC nations. The present study is just an effort to initiate alike studies.
References
Daniel Kahneman and Mark W. Riepe (1998). "Aspects of Investor Psychology." Journal of Portfolio Management, Vol. 24 No. 4, summer 1998
DeBondt F.M. W. and Thaler H.R. (1985), Does the stock market overreact?, The Journal of Finance, Vol. XI no. 3, 793-807
Edwards, W (1962) "Conservatism in human information processing" in: Kleimutz, B ed.: Representation of human judgment (John Wiley and Sons, New York, NY)
Goetzmann, W. N. and N. Peles (1993) "Cognitive Dissonance and Mutual Fund Investors." The Journal of Financial Research. Vol. 20, pp. 145-158
Kahneman D and Amos Tversky (1979), "Prospect Theory: An Analysis of Decision Under Risk", Econometrica, Vol. 47, No. 2, pp. 263-292
Kahneman, D and V. Smith (2002). "Foundations of Behavioral and Experimental Economics" The Royal Swedish Academy
Table 3: Results of Chi square (Χ2)
Category Χ2cal d.f. Χ2
tab P value Significance
Rational 0.943935 3 7.82 0.8148 NSS
Over-Confidence 0.725387 3 7.82 0.8672 NSS
Conservative 0.742893 3 7.82 0.8631 NSS
Disposition Effect 0.683539 3 7.82 0.8771 NSS
Cognitive Dissonance 0.776213 3 7.82 0.8551 NSS
Regret 0.742953 3 7.82 0.8631 NSS Level of significance = 95%; NSS: Not statistically significant
82
of Sciences Advanced Information on the Prize in Economic Sciences, 2002, pp.11
Kent, D., Hirshleifer, D. and Subrahmanyam, A., (2001). Overconfidence, Arbitrage, and Equilibrium asset pricing. Journal of Finance 56, 921-965
Larrick, R., and Boles, t (1995) Avoiding Regret in Decisions with Feedback: A Negotiation example; Organizational Behaviour and Human Decision Processes, 63, 87-97
Mahajan, J. (1992) "The Overconfidence Effect in Marketing Management Predictions."
Mark Grinblatt and Bing Han (2002). "The Disposition Effect and Momentum." NBER Working Paper No. 8734
Murthy, P.G. K. and Joshi, Divyang (2012) A Study on Retail Investors' Behavior, International Journal of Contemporary Business Studies, Vol: 3, No: 6. June, 2012 ISSN 2156-7506
Raiffa, Howard. Decision Analysis. Reading, MA: Addison-Wesley, 1968
Ritter Jay, (2003), Behavioural finance, Pacific-Basin Finance Journal 11 p 429-437
Tversky a. and Kahneman D., (1974). Judgment under uncertainty; Heuristics and biases. Journal of Science 185, 1124-1131
Tversky a. and Kahneman D., (1974). Judgment under uncertainty; Heuristics and biases. Journal of Science 185, 1124-1131
Tversky, A., and Kahneman, D (1986) Rational Choice and the Framing of Decisions. Journal of Business, 59, 251-294
Victor Ricciardi and Helen K. Simon. "What is Behavioral Finance?" Business, Education and Technology Journal Fall 2000.
Victor Ricciardi and Helen K. Simon. "What is Behavioral Finance?" Business, Education and Technology Journal Fall 2000Yates, J (1990) Judgement and Decision Making. Prentice Hall. P 118 – 127
83


FACULTY OF MANAGEMENT
Pacific Hills, Pratap Nagar Extn. Airport Road, Udaipur - 313 001
Pacific Academy of Higher Educa�on & Research University
Contact : +91 9414808190, +91 9414374423E-mail : unna�[email protected] Website : www.businessjournal.ac.in