Embed Size (px)
Citation preview
The Burden of Tobacco-Related Diseases andHealth Care Costs of Tobacco Use in the Philippines
Marina Miguel-Baquilod, MD, MScCountry Research Coordinator,
Tobacco and Poverty StudyDepartment of Health, Manila

Background
Project: “Tobacco and Poverty Study” in the Philippines
Component Studies:
1. Prevalence of Tobacco Use
2. Household Expenditures and Tobacco Use
3. Burden of Tobacco-Related Diseases in the Philippines
4. Analysis of Demand for Tobacco in the Philippines

Collaborative Study Group
Dept. of Health- Dr. Marina M. Baquilod- Dr. Ernie V. Vera- Dr. Elizabeth R. Matibag
WHO-TFI, HQ- Dr. Ayda A. Yurekli
College of Public Health-University of Philippines, Manila
- Mr. Alvin G. Tan- Prof. Marilyn E. Crisostomo .- Dr. Jesus Sarol- Dr. Jane C. Baltazar

Demographic and Economic Profile, Republic of the Philippines
Population (2007) 88.7M Population of 15-64y.o.=59.2% of Total
Popn. Life Expectancy at birth, Projected
2007 (Male=66.11yrs; Female=71.64yrs) Annual Growth Rate=2.4% Poverty Incidence (2003)= 27.4% of
Families Unemployment (Jan.2007) 7.8% Ave. Family Income (2003) P147,888
(U$2,640) Ave. Family Expenditures (2003)
P123,693 (U$2,208) GNP (Q4’06)Php1,856.0B (U$37B) GDP (Q4’06)Php1,693.6B (U$34B)
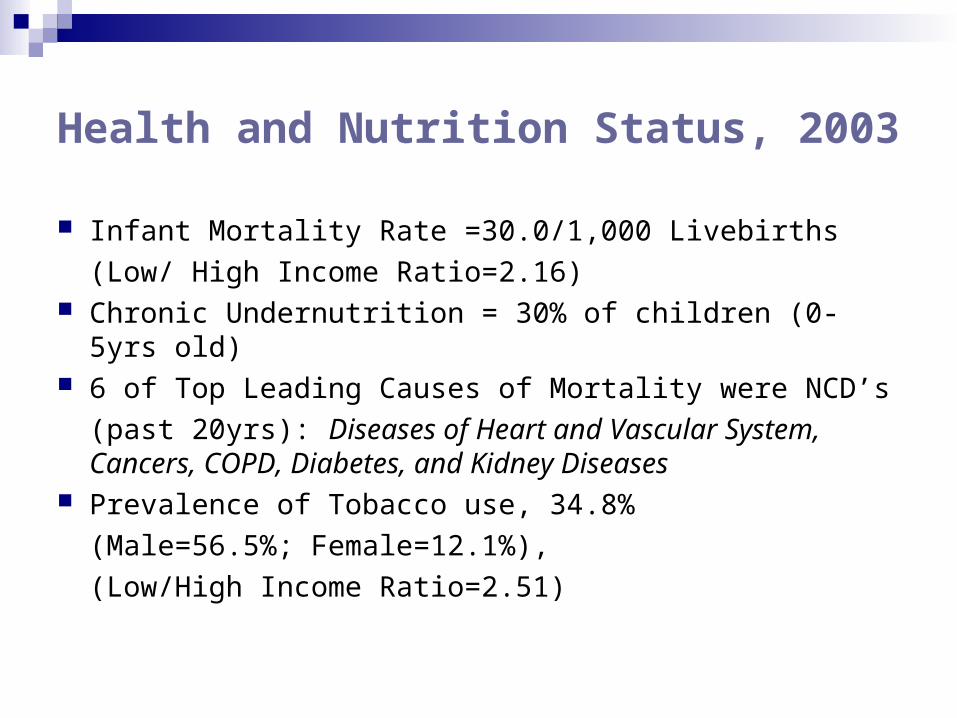
Health and Nutrition Status, 2003
Infant Mortality Rate =30.0/1,000 Livebirths
(Low/ High Income Ratio=2.16) Chronic Undernutrition = 30% of children (0-5yrs old) 6 of Top Leading Causes of Mortality were NCD’s
(past 20yrs): Diseases of Heart and Vascular System, Cancers, COPD, Diabetes, and Kidney Diseases
Prevalence of Tobacco use, 34.8%
(Male=56.5%; Female=12.1%),
(Low/High Income Ratio=2.51)

Health Expenditures, Selected Western Pacfic Countries, 2002
0102030405060708090
Per
cen
t
Total exp. On health as % of GDP
Gen. govt. exp. On health as % of total exp. On health
Private exp on health as % of total exp. On health
Source: National Statistical Coordination Board, 2004
7
Rationale of the Study
In 1995, the World Bank, estimated the number of smokers to be 1.1 billion smokers worldwide and projected it to rise to 1.6 billion by 2025 (Jha and Chaloupka, 1999).
In low- and middle-income countries where, an estimated 930 million smokers belong, cigarette consumption has been noted to increase (Jha et al, 2002).

Rationale
Known to be associated with a number of medical and non-medical causes of death and disability (US DHHS, 2004; English et al, 1995; Doll et al, 2004), half of all smokers will eventually die prematurely because of their habit.
Half of these deaths occur in the middle age (39-65 years) and lose 20 to 25 years of productive life (Jha and Chaloupka, 1999).
It was estimated that in the year 2000, about 4.83 M premature deaths in the world would be attributable to smoking (Ezzati and Lopez, 2003).

Rationale
A significant number adult Filipinos (15yrs and above) currently smoke cigarettes or use any tobacco product (NNHeS1998, 2003; BRFS 2001); Prevalence of current tobacco use ranks next to China and Indonesia (Tobacco Atlas, 2003)
A considerable number of Filipino youth initiated to
tobacco use; current smoking among girls had increased significantly (GYTS 2000, 2003).
Objectives
General objective: To determine the burden of disease attributable to smoking.
Specific objectives: Determine the health impact attributable to tobacco-
related diseases; Determine the economic impact attributable to tobacco-
related diseases.
Estimation of Disease Burden (Method 1)
jjBAFAB where
1)1(
)1(
j
jj RRP
RRPAF
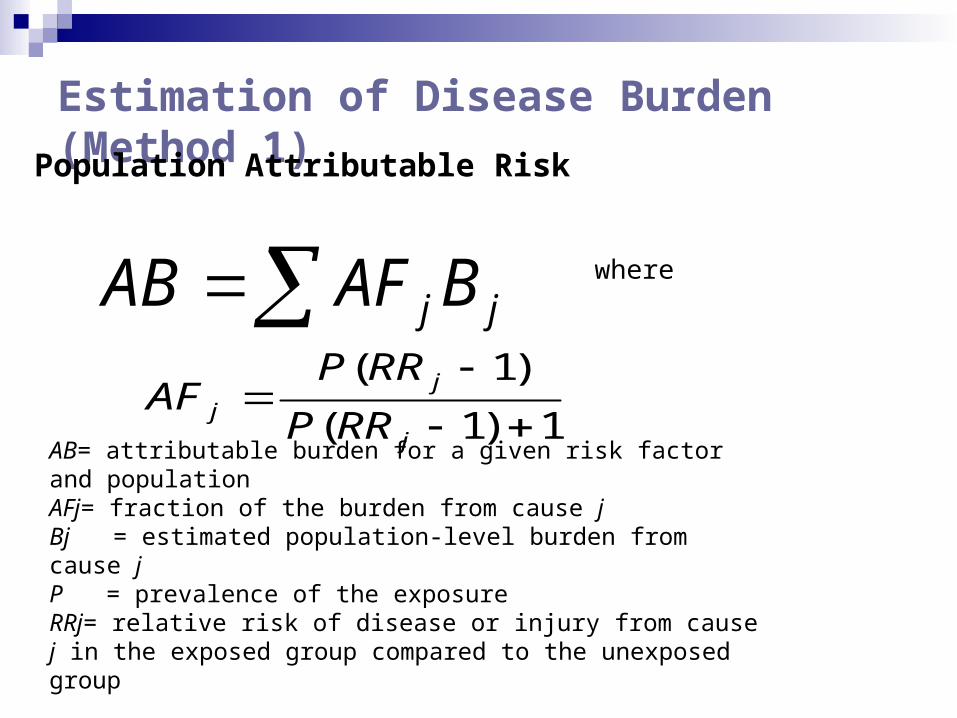
AB= attributable burden for a given risk factor and populationAFj= fraction of the burden from cause jBj = estimated population-level burden from cause jP = prevalence of the exposure RRj= relative risk of disease or injury from cause j in the exposed group compared to the unexposed group
Population Attributable Risk

Estimation of Disease Burden (Method 1)
LC
LC
LCLC
LCLC
N
N
NS
NCSIR
*
***
CLC= Age-sex specific lung cancer mortality rate in a populationNLC= Age-sex specific lung cancer mortality rate of never-smokers in the same populationS*LC and N*LC = Age-sex specific lung cancer mortality rates for smokers and never-smokers in a reference population
Smoking Impact Ratio
Estimation of Disease Burden (Method 1)
2
11* RR
RR
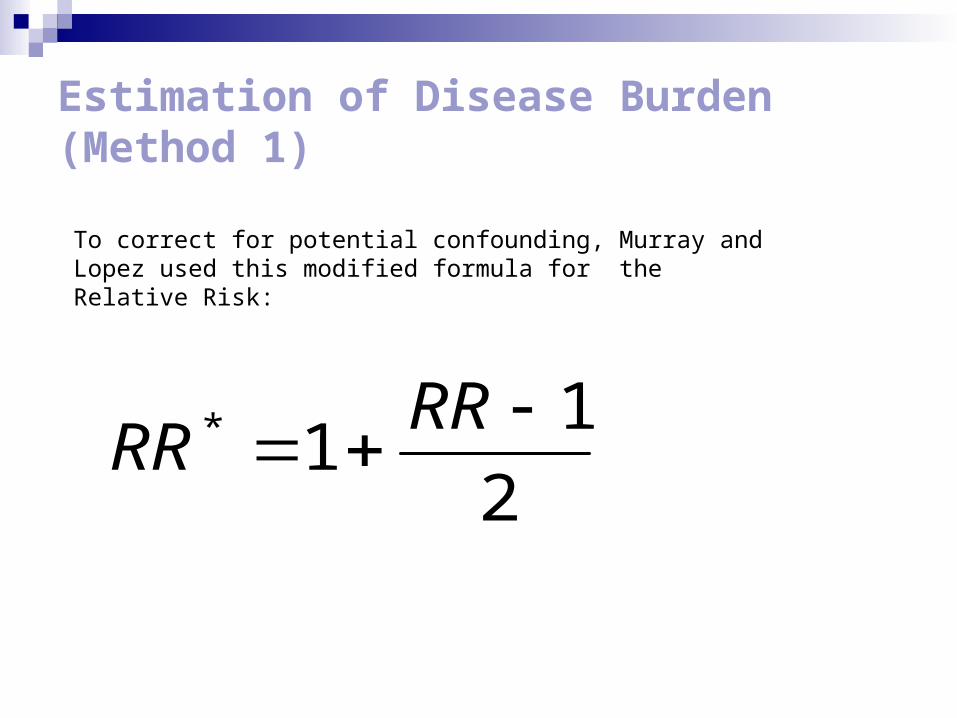
To correct for potential confounding, Murray and Lopez used this modified formula for the Relative Risk:

Estimation of Disease Burden (Method 2)SAF = [(p0 + p1(RR1) + p2(RR2)) - 1] /
[p0 + p1(RR1) + p2(RR2)]
P0=Percentage of adult never smokers in study groupP1=Percentage of adult current smokers in study
groupP2=Percentage of adult former smokers in study groupRR1=Relative risk of death for adult current smokers
relative to adult never smokersRR2=Relative risk of death for adult former smokers
relative to adult never smokers
Global Burden of Disease Study (1992): WHO & World Bank
To provide an objective assessment of health status that is comparable across countries
Address limitations of available health statistics
Disability Adjusted Life Years (DALY) as indicator

DALY
Measure of burden of disease as the gap between current health status and an ideal situation where people live to old age free of disease and disability.
Used for: 1. Measuring the health impact of a disease 2. Analyzing cost-effectiveness of alternative
interventions3. Priority setting
Combines life lost due to premature death with life years lost due to living in a disabled state.

DALY = YLL + YLDWhere:
YLL = Years of Life Lost or amount of time in years lost due to premature death from a specific disease.
YLD = Years Lived with Disability or the period of time someone has to live suffering from a disability brought about by a specific disease.

Parameters for DALY Estimation- Use of the spreadsheet model of Murray et. al. by
triangulating data from various sources
(sensitivity analysis):
1. Number of incident cases
2. Number of deaths
3. Number of cases with disabling sequelae
4. Duration of disability
5. Disability weights
6. Life expectancy
7. Age weighting
8. Discount rate
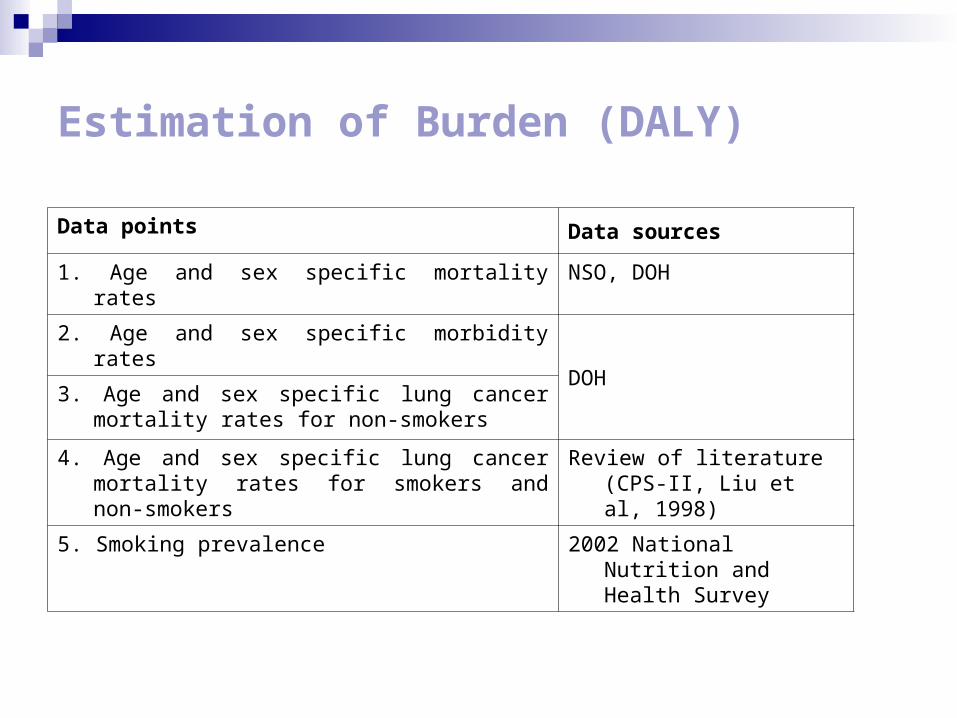
Estimation of Burden (DALY)
Data points Data sources
1. Age and sex specific mortality rates NSO, DOH
2. Age and sex specific morbidity rates
DOH3. Age and sex specific lung cancer mortality rates
for non-smokers
4. Age and sex specific lung cancer mortality rates for smokers and non-smokers
Review of literature (CPS-II, Liu et al, 1998)
5. Smoking prevalence 2002 National Nutrition and Health Survey
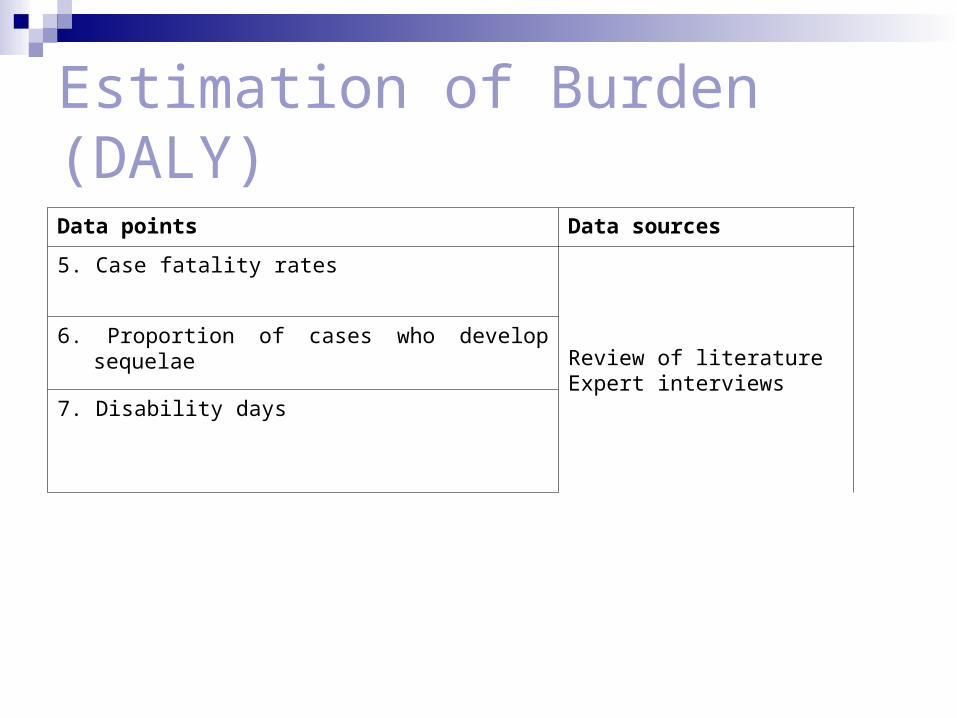
Estimation of Burden (DALY)
Data points Data sources
5. Case fatality rates
Review of literatureExpert interviews
6. Proportion of cases who develop sequelae
7. Disability days
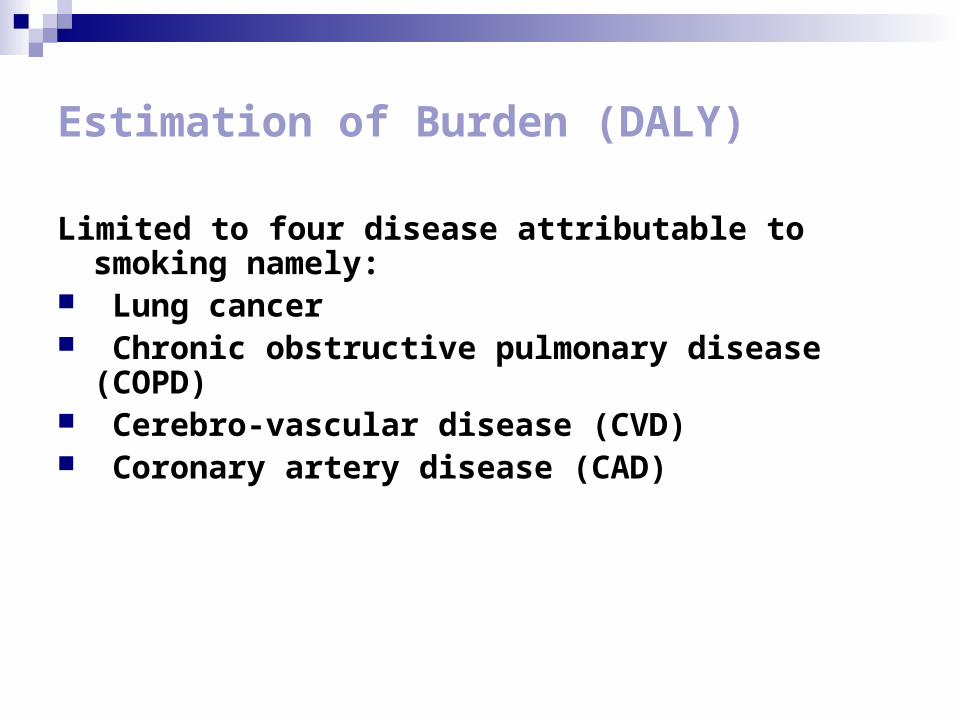
Estimation of Burden (DALY)
Limited to four disease attributable to smoking namely: Lung cancer Chronic obstructive pulmonary disease (COPD) Cerebro-vascular disease (CVD) Coronary artery disease (CAD)

Estimation of Burden (Costs)
combination of review or records, literature review, and expert interviews.
Perspective-societal Direct medical costs: hospitalization, out-patient
consultations, diagnosis, treatment and rehabilitation costs
Direct non-medical costs (salaries of watchers, transportation costs, etc) were not included
Philippine Health Insurance Corporation (PHIC) provided another data source for hospitalization costs
Estimation of Burden (Costs)
Productivity losses due to premature deaths- years of life lost (YLL) with the daily* minimum wage (P325) projected to 20 years
Productivity losses due to the disease were estimated using work days lost due to the four diseases as reported by Dans and colleagues (unpublished).
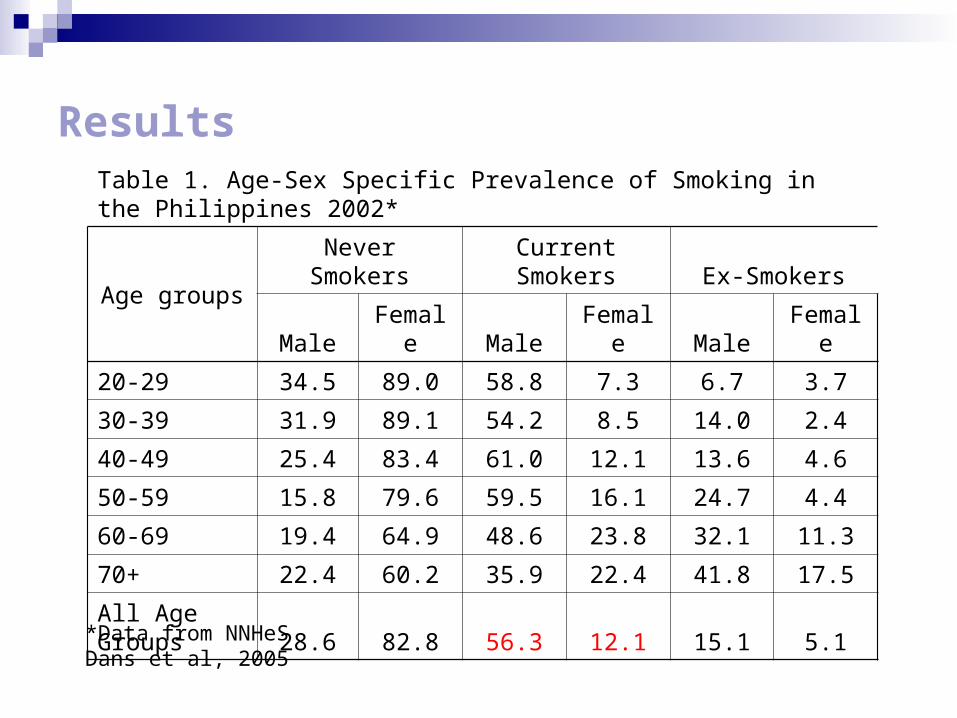
ResultsTable 1. Age-Sex Specific Prevalence of Smoking in the Philippines 2002*
Age groupsNever Smokers Current Smokers Ex-Smokers
Male Female Male Female Male Female
20-29 34.5 89.0 58.8 7.3 6.7 3.7
30-39 31.9 89.1 54.2 8.5 14.0 2.4
40-49 25.4 83.4 61.0 12.1 13.6 4.6
50-59 15.8 79.6 59.5 16.1 24.7 4.4
60-69 19.4 64.9 48.6 23.8 32.1 11.3
70+ 22.4 60.2 35.9 22.4 41.8 17.5
All Age Groups 28.6 82.8 56.3 12.1 15.1 5.1
*Data from NNHeSDans et al, 2005
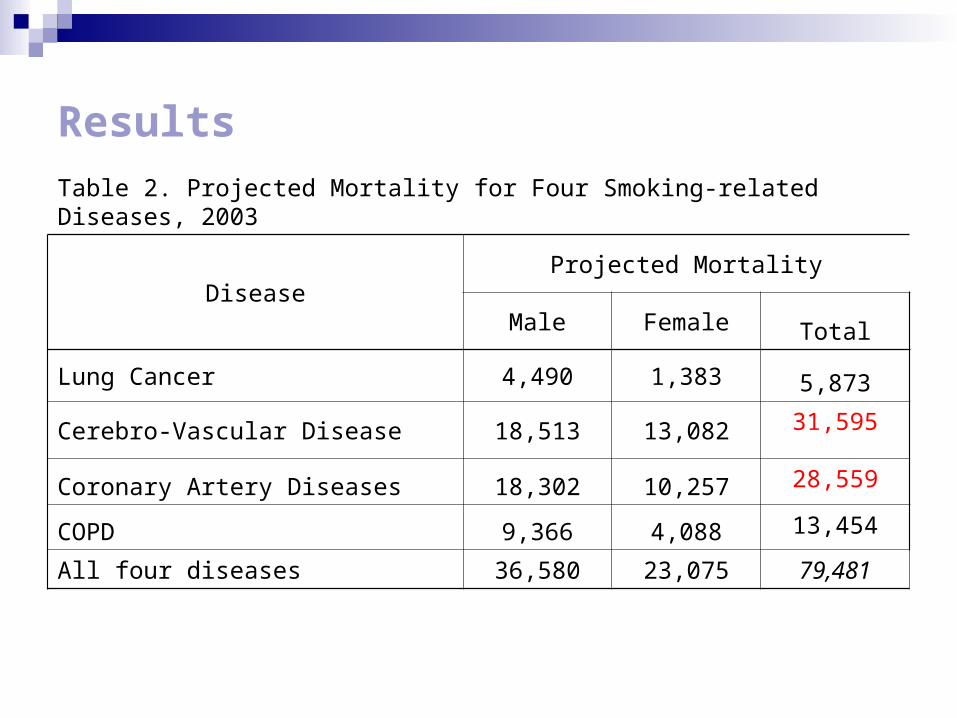
Results
Table 2. Projected Mortality for Four Smoking-related Diseases, 2003
DiseaseProjected Mortality
Male Female Total
Lung Cancer 4,490 1,383 5,873
Cerebro-Vascular Disease 18,513 13,082 31,595
Coronary Artery Diseases 18,302 10,257 28,559
COPD 9,366 4,088 13,454
All four diseases 36,580 23,075 79,481

Results
Table 3a. Smoking Attributable Mortality for Four Smoking-related Diseases, 2003*
DiseaseProjected Mortality
Male Female Total
Lung Cancer 4,150 952 5,102
Cerebro-Vascular Disease 7,739 2,603 10,342
Coronary Artery Diseases 7,642 1,909 9,551
COPD 7,947 2,903 10,850
All four diseases 27,478 8,367 35,845
*Using SAMMEC methodology
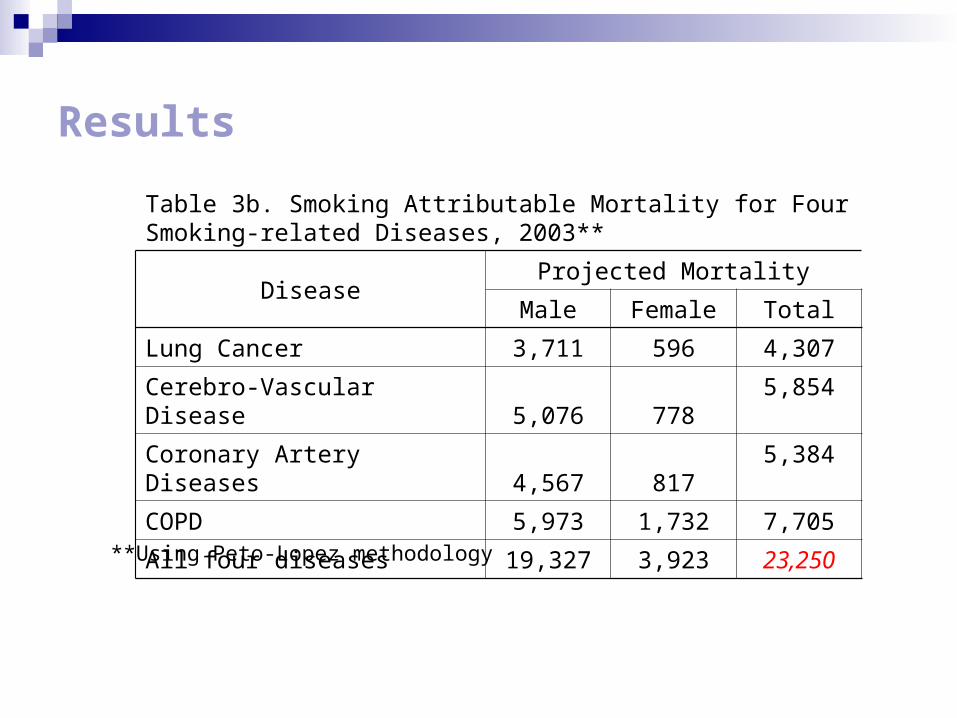
Results
Table 3b. Smoking Attributable Mortality for Four Smoking-related Diseases, 2003**
DiseaseProjected Mortality
Male Female Total
Lung Cancer 3,711 596 4,307
Cerebro-Vascular Disease 5,076 778 5,854
Coronary Artery Diseases 4,567 817 5,384
COPD 5,973 1,732 7,705
All four diseases 19,327 3,923 23,250
**Using Peto-Lopez methodology
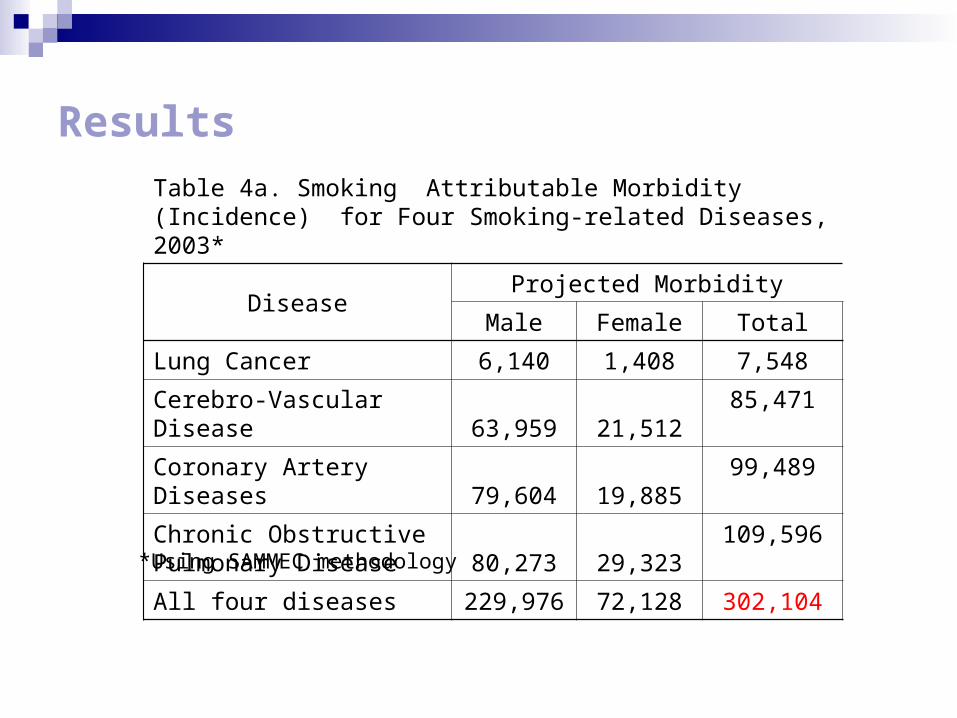
Results
Table 4a. Smoking Attributable Morbidity (Incidence) for Four Smoking-related Diseases, 2003*
DiseaseProjected Morbidity
Male Female Total
Lung Cancer 6,140 1,408 7,548
Cerebro-Vascular Disease 63,959 21,512 85,471
Coronary Artery Diseases 79,604 19,885 99,489
Chronic Obstructive Pulmonary Disease 80,273 29,323
109,596
All four diseases 229,976 72,128 302,104
*Using SAMMEC methodology
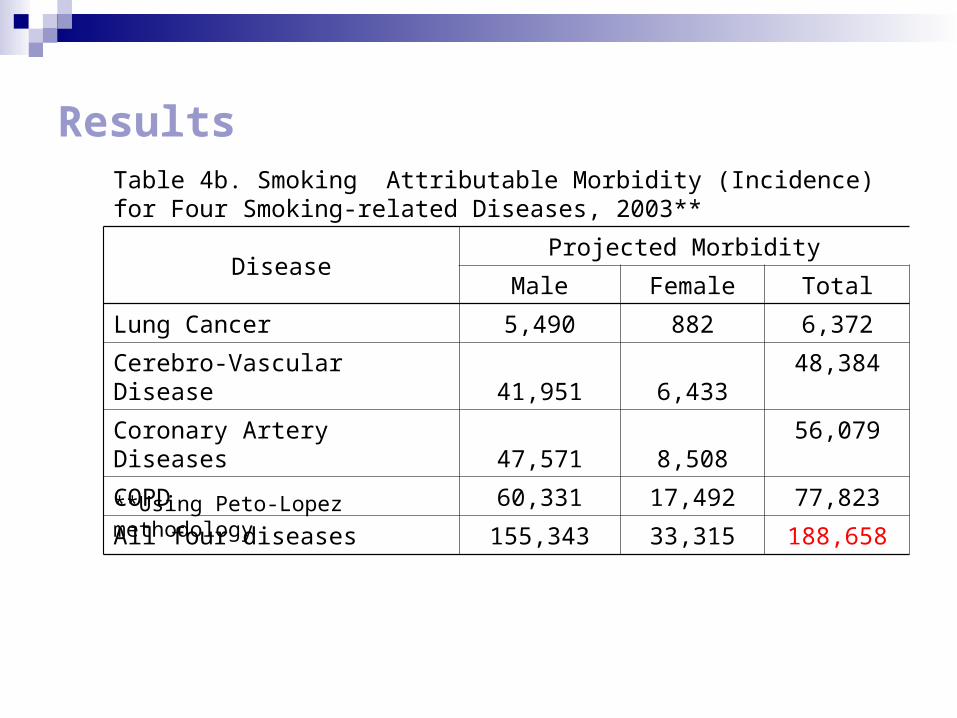
ResultsTable 4b. Smoking Attributable Morbidity (Incidence) for Four Smoking-related Diseases, 2003**
DiseaseProjected Morbidity
Male Female Total
Lung Cancer 5,490 882 6,372
Cerebro-Vascular Disease 41,951 6,433 48,384
Coronary Artery Diseases 47,571 8,508 56,079
COPD 60,331 17,492 77,823
All four diseases 155,343 33,315 188,658
**Using Peto-Lopez methodology

Results
Table 5a. Comparison of Smoking Attributable Fractions (SAF) Using SAMMEC and Peto-Lopez Methodology for Four Smoking-related Diseases, Males
DiseasesSAMMEC Peto-Lopez
35-64 65+ 35-64 65+
Lung Cancer 93% 92% 88% 75%
CVD 56% 22% 38% 7%
CAD 53% 23% 43% 8%
COPD 87% 86% 76% 57%

Results
Table 5b. Comparison of Smoking Attributable Fractions (SAF) Using SAMMEC and Peto-Lopez Methodology for Four Smoking-related Diseases, Females
DiseasesSAMMEC Peto-Lopez
35-64 65+ 35-64 65+
Lung Cancer 66% 77% 54% 37%
CVD 32% 11% 21% 3%
CAD 25% 14% 14% 3%
COPD 68% 78% 55% 38%
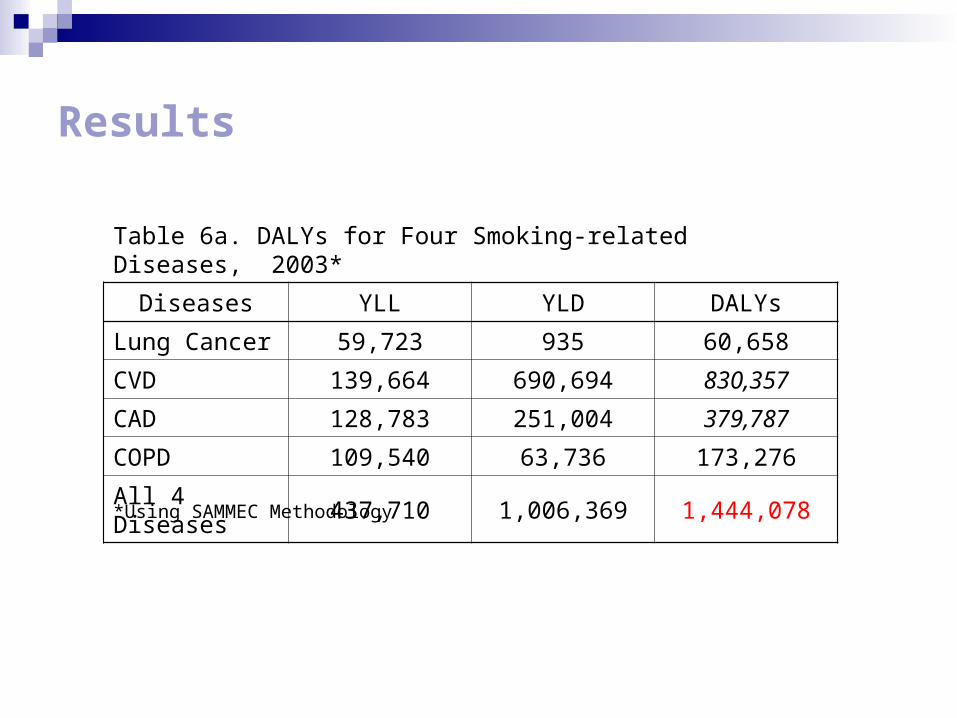
Results
Table 6a. DALYs for Four Smoking-related Diseases, 2003*
Diseases YLL YLD DALYs
Lung Cancer 59,723 935 60,658
CVD 139,664 690,694 830,357
CAD 128,783 251,004 379,787
COPD 109,540 63,736 173,276
All 4 Diseases 437,710 1,006,369 1,444,078
*Using SAMMEC Methodology

Results
Table 6b. DALYs for Four Smoking-related Diseases, 2003**
Diseases YLL YLD DALYs
Lung Cancer 19,048 1,157 20,205
CVD 87,277 103,344 190,621
CAD 83,962 225,292 309,254
COPD 84,976 47,205 132,181
All 4 Diseases 275,263 376,998 652,261
**Using Peto-Lopez Methodology
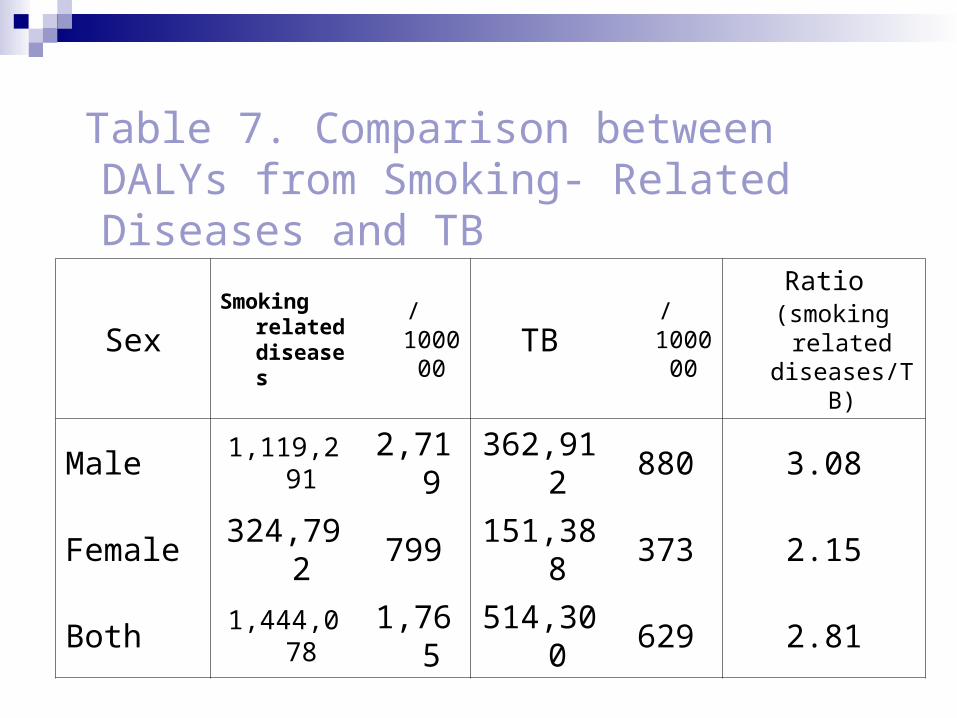
Table 7. Comparison between DALYs from Smoking- Related Diseases and TB
SexSmoking
related diseases
/100000
TB/100000
Ratio (smoking
related diseases/TB
)
Male 1,119,291 2,719
362,912
880 3.08
Female324,79
2799
151,388
373 2.15
Both 1,444,078 1,765
514,300
629 2.81
Results
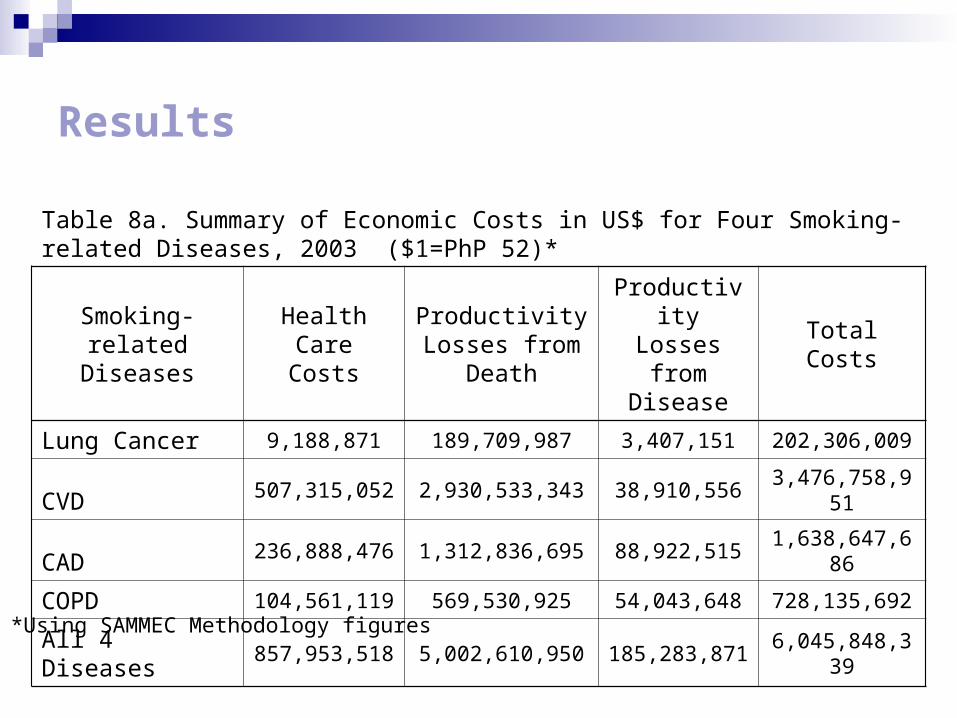
Table 8a. Summary of Economic Costs in US$ for Four Smoking-related Diseases, 2003 ($1=PhP 52)*
Smoking-related Diseases
Health Care Costs
Productivity Losses from
Death
Productivity Losses from
DiseaseTotal Costs
Lung Cancer 9,188,871 189,709,987 3,407,151 202,306,009
CVD 507,315,052 2,930,533,343 38,910,556 3,476,758,951
CAD 236,888,476 1,312,836,695 88,922,515 1,638,647,686
COPD 104,561,119 569,530,925 54,043,648 728,135,692
All 4 Diseases 857,953,518 5,002,610,950 185,283,871 6,045,848,339
*Using SAMMEC Methodology figures

Results
Table 8b. Summary of Economic Costs in US$ for Four Smoking-related Diseases, 2003 ($1=PhP 52)**
Smoking-related Diseases
Health Care Costs
Productivity Losses from
Death
Productivity Losses from
DiseaseTotal Costs
Lung Cancer 7,757,219 65,386,964 2,930,573 76,074,756
CVD 287,184,325 650,886,599 23,346,624 961,417,548
CAD 132,253,217 1,080,958,812 54,319,605 1,267,531,634
COPD 74,247,782 435,915,076 39,981,490 550,144,348
All 4 Diseases501,442,544 2,233,147,450 120,578,293 2,855,168,287
**Using Peto-Lopez Methodology figures
Discussion
Limitations• Only four of the 40 known diseases to be caused by
smoking were studied • Morbidity of the disease was probably underestimated
using indirect estimation• Morbidity and mortality estimates did not include those
for cigar smokers, passive smokers, pregnant women, and children
• Minimum wage was used to estimate productivity losses
• General picture of disease burden
Discussion
Higher estimates compared to Dans steady increase of mortality rates from the four diseases
studied increasing population
YLL=437,710 (53.49/10,000) Dans PYLL=125,918 (16.85/10,00) 3.17 times Dans estimate

Discussion
DALYs from lung cancer and COPD mainly YLL high case fatality ratio for lung cancer
CVD and CAD DALYs mainly YLD. The long duration of CAD and CVD sequelae and their
relatively low case fatality ratios

Discussion
Cost estimates Low=$2.86 B (Php148.72 B) High=$6.05 B (Php314.6 B) Dans Estimate= $891 M (Php46 B) GNP = Php 1,441.6B (2005 Q3) GDP= Php 1,322.4B (2005 Q3) Total Health Expenditure = Php165.2 B

Conclusions
DALYs range from 652,261 to 1,444,078 Different composition of DALYs Cost estimates range from $2.86 B to $6.05 B Over half of cases of the 4 major diseases were
attributable to smoking, hence, the significance of sustaining or strengthening comprehensive national tobacco prevention and control programs.

Policy Recommendations
Enforcement of the significant provisions of the Tobacco Regulatory Act of 2003 (RA 9211) and Framework Convention on Tobacco Control (FCTC)
Appropriation of budget, “Dedicated Taxes” as provided for in the “Sin Tax Law” (RA 9334), annual earmarking of 2.5% of revenues from tobacco excise tax since 2005 for disease prevention and control, focus on tobacco control and healthy lifestyle programs; and another 2.5% for Philippine Health Insurance, to increase coverage especially of indigent or poor families.
Strengthened comprehensive tobacco control programs that should prevent youth and poor people from uptake (taxation), available and accessible smoking- cessation programs, and strict environmental policies and regulations to prevent second-hand exposure to tobacco smoke.

Acknowledgments Tobacco Free Initiative, WHO, HQ- Dr. Anne- Marie Perucic- Dir. Douglas Bettcher
WHO,WPRO- Mr. Burke Fishburn- Mr. Jonathan Santos
WR-Philippines-Dr. Jean-Marc Olive-Dr. John Juliard Go
DOH- Usec. Ethelyn Nieto- Director Eric Tayag- Director Yoly Oliveros- Director Maylene Beltran- Dr. Marvi Ala- Dr. Jessica de Leon
Other GO’s- NSO, NSCB, NEDA,
NTA, BIR

MARAMING SALAMAT!Support Tobacco-Free Philippines