Embed Size (px)
Citation preview

THE BUILT ENVIRONMENT AND OBESITY-RELATED BEHAVIOURS IN
CANADIAN YOUTH
By
Laura Marie Seliske
A thesis submitted to the Graduate Program in Community Health & Epidemiology in
conformity with the requirements for the degree of Doctor of Philosophy
Queen‟s University
Kingston, Ontario, Canada
January, 2012
Copyright © Laura Marie Seliske, 2012

ii
ABSTRACT
The objectives of this thesis were to examine the relationship between the built
environment and obesity-related behaviours in Canadian youth, and to address measurement
issues relevant for studying these relationships. The thesis is comprised of four manuscripts.
The first manuscript determined the accuracy of the food retailer locations surrounding
34 schools in Ontario as provided by two geographic information system (GIS) databases. The
GIS locations of 25% of the food retailers were located within 15 m of their actual location, 50%
were within 25 m, and 75% were within 50 m. These values did not differ by GIS database
source.
The second manuscript examined the association between the presence of food retailers
surrounding schools and students‟ lunchtime eating behaviours. It also determined whether a
circular or road network buffer provided a better geographic boundary of the food retail
environment surrounding schools. It was carried out in 6,971 9th
and 10th
grades students from
158 schools. The presence of food retailers near schools was strongly associated with students
regularly eating their lunch at a snack-bar, fast-food restaurant or café. The road network buffers
provided the better measure of the food retail environment.
The third manuscript determined the optimal buffer size of the food retail environment
surrounding schools. Six road network buffers were created around 158 schools. These ranged
in size from 500 m to 5000 m. Results indicated that the 1000 m buffer was the optimal size.
The fourth manuscript explored associations between urban sprawl and active
transportation, moderate to vigorous physical activity (MVPA) and overweight/obesity in 7,017
youth aged 12 to 19 who resided in one of Canada‟s 33 Census Metropolitan Areas. Increasing
iii
levels of sprawl were modestly associated with increased active transportation (only among 12 to
15 year olds) and MVPA. No associations were found for overweight/obesity.
Taken together, the results from this thesis provide a better understanding of the role of
the built environment on obesity-related behaviours in Canadian youth. Important measurement
issues in this topic area were also addressed.
iv
STATEMENT OF CO-AUTHORSHIP
The manuscripts presented in this thesis are the work of Laura Seliske, in collaboration
with her co-authors. Laura Seliske was responsible for the study design, implementation,
analyses and the initial drafts of the manuscripts. Her supervisors, Dr. Ian Janssen and Dr.
William Pickett, were co-authors on all four manuscripts in this thesis, providing advice on
research methods and editorial feedback. In addition, Rebecca Bates, an undergraduate research
assistant, helped with the data collection for the first manuscript. For the second and third
manuscripts, Andrei Rosu provided technical advice for the GIS related work.
Chapter 3 – Manuscript 1: Field validation of food retailer listings: a comparison of
online and commercial geographic information systems databases. This manuscript is presented
as it was submitted to BMC Public Health. Funding for this manuscript was provided through the
research allowance provided by the Frederick Banting and Charles Best Canada Graduate
Scholarships from the Canadian Institutes of Health Research (CIHR). Additional funding was
provided through operating grants from CIHR and the Heart and Stroke Foundation of Canada.
Chapter 4 – Manuscript 2: Food retailers surrounding schools and lunchtime eating
behaviours of students. This manuscript is presented as it will be submitted to the Journal of
Nutrition and Metabolism for a special issue on “Health Effects of Local Food Environments”.
Funding for this manuscript was provided by research contracts with the Public Health Agency
of Canada and Health Canada as well as operating grants from CIHR and the Heart and Stroke
Foundation of Canada.
v
Chapter 5 – Manuscript 3: Identification of the optimal geographic boundary size to
use when measuring the food retail environment surrounding schools. This manuscript will be
jointly submitted with Manuscript 2 to the special issue within the Journal of Nutrition and
Metabolism, and has been formatted in the same matter. Funding for this manuscript was
provided by research contracts with the Public Health Agency of Canada and Health Canada as
well as operating grants from CIHR and the Heart and Stroke Foundation of Canada.
Chapter 6 – Manuscript 4: Urban Sprawl and its relationship with active
transportation, physical activity and obesity in Canadian youth. This manuscript has been
provisionally accepted for publication by Health Reports, which is affiliated with Statistics
Canada. The manuscript within the thesis is the revised version which incorporated feedback
provided by the reviewers of the article. Funding for this manuscript was provided by operating
grants from CIHR and the Heart and Stroke Foundation of Canada.

vi
ACKNOWLEDGEMENTS
First and foremost, I would like to start by acknowledging my supervisors, Drs. Ian
Janssen and William Pickett. Without their guidance, it would not have been possible to carry
out this thesis. They both have made valuable contributions that helped me gain skills and
expertise as a researcher during my graduate studies and I am most grateful for their support.
Thank you also to the faculty in the Community Health & Epidemiology department, who
provided challenging and insightful discussions on various topics.
I would also like to thank my fellow PhD students for their support, especially the
inaugural PhD class. It was a pleasure sharing the unique experiences associated with being the
first group of students in the Doctoral program in Community Health & Epidemiology. I wish
you all the very best in your future endeavors. I would also like to thank the students in Dr.
Janssen‟s epidemiology lab and Dr. Will Pickett‟s KGH group for their very helpful feedback on
various projects during my MSc and PhD.
Finally, I would like to thank my family and friends for their support and encouragement
through my graduate school endeavours. Also, thank you to Kevin for your never ending love
and support throughout this process.

vii
TABLE OF CONTENTS
Abstract…………………………………………………………………………………………...ii
Co-authorship………………………………………………………………………………….....iv
Acknowledgements………………………………………………………………………………vi
Table of Contents……………………………………………………………………………......vii
List of Tables…………………………………………………………………………………….xii
List of Figures…………………………………………………………………………………...xiv
List of Abbreviations…………………………………………………………………………….xv
CHAPTER 1: GENERAL INTRODUCTION………………………………………………...1
1.1 Public Health Relevance of Obesity in Children and Youth………………………………..1
1.2 Role of the Built Environment……………………………………………………………....1
1.3 Summary of Built Environment Research in the Obesity Field………………………….....3
1.3.1 Research in Young People………………………………………………………………3
1.3.2 Methodological Limitations of Existing Studies………………………………………..3
1.4 Thesis Purpose and Objectives……………………………………………………………...5
1.4.1 Thesis Purpose…………………………………………………………………………..5
1.4.2 Thesis Objectives………………………………………………………………………..5
1.4.3 Thesis Organization……………………………………………………………………..6
1.5 References…………………………………………………………………………………...7
CHAPTER 2: LITERATURE REVIEW…………..…………………………………………10
2.1 Overview…………………………………………………………………………………...10
2.2 Definitions………………………………………………………………………………….10

viii
2.3 The Built Environment and Obesity-Related Behaviours in Youth: Overview & Conceptual
Model………………………………………………………………………………………12
2.4 The Relationship Between the Food Retail Environment, Eating Behaviours, and Obesity in
Youth……………………………………………………………………………………….15
2.4.1 Relationships Between the Food Retail Environment Surrounding Homes, Eating
Behaviours, and Obesity …………………………………………………………….15
2.4.2 Relationships Between the Food Retail Environment Surrounding Schools and
Obesity……………………………………………………………………………….17
2.4.3 Relationships Between the Food Retail Environment Surrounding Schools and Eating
Behaviours…………………………………………………………………………...19
2.5 Methodological Limitations of GIS-Based Measures of the Food Retail Environment…...20
2.5.1 Secondary Sources of Food Retailer Locations……………………………………...20
2.5.2 Methods Used to Capture Food Retailers Surrounding Schools…………………….21
2.6 The Physical Activity Environment and Physical Activity-Related Outcomes in Youth…24
2.7 The Relationship Between Components of Urban Form and Physical Activity…………..27
2.7.1 Components of Urban Form and Physical Activity in Youth……………………….27
2.7.2 Urban Sprawl, Physical Activity, and Obesity in Young People……………………29
2.8 Summary…………………………………………………………………………………...30
2.9 References………………………………………………………………………………….32
CHAPTER 3: Field Validation of Food Retailer Listings: a Comparison of Online and
Commercial Geographic Information Systems Databases……………………………..….42
Abstract………………………………………………………………………………………...43
Background…………………………………………………………………………………….44

ix
Methods………………………………………………………………………………………..44
Results……………………………………………………………………………………….....46
Discussion……………………………………………………………………………………...47
Conclusion.………………………………………………………………………………….....48
Acknowledgements…………………………………………………………………………....48
References……………………………………………………………………………………..49
CHAPTER 4: Food Retailers Surrounding Schools and Lunchtime Eating Behaviours of
Students……………………………………………………………………….……………….54
Abstract………………………………………………………………………………………...55
Introduction…………………………………………………………………………………….56
Materials and Methods…………………………………………………………………………58
Results………………………………………………………………………………………….63
Discussion……………………………………………………………………………………...65
Conclusions…………………………………………………………………………………….68
Acknowledgements…………………………………………………………………………….69
References……………………………………………………………………………………...70
CHAPTER 5: Identification of the Optimal Geographic Boundary Size to Use When
Measuring the Food Retail Environment Surrounding Schools…………………………..80
Abstract………………………………………………………………………………………...81
Introduction…………………………………………………………………………………….82
Materials and Methods………………………………………………………………………....84
Results………………………………………………………………………………………….89
Discussion……………………………………………………………………………………...91

x
Conclusions…………………………………………………………………………………….93
Acknowledgements…………………………………………………………………………….93
References……………………………………………………………………………………...95
CHAPTER 6: Urban Sprawl and its Relationship with Active Transportation, Physical
Activity and Obesity in Canadian Youth…………………………………………………..105
Abstract……………………………………………………………………………………….106
Introduction…………………………………………………………………………………...107
Methods……………………………………………………………………………………….109
Results………………………………………………………………………………………...114
Discussion…………………………………………………………………………………….116
Acknowledgements…………………………………………………………………………...119
References…………………………………………………………………………………….120
CHAPTER 7: GENERAL DISCUSSION…………………………………………………...132
7.1 Summary of Findings…………………………………………………………………….132
7.2 Suitability for a Doctoral Dissertation in Epidemiology…………………………………134
7.3 Strengths & Limitations…………………………………………………………………..135
7.4 Methodological Contributions……………………………………………………………140
7.5 Public Health and Policy Contributions………………………………………………….141
7.6 Future Research…………………………………………………………………………..143
7.7 Conclusions…………………………………………………………………………….....144
7.7 References………………………………………………………………………………...145
APPENDICES…………………………………………………………………………………150
Appendix A: Ethics Approval……………………………………………………………..….150

xi
Appendix B: Health Behaviour in School Aged Children (HBSC) Survey Methodology…...155
Appendix C: Relevant Questionnaire Items from the Student and Administrator Health
Behaviour in School-aged Children (HBSC) Surveys……………………………….……..159
Appendix D: Canadian Community Health Survey (CCHS) Methodology………………….163
Appendix E: Relevant Questionnaire Items from the Canadian Community Health Survey
(CCHS) ……………………………………………………………………………..………167
Appendix F: Geographical Information Systems (GIS) Methodology……………………….174
Appendix G: Power and Sample Size………………………………………………………...189
xii
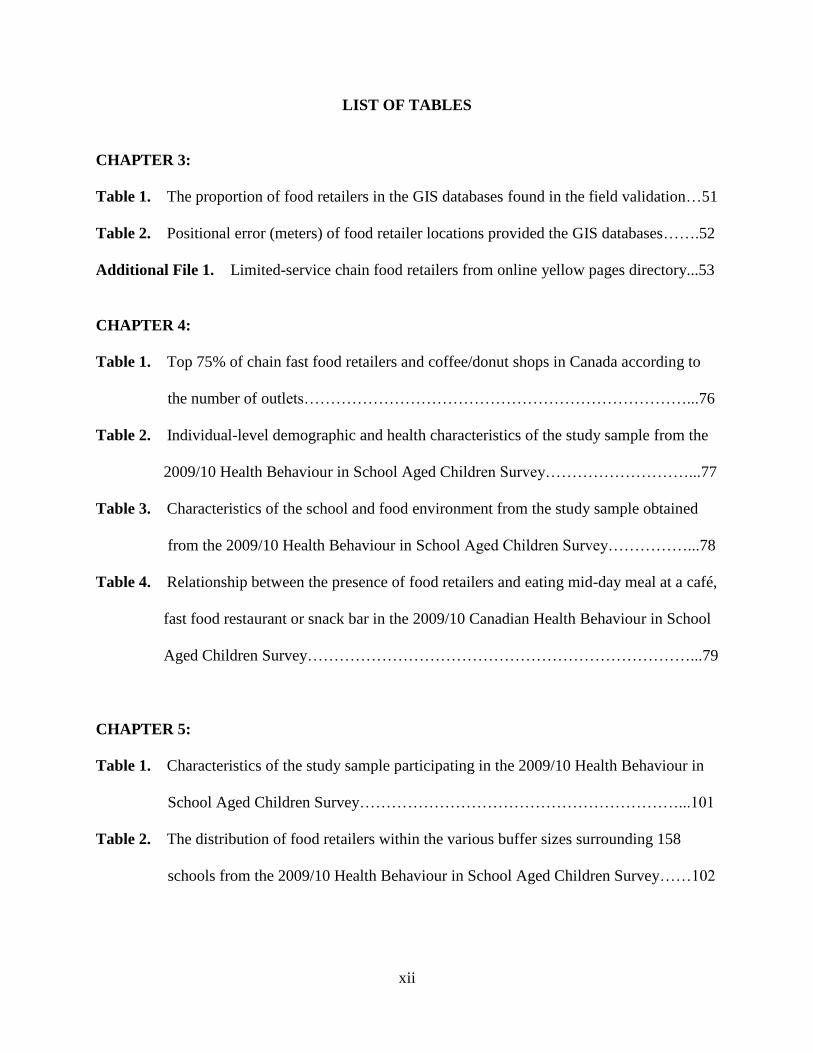
LIST OF TABLES
CHAPTER 3:
Table 1. The proportion of food retailers in the GIS databases found in the field validation…51
Table 2. Positional error (meters) of food retailer locations provided the GIS databases…….52
Additional File 1. Limited-service chain food retailers from online yellow pages directory...53
CHAPTER 4:
Table 1. Top 75% of chain fast food retailers and coffee/donut shops in Canada according to
the number of outlets………………………………………………………………...76
Table 2. Individual-level demographic and health characteristics of the study sample from the
2009/10 Health Behaviour in School Aged Children Survey………………………...77
Table 3. Characteristics of the school and food environment from the study sample obtained
from the 2009/10 Health Behaviour in School Aged Children Survey……………...78
Table 4. Relationship between the presence of food retailers and eating mid-day meal at a café,
fast food restaurant or snack bar in the 2009/10 Canadian Health Behaviour in School
Aged Children Survey………………………………………………………………...79
CHAPTER 5:
Table 1. Characteristics of the study sample participating in the 2009/10 Health Behaviour in
School Aged Children Survey……………………………………………………...101
Table 2. The distribution of food retailers within the various buffer sizes surrounding 158
schools from the 2009/10 Health Behaviour in School Aged Children Survey……102

xiii
Table 3. Relationship between the presence of food retailers near schools and students eating
lunch during the school week at a café, fast food restaurant or snack bar according to
various buffer sizes: different vs. identical exposure categories…………………...103
Table 4. Comparison of AIC values, relative likelihood, and Akaike‟s weights
across various buffer sizes: different vs. identical exposure categories……………104
CHAPTER 6:
Table 1. Demographic and health characteristics of the study population………………….127
Table 2. Urban sprawl scores and climate characteristics for Canada‟s 33 census metropolitan
Areas………………………………………………………………………………..128
Table 3. Multilevel logistic regression examining the association between urban sprawl and
active transportation among Canadian youth……………………………………….129
Table 4. Multilevel logistic regression examining the association between urban sprawl and
moderate-to-vigorous physical activity among Canadian youth…………………...130
Table 5. Multilevel logistic regression examining the association between urban sprawl and
overweight and obesity among Canadian youth……………………………………..131
Appendix E: Relevant Questionnaire Items from the Canadian Community Health Survey
Table 1. Duration of physical activity assigned to response categories in the CCHS……….172
Table 2. Activities used to determine MVPA and active transportation for Manuscript 4….173
Appendix G: Power and Sample Size
Table. Comparison of the actual versus required sample sizes for Manuscript 1………….190
xiv
LIST OF FIGURES
CHAPTER 2: Literature Review
Figure 1. Conceptual model depicting the relationship between features of the built
environment and obesity-related outcomes…………………………………………12
Figure 2. A comparison of a 1 km circular buffer and a 1 km road network buffer to measure
access to food retailers.……………………………………………………………...23
CHAPTER 4:
Figure. A comparison of a 1 km circular buffer and a 1 km road network buffer to measure
access to food retailers.………………………………………………………………..75
CHAPTER 5:
Figure. An illustration of the street-network buffer sizes used to measure the food
environment.…………………………………………………………………………100

xv
LIST OF ABBREVIATIONS
AIC Akaike‟s Information Criteria
BMI Body Mass Index
CI Confidence Interval
CCHS Canadian Community Health Survey
CMA Census Metropolitan Area
FAS Family Affluence Scale
GIS Geographic Information System
GPS Global Positioning System
HBSC Health Behaviour in School Aged Children
ICC Intraclass Correlation Coefficient
IQR Interquartile Range
MVPA Moderate to Vigorous Physical Activity
OR Odds Ratio
PAR Population Attributable Risk
RR Relative Risk
SD Standard Deviation

1
CHAPTER 1: GENERAL INTRODUCTION
1.1 Public Health Relevance of Obesity in Children and Youth
Over the past three decades, the prevalence of obesity among Canadian youth has
increased threefold [1]. Results from the 2004 Canadian Community Health Survey (CCHS)
found that 18% of youth aged 2 to 17 years were overweight and 8% were obese [1]. This is
cause for concern due to the many health problems associated with obesity in young people,
ranging from cardiovascular and metabolic health risks [2-5] to psychosocial issues such as
depression [6] and social marginalization [7]. In addition, obesity tends to track from the
adolescent to adult years, with longitudinal studies indicating that 75 to 90% of obese youth will
remain obese as young adults [8]. Because of the numerous health problems associated with
obesity and its persistence into adulthood, it is important to gain a comprehensive understanding
of its determinants in order to inform prevention and treatment efforts.
1.2 Role of the Built Environment
Interventions that have targeted young peoples‟ physical activity and dietary behaviours
without addressing their surrounding environments have been largely unsuccessful in preventing
obesity [9]. Researchers now recognize the importance of the built environment on obesity-
related behaviours such as diet and physical activity, with the earliest studies in young people
appearing in 2004 [10]. The „built environment‟ refers to our surrounding physical environment
and provides the context in which health-related behaviours occur. Srinivasan et al. [11] provide
a broad definition of the built environment adapted from Health Canada, stating: “The built
environment includes our homes, schools, workplaces, parks/recreation areas, business areas

2
and roads. The built environment encompasses all buildings, spaces and products that are
created or modified by people. It impacts indoor and outdoor physical environments as well as
social environments and subsequently our health and quality of life”.
The preventive medicine strategy proposed by Rose [12] supports the notion of
modifying the built environment in order to improve the health of the broader population. It
emphasizes the fact that although some potentially important risk factors may be small, they can
affect a large segment of the population. This strategy aligns with the concept of population
attributable risk (PAR), which is equal to: Pexp(RR - 1) / (1 + Pexp(RR - 1), where Pexp denotes the
prevalence of the exposure and RR is the relative risk [13]. Thus, as the prevalence of an
exposure (Pexp) increases, the risk of an outcome at the population level – the population
attributable risk – is important, even if the magnitude of the risk is modest. Rose also notes that it
is difficult for people to engage in behaviours that do not correspond to the behaviours of others
around them, stating that “the efforts by individuals are only likely to be effective when they are
working with the societal trends” [12]. This also supports the strategy of modifying the built
environment to facilitate healthy behaviours.
There are three main components of the built environment that are hypothesized to be
associated with obesity. They include the food environment (e.g. access to various food retailers)
and the physical activity environment (e.g. access to amenities such as parks and recreational
facilities). In addition, it also includes a component referred to as urban form, which refers to the
design and organization of cities, including features such as layout of streets and the availability
of sidewalks and bike paths. This thesis will focus on the food environment and urban form as
they related to eating behaviours, physical activity, and obesity in Canadian youth.
3
1.3 Summary of Built Environment Research in the Obesity Field
1.3.1 Research in Young People
Obesity and its causal behaviours are associated with features of the built environment,
including: the food environment [14-16] and urban sprawl [17,18]. The food environment refers
to the availability of various types of food retailers within a given area, including fast food
restaurants, convenience stores, coffee/donut shops and other types of food retailers. Urban
sprawl is related to the layout of cities, and for the purposes of this thesis, refers primarily to
features of metropolitan areas that influence how people travel from one place to another.
Changes to the built environment provide one potential strategy to prevent a further rise
in obesity levels by influencing its causal behaviours. Young people may be affected by the built
environment differently than adults, particularly with respect to mobility, since many cannot use
a vehicle as their primary mode of transportation and may be more reliant on forms of active
transportation such as walking or cycling. Furthermore, young people are undergoing a rapid
period of development and the choices presented to them through their environments may
influence their behaviour differently. With a more thorough understanding these influences,
public health professionals and policy makers will be in a better position to intervene at a young
age when health habits are being formed. Research into the effects of the built environment on
obesity levels in young people may inform urban planning and policies surrounding the design of
neighbourhoods and schools by encouraging the creation of built environments that facilitate
healthy choices.
1.3.2 Methodological Limitations of Existing Studies
A key measurement issue for large-scale studies of the food environment is their reliance
on the accuracy of information that is provided in commercial lists or publicly available

4
databases. In order to be feasible, large-scale studies must rely on secondary sources to obtain
information on the location of food retailers, as opposed to obtaining this information via direct
observation. Few studies have examined issues of accuracy with respect to this information,
particularly the accuracy of Canadian sources. Only one such study has been conducted to date in
Canada [19], but it took place within a single city and combined the physical activity and food
environment features into one measure of the built environment. This is problematic due the
challenges associated with measuring access to parks, which can span large geographic areas and
have multiple access points, versus restaurants, which are smaller and have more clearly
identifiable access points.
Another methodological issue in this field concerns the methods used to measure access
to components of the built environment. Studies that have examined access to food retailers have
differed considerably in terms of their measurement approach. Some studies have measured the
number of destinations within pre-existing boundaries such as ZIP codes [20,21]. The limitation
of pre-existing boundaries is that they were designed for administrative purposes and may not be
consistent in size. Other studies have determined the number of food retailers within a certain
distance, using either circular buffers [14,22] or road network buffers [15,16,23]. Studies using
radius or road network distances may avoid the problems associated with pre-existing
administrative boundaries, but to date, no methodological studies have determined the distance to
the destinations that is most relevant to health, and little is known about whether using a road
network buffer or a circular buffer is more optimal for the measurement of access to the food
environment.

5
1.4 Thesis Purpose and Objectives
1.4.1 Thesis Purpose
The overall purpose of this thesis is to examine the influence of the built environment on
the causal behaviours of obesity in Canadian youth. The built environment is an important area
of research because it takes into account the broader contextual influences on health behaviours.
Since research in this field is relatively new, there are key measurement issues regarding how to
measure the built environment which need to be resolved. The purpose of this thesis is to
examine how the built environment affects eating behaviours and physical activity in large
samples of Canadian youth. In addition, this thesis will also help identify the optimal methods to
use to measure the built environment.
1.4.2 Thesis Objectives
Objective 1: To address some of the methodological issues surrounding the use of Geographical
Information Systems (GIS) to measure features of the built environment, with an emphasis on
the food environment. This included comparing different measurement approaches and
quantifying the level of error in publicly available GIS databases used to measure features of the
built environment.
Objective 2: To examine the relationship between the built environment and the behavioural
determinants of obesity in young people, including eating behaviour and physical activity. This
was accomplished using nationally representative samples of Canadian youth and incorporated
the built environment measurements refined in Objective 1.

6
1.4.3 Thesis Organization
This thesis is organized as a manuscript-based thesis. Prior to the manuscripts, there is a
literature review that will outline the relationships between the built environment and the causal
behaviours associated with obesity in young people. Also, methodological limitations of the
measurement of the built environment will be reviewed, with a focus on the food environment.
Next, the four manuscripts will be included. They are organized as follows: the first manuscript
addresses an important measurement issue related to the use of GIS databases to obtain
information on the location of food retailers. It quantifies the measurement error of the positional
information provided by a commercial database and an online directory for food retailers located
near schools in urban and non-urban areas. The focus of the second manuscript will be on
determining whether circular or road network based buffers provide the more optimal measure of
the school food retail environment and its relationship with students‟ lunchtime eating
behaviours. For the third manuscript, various sized buffers will be used to determine the
relevant distance from schools to capture food retailers in order to examine their relationship
with students‟ lunchtime eating behaviours. Finally, the fourth manuscript shifts focus to urban
sprawl and its relationship with physical activity in a large sample of Canadian youth. Following
the four manuscripts, a discussion chapter will summarize the results and implications of the
findings of the four manuscripts.

7
1.5 References
1. Shields M: Overweight and obesity among children and youth. Health Rep 2006;17:27-
42.
2. Freedman DS, Dietz WH, Srinivasan SR, Berenson GS: The relation of overweight to
cardiovascular risk factors among children and adolescents: the Bogalusa Heart Study.
Pediatrics 1999;103:1175-1182.
3. Raitakari OT, Porkka KV, Viikari JS, Ronnemaa T, Akerblom HK: Clustering of risk
factors for coronary heart disease in children and adolescents. The Cardiovascular Risk in
Young Finns Study. Acta Paediatr 1994;83:935-940.
4. Travers SH, Jeffers BW, Eckel RH: Insulin resistance during puberty and future fat
accumulation. J Clin Endocrinol Metab 2002;87:3814-3818.
5. Andersen LB, Sardinha LB, Froberg K, Riddoch CJ, Page AS, Anderssen SA: Fitness,
fatness and clustering of cardiovascular risk factors in children from Denmark, Estonia
and Portugal: the European Youth Heart Study. Int J Pediatr Obes 2008;3 Suppl 1:58-66.
6. Sjoberg RL, Nilsson KW, Leppert J: Obesity, shame, and depression in school-aged
children: a population-based study. Pediatrics 2005;116:e389-392.
7. Strauss RS, Pollack HA: Social marginalization of overweight children. Arch Pediatr
Adolesc Med 2003;157:746-752.
8. Freedman DS, Khan LK, Serdula MK, Dietz WH, Srinivasan SR, Berenson GS: The
relation of childhood BMI to adult adiposity: the Bogalusa Heart Study. Pediatrics
2005;115:22-27.
9. Summerbell CD, Waters E, Edmunds LD, Kelly S, Brown T, Campbell KJ: Interventions
for preventing obesity in children. In Cochrane Database Syst Rev. 2005:CD001871.

8
10. Papas MA, Alberg AJ, Ewing R, Helzlsouer KJ, Gary TL, Klassen AC: The built
environment and obesity. Epidemiol Rev 2007;29:129-143.
11. Srinivasan S, O'Fallon LR, Dearry A: Creating healthy communities, healthy homes,
healthy people: initiating a research agenda on the built environment and public health.
Am J Public Health 2003;93:1446-1450.
12. Rose G: Rose's Strategy of Preventive Medicine. Oxford, U.K., Oxford University Press,
2008.
13. Gordis L: Epidemiology. ed Third Edition, Philadelphia, Elsevier Saunders, 2004.
14. Davis B, Carpenter C: Proximity of fast-food restaurants to schools and adolescent
obesity. Am J Public Health 2009;99:505-510.
15. Laska MN, Hearst MO, Forsyth A, Pasch KE, Lytle L: Neighbourhood food
environments: are they associated with adolescent dietary intake, food purchases and
weight status? Public Health Nutr 2010;13:1757-1763.
16. Leung CW, Laraia BA, Kelly M, Nickleach D, Adler NE, Kushi LH, Yen IH: The
influence of neighborhood food stores on change in young girls' body mass index. Am J
Prev Med 2011;41:43-51.
17. Ewing R, Brownson RC, Berrigan D: Relationship between urban sprawl and weight of
United States youth. Am J Prev Med 2006;31:464-474.
18. Slater SJ, Ewing R, Powell LM, Chaloupka FJ, Johnston LD, O'Malley PM: The
association between community physical activity settings and youth physical activity,
obesity, and body mass index. J Adolesc Health 2010;47:496-503.

9
19. Paquet C, Daniel M, Kestens Y, Leger K, Gauvin L: Field validation of listings of food
stores and commercial physical activity establishments from secondary data. Int J Behav
Nutr Phys Act 2008;5:58.
20. Powell LM, Auld MC, Chaloupka FJ, O'Malley PM, Johnston LD: Associations between
access to food stores and adolescent body mass index. Am J Prev Med 2007;33:S301-
307.
21. Sturm R, Datar A: Body mass index in elementary school children, metropolitan area
food prices and food outlet density. Public Health 2005;119:1059-1068.
22. Leatherdale ST, Pouliou T, Church D, Hobin E: The association between overweight and
opportunity structures in the built environment: a multi-level analysis among elementary
school youth in the PLAY-ON study. Int J Public Health 2011;56:237-246.
23. Jennings A, Welch A, Jones AP, Harrison F, Bentham G, van Sluijs EM, Griffin SJ,
Cassidy A: Local food outlets, weight status, and dietary intake: associations in children
aged 9-10 years. Am J Prev Med 2011;40:405-410.

10
CHAPTER 2: LITERATURE REVIEW
2.1 Overview
The influence of the built environment on the determinants of obesity in young people is
a relatively new area of research. The purpose of this chapter is to explore the literature on the
influence of the built environment on outcomes related to obesity, including physical activity and
eating behaviours. The first section of this chapter will define key concepts that are used
throughout this chapter and the thesis in general. Next, a conceptual model will be presented to
provide an overview of the relationships to be examined. This will be followed by a review of
the literature examining the first theme of this thesis, which investigates the role of the food
retail environment on eating behaviour and obesity in young people, as well as the associated
measurement issues. Following this, the second theme of this thesis will be outlined, which is
related to the components of the built environment that are associated with physical activity and
obesity. The chapter concludes with a brief summary of the key issues regarding the relationship
between the built environment and the behavioural determinants of obesity in young people.
2.2 Definitions
The built environment is defined as the physical environment surrounding homes, schools
and workplaces. The key components of the built environment for this thesis include the food
retail environment, the physical activity environment and urban form. The built environment is
thought to influence our health by encouraging or discouraging healthy lifestyle choices [1,2].
The food retail environment refers to the quantity and types of food retailers available
within a particular geographic area. It includes the following retailers: fast food restaurants,

11
convenience stores, coffee/donut shops, grocery stores, supermarkets, and ethnic/specialty stores.
The food retail environment can influence dietary choices and unhealthy eating behaviours,
which involve the consumption of foods that are high in calories, sugar, salt and fat.
The physical activity environment consists of parks and other green space and
recreational facilities (e.g. gyms, arenas, pools, soccer fields, etc.) that are located within a given
area.
Urban form refers to the layout of the metropolitan areas and consists of many different
components. These include street connectivity, which is a measure of the number of street
intersections within a given area, and is an indicator of the ease of travel between destinations
via road networks [3]. Another component of urban form is land use mix, which refers to the
proportions of land that are zoned for particular purposes, including residential, industrial,
commercial and recreational [3]. Residential density is another component of urban from, and
refers to the number of residential units within a geographic area [4]. Finally, urban sprawl
refers to a pattern of urban development where cities extend over large geographic areas in a
“leap frog” pattern of development [5]. It can make it difficult to travel between destinations
using active transportation. Active transportation refers to the use of non-motorized
transportation (walking, cycling, inline skating) [6].
The term child refers to an individual between the ages of 6 and 11 years and adolescent
refers to an individual aged 12 to 19 years. The terms youth and young people are used
interchangeably in this thesis and refer to children and adolescents, collectively.
Geographic information systems (GIS) refers to the computer-based systems designed to
collect, manipulate and analyze spatial data such as measures of the built environment [7,8].

12
2.3 The Built Environment and Obesity-Related Behaviours in Youth: Overview &
Conceptual Model
Obesity is a complex health issue that is caused by a multitude of factors. Fundamentally,
body fat content is determined by energy balance, which is maintained when energy intake,
obtained through food consumption, is balanced by energy expenditure, which is a function of
resting metabolism and the amount of physical activity a person engages in [9-11]. Thus, eating
behaviours and physical activity are key determinants of obesity. Figure 1 provides a brief
conceptual model of the components of the built environment that are the focus of this thesis and
how they relate to overweight and obesity.
Figure 1. Conceptual model depicting the relationship between features of the built environment
and obesity-related outcomes
Active Transportation
Eating Behaviours
Physical Activity
Overweight & Obesity
Food Environment
Individual & Area Level Covariates
Physical Activity Environment
Urban Form

13
The key components of the built environment are the food retail environment, the
physical activity environment and urban form, which affect eating behaviours and overweight
and obesity. The focus of this thesis is primarily on the more immediate outcomes of eating
behaviours, physical activity and active transportation.
The food retail environment can influence eating behaviour as it determines the
availability of healthy and unhealthy food items within a given geographic location. Since young
people spend a large portion of their day in school, the food retail environment surrounding
schools may be an important determinant of their eating behaviour. Most research on the school
food retail environment has focused directly on sources within the schools (e.g., cafeteria,
vending machines) [12-14]. However, many students are permitted to leave school grounds
during the school day and have access to nearby food retailers. Previous research has
demonstrated that there can be a preponderance of fast food restaurants near schools [15,16], and
these types of food retailers tend to sell food that is high in calories, sugar and fat [17]. Less is
known about the presence of other types of food retailers near schools, such as coffee/donut
shops and convenience stores. However, given the secular increases in the consumption of snack
foods [18] and sugar sweetened beverages by young people [19], having these food retailers in
close proximity to schools may also play an important role in influencing students‟ eating
behaviours.
Features of the built environment can influence physical activity levels in a variety of
ways. Urban form is a component of the built environment that can either facilitate or inhibit
active transportation [20]. Components of urban form that have been associated with active
transportation in young people include street connectivity, land use mix, and residential density
[20]. Having well-connected street networks near the residences of young people has been
14
associated with a greater frequency and duration of walking [21], and similar positive
associations have been found for land use mix and residential density [21]. Urban form primarily
influences physical activity by determining the likelihood of individuals engaging in active
transportation, but there are other features of the built environment that influence physical
activity as well. Urban sprawl is related to urban form, and is an overall measure of how densely
populated and well-connected metropolitan areas are [5]. Individuals living in metropolitan areas
with high levels of urban sprawl may spend more time in motorized transport, which can impact
their physical activity levels [22]. In addition to urban form and urban sprawl, there are other
features of the built environment that influence physical activity as well. For example, having
access to nearby parks has been related to increased physical activity in young people [23], and
similar relationships have been found for other recreational facilities such as fitness facilities, ice
rinks, pools, etc.[24]
There are many features of the built environment that influence eating behaviours and
physical activity among young people, which can then affect the prevalence of overweight and
obesity. Each of these features is outlined in more detail in the following sections of this
literature review. The relationship between the food retail environment and the associated
measurement issues will be outlined in detail in Sections 2.4 and 2.5. Section 2.6 briefly outlines
the role of physical activity environment, which is an important determinant of physical activity
and obesity, but is not a major focus of this thesis. Finally, Section 2.7 reviews the literature that
examines how urban form is related to physical activity and obesity, with a focus on urban
sprawl and active transportation.

15
2.4 The Relationship Between the Food retail environment, Eating Behaviours, and
Obesity in Youth
2.4.1. Relationships Between the Food Retail Environment Surrounding Homes, Eating
Behaviours, and Obesity
Over the past 30 years, the consumption of foods prepared away from home has
increased dramatically. Among 2 to 18 year olds, the proportion of energy obtained from fast
food and other restaurants has tripled [25]. Temporal trends have also shown increased
consumption of sugar sweetened beverages [19] increased and calories obtained from snack
foods [18]. The increased consumption of these foods is cause for concern, since they tend to be
of poor nutritional quality [26,27] and have been associated with adverse health outcomes in
young people, including obesity [28-30] as well as early indicators of cardiovascular disease [31-
33] and type 2 diabetes [33].
There is consistent evidence to support a relationship between the presence of food
retailers surrounding homes and obesity outcomes in youth. In a study of 9 and 10 year olds in
Leeds, UK, Jennings et al. [34] found that youth with fast food restaurants and convenience
stores within 800 m of their homes had higher BMI z-scores (0.49 vs. 0.34) and higher body fat
percentages (31.2% vs. 30.2%) compared to those with no nearby fast food restaurants and
convenience stores. Although these associations are small, it is important to note that this study
only considered the presence or absence of the food retailers and not the specific quantity.
Therefore, stronger associations may have been obscured by not considering the number of food
retailers present. Fraser et al. [35] examined the presence of fast food restaurants in 3 to 14 year
olds living in Leeds, UK. They used the super output area as their geographical unit of analysis,
which is a pre-existing administrative area containing approximately 1,500 to 7,200 people [36].

16
Each additional fast food restaurant per super output area was associated with an increased
likelihood of obesity (OR=1.01, 95% CI: 1.002-1.02). While this odds ratio may seem small, the
confidence interval is quite narrow, which indicates that this effect estimate is precise and not
unduly affected by measurement error. In addition, the odds ratio has been calculated for the
addition of a single food retailer within a potentially large area. Therefore, the relationship would
likely have been stronger if the researchers considered a smaller geographic area. Robust
relationships were found for Californian girls by Leung et al.[37], but only for convenience
stores. Girls (mean age=7.4, SD=0.4) who had at least one convenience store within 400 m of
their homes had a higher relative odds of obesity (OR=3.38, 95% CI: 1.07 - 10.68) compared to
girls with no convenience stores near their homes. The lack of relationships with fast food
restaurants may have been due to a small sample size (N=353).
Some studies have also examined the relationship between the home food retail
environment and eating behaviours in young people. Jennings et al. [34] found that among 9 to
10 year olds in Leeds, UK, those with fast food restaurants and convenience stores within 800 m
of their homes had an 11.8% higher intake of fruit drinks and a 15.3% higher intake of soda
compared to those with neither food retailer present. Skidmore et al. [38] measured the distance
to various food retailers and examined associations with dietary intake in 9 to 10 year olds living
in Norfolk, UK. For each 1 km increase in the distance to the nearest convenience store, there
was a decrease in the consumption of potato chips (-0.16 servings/week, 95% CI: -0.06 to -0.25),
french fries (-0.09 servings/week, 95% CI: -0.03 to -0.16), chocolate (-0.09 servings/week,
95% CI: -0.01 to -0.20) and white bread (-0.19 servings/week, 95% CI: -0.07 to -0.30). Similar
relationships were found for fast food restaurants. When considering the number of food retailers
within 800 m of participants‟ homes, findings were not as robust. Each additional convenience

17
store per km2 was associated with a 0.25 (95% CI: 0.05 to 0.45) increase in fruit juice servings
per week. No associations were found for fast food restaurants. It is important to note that the
dietary intake measures did not consider where food was obtained (e.g. at school, at home or
elsewhere), and this may have weakened the relationships between the home food retail
environment and dietary behaviours.
The above studies indicate that there is evidence to support a relationship between the
presence of fast food restaurants and convenience stores and indicators of obesity. Few studies
have incorporated eating behaviours as an outcome of interest, but there appears to be a modest
relationship between availability of food retailers near homes and eating behaviours. However,
since many young people spend a notable proportion of their day elsewhere, the examination of
other food retail environments, such as the school food retail environment, is warranted.
2.4.2 Relationships Between the Food Retail Environment Surrounding Schools and Obesity
Evidence suggests a relationship between the presence of various food retailers near
schools and obesity-related outcomes in young people. For example, in a large national study of
8th
and 10th
grade students in the U.S., Powell et al. [39] found that each additional convenience
store per 10,000 people within school ZIP codes was associated with a 0.03 unit increase in body
mass index (BMI) and a 0.2% increase in the prevalence of obesity. Although these relationships
appear to be relatively weak, the addition of a single convenience store per 10,000 people may
cover a large geographic area. Davis and Carpenter [40] examined the association between the
presence of chain fast food retailers near schools and overweight and obesity in 7th
to 12th
grade
students in California. Compared to students with no nearby fast food restaurants, those who had
one or more chain fast food restaurants within 800 m of their school had a greater relative odds
18
of overweight (OR=1.06, 95% CI: 1.02-1.10) and obesity (OR=1.07, 95% CI: 1.02-1.12). Not all
studies were able to find a relationship. In a study of 5th
to 8th
grade students in Ontario,
Leatherdale et al. [41] found no relationships between obesity and the presence of a variety of
food retailers, including gas stations, fast food restaurants and bakeries/doughnut shops.
Although there were a large number of students included in the study (n=2,449), there were only
30 schools, which may have been inadequate to detect associations.
One of the limitations of the above studies is that they considered measures of
overweight and obesity as their primary outcomes. Obesity is a complex health problem, and it
may also be influenced by factors within the home environment as well other environments, in
addition to individual-level characteristics such as age, sex and socioeconomic status [42-45].
Therefore, it is difficult to solely attribute the higher prevalence of obesity with the presence of
food retailers near schools when factors within the home environment have not been considered.
In addition, features within the built environment that promote physical activity, such as the
availability of parks and recreational facilities and having well-connected streets may also
influence obesity levels. These features of the built environment will be expanded upon in
Sections 2.6 and 2.7. However, this highlights the difficulty in attributing differences in the
prevalence of obesity solely to the food retail environment, while other features of the built
environment may also have an important role. To avoid this issue, studies of the food retail
environment should also consider the more direct relationships between the food retail
environment and eating behaviours. Finally, previous studies have often quantified the effects of
the food retail environment for large geographic areas [38,39], and this may result in the
magnitude of the effects appearing trivial when in reality, their influence may be important on a
smaller scale.

19
2.4.3 Relationships Between the Food Retail Environment Surrounding Schools and Eating
Behaviours
Recently, researchers have begun to include dietary outcomes in their analysis of the food
retail environment in young people. In addition to obesity, Davis and Carpenter [40] also
examined the association between the presence of chain fast food retailers near schools and
eating behaviours. Dietary intake was obtained by a 24 hour dietary recall and the outcomes of
interest included the consumption of vegetables, fruits, juice, soda and french fries. They found
that the presence of fast food restaurants within 800 m of schools was marginally associated with
soda consumption (OR=1.05, 95% CI: 1.00-1.11), but no notable associations were found with
other food items. Laska et al. [46] also examined the relationship between the food retail
environment surrounding schools and sugar sweetened beverage intake in 10 to 17 year olds
living in Minneapolis-St. Paul, Minnesota. They were unable to find a relationship between sugar
sweetened beverage intake and the availability of fast-food restaurants, convenience stores and
other food retailers near schools. Finally, a study of the school food retail environment by van
der Horst et al. [47] found that small food stores (convenience stores, small grocery stores, and
ethnic food stores) were associated with decreased soft drink consumption, and no associations
were found for snack food intake.
Based on these studies of the school food retail environment, it appears that there is no
relationship with the eating behaviours in students. However, there is a key methodological
limitation in the outcome measures used in the existing studies. All of the studies used general
dietary intake questions, such as 24 hour dietary recalls [40] or questions about the typical
consumption of certain food items within the past week or month [46,47]. These questions
cannot decipher whether the foods of interest were eaten at home, at school, or elsewhere. This

20
highlights the need for context-specific eating behaviour questions that assess where and when
food is eaten. By not accounting for this, the previous studies of the school food retail
environment may be susceptible to error introduced by misclassification, which may partly
explain the absence of relationships with the food retail environment.
2.5 Methodological Limitations of GIS-Based Measures of the Food Retail Environment
2.5.1 Secondary Sources of Food Retailer Locations
Large scale studies that examine the food retail environment need to rely on secondary
sources of information for food retailer locations due to feasibility issues associated with the
direct measurement (e.g., physical audit) of the food retail environment. Audits of the food retail
environment are carried out by confirming whether food retailers are present or absent within a
given geographical location [48,49]. More detailed validation studies involve recording the
location of food retailers using a hand-held Global Positioning Systems (GPS) device [50]. Using
the GPS device, the location of each food retailer is obtained by recording its longitude and
latitude coordinates. The coordinates can then be uploaded into mapping software, and the GPS-
derived coordinates can be compared to the street address given by the food retailer databases.
Studies of the food retail environment typically rely on three types of geographic information
systems (GIS) databases: online databases (e.g. Yellow Pages) [51,52], commercial food retailer
databases [48,50], or listings of food retailers provided by the health departments of local
governments [49,53].
To date, six studies have examined the accuracy of the information on food retailer
locations provided by GIS databases [49-54]. With the exception of the field validation study by
Liese et al. [50], existing studies took place in a single city [48,49,51-53] and recorded the food

21
retailers as present or absent. The proportion of GIS-listed food retailers that were located in the
field ranged from 60% [52] to 88% [53]. Although this gives an indication of how many of the
listed food retailers exist within a given area, there is no indication of the positional accuracy of
the x,y coordinate location for the food retailers. In other words, information on the distance
between where the food retailers are truly located and where the GIS database suggests they are
located is also important. Furthermore, only one study using multiple food retailer databases
(e.g. online, commercial or government sources) compared the accuracy between different types
of GIS databases [52]. Other limitations of current food retailer validation studies include a small
sample size (n<200) [52] and the lack of differentiation between various food retailer types [51-
53].
2.5.2 Methods Used to Capture Food Retailers Surrounding Schools
Research on the food retail environment is relatively new, with the earliest studies in
youth published in 2004 [55]. Recent reviews have outlined the need to apply consistent
measures of the food retail environment across studies in order to increase comparability [56,57].
This includes the consideration of the size and shape of the area of geographic boundary used to
capture the food retail environment. Early studies of the food retail environment tended to use
pre-existing boundaries such as ZIP codes to define the boundaries for the food retail
environment [39,58]. The limitation of pre-existing boundaries is that they were designed for
administrative purposes and may not be consistent in size. The use of GIS software has
addressed this limitation by allowing researchers to define their own food retail environment
boundaries, but this has resulted in the emergence of a variety of measurement issues.

22
There are two common methods employed by GIS software to define the shape of the
geographic area used to capture food retailers. The simpler method is to use circular buffers,
which measure the Euclidean straight line distance (also referred to “as the crow flies”) from a
point of interest to create a circular buffer. The advantage of this method is that it is easy to carry
out and requires less time and expertise in using GIS software. However, it does not account for
barriers such as bridges, waterways, major highways, or disconnected road networks. In order to
address this limitation, road network buffers have been used as an alternative method to capture
food retailers. Road network buffers are created by following roads extending outwards from a
location of interest for a certain distance. Lines are then drawn to connect the endpoints of the
road networks, creating an irregular shaped buffer surrounding the point of interest. Road
network buffers capture what is actually accessible to a person when using the roads to travel to
and from food retailers.
Figure 2 on the next page contrasts a 1 km circular and a 1 km road network buffer
around a school. It is apparent that the two buffers can be quite dissimilar in size and capture
different numbers of food retailers despite using the same distance to create the buffer.
Theoretically, road network buffers would provide a better measure of the food retail
environment than circular buffers. However, there have been no direct comparisons between the
food retailers measured using these different buffer types and there is a need to define the
optimal method of capturing food retailers in order to standardize these measurement methods
across studies.

23
Figure 2 A comparison of a 1 km circular buffer and a 1 km road network buffer to measure
access to food retailers. The road network buffer is represented by the white area and the circular
buffer encompasses both the white and gray areas. The food retailers are represented by the black
circles
In addition to the shape of buffers used to capture the food retail environment, there are
notable variations in the size of buffers employed in studies of the food retail environment. Most
have used two approaches to this issue: either using multiple buffer sizes [40,46] or by choosing
one buffer size based on estimates of reasonable walking time [41,47]. Food retail environments
have been measured with buffers ranging from 400 m [37] to 5000 m [59] in size. Researchers
have identified the need to standardize buffer sizes [56,57]. The wide variation in buffer size
makes it difficult to make comparisons across studies, and studies using buffers that are too large
or too small may not capture associations that exist. Furthermore, it is possible that the relevant
buffer size of the food retail environment may differ depending on the setting. For youth it may
24
be different for their home versus their school. This remains a relatively unexplored
measurement issue for the food retail environment and research is needed to examine the
relevant size of the food retail environment, both at home and at school.
There is some variation in how access to food retailers is measured. Some studies
measured the number of food retailers within a given area (also referred to as the density of food
retailers) [34,37,41], while others have also considered the distance to the nearest food retailer
[35,38,46,60]. In general, the density measure has shown more consistent relationships with
eating habits and obesity outcomes [35,40,46,60]. An exception was the study by Skidmore et al.
[38], which found more associations when assessing the distance to the nearest food retailer.
However, some distance-based relationships were inconsistent. For example, Skidmore et al.
[38] found that having grocery stores further away from young peoples‟ homes, indicating
decreased access, was associated with healthy eating behaviours, while an increased density of
grocery stores was also associated with healthy eating behaviours. A similar pattern was found
for grocery stores and vegetable consumption by Timperio et al. [60]. Given the stronger and
more consistent findings with the density measures, it is more commonly used in studies of the
food retail environment.
2.6 The Physical Activity Environment and Physical Activity-Related Outcomes in Youth
The built environment has many components that provide opportunities for physical
activity among youth. One component is facilities that allow for physical activity, including
parks and recreational facilities. For example, 12 to 17 year olds living in urban areas who had
access to a park were more likely to participate in moderate- to-vigorous physical activity
(MVPA), (RR=1.10, 95% CI 1.01-1.17) compared to those who did not have access to a park

25
[23]. Although the magnitude of this relationship is relatively small, it is important to consider
that access to parks was obtained through self-report, and the strength of the relationship may be
diminished by inaccurate recollection of the presence of parks.
The relationship between the presence of recreational facilities and physical activity
showed a dose-response pattern, whereby increases in the number of facilities were accompanied
by increases in physical activity levels. Powell et al. [24] examined a wide variety of recreational
facilities (e.g. fitness facilities, ice rinks, swimming pools, etc.) near residences and self-reported
physical activity in a large sample of U.S. adolescents in the 8th
, 10th
and 12th
grades. Each
additional facility per 10,000 people was associated with a 0.23% increase in MVPA. Although
the magnitude of this relationship appears to be quite small, the findings apply to a large number
of people. On a smaller scale, it is likely that the addition of a single recreational facility would
result in a stronger relationship.
A dose-response pattern was particularly evident in older students, whereby an increase
in the number of facilities from 1 to 8 resulted in a 6.4% and a 9.0% increase in vigorous
physical activity in males and females, respectively. Gordon-Larsen et al. [61] found a similar
dose-response relationship for MVPA in youth in grades 7 to 12 in the U.S. Youth with 1
physical activity facility near their homes had a greater relative odds of engaging in ≥5 bouts of
MVPA per week (OR=1.03, 95% CI: 1.01-1.06) and the relative odds increased for 7 nearby
facilities (OR=1.26, 95% CI: 1.06-1.50) compared to those with no nearby facilities. This
relationship was confirmed in students in the 7th
and 8th
grades living in London Ontario [62].
Students with at least 2 recreational facilities within 1.6 km of schools were more likely to be in
the upper quartile for physical activity (OR=1.65, 95% CI: 1.09-2.50) compared to those with
access to fewer than 2 recreational facilities.

26
Despite the fact that young people may have access to recreational facilities near their
homes, perceived safety is an important factor that influences whether they utilize them. Utter et
al. [63] examined the relationship between the presence of parks and recreational facilities and
vigorous physical activity among 13 to 17 year olds in New Zealand. They found that those who
perceived their neighbourhoods as safe were also more likely to engage in vigorous physical
activity (OR=1.46, 95% CI: 1.30-1.60) compared to youth who did not. Although Nichol et al.
[64] did not find a relationship between access to parks and recreational facilities and physical
activity in 11 to 15 year old Canadian youth, they found that perceptions of being safe lead to a
and increased likelihood of being physically active. Males and females who had the highest
perception of safety were 1.31 (95% CI: 1.17-1.45) and 1.45 (95% CI: 1.26-1.65) times more
likely to participate in physical activity compared to those with the lowest perceived safety.
There are many limitations to the studies that have examined physical activity amenities
and MVPA in youth. Similar to the food retail environment, there are a variety of distances used
when measuring physical activity amenities. Distances ranged from the length of one side of a
residential block [65] to a 3 km buffer [66]. Some studies used a sensitivity analysis approach
with 2 or 3 options [67,68], and one study by Boone-Heinonen [69] took a more systematic
approach using 4 distances (1 km, 3 km, 5 km and 8 km) to measure associations between access
to recreational facilities and MVPA in a large sample of U.S. students in grades 7 to 12. The
analysis was simultaneously stratified by sex and 3 urban-rural categories, which made it
difficult to provide an overall recommendation for researchers. However, for recreational
facilities, there appeared to be relatively consistent associations between access to recreational
facilities within 1 and 3 km of respondents‟ homes and MVPA. Additional limitations of current
studies include small sample sizes (n<100) [70] and limited geographic scope [62,71]. For

27
example, of three studies examining access to parks and recreational facilities and their
relationship with physical activity outcomes in Canadian youth, only one examined the
relationship on a national scale [72], while the other two took place within a single city [62,71].
2.7 The Relationship Between Components of Urban Form and Physical Activity
2.7.1 Components of Urban Form and Physical Activity in Youth
There are many components of urban form that influence the physical activity of adults,
including street connectivity, residential density and land use mix. These urban form components
have been associated with the frequency of walking among young people. For example, Frank et
al. [21] found that 12 to 15 year olds were more likely to walk at least 800 m per day if they
lived in areas with the highest tertile of street connectivity (OR=2.4, 95% CI:1.1-5.1) and
population density (OR=4.9, 95% CI: 2.1-11.4) compared to those living in the areas in the
lowest tertiles. They also found that higher land use mix was associated with walking, whereby
youth living in areas with the highest tertile of land use mix more were likely to walk at least 800
m per day (OR=2.7, 95% CI: 1.4-5.3) compared to those living with no mixture of land uses.
Associations of a similar magnitude were also found in the 16 to 19 year olds, although land use
mix was no longer found to be statistically significant. These relationships were confirmed in a
study by Kerr et al. [73], who incorporated various features of urban form into a walkability
measure. This measure included residential density, retail floor area (an indicator of pedestrian-
friendly commercial areas), intersection density and land use mix. Youth aged 4 to 18 years
living in high walkability areas were more likely to walk to school (OR=2.1, 95% CI: 1.1-4.0),
but only for those living in high-income neighbourhoods.
28
Some studies have found that features of urban form that positively influence physical
activity in adults have the opposite relationship in youth. Mecredy et al. [74] examined the
relationship between street connectivity (a positive correlate of physical activity in adults) and
physical activity outside school hours in a large sample of Canadian youth. Compared to those
living in areas with the highest quartile of street connectivity, those in second (RR= 1.22, 95%
CI: 1.10-1.35), third (RR=1.25, 95% CI: 1.13-1.37), and fourth (RR=1.21, 95% CI: 1.09-1.34)
quartiles were more likely to be physically active. A possible reason for the opposite relationship
with street connectivity compared to adults is that adults accumulate most of their physical
activity through walking while young people accumulate most of their activity through play and
sport. Thus, quiet residential streets that are not well connected may provide a playground for
young people to be active. For example, Veitch et al. [75] found that 8 and 9 year old children
who lived on cul-de-sacs were considerably more likely to play in the street on weekdays
(OR=3.99, 95% CI: 1.65-9.66) and weekends (OR=3.49, 95% CI: 1.49-8.16) compared to those
who did not live on cul-de-sacs. Furthermore, parental perceptions of traffic safety have been
associated with active transportation. Among 10 to 12 year olds living in Melbourne, Australia,
parental perceptions of a lack of pedestrian crossings or traffic lights was associated with a
decreased likelihood of cycling or walking to school (OR=0.6, 95% CI: 0.3-0.9) [76]. Therefore,
it appears that there may be features of urban form which may influence physical activity
differently in young people, with safety a salient concern among their parents.
Overall, relationships between components of urban form, physical activity and active
transportation in young people appear to be more complex and less well-understood than in
adults. Variations in traffic safety across studies may account for part of this relationship, but
further research is needed to clarify these mechanisms.

29
2.7.2 Urban Sprawl, Physical Activity, and Obesity in Young People
In adults, higher levels of urban sprawl contribute to greater levels of obesity through the
increased reliance on cars and time spent commuting [22]. That is, adults living in cities with
greater levels of urban sprawl are less likely to engage in active transportation [77] and may have
less free time to engage in other forms of physical activity because of the amount of time they
spend driving [78]. A key difference between the urban sprawl studies in adults versus young
people may relate to the role of car use. Relationships in older adolescents may be similar to
those in adults, with both groups potentially having access to a vehicle. A study by Trowbridge
et al. [79] supported this notion, whereby youth aged 16 to 19 years who lived in sprawling
counties were more than twice as likely to drive >32 km per day compared to youth who lived in
compact counties. However, the role of driving age is not well understood in younger
adolescents who may not yet have a driver‟s licence. Therefore, there is a need to explore the
relationship between urban sprawl and active modes of transportation, while considering driving
age.
There are two studies in young people which provide evidence supporting similar
relationships to those found in adults. Ewing et al. [80] examined the relationship between urban
sprawl and obesity in 12 to 16 year olds living in the U.S. They found a positive relationship,
whereby those who lived in a county 1 standard deviation below the mean in the urban
compactness score (greater urban sprawl) had a higher relative odds of overweight and obesity
(OR= 1.16, 95% CI: 1.02-1.31) compared to those who lived in a county with an urban
compactness score 1 standard deviation above the mean (less urban sprawl). Analysis of
longitudinal data also showed a positive relationship between increased urban sprawl and
overweight and obesity, although the relationship did not reach statistical significance (p ≤ 0.05),
30
likely due to a small sample size. Similarly, in a group of 8th
and 10th
grade students, Slater et al.
[81] found that a 1 standard deviation increase in their urban compactness scale, indicating less
urban sprawl, was associated with an 11.8% decrease in the prevalence of obesity, but no
association was found with MVPA.
Further examination of the relationship between urban sprawl and physical activity in
young people is needed, with the inclusion of active transportation as a key outcome variable.
Active transportation may have an important role, since young people who do not have a driver‟s
license may be more reliant on non-motorized modes of transportation such as walking or
cycling. Furthermore, existing studies on urban sprawl, physical activity and obesity in young
people have taken place in the U.S., and there is a need to examine these relationships within
more geographically diverse populations, including Canada.
2.8 Summary
In light of the increasing prevalence of obesity among young people and the lack of
notable success of interventions focusing on solely individual behaviours, there has been an
increased focus on the broader contextual determinants of obesity and its related behaviours.
Because of the increase in consumption of food prepared away from home among young people,
there is an interest in the relationship between the food retail environment and obesity-related
outcomes. However, there are many methodological issues that must be addressed regarding the
measurement of the food retail environment and its association with dietary outcomes. In
addition to the food retail environment, the physical activity environment and urban form also
influence obesity-related behaviours in young people. There remain large gaps in knowledge

31
regarding the built environment and its influence on the determinants of obesity in Canadian
youth, some of which will be addressed by the manuscripts included in this thesis.

32
2.9 References
1. Booth KM, Pinkston MM, Poston WS: Obesity and the built environment. J Am Diet
Assoc 2005;105:S110-117.
2. Papas MA, Alberg AJ, Ewing R, Helzlsouer KJ, Gary TL, Klassen AC: The built
environment and obesity. Epidemiol Rev 2007;29:129-143.
3. Handy SL, Boarnet MG, Ewing R, Killingsworth RE: How the built environment affects
physical activity: views from urban planning. Am J Prev Med 2002;23:64-73.
4. Frank LD, Pivo G: Impacts of mixed use and density on utilization of three modes of
travel: Single-occupant vehicle, transit, and walking. Transport Res Rec 1994;1466:44-
52.
5. Frumkin H, Frank L, Jackson R: Urban Sprawl and Public Health. Washington, DC,
Island Press, 2004.
6. Saelens BE, Sallis JF, Frank LD: Environmental correlates of walking and cycling:
findings from the transportation, urban design, and planning literatures. Ann Behav Med
2003;25:80-91.
7. Lo CP, Yeung A: Concepts and Techniques of Geographic Information Systems. Upper
Saddle River, NJ, Prentice Hall, 2006.
8. Wang F: Quantitative Methods and Applications in GIS. Boca Raton, FL, Taylor &
Francis, 2006.
9. Martinez JA: Body-weight regulation: causes of obesity. Proc Nutr Soc 2000;59:337-345.
10. Friedman JM: Obesity in the new millennium. Nature 2000;404:632-634.
11. Hill JO, Melanson EL: Overview of the determinants of overweight and obesity: current
evidence and research issues. Med Sci Sports Exerc 1999;31:S515-521.

33
12. Kubik MY, Lytle LA, Hannan PJ, Perry CL, Story M: The association of the school food
environment with dietary behaviors of young adolescents. Am J Public Health
2003;93:1168-1173.
13. Park S, Sappenfield WM, Huang Y, Sherry B, Bensyl DM: The impact of the availability
of school vending machines on eating behavior during lunch: the Youth Physical Activity
and Nutrition Survey. J Am Diet Assoc 2010;110:1532-1536.
14. Briefel RR, Crepinsek MK, Cabili C, Wilson A, Gleason PM: School food environments
and practices affect dietary behaviors of US public school children. J Am Diet Assoc
2009;109:S91-107.
15. Day PL, Pearce J: Obesity-promoting food environments and the spatial clustering of
food outlets around schools. Am J Prev Med 2011;40:113-121.
16. Austin SB, Melly SJ, Sanchez BN, Patel A, Buka S, Gortmaker SL: Clustering of fast-
food restaurants around schools: a novel application of spatial statistics to the study of
food environments. Am J Public Health 2005;95:1575-1581.
17. Bowman SA, Gortmaker SL, Ebbeling CB, Pereira MA, Ludwig DS: Effects of fast-food
consumption on energy intake and diet quality among children in a national household
survey. Pediatrics 2004;113:112-118.
18. Piernas C, Popkin BM: Trends in snacking among U.S. children. Health Aff (Millwood)
2010;29:398-404.
19. Wang YC, Bleich SN, Gortmaker SL: Increasing caloric contribution from sugar-
sweetened beverages and 100% fruit juices among US children and adolescents, 1988-
2004. Pediatrics 2008;121:e1604-1614.

34
20. van Loon J, Frank L: Urban form relationships with youth physical activity: implications
for research and practice. J Plan Lit 2011;26:280-308.
21. Frank L, Kerr J, Chapman J, Sallis J: Urban form relationships with walk trip frequency
and distance among youth. Am J Health Promot 2007;21:305-311.
22. Frank LD, Andresen MA, Schmid TL: Obesity relationships with community design,
physical activity, and time spent in cars. Am J Prev Med 2004;27:87-96.
23. Babey SH, Hastert TA, Yu H, Brown ER: Physical activity among adolescents. When do
parks matter? Am J Prev Med 2008;34:345-348.
24. Powell LM, Chaloupka FJ, Slater SJ, Johnston LD, O'Malley PM: The availability of
local-area commercial physical activity-related facilities and physical activity among
adolescents. Am J Prev Med 2007;33:S292-300.
25. Nielsen SJ, Siega-Riz AM, Popkin BM: Trends in food locations and sources among
adolescents and young adults. Prev Med 2002;35:107-113.
26. Paeratakul S, Ferdinand DP, Champagne CM, Ryan DH, Bray GA: Fast-food
consumption among US adults and children: dietary and nutrient intake profile. J Am
Diet Assoc 2003;103:1332-1338.
27. French SA, Story M, Neumark-Sztainer D, Fulkerson JA, Hannan P: Fast food restaurant
use among adolescents: associations with nutrient intake, food choices and behavioral
and psychosocial variables. Int J Obes Relat Metab Disord 2001;25:1823-1833.
28. Berkey CS, Rockett HR, Field AE, Gillman MW, Colditz GA: Sugar-added beverages
and adolescent weight change. Obes Res 2004;12:778-788.
35
29. Bradlee ML, Singer MR, Qureshi MM, Moore LL: Food group intake and central obesity
among children and adolescents in the Third National Health and Nutrition Examination
Survey (NHANES III). Public Health Nutr 2010;13:797-805.
30. Taveras EM, Berkey CS, Rifas-Shiman SL, Ludwig DS, Rockett HR, Field AE, Colditz
GA, Gillman MW: Association of consumption of fried food away from home with body
mass index and diet quality in older children and adolescents. Pediatrics 2005;116:e518-
524.
31. Holt EM, Steffen LM, Moran A, Basu S, Steinberger J, Ross JA, Hong CP, Sinaiko AR:
Fruit and vegetable consumption and its relation to markers of inflammation and
oxidative stress in adolescents. J Am Diet Assoc 2009;109:414-421.
32. McNaughton SA, Ball K, Mishra GD, Crawford DA: Dietary patterns of adolescents and
risk of obesity and hypertension. J Nutr 2008;138:364-370.
33. Lindquist CH, Gower BA, Goran MI: Role of dietary factors in ethnic differences in early
risk of cardiovascular disease and type 2 diabetes. Am J Clin Nutr 2000;71:725-732.
34. Jennings A, Welch A, Jones AP, Harrison F, Bentham G, van Sluijs EM, Griffin SJ,
Cassidy A: Local food outlets, weight status, and dietary intake: associations in children
aged 9-10 years. Am J Prev Med 2011;40:405-410.
35. Fraser LK, Edwards KL: The association between the geography of fast food outlets and
childhood obesity rates in Leeds, UK. Health Place 2010;16:1124-1128.
36. Office for National Statistics. Neighbourhood Output Areas Explained: Super Output
Areas. http://www.neighbourhood.statistics.gov.uk/dissemination. Accessed Oct 2011.
36
37. Leung CW, Laraia BA, Kelly M, Nickleach D, Adler NE, Kushi LH, Yen IH: The
influence of neighborhood food stores on change in young girls' body mass index. Am J
Prev Med 2011;41:43-51.
38. Skidmore P, Welch A, van Sluijs E, Jones A, Harvey I, Harrison F, Griffin S, Cassidy A:
Impact of neighbourhood food environment on food consumption in children aged 9-10
years in the UK SPEEDY (Sport, Physical Activity and Eating behaviour: Environmental
Determinants in Young people) study. Public Health Nutr 2009;13:1022-1030.
39. Powell LM, Auld MC, Chaloupka FJ, O'Malley PM, Johnston LD: Associations between
access to food stores and adolescent body mass index. Am J Prev Med 2007;33:S301-
307.
40. Davis B, Carpenter C: Proximity of fast-food restaurants to schools and adolescent
obesity. Am J Public Health 2009;99:505-510.
41. Leatherdale ST, Pouliou T, Church D, Hobin E: The association between overweight and
opportunity structures in the built environment: a multi-level analysis among elementary
school youth in the PLAY-ON study. Int J Public Health 2011;56:237-246.
42. Janssen I, Katzmarzyk PT, Boyce WF, King MA, Pickett W: Overweight and obesity in
Canadian adolescents and their associations with dietary habits and physical activity
patterns. J Adolesc Health 2004;35:360-367.
43. Wang Y, Beydoun MA: The obesity epidemic in the United States--gender, age,
socioeconomic, racial/ethnic, and geographic characteristics: a systematic review and
meta-regression analysis. Epidemiol Rev 2007;29:6-28.
44. Ogden CL, Carroll MD, Curtin LR, McDowell MA, Tabak CJ, Flegal KM: Prevalence of
overweight and obesity in the United States, 1999-2004. JAMA 2006;295:1549-1555.

37
45. Troiano RP, Flegal KM: Overweight children and adolescents: description,
epidemiology, and demographics. Pediatrics 1998;101:497-504.
46. Laska MN, Hearst MO, Forsyth A, Pasch KE, Lytle L: Neighbourhood food
environments: are they associated with adolescent dietary intake, food purchases and
weight status? Public Health Nutr 2010;13:1757-1763.
47. van der Horst K, Timperio A, Crawford D, Roberts R, Brug J, Oenema A: The school
food environment associations with adolescent soft drink and snack consumption. Am J
Prev Med 2008;35:217-223.
48. Bader MD, Ailshire JA, Morenoff JD, House JS: Measurement of the local food
environment: a comparison of existing data sources. Am J Epidemiol 2010;171:609-617.
49. Hosler AS, Dharssi A: Identifying retail food stores to evaluate the food environment.
Am J Prev Med 2010;39:41-44.
50. Liese AD, Colabianchi N, Lamichhane AP, Barnes TL, Hibbert JD, Porter DE, Nichols
MD, Lawson AB: Validation of 3 food outlet databases: completeness and geospatial
accuracy in rural and urban food environments. Am J Epidemiol 2010;172:1324-1333.
51. Lake AA, Burgoine T, Greenhalgh F, Stamp E, Tyrrell R: The foodscape: classification
and field validation of secondary data sources. Health Place 2010;16:666-673.
52. Paquet C, Daniel M, Kestens Y, Leger K, Gauvin L: Field validation of listings of food
stores and commercial physical activity establishments from secondary data. Int J Behav
Nutr Phys Act 2008;5:58.
53. Cummins S, Macintyre S: Are secondary data sources on the neighbourhood food
environment accurate? Case-study in Glasgow, UK. Prev Med 2009;49:527-528.

38
54. Bader MD, Ailshire JA, Morenoff JD, House JS: Measurement of the local food
environment: a comparison of existing data sources. Am J Epidemiol;171:609-617.
55. Burdette HL, Whitaker RC: Neighborhood playgrounds, fast food restaurants, and crime:
relationships to overweight in low-income preschool children. Prev Med 2004;38:57-63.
56. Casey R, Oppert JM, Weber C, Charreire H, Badariotti D, Banos A, Fischler C,
Giacoman Hernandez C, Chaix B, Simon C: Determinants of childhood obesity: What
can we learn from built environment studies? . Food Qual Prefer. In Press.
57. Fleischhacker SE, Evenson KR, Rodriguez DA, Ammerman AS: A systematic review of
fast food access studies. Obes Rev 2011;12:e460-471.
58. Sturm R, Datar A: Body mass index in elementary school children, metropolitan area
food prices and food outlet density. Public Health 2005;119:1059-1068.
59. Seliske LM, Pickett W, Boyce WF, Janssen I: Association between the food retail
environment surrounding schools and overweight in Canadian youth. Public Health Nutr
2009;12:1384-1391.
60. Timperio A, Ball K, Roberts R, Campbell K, Andrianopoulos N, Crawford D: Children's
fruit and vegetable intake: associations with the neighbourhood food environment. Prev
Med 2008;46:331-335.
61. Gordon-Larsen P, Nelson MC, Page P, Popkin BM: Inequality in the built environment
underlies key health disparities in physical activity and obesity. Pediatrics 2006;117:417-
424.
62. Tucker P, Irwin JD, Gilliland J, He M, Larsen K, Hess P: Environmental influences on
physical activity levels in youth. Health Place 2009;15:357-363.

39
63. Utter J, Denny S, Robinson EM, Ameratunga S, Watson P: Perceived access to
community facilities, social motivation, and physical activity among New Zealand youth.
J Adolesc Health 2006;39:770-773.
64. Nichol M, Janssen I, Pickett W: Associations between neighborhood safety, availability
of recreational facilities, and adolescent physical activity among Canadian youth. J Phys
Act Health;7:442-450.
65. Franzini L, Elliott MN, Cuccaro P, Schuster M, Gilliland MJ, Grunbaum JA, Franklin F,
Tortolero SR: Influences of physical and social neighborhood environments on children's
physical activity and obesity. Am J Public Health 2009;99:271-278.
66. Nelson MC, Gordon-Larsen P, Song Y, Popkin BM: Built and social environments
associations with adolescent overweight and activity. Am J Prev Med 2006;31:109-117.
67. Kligerman M, Sallis JF, Ryan S, Frank LD, Nader PR: Association of neighborhood
design and recreation environment variables with physical activity and body mass index
in adolescents. Am J Health Promot 2007;21:274-277.
68. Dowda M, Dishman RK, Porter D, Saunders RP, Pate RR: Commercial facilities, social
cognitive variables, and physical activity of 12th grade girls. Ann Behav Med
2009;37:77-87.
69. Boone-Heinonen J, Popkin BM, Song Y, Gordon-Larsen P: What neighborhood area
captures built environment features related to adolescent physical activity? Health Place
2010;16:1280-1286.
70. Grow HM, Saelens BE, Kerr J, Durant NH, Norman GJ, Sallis JF: Where are youth
active? Roles of proximity, active transport, and built environment. Med Sci Sports Exerc
2008;40:2071-2079.

40
71. Potwarka LR, Kaczynski AT, Flack AL: Places to play: association of park space and
facilities with healthy weight status among children. J Community Health 2008;33:344-
350.
72. Nichol M, Janssen I, Pickett W: Associations between neighborhood safety, availability
of recreational facilities, and adolescent physical activity among Canadian youth. J Phys
Act Health 2010;7:442-450.
73. Kerr J, Rosenberg D, Sallis JF, Saelens BE, Frank LD, Conway TL: Active commuting to
school: Associations with environment and parental concerns. Med Sci Sports Exerc
2006;38:787-794.
74. Mecredy G, Pickett W, Janssen I: Street connectivity is negatively associated with
physical activity in Canadian youth International Journal of Environmental Research and
Public Health 2011;8.
75. Veitch J, Salmon J, Ball K: Individual, social and physical environmental correlates of
children's active free-play: a cross-sectional study. Int J Behav Nutr Phys Act 2006;7:11.
76. Timperio A, Ball K, Salmon J, Roberts R, Giles-Corti B, Simmons D, Baur LA,
Crawford D: Personal, family, social, and environmental correlates of active commuting
to school. Am J Prev Med 2006;30:45-51.
77. Ewing R, Schmid T, Killingsworth R, Zlot A, Raudenbush S: Relationship between urban
sprawl and physical activity, obesity, and morbidity. Am J Health Promot 2003;18:47-57.
78. Lopez-Zetina J, Lee H, Friis R: The link between obesity and the built environment.
Evidence from an ecological analysis of obesity and vehicle miles of travel in California.
Health Place 2006;12:656-664.

41
79. Trowbridge MJ, McDonald NC: Urban sprawl and miles driven daily by teenagers in the
United States. Am J Prev Med 2008;34:202-206.
80. Ewing R, Brownson RC, Berrigan D: Relationship between urban sprawl and weight of
United States youth. Am J Prev Med 2006;31:464-474.
81. Slater SJ, Ewing R, Powell LM, Chaloupka FJ, Johnston LD, O'Malley PM: The
association between community physical activity settings and youth physical activity,
obesity, and body mass index. J Adolesc Health 2010;47:496-503.
42
CHAPTER 3
Field validation of Food Retailer Listings: A Comparison of Online and Commercial
Geographic Information Systems Databases

43
ABSTRACT
Background: Many studies examining the retail food environment rely on geographic
information system (GIS) databases for location information. The purpose of this study was to
validate information provided by two GIS databases, comparing positional accuracy of different
food retailer types.
Methods: The location of food retailers within a 1 km circular buffer surrounding 34 schools in
Ontario, Canada were measured from online and commercial GIS databases. Actual locations
were obtained using a global positioning system (GPS) device. Distances between GIS- and
GPS-derived locations were determined.
Results: The InfoCanada and Yellow Pages GIS databases provided the locations for 973 and
676 food retailers, respectively. Overall, 749 (77.1%) and 595 (88.1%) of these were located in
the field. The online database had a higher proportion of food retailers found in the field. The
GIS locations of 25% of the food retailers were located within 15 m of their actual location, 50%
were within 25 m, and 75% were within 50 m. These values did not differ by database source.
Conclusions: This validation study provided a detailed assessment of GIS food database quality,
providing in-depth information on measurement error. The location information was more
accurate for the online database. However, when matching criteria was more conservative, there
were no differences between databases.

44
BACKGROUND
Recent research on the determinants of obesity has focused on how the built environment
in which people live influences their physical activity and diet [1]. Several studies have
documented relationships between the availability of food retailers in the local environment,
such as fast food restaurants and convenience stores, with eating behaviors and obesity [2-5].
Most studies rely on geographical information system (GIS) databases to measure the food retail
environment. Quantifying error in GIS databases is important because it accounts for some of the
measurement bias present in etiological studies of the food environment.
To date, six validation studies have examined the accuracy of the information on food
retailer locations provided by GIS databases [6-11]. With the exception of the study by Liese et
al. [10], existing studies occurred in a single city and classified food retailers as present or
absent, rather than quantify the distance between the true and reported locations. Furthermore,
studies had small sample sizes (n<200) [8] and did not differentiate between food retailer types
[7-9]. Our study objective was to assess the validity of the positional information provided by
two GIS databases for different types of food retailers located in urban and non-urban areas.
METHODS
Sampling Approach
We measured the retail food environment surrounding 34 schools. The schools were
located in 22 cities and towns located across southern Ontario, Canada. Eight schools were in
non-urban areas (<10,000 people) and 26 were in urban areas (>10,000 people) [12]. A 1 km
circular buffer was created around each school using ArcGIS (ESRI, Redlands CA, version 9.3)
and no buffers overlapped. The location of all food retailers within the buffers was measured.
45
Food Retailers
The GIS locations of food retailers were obtained from a fee-for-service commercial
database (InfoCanada) and a freely accessible online Yellow Pages database
(www.yellowpages.ca). The North American Industry Classification System was used to obtain
multiple categories of food retailers from the InfoCanada database including: full-service
restaurants, limited-service restaurants, snack and non-alcoholic beverage bars, and convenience
stores. We merged the snack and non-alcoholic beverage bars into the limited-service restaurant
category. For the Yellow Pages database, full-service restaurants and convenience stores were
obtained with the keywords “restaurant” and “convenience store”, respectively. Limited-service
restaurants were obtained with the keywords “ice-cream & frozen desserts”, “sandwiches”, and
“donut – retail”. The limited-service restaurants also included chain fast-food restaurants, which
are listed in Additional File 1.
The true location of food retailers, at the curb side street entrances, was determined in the
field using a Garmin Dakota 10 handheld Global Positioning System (GPS) device (Garmin
International Inc., Olathe, Kansas). In downtown areas where there were no distinct street
entrances, the storefront entrance was measured. If a food retailer was not initially found, it was
telephoned to verify its existence and to help identify its location for GPS measures.
For a detailed description of the GIS-based measures of this study, see Appendix F.
Statistical Analysis
The differences in GIS- and GPS-derived locations were determined by measuring the
Euclidian (straight line) distance in ArcGIS. Because values for these distances were skewed,
medians were reported and the Wilcoxon rank-sum test was used to determine if the distances
differed between the GIS databases. We also determined the proportion of the GIS-measured
46
food retailers that were located within the 1 km buffer, and within 100 m, 50 m, and 25 m of the
true GPS-measured location. Chi-square and Fisher‟s exact tests were used to determine whether
the proportions of GIS-measured food retailers located within these distances differed between
the databases.
RESULTS
The InfoCanada and Yellow Pages GIS databases provided the locations for 973 and 676
food retailers, respectively, in the 1 km buffer surrounding the 34 schools. Overall, 749 (77.1%)
and 595 (88.1%) of these were located in the field, respectively. For urban schools, the
proportion of food retailers found within the 1 km buffer was higher for the Yellow Pages
database for all categories, with the exception of convenience stores (Table 1).
The proportion of listed food retailers located within a specific distance of their true
location decreased as the size of the distance got smaller (Table 1). For example, for urban
schools, the proportion of limited-service restaurants in the Yellow Pages database that were
within 100 m of their true location was 77.5 %; 52.1% were within 50 m and only 25.4% were
within 25 m.
Table 2 provides the median positional error, which is the Euclidean distance between the
GIS- and GPS-derived locations. The median positional errors were not statistically different in
the InfoCanada (24.6 m, interquartile range: 13.2-51.0 m) and Yellow Pages (25.6 m,
interquartile range: 13.1-51.7 m) databases.

47
DISCUSSION
The key findings of this study were that the Yellow Pages directory provided a greater
proportion of the listed food retailers in the 1 km buffer, but that the positional error did not
differ between GIS databases. When considering the presence or absence of food retailers within
a 1 km buffer, the validity of the information provided by GIS was good. However, with more
precise distance thresholds (eg, within 50 m), the validity of both GIS databases was poor.
This study provides important contributions to the study of the food environment. It is
important to assess the quality of GIS food retailer databases since they are used to make
inferences about the food environment and eating behaviors. This was achieved by evaluating
the quality of positional information provided by two different GIS databases in multiple
locations using a variety of criteria.
The results for the 1 km buffer were relatively consistent with those of Hosler and Darssi
[6], Lake et al. [9], and Liese et al. [10]. However, unlike the findings by Paquet et al [8], we
found that a higher proportion of food retailers listed in the online database were found in the
field compared to the commercial database. This may be explained by how frequently the
databases are updated. The location information for InfoCanada is valid for 6 months while the
Yellow Pages provides monthly subscriptions. Some of the measurement error for both databases
may be explained by the fact that GIS software estimates street address locations by uniformly
distributing street address numbers along road segments. These estimated locations may not
precisely match the actual street address locations.
There are some limitations to our study that warrant consideration. Because we did not
attempt to measure the presence of food retailers located within the 1 km buffer that did not
appear in the GIS databases (due to feasibility issues), we were unable to calculate sensitivity. In

48
addition, there were small numbers of food retailers in non-urban locations, which may account
for the lack of statistically significant findings in those areas.
CONCLUSION
Half of the food retailers were positioned within ~25 m of their true location by the two
GIS databases, and 75% were positioned within ~50 m. The Yellow Pages directory provided a
higher proportion of matches within the 1 km buffers compared to the InfoCanada database.
ACKNOWLEDGEMENTS
This study was funded by an operating grant from the Canadian Institutes of Health Research
(CIHR) (MOP 97962), and a second operating grant co-funded by CIHR and the Heart and
Stroke Foundation of Canada (PCR 101415). LS was supported by the CIHR Frederick Banting
and Charles Best Canada Graduate Scholarship. IJ was supported by researcher awards from
CIHR and the Ontario Ministry of Research and Innovation.

49
References
1. Papas MA, Alberg AJ, Ewing R, Helzlsouer KJ, Gary TL, Klassen AC: The built
environment and obesity. Epidemiol Rev 2007;29:129-143.
2. Davis B, Carpenter C: Proximity of fast-food restaurants to schools and adolescent
obesity. Am J Public Health 2009;99:505-510.
3. Powell LM, Auld MC, Chaloupka FJ, O'Malley PM, Johnston LD: Associations between
access to food stores and adolescent body mass index. Am J Prev Med 2007;33:S301-
307.
4. Seliske LM, Pickett W, Boyce WF, Janssen I: Association between the food retail
environment surrounding schools and overweight in Canadian youth. Public Health Nutr
2009;12:1384-1391.
5. Laska MN, Hearst MO, Forsyth A, Pasch KE, Lytle L: Neighbourhood food
environments: are they associated with adolescent dietary intake, food purchases and
weight status? Public Health Nutr 2010;13:1757-1763.
6. Hosler AS, Dharssi A: Identifying retail food stores to evaluate the food environment.
Am J Prev Med 2010;39:41-44.
7. Cummins S, Macintyre S: Are secondary data sources on the neighbourhood food
environment accurate? Case-study in Glasgow, UK. Prev Med 2009;49:527-528.
8. Paquet C, Daniel M, Kestens Y, Leger K, Gauvin L: Field validation of listings of food
stores and commercial physical activity establishments from secondary data. Int J Behav
Nutr Phys Act 2008;5:58.

50
9. Lake AA, Burgoine T, Greenhalgh F, Stamp E, Tyrrell R: The foodscape: classification
and field validation of secondary data sources. Health Place 2010;16:666-673.
10. Liese AD, Colabianchi N, Lamichhane AP, Barnes TL, Hibbert JD, Porter DE, Nichols
MD, Lawson AB: Validation of 3 Food Outlet Databases: Completeness and Geospatial
Accuracy in Rural and Urban Food Environments. Am J Epidemiol 2010.
11. Bader MD, Ailshire JA, Morenoff JD, House JS: Measurement of the local food
environment: a comparison of existing data sources. Am J Epidemiol 2010;171:609-617.
12. Statistics Canada. 2006 Census Dictionary. Catalogue no. 92-566-X
[http://www12.statcan.gc.ca/census-recensement/2006/ref/dict/pdf/92-566-eng.pdf].

51
Table 1. The proportion of food retailers in the GIS databases found in the field validation
† = proportion of food retailers differs between sources at a p value <0.01
* = proportion of food retailers differs between sources at a p value <0.05
Distance
Urban Non-Urban
Info Canada Yellow Pages Info Canada Yellow Pages
N % (95% CI) N % (95% CI) N % (95% CI) N % (95% CI)
Within 1 km Buffer
All Food Retailers
Full Service
Limited Service
Convenience
Within 100 m
All Food Retailers
Full Service
Limited Service
Convenience
Within 50 m
All Food Retailers
Full Service
Limited Service
Convenience
Within 25 m
All Food Retailers
Full Service
Limited Service
Convenience
628
283
272
73
562
261
234
67
450
229
166
55
297
164
97
36
76.0 (72.7-79.3)
72.2 (67.0-77.4)
80.0 (75.2-84.8)
77.7 (68.2-87.2)
68.0 (64.1-71.9)
66.6 (60.9-72.3)
68.8 (62.9-74.7)
71.3 (60.5-82.1)
54.5 (49.9-59.1)
58.4 (52.0-64.8)
48.8 (41.2-56.4)
58.5 (45.5-71.5)
36.0 (30.5-41.5)
41.8 (34.3-49.3)
28.5 (19.5-37.5)
38.3 (22.4-54.2)
525
320
125
80
474
294
110
70
382
250
74
58
245
168
36
41
87.9 (85.1-90.7)†
88.4 (84.9-91.9)†
88.0 (82.3-93.7)*
86.0 (78.4-93.6)
79.4 (75.8-83.0)†
81.2 (76.7-85.7)†
77.5 (69.7-85.3)
75.3 (65.2-85.4)
64.0 (59.2-83.8)†
69.1 (63.4-74.8)†
52.1 (40.7-63.5)
62.4 (49.9-74.9)
41.0 (34.8-47.2)
46.4 (38.9-53.9)
25.4 (11.2-39.6)
44.1 (28.9-59.3)
121
55
54
12
110
50
48
12
102
47
43
12
81
38
33
10
82.9 (76.2-89.6)
75.3 (63.9-86.7)
91.5 (84.1-98.9)
85.7 (65.9-105.5)
75.3 (63.9-86.7)
68.5 (55.6-81.4)
81.4 (70.4-92.4)
85.7 (65.9-105.5)
69.9 (61.0-78.8)
64.4 (50.7-78.1)
72.9 (59.6-86.2)
85.7 (65.9-105.5)
55.5 (44.7-66.3)
52.1 (36.2-68.0)
55.9 (39.0-72.8)
71.4 (44.7-98.1)
70
48
15
7
65
45
13
7
57
41
10
6
50
37
9
4
89.7 (82.6-96.8)
90.6 (82.3-98.9)*
88.2 (71.9-104.5)
87.5 (63.0-112.0)
83.3 (74.2-92.4)
84.9 (74.4-95.4)*
76.5 (53.5-99.5)
87.5 (63.0-112.0)
73.1 (61.6-84.6)
77.4 (64.6-90.2)
58.8 (28.3-89.3)
75.0 (40.4-109.6)
64.1 (50.8-77.4)
69.8 (55.0-84.6)
52.9 (20.3-85.5)
50.0 (1.0-99.0)

52
Table 2. Positional error (meters) of food retailer locations provided the GIS databases
InfoCanada Yellow Pages P
value N Median (IQR) N Median (IQR)
Urban Schools All Food Retailers
Full Service
Limited Service
Convenience
628
283
272
7
26.9 (13.5 - 54.4)
20.9 (12.3 - 41.9)
37.6 (16.8 - 67.4)
24.6 (13.5 - 49.9)
525
320
125
80
27.7 (13.8-51.7)
22.5 (12.2 - 44.2)
44.0 (21.1 - 69.4)
24.6 (13.7 - 60.6)
0.98
0.34
0.31
0.61
Non-Urban Schools
All Food Retailers
Full Service
Limited Service
Convenience
121
55
54
12
16.8 (10.3 - 30.3)
16.7 (9.7 - 30.3)
17.1 (10.4 - 35.1)
16.8 (13.9 - 23.6)
70
48
15
7
14.4 (8.1 - 27.6)
14.4 (7.6 - 23.4)
17.0 (9.5 - 54.3)
13.9 (7.4 - 32.8)
0.20
0.70
0.89
0.37
IQR = Interquartile Range

53
Additional File 1. Limited-service chain food retailers from online yellow pages directory
241 Pizza
A&W
Arbys
Baskin Robbins
Burger King
Coffee Time Donuts
Country Style Donuts
Dairy Queen
Dominos Pizza
Double Double Pizza & Chicken
Harvey‟s
KFC
McDonalds
Mr. Sub
Pita Pit
Pizza Pizza
Quiznos
Starbucks
Subway
Taco Bell
Tim Hortons
Wendys

54
CHAPTER 4
Food Retailers Surrounding Schools and Lunchtime Eating Behaviours of Students

55
ABSTRACT
The primary objective of this study was to examine whether the presence of food retailers within
1 km of Canadian schools was associated with lunchtime eating behaviours of grade 9-10
students. The secondary objective was to determine whether measures of the presence of food
retailers assessed using road network buffers were more strongly related to eating behaviours
compared to measures obtained using circular buffers. For the circular buffers, students with ≥5
food retailers were 2.94 (95% CI: 1.71-5.09) times more likely to eat their lunch at food retailers
compared to students with no nearby food retailers; a finding that was slightly stronger when
assessed via road network buffers (OR 3.54, 95% CI: 2.08-6.02). Road network buffers appeared
to provide a better measure of the food retail environment, as indicated by lower Akaike‟s
Information Criteria values (3332 vs. 3346), a goodness-of-fit statistic for the regression models.

56
INTRODUCTION
Poor eating behaviours, defined in this study as eating behaviours that lead to an
increased consumption of foods high in calories, sugar, salt and fat, are an important determinant
of health among young people. Consumption of these foods is associated with the onset of
several adverse health outcomes including obesity [1-3] and early indicators of cardiovascular
disease [4,5] and type 2 diabetes [6]. Young people who frequently eat at fast food restaurants
have poorer diets than those who eat at these restaurants less frequently [7-9]. Although there is a
lack of analogous research on food purchases at convenience stores or coffee/donut shops, the
increased consumption of sugar sweetened beverages [10] and snack foods [11] in recent years
suggests that these food retailers may also influence eating behaviours.
Since young people spend a large portion of their day at school, the school food
environment may impact their eating behaviours and diets. Most research on the school food
environment has focused directly on the school itself (e.g., cafeteria, vending machines) [12-14].
However, many students are permitted to leave school grounds during the school day and have
access to nearby food retailers. There is sometimes a preponderance of fast food restaurants near
schools [15,16], and these types of food retailers sell primarily unhealthy foods. Few studies
have considered whether the presence of food retailers near schools negatively influences young
peoples‟ eating behaviours. Existing studies provided weak [17] to no support of this notion
[18,19]. A major limitation of these studies is that they measured the overall consumption of
specific food items (e.g., fruits and vegetables), and did not consider where or when the food
items were obtained. This makes it impossible to distinguish between the contributions of the
school food retail environment, the food retail environment surrounding homes, and other
environments to overall consumption.

57
In order to measure the local food retail environment, previous studies have used
different types of geographic boundaries, with most relying on either circular buffers [17,19] or
road network buffers [15,18]. Circular buffers capture all land within a set distance from a
location of interest “as the crow flies”, while road network buffers extend outwards from a
location of interest by following road networks, and therefore capture what is actually accessible
to a person using the roads to travel to and from food retailers. Circular buffers, while easy to
create, do not necessarily reflect how people travel. Road network-based buffers address this
limitation, but the creation of road network buffers requires more time and expertise in
geographic information system (GIS) technologies. Measures of the built environment which use
road network buffers have been shown to be more strongly and consistently related to physical
activity behaviours compared to circular buffers [20]. There is an analogous need to address this
buffer measurement issue for the food retail environment.
The primary objective of this study was to examine the relationship between the food
retail environment surrounding Canadian schools and students‟ lunchtime eating behaviours.
This relationship has not been demonstrated convincingly in past studies, potentially due to a
lack of precision in the measurement of specific eating behaviours and locations. A second
objective was to determine whether measures of the food retail environment obtained by road
network buffers were more strongly related to eating behaviours than comparable measures
obtained using circular buffers. We carried out these objectives in a large national study. From a
public health perspective, findings from this study could support strategies aimed at improving
eating behaviours among young people through the development of policies that would address
the food retail environment surrounding schools. From a methodological perspective, the

58
findings of this study could provide information on the optimal buffer type to use when
conducting research on the food retail environment.
MATERIALS AND METHODS
Overview of Study Design
This study involved a multilevel cross-sectional analysis that examined the relationship
between the food environment surrounding schools and the locations where grade 9 and 10
students ate their lunch during the school week. Participants and schools were obtained from the
2009/10 Canadian Health Behaviour in School-aged Children (HBSC) survey. Addresses of food
retailers surrounding schools were gathered using an online food retailer database. The presence
of food retailers surrounding each school was measured by creating 1 km circular and 1 km road
network buffers around schools using the GIS software, then determining the number of food
retailers within each type of buffer. Associations between food retailer exposures and individual
reports from students about eating their lunch at a food retailer were then assessed.
Study Sample
The HBSC survey is carried out in association with the World Health Organization and
was conducted in 43 countries in 2009/10. It includes a student survey completed by grades 6 to
10 students (approximate ages of 11 to 16 years) and an administrator survey completed by a
principal or designate at each of the participating schools. The student survey is completed in the
classroom and covers a variety of health behaviours and their determinants.(For more detailed
information on the HBSC survey methodology, see appendix B). In Canada, a single stage
cluster sampling approach was used to obtain participants, in accordance with an international
protocol [21]. Classes were the primary sampling unit, and they were stratified by province, with

59
an oversampling of some provinces and the three northern territories. The HBSC survey excludes
students in private schools, incarcerated youth, special needs schools and students who are home
schooled. In 2009/2010, two Canadian provinces with small populations (New Brunswick and
Prince Edward Island) were unable to participate. Ethics approval was obtained from the
Queen‟s University Health Sciences & Affiliated Teaching Hospitals Research Ethics Board.
Subject consent was obtained at the school board and school levels, as well as from parents or
guardians (either explicitly or implicitly, as determined by school board policy). See Appendix A
for information on ethics approvals.
The 2009/10 HBSC survey contained a total of 26,078 students in 436 schools across
Canada. For our study, analyses were restricted to students attending schools where they were
permitted to leave school grounds, thereby making it possible for them to purchase food at
nearby food retailers. Because only 1.1% of grade 6 to 8 students reported the study outcome
(regularly eating their lunch at food retailers), they were excluded from the analysis, leaving
8,439 students from 169 schools. Students (n=528) from an additional 11 schools were excluded
due to missing information on food sources within schools or in the school neighborhoods, and
940 students were excluded because of missing data on key variables. The final analyses
involved 6,971 students from 158 schools.
Eating Lunch at a Food Retailer
The outcome of this study was obtained from the response to the following question:
“Where do you usually eat your lunch or mid-day meal on school days?”. Students who chose
the response “snack-bar, fast-food restaurant, café” were classified as regularly purchasing their
lunch from a food retailer. Those who chose the remaining responses (“at school”, “at home”,
“at someone else’s house”, “do not eat lunch/mid-day meal”, or “other”) were classified those

60
who typically did not eat their lunch at a food retailer. For a complete description of the HBSC
questions used in this Manuscript, see Appendix C.
School Food Retail Environment
The addresses of the 158 HBSC schools were mapped in ArcGIS (ESRI, version 9.3) and
1 km circular and road network-based buffers were constructed. The 1 km distance was chosen
because it approximates the distance that can be walked in 10 to 15 minutes [22], a comfortable
amount of time for students to walk to and from food retailers during their lunch break. Circular
buffers surrounding schools were created by extending a 1 km radius around the schools. Road
network buffers were created using a commercial road network database provided by CanMaps
Streetfiles (DMTI Spatial Inc., v.2009.4, Markham ON). Roads extending outwards from schools
were followed until they reached an endpoint at 1 km. Lines connecting the 1 km endpoints were
used to create the border of the road network-based buffers. To illustrate, the Figure shows the
characteristics of a circular and road network buffer for one of the participating HBSC schools.
For some schools, the 1 km road network buffer may cover a considerably smaller area than
circular buffers and therefore capture fewer food retailers.
Convenience stores, fast food restaurants, and coffee/donut shops were included as the
primary independent variable of interest. These directly corresponded to the lunchtime eating
question used to determine the study outcome. Information on the addresses of these types of
food retailers near schools was obtained using an online Yellow Pages directory
(www.yellowpages.ca). The Yellow Pages database was chosen because it provided more
accurate information on food retailer locations than a commercial database [23]. School
addresses were entered into the Yellow Pages directory. The search term „convenience stores‟

61
was used to obtain convenience stores. There was no single search term to use for fast food
restaurants and coffee/donut shops because many of them were listed under the full service
restaurant category. Therefore, we searched for the top 75% of the top 200 chain food retailers in
Canada in 2009 [24], which is a similar approach to those used in previous food retail
environment studies [25,26]. Names of the 16 fast food restaurant chains and 4 coffee/donut
chain restaurants that were included as search terms are shown in Table 1. For detailed
information on how food retailers were obtained and mapped, see Appendix F)
All food retailers within the 1 km circular and 1 km road network buffers were mapped
using ArcGIS software. For food retailers whose street addresses had a match score of less than
80%, the Street View tool in Google Earth (©2011 Google) was used to confirm the location and
obtain latitude and longitude coordinates to map them manually in ArcGIS. The number of food
retailers within the buffers was positively skewed, hence the following categories were created:
no food retailers present, presence of 1 or 2 food retailers, presence of 3 or 4 food retailers, and
presence of 5 or more food retailers.
Confounders
Individual-level variables, including age, sex, and socioeconomic status were considered
as potential confounders, since fast food consumption varies by these characteristics [9,27,28].
To obtain information on socioeconomic status, the HBSC survey uses the previously validated
family affluence scale (FAS) [29]. Finally, because cafeterias, vending machines, and school
snack/tuck shops are associated with students‟ eating behaviors [12-14], they were considered as
potential school-level confounders, as they may have reduced the likelihood of students seeking
food from food retailers outside of the school. (See Appendix C for the exact survey questions
used in the analysis).

62
Regression Analysis
All analyses were conducted using SAS statistical software, version 9.2 (SAS Institute,
Cary, NC). Multilevel logistic regression was carried out to examine the relationship between the
presence of food retailers (convenience stores, fast food restaurants, and coffee/donut shops) and
the likelihood of students eating their lunch at these food retailers. A three step modeling
procedure was carried out. First, an empty model was used to determine the intraclass correlation
coefficient (ICC), which provides an estimate of the proportion of the variation in the study
outcome that was due to differences between schools. Second, bivariate relationships were
examined between the study outcome and each potential confounder. Finally, the multivariate
model building process began with the introduction of the individual-level confounders and
proceeded using a backwards elimination approach. Next, the school-level food exposure
variables were forced into the model because we were interested in assessing food sources within
school as well as those surrounding schools.
Goodness-of-Fit
The Akaike information criterion (AIC) was determined for the final multivariate models.
It is a measure of goodness-of-fit when comparing two or more regression models. The AIC
value is derived using likelihood theory rather than the more commonly used least squares
theory. Likelihood theory estimates the likelihood of an unknown parameter, given the data at
hand and a particular model [30]. The AIC value of a model is equal to -2 Log likelihood + 2K,
where K is the number of parameters in the model, including the intercept and the variance [30].
It is an estimate of the expected relative distance between a fitted model and an unknown “true
mechanism” that generated the observed data. The advantage of the AIC goodness-of-fit value is
that the models that are compared do not have to be nested. Rather, the key condition for

63
comparing AIC scores across candidate models is that the models must be obtained from the
same data set.
To interpret the AIC values from a set of candidate models, it is not the absolute values of
the AIC scores that matter, but rather the difference between them. A lower AIC value indicates
better model fit and a difference in AIC values between 2 to 7 indicates a moderate difference in
fit of the models, while a difference of 7 or more indicates a large difference in model fit [30].
Using the AIC values, the Akaike weights were calculated, which indicate the probability that a
regression model is the best choice among a set of candidate models based on the model fit [31].
After the model with the best fit was determined, the population attributable risk (PAR) was
calculated, using the following formula: PAR = Pexp(RR - 1)/(1 + Pexp(RR - 1), where Pexp
denotes the prevalence of the exposure [32] and RR represents the relative risk. Since the
outcome is rare (<10%), the odds ratio (OR) was used to approximate the RR.
RESULTS
Description of Study Sample
Table 2 shows the individual-level characteristics of the study sample. There was an
approximately equal distribution of males and females. Over half of the participants were in the
highest family affluence group and only 8.0% were in the lowest. Of the participants who
provided self-reported weights and heights, 19.6% were overweight or obese according to the
International Obesity Task Force body mass index criteria [33]. During the school week, the
majority of students typically ate their lunch either at school (67.7%), at home (15.2%), or in a
snack bar, fast food restaurant, or café (7.4%).

64
Characteristics of the schools involved in this analysis are shown in Table 3. The
majority were secondary schools (limited to students in grades 9 to 12) and 39.2% were located
within large urban centres. Most schools had cafeterias (76.0%) and vending machines that
served sugared drinks (61.4%). Only 33.5% of schools had a snack/tuck shop. Overall, 70.9% of
schools had at least one food retailer of any type within the circular buffer, and 61.3% of schools
had at least one food retailer within the road network buffer. Convenience stores and fast food
restaurants were most prevalent. A total of 648 food retailers were located within the 1 km
circular buffers surrounding the 158 schools, and 394 food retailers were located within the 1 km
road network buffers.
Association Between Neighborhood Food Environments and Lunchtime Eating Behaviors
The ICC value indicated that 26.3% of the variation in the lunchtime eating outcome was
due to school-level factors. The high ICC value provides support for the use of multi-level
modeling to examine the relationship between the presence of food retailers near schools and the
lunchtime eating outcome. Results of the regression analyses for each buffer type are shown in
Table 4. The bivariate analysis showed that the only individual-level confounder related to
lunchtime eating was sex, with males nearly twice as likely to obtain their lunch from a food
retailer. For the school-level confounders, the presence of a school snack/tuck shop decreased the
likelihood of eating at food retailers by nearly half, while the presence of a cafeteria in the school
was positively related to students eating lunch at a food retailer.
After adjusting for the relevant individual- and school-level confounders, students
exposed to ≥5 food retailers based upon the 1 km circular buffer were 2.94 times (95% CI: 1.71-
5.09) more likely to eat their lunch at a food retailer compared to students with no food retailers
surrounding their school. For the road network-based buffers, students exposed to 3 or 4 food

65
retailers were 3.19 times (95% CI: 1.66-6.13) more likely to eat their lunch at a food retailer, and
students exposed to ≥5 food retailers were 3.54 times (95% CI: 2.08-6.02) more likely to eat
their lunch at a food retailer compared to students with no food retailers surrounding their school.
Circular vs. Road Network Buffers
The AIC value for the final road network buffer model was 14 units smaller than the
value for the final circular buffer model (3332 vs. 3346), indicating that the road network-based
buffers provided a better model fit. In addition, the Akaike weight for the road network buffer
was 0.99, indicating that there was a 99% probability that the road network data provided the
better model fit.
DISCUSSION
The key findings of our study are as follows. First, by using a focused measure of where
students eat their lunch, we were able to demonstrate that the food retail environment
surrounding schools is strongly related to student‟s eating behaviours during the school day.
Second, our findings suggest that the geographic boundaries used to assess the food retail
environment are better captured using road network buffers rather than circular buffers.
At 26.3%, the amount of variation in students‟ lunchtime eating behaviours attributable to
school-level factors was noteworthy. Although there are currently no studies with a similar
lunchtime eating behaviour outcome, another Canadian study of the school food environment
and obesity by Leatherdale et al. [34] had an ICC of 5.4%. Our comparatively higher ICC value
indicates that the school food environment accounts for a notable proportion of the variation in
students‟ lunchtime eating behaviours. Furthermore, the relationship between food retailers
surrounding schools and students‟ eating behaviors observed in our study were much stronger
than those previously reported [17,18]. This difference may partly be explained by our use of a

66
precise measurement of food consumption at food retailers during the school day, rather than a
more general measure of food consumption patterns reported for the entire day or week, as has
been used in past studies [17,18]. It is important to consider the specific context of food
consumption, including where and when the food was eaten, in order to evaluate the importance
of a specific food environment. By accounting for the particular context in which food was
consumed, the potential for the misclassification in the measurement of the food environment is
greatly reduced.
Our comparison of the model fit provided by the circular and road network-based buffers
showed findings that were consistent with similar research, despite the fact that previous research
has used different behavioural outcomes in different populations. Oliver et al. [20] examined the
relationship between land use mix, measured with 1 km circular and road network buffers, and
walking behaviour in adults residing in Vancouver, B.C. The road network-based measures were
consistently related to walking behaviours, while the circular-based measures were not. Taken
together, the findings suggest that researchers should consider investing the time in obtaining
road network buffers when they want to measure the association between built environment
constructs and health-related behaviours. However, it is important to note that there is a scarcity
of studies directly comparing buffer types. Future studies comparing these measures are needed
to confirm this observation, particularly when assessing the food environment.
Despite the implementation of a new policy restricting fast food restaurants in a
socioeconomically disadvantaged area in California [35], there is currently no evidence
evaluating its effectiveness. In fact, to our knowledge, no existing studies have examined
whether policies aimed at restricting the number of food retailers that sell primarily unhealthy
foods (e.g., fast food restaurants) impacts people‟s dietary behaviours. However, there is

67
analogous evidence from interventions and policies put in place to address the lack of
supermarkets – the main source of reasonably priced fresh fruits and vegetables – in
socioeconomically disadvantaged neighbourhoods. For instance, the introduction of a new
supermarket in a deprived neighborhood in Leeds, UK positively impacted the fruit and
vegetable consumption of the adults residing in that neighborhood, particularly those with the
worst diets, whose fresh fruit and vegetable consumption doubled [36]. This demonstrates the
potential to influence peoples‟ eating behaviours by modifying their food environment through
policies and interventions. Given the preponderance of unhealthful food retailers near schools
[15,16] and the strong associations we found with students‟ eating behaviours, there is a need for
future research to evaluate whether restrictions on food retailers near schools affect lunchtime
eating behaviours of young people.
While the food retail environment within the school has an important impact on students‟
eating behaviors and food choices [12-14], approximately one third of the grade 9 and 10
students in our national study did not usually eat their lunch at school and almost one in ten
usually ate their lunch at a food retailer. Interestingly, we observed that the presence of school
cafeterias and certain vending machines were positively associated with eating lunch at food
retailers, although the relationship was not statistically significant. The positive relationships
suggest that despite having the option to purchase food directly within their schools, some
students prefer to purchase their lunch at nearby food retailers. Furthermore, the population
attributable risk calculations suggest that 58% of the study outcome (eating at food retailers
during the school week) was attributable to students being exposed to 3 or more food retailers
within a 1 km travel distance of their school. Therefore, policies and programs directed at
68
eliminating unhealthy food choices within school cafeterias and vending machines may be
undermined by the availability of less nutritious food at nearby food retailers.
Some important strengths and limitations merit consideration. Key strengths of this study
included our specific measurement of eating behaviours during the school day and the large and
geographically diverse study sample. A limitation of this study was that the food environment
was measured with an online GIS database, which may not provide a completely accurate and
up-to-date measure of the food environment. Furthermore, only the top 75% of chain fast food
and donut/coffee shops were included in the exposure measure. There was no information from
the HBSC survey on which food retailers the students actually went to. Also, all data were
obtained by self-report, and may be subject to bias introduced by the social desirability of eating
healthy meals. Finally, the study was cross-sectional and therefore temporality between the
presence of food retailers and eating behaviours cannot be directly established. However, it is
unlikely that students chose to attend schools based on the presence of nearby food retailers.
CONCLUSIONS
In conclusion, this national study provides novel insights into the relationship between
the food retail environment surrounding schools and the eating behaviours of students during the
school day. It also provided evidence to support the use of network buffers over circular buffers
when assessing the food retail environment. Future research needs to evaluate whether policies
directed at modifying the food retail environment improve eating behaviours.

69
ACKNOWLEDGEMENTS
The authors of this study would like to thank Mariane Héroux, Rachel Laxer and Hoda
Gharib for their assistance in the collection of the food retailer addresses. The 2009/10 Health
Behaviour in School-aged Children Survey (HBSC), a World Health Organization/European
Region collaborative study, was funded in Canada by the Public Health Agency of Canada and
Health Canada. This study was funded by an operating grant from the Canadian Institutes of
Health Research (MOP 97962), and a second operating grant co-funded by the Canadian
Institutes of Health Research and the Heart and Stroke Foundation of Canada (PCR 101415). In
addition, Laura Seliske was supported by a Frederick Banting and Charles Best Doctoral
Research Award from the Canadian Institutes of Health Research. Ian Janssen was supported by
a Canada Research Chair and an investigator award from the Ontario Ministry of Research and
Innovation. The principal investigators of the 2009/10 Canadian HBSC survey were John
Freeman and William Pickett, and the HBSC is coordinated internationally by Candace Currie
(University of Edinburgh).

70
References
1. Bradlee ML, Singer MR, Qureshi MM, Moore LL: Food group intake and central obesity
among children and adolescents in the Third National Health and Nutrition Examination
Survey (NHANES III). Public Health Nutr 2010;13:797-805.
2. Taveras EM, Berkey CS, Rifas-Shiman SL, Ludwig DS, Rockett HR, Field AE, Colditz
GA, Gillman MW: Association of consumption of fried food away from home with body
mass index and diet quality in older children and adolescents. Pediatrics 2005;116:e518-
524.
3. Berkey CS, Rockett HR, Field AE, Gillman MW, Colditz GA: Sugar-added beverages
and adolescent weight change. Obes Res 2004;12:778-788.
4. McNaughton SA, Ball K, Mishra GD, Crawford DA: Dietary patterns of adolescents and
risk of obesity and hypertension. J Nutr 2008;138:364-370.
5. Holt EM, Steffen LM, Moran A, Basu S, Steinberger J, Ross JA, Hong CP, Sinaiko AR:
Fruit and vegetable consumption and its relation to markers of inflammation and
oxidative stress in adolescents. J Am Diet Assoc 2009;109:414-421.
6. Lindquist CH, Gower BA, Goran MI: Role of dietary factors in ethnic differences in early
risk of cardiovascular disease and type 2 diabetes. Am J Clin Nutr 2000;71:725-732.
7. Paeratakul S, Ferdinand DP, Champagne CM, Ryan DH, Bray GA: Fast-food
consumption among US adults and children: dietary and nutrient intake profile. J Am
Diet Assoc 2003;103:1332-1338.
8. Pereira MA, Kartashov AI, Ebbeling CB, Van Horn L, Slattery ML, Jacobs DR, Jr.,
Ludwig DS: Fast-food habits, weight gain, and insulin resistance (the CARDIA study):
15-year prospective analysis. Lancet 2005;365:36-42.

71
9. Bowman SA, Gortmaker SL, Ebbeling CB, Pereira MA, Ludwig DS: Effects of fast-food
consumption on energy intake and diet quality among children in a national household
survey. Pediatrics 2004;113:112-118.
10. Wang YC, Bleich SN, Gortmaker SL: Increasing caloric contribution from sugar-
sweetened beverages and 100% fruit juices among US children and adolescents, 1988-
2004. Pediatrics 2008;121:e1604-1614.
11. Piernas C, Popkin BM: Trends in snacking among U.S. children. Health Aff (Millwood)
2010;29:398-404.
12. Kubik MY, Lytle LA, Hannan PJ, Perry CL, Story M: The association of the school food
environment with dietary behaviors of young adolescents. Am J Public Health
2003;93:1168-1173.
13. Park S, Sappenfield WM, Huang Y, Sherry B, Bensyl DM: The impact of the availability
of school vending machines on eating behavior during lunch: the Youth Physical Activity
and Nutrition Survey. J Am Diet Assoc 2010;110:1532-1536.
14. Briefel RR, Crepinsek MK, Cabili C, Wilson A, Gleason PM: School food environments
and practices affect dietary behaviors of US public school children. J Am Diet Assoc
2009;109:S91-107.
15. Day PL, Pearce J: Obesity-promoting food environments and the spatial clustering of
food outlets around schools. Am J Prev Med 2011;40:113-121.
16. Austin SB, Melly SJ, Sanchez BN, Patel A, Buka S, Gortmaker SL: Clustering of fast-
food restaurants around schools: a novel application of spatial statistics to the study of
food environments. Am J Public Health 2005;95:1575-1581.
72
17. Davis B, Carpenter C: Proximity of fast-food restaurants to schools and adolescent
obesity. Am J Public Health 2009;99:505-510.
18. Laska MN, Hearst MO, Forsyth A, Pasch KE, Lytle L: Neighbourhood food
environments: are they associated with adolescent dietary intake, food purchases and
weight status? Public Health Nutr 2010;13:1757-1763.
19. van der Horst K, Timperio A, Crawford D, Roberts R, Brug J, Oenema A: The school
food environment associations with adolescent soft drink and snack consumption. Am J
Prev Med 2008;35:217-223.
20. Oliver LN, Schuurman N, Hall AW: Comparing circular and network buffers to examine
the influence of land use on walking for leisure and errands. Int J Health Geogr
2007;6:41.
21. Currie C, Griebler R, Inchley J, Theunissen A, Molcho M, Samdal O, Dur W: Health
Behaviour in School-aged Children (HBSC) Study Protocol: Background, Methodology
and Background Items for the 2009/10 Survey. Edinburgh: CAHRU & Vienna: LBIHPR.
Found at: http://www.hbsc.org. 2010.
22. Pikora TJ, Bull FC, Jamrozik K, Knuiman M, Giles-Corti B, Donovan RJ: Developing a
reliable audit instrument to measure the physical environment for physical activity. Am J
Prev Med 2002;23:187-194.
23. Seliske LM, Pickett W, Bates R, Janssen I: Field validation of food retailer listings: a
comparison of online and commercial GIS databases. Submitted.
24. Technomic. Top 200 Canadian Chain Restaurant Report. Chicago, IL: Technomic Inc;
2010.
73
25. Alter DA, Eny K: The relationship between the supply of fast-food chains and
cardiovascular outcomes. Can J Public Health 2005;96:173-177.
26. Crawford DA, Timperio AF, Salmon JA, Baur L, Giles-Corti B, Roberts RJ, Jackson ML,
Andrianopoulos N, Ball K: Neighbourhood fast food outlets and obesity in children and
adults: the CLAN Study. Int J Pediatr Obes 2008;3:249-256.
27. French SA, Story M, Neumark-Sztainer D, Fulkerson JA, Hannan P: Fast food restaurant
use among adolescents: associations with nutrient intake, food choices and behavioral
and psychosocial variables. Int J Obes Relat Metab Disord 2001;25:1823-1833.
28. Campbell K, Crawford D, Jackson M, Cashel K, Worsley A, Gibbons K, Birch LL:
Family food environments of 5-6-year-old-children: does socioeconomic status make a
difference? Asia Pac J Clin Nutr 2002;11 Suppl 3:S553-561.
29. Currie C, Molcho M, Boyce W, Holstein B, Torsheim T, Richter M: Researching health
inequalities in adolescents: the development of the Health Behaviour in School-Aged
Children (HBSC) family affluence scale. Soc Sci Med 2008;66:1429-1436.
30. Burnham KP, Andersen LB: Model Selection and Multimodel Inference: A Practical
Information-Theoretic Approach. New York, Springer, 2002.
31. Motulsky H, Christopoulos A: Fitting Models to Biological Data Using Linear and
Nonlinear Regression: A Practical Guide to Curve Fitting. GraphPad Software Inc., 2003.
32. Gordis L: Epidemiology. Third Edition, Philadelphia, Elsevier Saunders, 2004.
33. Cole TJ, Bellizzi MC, Flegal KM, Dietz WH: Establishing a standard definition for child
overweight and obesity worldwide: international survey. BMJ 2000;320:1240-1243.

74
34. Leatherdale ST, Pouliou T, Church D, Hobin E: The association between overweight and
opportunity structures in the built environment: a multi-level analysis among elementary
school youth in the PLAY-ON study. Int J Public Health 2011;56:237-246.
35. Sturm R, Cohen DA: Zoning for health? The year-old ban on new fast-food restaurants in
South LA. Health Aff (Millwood) 2009;28:w1088-1097.
36. Wrigley N, Warm D, Margetts B: Deprivation, diet, and food-retail access: findings fom
the Leeds 'food deserts' study. Environ Plan A 2003;35:151-188.

75
Figure. A comparison of a 1 km circular buffer and a 1 km road network buffer to measure
access to food retailers. The road network buffer is represented by the white area and the circular
buffer encompasses both the white and gray areas. The food retailers are represented by the black
circles.

76
Table 1. Top 75% of chain fast food retailers and coffee/donut shops in Canada according to
the number of outlets.
Fast Food
Retailers
Number
of
Outlets
Coffee/Donut
Shops
Number
of
Outlets
Subway
McDonald‟s
KFC
A&W
Pizza Pizza
Dairy Queen
Quizno‟s
Mr Sub
Burger King
Wendy‟s
Pizza Hut
Domino‟s Pizza
Harvey‟s
Little Caesar‟s
New York Fries
Taco Bell
2477
1420
760
700
590
580
450
400
395
371
340
319
260
191
180
175
Tim Hortons
Starbucks
Country Style
Second Cup
3014
1051
465
343

77
Table 2. Individual-level demographic and health characteristics of the study sample from the
2009/10 Health Behaviour in School Aged Children Survey (N=6,971)
N %
Sex
Male
Female
Age (years)
13
14
15
16
Family Affluence Scale
Low
Moderate
High
Weight Status
Non-overweight
Overweight
Obese
Missing Data
Where Students Eat Mid-day Meal
At school
At home
In a snack bar, fast food restaurant or café
Never eat a midday meal
Somewhere else
At someone else‟s home
3381
3590
33
2339
3280
1319
560
2531
3880
4823
1018
346
784
4719
1056
517
307
209
163
48.5
51.5
0.5
33.6
47.1
18.9
8.0
36.3
55.7
69.2
14.6
5.0
11.3
67.7
15.2
7.4
4.4
3.0
2.3

78
Table 3. Characteristics of the school and food environment from the study sample obtained
from the 2009/10 Health Behaviour in School Aged Children Survey (N=158)
N %
School Type
Secondary (grades 9 - 12)
Mixed
Urban Rural Status
Large urban centre (≥100,000 people) Medium urban centre (20,000 - 99,999 people)
Small urban centre (1,000 - 19,000 people)
Rural (<1,000 people)
Access to Food Sources Within School
Cafeteria
Sugared drinks vending machines
Milk vending machines
Candy and potato chip vending machines
School tuck shop/snack bar
≥1 Food Retailer Within 1 km Circular Buffer
Convenience stores
Fast food restaurants
Coffee/donut shops
All food retailers
≥1 Food Retailer Within 1 km Road Network Buffer
Convenience stores
Fast food restaurants
Coffee/donut shops
All food retailers
94
64
62
15
38
43
120
97
75
64
51
92
88
53
112
73
65
35
103
59.5
40.5
39.2
9.5
24.1
27.2
76.0
61.4
47.5
40.5
32.3
55.2
55.7
33.5
70.9
46.2
41.1
22.2
61.3

79
Table 4. Relationship between the presence of food retailers and eating mid-day meal at a café, fast food restaurant or snack bar in
the 2009/10 Canadian Health Behaviour in School Aged Children Survey
Bivariate Individual Level Variables Individual and School Level
Variables
Circular Buffer Network Buffer Circular Buffer Network Buffer Circular Buffer Network Buffer
Number of Food Retailers
0
1-2
3-4
≥ 5
1.00
1.08 (0.57-2.04)
1.45 (0.76-2.76)
3.00 (1.77-5.09)
1.00
1.24 (0.76-2.02)
3.30 (1.71-6.37)
3.59 (2.13-6.05)
1.00
1.08 (0.57-2.06)
1.45 (0.76-2.79)
3.08 (1.80-5.27)
1.00
1.25 (0.76-2.06)
3.27 (1.67-6.39)
3.70 (2.17-6.30)
1.00
1.10 (0.57-2.11)
1.45 (0.75-2.82)
2.94 (1.71-5.09)
1.00
1.20 (0.74-1.95)
3.19 (1.66-6.13)
3.54 (2.08-6.02)
Individual-Level Variables
Age
1 year increase
Sex
Female
Male
Family Affluence Scale
Low wealth
Medium wealth
High wealth
1.09 (0.94-1.26)
1.00
1.91 (1.57-2.33)
1.00
0.99 (0.69-1.42)
1.00 (0.70-1.42)
1.09 (0.94-1.26)
1.00
1.91 (1.57-2.33)
1.00
0.99 (0.69-1.42)
1.00 (0.70-1.42)
1.00
1.92 (1.57-2.33)
1.00
1.90 (1.56-2.32)
1.00
1.92 (1.57-2.33)
1.00
1.91 (1.57-2.32)
School-Level Variables
Food Sources in Schools
Cafeteria
Sugared drinks vending
Milk vending
Candy/potato chip vending
School tuck shop/snack bar
1.79 (1.01-3.15)
1.20 (0.76-1.91)
1.15 (0.74-1.77)
1.13 (0.72-1.76)
0.57 (0.36-0.91)
1.79 (1.01-3.15)
1.20 (0.76-1.91)
1.15 (0.74-1.77)
1.13 (0.72-1.76)
0.57 (0.36-0.91)
--
--
--
--
--
--
--
--
--
--
1.30 (0.75-2.28)
1.36 (0.80-2.32)
1.19 (0.77-1.83)
0.76 (0.44-1.30)
0.66 (0.42-1.03)
1.49 (0.88-2.53)
1.37 (0.82-2.28)
1.22 (0.81-1.84)
0.76 (0.45-1.26)
0.68 (0.44-1.05)
Note: Data are presented as odds ratios (95% confidence interval)

80
CHAPTER 5
Identification of the Optimal Geographic Boundary Size to Use When Measuring the Food Retail
Environment Surrounding Schools

81
ABSTRACT
The study objective was to identify the optimal geographic boundary or buffer size to use when
assessing the food retail environment surrounding Canadian schools. We measured the number
of food retailers (fast food restaurants, convenience stores, and cafes) captured by five different
road network buffer sizes (500, 750, 1000, 1500, 2000, and 5000 metres) around 158 schools.
We then used logistic regression to examine associations between the food retailer measures with
the lunchtime eating behaviours of 6,971 students in grades 9-10. The logistic regression model
for the 1000 m buffer provided the best fit. At this distance, students with ≥3 food retailers near
their schools had a 3.42 times the relative odds (95% CI: 2.12-5.52) of eating their lunchtime
meal at a food retailer compared to students with no food retailers near their schools. Future
initiatives directed at the food retail environment surrounding schools should consider using a
1000 m road network buffer.

82
INTRODUCTION
Over the past three decades, the prevalence of childhood and youth obesity has increased
dramatically across the globe [1]. There has been a lack of long-term success with its prevention
via interventions that focus on individual-level factors [2]. This has resulted in a more
comprehensive approach that includes the exploration of food retail environments and their
impact on eating behaviours in young people [3]. The food retail environment refers to the
availability of food retailers such as fast food restaurants, convenience stores and coffee/donut
shops. In general, foods sold at these retailers are of poor nutritional quality [4-6] and excess
consumption of these foods is associated with adverse health outcomes such as obesity and
cardiometabolic diseases [7-10]. For young people, the food environment includes the food
retailers surrounding their homes and schools. Food retailers near schools are readily available to
students [11,12] and relationships with students‟ lunchtime eating behaviours [13] and obesity
[14-16] have been identified.
Research on the food retail environment has used both subjective [17,18] and objective
[19,20] measures. Subjective measures rely on self-reported availability of nearby food retailers.
Objective measures use geographic information systems (GIS) software to map food retailer
addresses within a particular geographic area. Subjective and objective measures of the food
retail environment are poorly related [21], and therefore objective GIS-based measures are
preferred. GIS-based studies have used a variety of boundaries types to capture the food retail
environment including census boundaries [22], ZIP codes [16], circular buffers [14], and road
network buffers [20]. A limitation of pre-existing census and ZIP code boundaries is that they
were designed for administrative purposes and vary considerably in size. Circular buffers
overcome this limitation, but unlike road network buffers, they do not necessarily reflect how

83
people travel from one location to another. Road network-based food retailer measures are more
strongly related to young peoples‟ eating behaviours compared to measures that use circular
buffers [13].
The next methodological issue to address for GIS-based measures of the food retail
environment, as identified in recent literature reviews [3,23], is the appropriate size of the buffer.
Some studies that measured food retail environments around schools [14,24] and homes
[14,20,24,25] addressed this issue by using various buffer sizes. For instance, for the school
environment, Davis and Carpenter [14] found that chain fast food restaurants within 0 to 400 m
and 400 m to 800 m of schools, but not 800 m to 1200 m, were associated with students‟ BMI
values. For the home environment, Laska et al. [24] found that food retailers within 1600 m of
homes, but not 800 m or 3000 m, were associated with adolescents‟ sugar sweetened beverage
intake and obesity. There are important limitations to these studies [14,20,24,25]. None of them
conducted a formal analysis to quantify which buffer distance was the best predictor of eating
behaviours or obesity. Many examined only two buffer sizes that were substantially different in
size [20,24,25]. Finally, studies took place within a single city [24,25] or state [14,20] and are
limited in their representativeness.
The primary objective of this study was to identify the optimal buffer size to use when
studying the relationship between the food retail environment around schools and the eating
behaviour of Canadian students. To achieve this, we measured the food retail environment
surrounding schools using several buffer sizes, and then used regression analysis to examine the
associations between the food retailer measures in each buffer size and the lunchtime eating
behaviours of students. Comparisons of model fit were used to determine the optimal buffer size.
Our study was conducted in a large and diverse sample of students from across Canada.

84
MATERIALS AND METHODS
Overview of Study Design
This study involved a multilevel cross-sectional analysis of schools participating in the
2009/2010 Canadian Health Behaviour in School-aged Children (HBSC) survey. Addresses of
food retailers surrounding schools were gathered using an online food retailer database. Numbers
of food retailers surrounding each school were obtained for the following road network-based
buffers: 500 m, 750 m, 1000 m, 1500 m, 2000 m and 5000 m. Associations between the presence
of food retailers and students‟ reports of eating their lunch at a food retailer were then assessed.
Study Sample
The 2009/2010 HBSC survey involved 26,078 students from 436 schools across Canada
and collected information on a variety of health behaviours in students in grades 6 to 10
(approximate ages 11-16 years). Classes were the primary sampling unit, and they were stratified
by province, with an oversampling of some provinces and the three northern territories. Two
Canadian provinces with small populations (New Brunswick and Prince Edward Island) were
unable to participate in the 2009/2010 survey. The HBSC survey also excludes students in
private schools, incarcerated youth, special needs schools and students who are home schooled.
Ethics approval was obtained from the Queen‟s University Health Sciences & Affiliated
Teaching Hospitals Research Ethics Board. Subject consent was obtained at the school board and
school levels, as well as from parents or guardians (either explicitly or implicitly, as determined
by school board policy). See Appendix A for more information on the ethics approvals for this
Manuscript.
In the current analysis, the sample was restricted to the 169 schools where students were
permitted to leave school grounds, making it possible for them to purchase food at nearby food

85
retailers. Because only 1.1% of grade 6 to 8 students reported the study outcome (regularly
eating their lunch at food retailers), they were excluded from the analysis, leaving 8,439 students
from the 169 schools. Due to missing information on food sources within schools or in the
school neighborhoods, 528 additional students from 11 schools were excluded. An additional
940 students were excluded because of missing data on key variables. The final analyses
involved 6,971 students from 158 schools.
School Food Retail Environment
The addresses of the 158 eligible HBSC schools were mapped in ArcGIS (ESRI, version
9.3) and road network-based buffers were constructed using the following distances: 500 m, 750
m, 1000 m, 1500 m, 2000 m and 5000 m. These distances were selected based upon existing
precedents [19,20,26-28]. Road network-based buffers were chosen instead of circular buffers
because they are a better measure of the food retail environment surrounding schools [13]. The
road network buffers were created using a commercial road network database provided by
CanMaps Streetfiles (DMTI Spatial Inc., v.2009.4, Markham ON). Roads extending outwards
from schools were followed until they reached their specified endpoint. Lines connecting the
endpoints were used to create the border of the road network-based buffers. See the Figure for an
illustration of the multiple road network buffers used in this study.
Convenience stores, fast food restaurants, and coffee/donut shops were included to
develop the primary independent variable of interest. These directly corresponded to the
lunchtime eating question used to determine the study outcome. Addresses of these specific types
of food retailers were obtained using an online Yellow Pages directory (www.yellowpages.ca).
The Yellow Pages database was chosen because it provided the most accurate information
available on food retailer locations [29]. School addresses were entered into the Yellow Pages

86
directory. The search term „convenience stores‟ was used to obtain convenience store addresses.
There was no single search term to use for fast food restaurants and coffee/donut shops because
many of them were listed under the full service restaurant category. Therefore, we searched for
the top chain food retailers, as has been done in previous studies [28,30]. The top 75% of the top
200 chain food retailers for Canada in 2009 used in this study were obtained from Technomic Inc
[31], and are available upon request. Appendix F provides a detailed description of the methods
used to collect food retailer addresses and map their locations.
All food retailers within the road network buffers were mapped using ArcGIS software.
The mapping procedure in ArcGIS provided a score evaluating the accuracy of each mapped
location. For food retailers whose street addresses had a score of less than 80%, the Street View
tool in Google Earth (©2011 Google) was used to confirm the location and obtain latitude and
longitude coordinates to map them manually in ArcGIS if necessary. Because the number of
food retailers within the buffers was positively skewed, they were categorized into groups. All
categories were based on thresholds established for the 500 m network buffer size. At this
distance, 74% of schools had no nearby food retailers (categorized as “none”), and the remaining
26% were categorized as having “1 or more” food retailers. For the remaining buffer sizes, a
“none” category was created, a threshold of the top ~26% was used to denote the category with
the highest number of food retailers. The thresholds for the middle categories were created in a
manner which ensured an approximate equal number of schools within each category.
Lunchtime Eating Outcome
The outcome of this study was obtained from the response to the following question:
“Where do you usually eat your lunch or mid-day meal on school days?”. Students who chose
the response “snack-bar, fast-food restaurant, café” were considered to regularly purchase their

87
lunch from food retailers. Those who chose the remaining responses (“at school”, “at home”,
“at someone else’s house”, “do not eat lunch/mid-day meal”, or “other”) were classified as
those who did not typically obtain their lunch from food retailers. To see the HBSC survey
questions used in this analysis, see Appendix C.
Confounders
Potential confounders were considered at both the individual- and school-levels.
Individual-level variables, including age, sex, and socioeconomic status were considered as
potential confounders, since fast food consumption varies by these characteristics [6,32,33]. To
obtain information on socioeconomic status, the HBSC survey uses the previously validated
family affluence scale (FAS) [34]. In addition, because cafeterias, vending machines, and school
snack/tuck shops are associated with students‟ eating behaviors at school [35-37], they were
considered as potential school-level confounders.
Regression Analysis
All analyses were conducted using SAS statistical software, version 9.2 (SAS Institute,
Cary, NC). Multilevel logistic regression was carried out to examine the relationship between the
presence of food retailers near schools (convenience stores, fast food restaurants and
coffee/donut shops) and the likelihood of students eating their lunch at these food retailers. For
each buffer size, the multivariate model building process began with the introduction of the
individual-level confounders and proceeded using a backwards elimination approach. Next, the
school-level food exposure variables were forced into the model because we were interested in
accounting for food sources within the schools as well as those surrounding schools.

88
Goodness-of-Fit
The Akaike information criterion (AIC), which is a measure of goodness-of-fit when
comparing two or more regression models, was determined for the final multivariate models. The
AIC value is derived using likelihood theory rather than the more commonly used least squares
theory. Likelihood theory estimates the likelihood of an unknown parameter, given the data at
hand and a particular model [38]. The AIC value of a model is equal to -2 Log likelihood + 2K,
where K is the number of parameters in the model, including the intercept and the variance [38].
It is an estimate of the expected relative distance between a fitted model and an unknown “true
mechanism” that generated the observed data. The advantage of the AIC goodness-of-fit value is
that the models that are compared do not have to be nested. Rather, the key condition for
comparing AIC scores across candidate models is that the models must be obtained from the
same data set.
To interpret the AIC values from a set of candidate models, it is not the absolute values
of the AIC scores that matter, but rather the difference between them. A lower AIC value
indicates better model fit and a difference in AIC values of between 2 to 7 indicates a moderate
difference in fit of the models, while a difference of 7 or more indicates a large difference in
model fit [38]. The difference in AIC scores can be used to obtain the likelihood of each model
relative to the likelihood of the total set of models. This can be used to calculate Akaike‟s
weight, which expresses the probability that a particular model is the best choice among a set of
candidate models based on model fit [38].
The AIC values and Akaike‟s weights were determined for the original food retailer
exposure categories, which differed across buffer sizes. The larger buffer sizes had broader
categories of exposure. For example, the 500 m buffer had categories of 0 and 1 or more, while

89
the 1500 m buffer had categories of 0, 1-2, 3-4, 5-6 and 7 or more food retailers. Since the
differences in AIC scores may reflect the influence of changing the category sizes in addition to
changing the buffer sizes, the regression analyses were repeated using identical exposure
categories for all other buffer sizes. The AIC values were then reassessed using the same
categorization approach as the 1000 m buffer, since it was near the midpoint of the series of
buffer sizes and is a reasonable distance to walk during the time allotted for lunch at school.
RESULTS
The median number of student respondents per school was 37 (interquartile range: 23-
55). Table 1 shows the school- and student-level characteristics. Nearly 40% of the schools were
located in large metropolitan centres and 59.5% were secondary schools schools (limited to
grades 9 to 12). There was an approximately equal distribution of males and females and only
8.0% of the study sample was in the lowest family affluence group. Of the respondents who self-
reported their height and weight, 19.6% were overweight or obese according to the International
Obesity Task Force body mass index criteria [39]. During the school week, the majority of
students typically ate their lunch either at school (67.7%), at home (15.2%), or in a snack bar,
fast food restaurant, or café (7.4%).
Table 2 describes the quantity of food retailers within the various buffer sizes. Very few
food retailers were obtained within the smallest buffers; only 88 food retailers were located
within 500 m buffers for the 158 schools in this study. The median number of food retailers
ranged from 0 to 13 across the buffer sizes, and median values were greater than zero for buffers
of 1000 m and larger.

90
Results of the multilevel logistic regression examining the relationship between the
number of food retailers in each buffer and students‟ lunchtime eating behaviours are shown in
Table 3. Model 1 shows the bivariate relationships, model 2 controlled for individual-level
covariates, and model 3 controlled for individual- and school-level covariates. The left hand side
of the table shows the results of the regression when using the different categories of food
retailers, whereby broader categories were used for the larger buffer sizes. The strongest
relationship appeared to be for the 1000 m buffer, where students who had 3 or more food
retailers within 1000 m of their schools had 3.42 times (95% CI: 2.12-5.52) the relative odds of
eating lunch at a food retailer compared to students with no food retailers within 1000 m. The
smallest two buffer sizes also showed relationships with lunchtime eating behaviours. At buffer
sizes greater than 1000 m, these relationships were weaker and, with a couple of exceptions,
were not statistically significant (exceptions: 7-10 and 11 or more food retailers for the 2000 m
buffer). The right hand side of the table shows the same analysis approach, but with identical
food retailer exposure categories for all buffer sizes. The results are similar to the analysis with
the different sized exposure categories.
The AIC-related values comparing goodness-of-fit between the final regression models
(Model 3 in Table 3) for the different buffer sizes are shown in Table 4. AIC values were
calculated for the models which used different food retailer exposure categories as well as the
models which used identical food retailer exposure categories for all buffer sizes. For the models
with differing exposure categories, the 1000 m buffer had the lowest AIC value (3344). The
difference in AIC values between the 1000 m buffer model and all remaining models was greater
than the threshold value of 7, which indicated that there was a substantially better model fit for
the 1000 m buffer. Results from the Akaike‟s weights showed there was a 98.8% probability that

91
the 1000 m street network buffer provided the best fit. The AIC values for the differing and
identical food retailer exposure categories were quite similar, indicating that the 1000 m road
network buffer consistently fit the data better, regardless of the food retailer categorization
approach.
DISCUSSION
This study demonstrated that the 1000 m road network buffer provided the best fit for the
eating behaviour outcome among the six candidate models with varying buffer sizes. Based upon
an average walking speed of 4-5 km/hour in adolescents [40], this is a distance that could be
walked in approximately 10-15 minutes. At distances less than 1000 m, less than half of the
schools had at least one food retailer present, suggesting these buffers were too small to capture a
sufficient number of food retailers. Distances greater than 1000 m may be perceived by students
as being too far for them to travel during the time allotted for their lunch break.
Our findings that food retailers measured in 500 m, 750 m, and 1000 m road network
buffers around schools were associated with student‟s eating behaviours corresponded to
observations by Davis and Carpenter [14]. They observed that chain fast food restaurants within
0 to 400 m and 400 m to 800 m of schools were associated with students‟ BMI values. An
advantage of our study is that it used model fit criteria to determine that the 1000 m buffer size
was optimal. It is important to note that the optimal buffer size of 1000 m for schools may differ
from non-school settings. Studies of the food retail environment surrounding peoples‟ homes
have provided mixed results, with two suggesting that a relatively small (i.e., 400 to 800 m)
buffer size may be the most meaningful [20, 25], and one study suggesting that larger (i.e., 1600
m) buffer sizes may be most meaningful [24].

92
Results from this study provide important evidence regarding the appropriate buffer size
to use when measuring the food environment surrounding schools. Namely, using a buffer that is
either too large or too small may obscure relationships with eating outcomes and result in
weakened study findings. Furthermore, having a standardized buffer size measure in studies
examining the food retail environment surrounding schools will enhance comparability across
studies. Finally, results from studies such as this one are needed to inform the implementation
and evaluation of policies aimed at optimizing the built environment surrounding schools.
Specifically, our findings suggest that policies that limit the number of food retailers around
schools should consider a 1000 m distance and a maximum of 2 fast food restaurants,
coffee/donut shops, and/or convenience stores. More than one quarter (28.4%) of the schools
studied here would be affected by such a policy.
This study has some key strengths and limitations that warrant consideration. Key
strengths include the large and geographically diverse study sample, the wide variety of buffer
sizes, and the use of goodness-of-fit statistics to assess the relative contribution of each buffer
size to model fit. A key limitation was that the GIS database used to obtain information on the
food retail environment does not provide a completely accurate measure of the food retail
environment. Furthermore, for practical reasons, only the top chain fast food restaurants and
donut/coffee shops were included in the food retail environment measures. In addition, the
survey data were obtained by self-report and this may introduce bias due to the social desirability
of eating healthy foods. Finally, the cross-sectional nature of this study made it impossible to
directly assess temporality between the presence of food retailers and eating behaviours.
However, it is unlikely that students chose to attend schools based on the presence of nearby
food retailers.

93
CONCLUSIONS
The results from this study indicated that the optimal road network buffer distance when
assessing the food retail environment surrounding Canadian schools was 1000 m. Future studies
investigating the school food retail environment should consider using street network buffers of
this size. Having a consistent buffer size across studies will not only help inform policies and
interventions directed at the modification of the food retail environment surrounding schools, but
will also help facilitate comparisons across studies.
COMPETING INTERESTS STATEMENT
The authors declare that they have no competing interests.
ACKNOWLEDGEMENTS
The authors of this study would like to thank Mariane Héroux, Rachel Laxer and Hoda
Gharib for their assistance in the collection of the food retailer addresses. The 2009/10 Health
Behaviour in School-aged Children Survey (HBSC), a World Health Organization/European
Region collaborative study, was funded in Canada by the Public Health Agency of Canada and
Health Canada. This study was funded by an operating grant from the Canadian Institutes of
Health Research (MOP 97962), and a second operating grant co-funded by the Canadian
Institutes of Health Research and the Heart and Stroke Foundation of Canada (PCR 101415). In
addition, Laura Seliske was supported by a Frederick Banting and Charles Best Doctoral
Research Award from the Canadian Institutes of Health Research. Ian Janssen was supported by
a Canada Research Chair and an investigator award from the Ontario Ministry of Research and
Innovation. The principal investigators of the 2009/10 Canadian HBSC survey were John

94
Freeman and William Pickett, and the HBSC Survey is coordinated internationally by Candace
Currie (University of Edinburgh).

95
References
1. Popkin BM, Gordon-Larsen P: The nutrition transition: worldwide obesity dynamics and
their determinants. Int J Obes Relat Metab Disord 2004;28 Suppl 3:S2-9.
2. Summerbell CD, Waters E, Edmunds LD, Kelly S, Brown T, Campbell KJ: Interventions
for preventing obesity in children. Cochrane Database Syst Rev 2005:CD001871.
3. Casey R, Oppert JM, Weber C, Charreire H, Badariotti D, Banos A, Fischler C,
Giacoman Hernandez C, Chaix B, Simon C: Determinants of childhood obesity: What
can we learn from built environment studies? . Food Qual Prefer. In Press.
4. Paeratakul S, Ferdinand DP, Champagne CM, Ryan DH, Bray GA: Fast-food
consumption among US adults and children: dietary and nutrient intake profile. J Am
Diet Assoc 2003;103:1332-1338.
5. Pereira MA, Kartashov AI, Ebbeling CB, Van Horn L, Slattery ML, Jacobs DR, Jr.,
Ludwig DS: Fast-food habits, weight gain, and insulin resistance (the CARDIA study):
15-year prospective analysis. Lancet 2005;365:36-42.
6. Bowman SA, Gortmaker SL, Ebbeling CB, Pereira MA, Ludwig DS: Effects of fast-food
consumption on energy intake and diet quality among children in a national household
survey. Pediatrics 2004;113:112-118.
7. Bradlee ML, Singer MR, Qureshi MM, Moore LL: Food group intake and central obesity
among children and adolescents in the Third National Health and Nutrition Examination
Survey (NHANES III). Public Health Nutr 2010;13:797-805.
8. Berkey CS, Rockett HR, Field AE, Gillman MW, Colditz GA: Sugar-added beverages
and adolescent weight change. Obes Res 2004;12:778-788.

96
9. Lindquist CH, Gower BA, Goran MI: Role of dietary factors in ethnic differences in early
risk of cardiovascular disease and type 2 diabetes. Am J Clin Nutr 2000;71:725-732.
10. Taveras EM, Berkey CS, Rifas-Shiman SL, Ludwig DS, Rockett HR, Field AE, Colditz
GA, Gillman MW: Association of consumption of fried food away from home with body
mass index and diet quality in older children and adolescents. Pediatrics 2005;116:e518-
524.
11. Austin SB, Melly SJ, Sanchez BN, Patel A, Buka S, Gortmaker SL: Clustering of fast-
food restaurants around schools: a novel application of spatial statistics to the study of
food environments. Am J Public Health 2005;95:1575-1581.
12. Day PL, Pearce J: Obesity-promoting food environments and the spatial clustering of
food outlets around schools. Am J Prev Med 2011;40:113-121.
13. Seliske LM, Janssen I, Rosu A, Pickett W: Food retailers surrounding schools and
lunchtime eating behaviours of students. J Nutr Metab. Submitted.
14. Davis B, Carpenter C: Proximity of fast-food restaurants to schools and adolescent
obesity. Am J Public Health 2009;99:505-510.
15. Howard PH, Fitzpatrick M, Fulfrost B: Proximity of food retailers to schools and rates of
overweight ninth grade students: an ecological study in California. BMC Public Health
2011;11:68.
16. Powell LM, Auld MC, Chaloupka FJ, O'Malley PM, Johnston LD: Associations between
access to food stores and adolescent body mass index. Am J Prev Med 2007;33:S301-
307.

97
17. Casey AA, Elliott M, Glanz K, Haire-Joshu D, Lovegreen SL, Saelens BE, Sallis JF,
Brownson RC: Impact of the food environment and physical activity environment on
behaviors and weight status in rural U.S. communities. Prev Med 2008;47:600-604.
18. Inagami S, Cohen DA, Finch BK, Asch SM: You are where you shop: grocery store
locations, weight, and neighborhoods. Am J Prev Med 2006;31:10-17.
19. Leatherdale ST, Pouliou T, Church D, Hobin E: The association between overweight and
opportunity structures in the built environment: a multi-level analysis among elementary
school youth in the PLAY-ON study. Int J Public Health 2011;56:237-246.
20. Leung CW, Laraia BA, Kelly M, Nickleach D, Adler NE, Kushi LH, Yen IH: The
influence of neighborhood food stores on change in young girls' body mass index. Am J
Prev Med 2011;41:43-51.
21. Williams LK, Thornton L, Ball K, Crawford D: Is the objective food environment
associated with perceptions of the food environment? Public Health Nutr 2011:1-8.
22. Fraser LK, Edwards KL: The association between the geography of fast food outlets and
childhood obesity rates in Leeds, UK. Health Place 2010;16:1124-1128.
23. Fleischhacker SE, Evenson KR, Rodriguez DA, Ammerman AS: A systematic review of
fast food access studies. Obes Rev 2011;12:e460-471.
24. Laska MN, Hearst MO, Forsyth A, Pasch KE, Lytle L: Neighbourhood food
environments: are they associated with adolescent dietary intake, food purchases and
weight status? Public Health Nutr 2010;13:1757-1763.
25. Spence JC, Cutumisu N, Edwards J, Raine KD, Smoyer-Tomic K: Relation between local
food environments and obesity among adults. BMC Public Health 2009;9:192.

98
26. Jennings A, Welch A, Jones AP, Harrison F, Bentham G, van Sluijs EM, Griffin SJ,
Cassidy A: Local food outlets, weight status, and dietary intake: associations in children
aged 9-10 years. Am J Prev Med 2011;40:405-410.
27. Seliske LM, Pickett W, Boyce WF, Janssen I: Association between the food retail
environment surrounding schools and overweight in Canadian youth. Public Health Nutr
2009;12:1384-1391.
28. Crawford DA, Timperio AF, Salmon JA, Baur L, Giles-Corti B, Roberts RJ, Jackson ML,
Andrianopoulos N, Ball K: Neighbourhood fast food outlets and obesity in children and
adults: the CLAN Study. Int J Pediatr Obes 2008;3:249-256.
29. Seliske LM, Pickett W, Bates R, Janssen I: Field validation of food retailer listings: a
comparison of online and commercial GIS databases. Submitted.
30. Alter DA, Eny K: The relationship between the supply of fast-food chains and
cardiovascular outcomes. Can J Public Health 2005;96:173-177.
31. Technomic. Top 200 Canadian Chain Restaurant Report. Chicago, IL: Technomic Inc;
2010.
32. French SA, Story M, Neumark-Sztainer D, Fulkerson JA, Hannan P: Fast food restaurant
use among adolescents: associations with nutrient intake, food choices and behavioral
and psychosocial variables. Int J Obes Relat Metab Disord 2001;25:1823-1833.
33. Campbell K, Crawford D, Jackson M, Cashel K, Worsley A, Gibbons K, Birch LL:
Family food environments of 5-6-year-old-children: does socioeconomic status make a
difference? Asia Pac J Clin Nutr 2002;11 Suppl 3:S553-561.

99
34. Currie C, Molcho M, Boyce W, Holstein B, Torsheim T, Richter M: Researching health
inequalities in adolescents: the development of the Health Behaviour in School-Aged
Children (HBSC) family affluence scale. Soc Sci Med 2008;66:1429-1436.
35. Briefel RR, Crepinsek MK, Cabili C, Wilson A, Gleason PM: School food environments
and practices affect dietary behaviors of US public school children. J Am Diet Assoc
2009;109:S91-107.
36. Kubik MY, Lytle LA, Hannan PJ, Perry CL, Story M: The association of the school food
environment with dietary behaviors of young adolescents. Am J Public Health
2003;93:1168-1173.
37. Park S, Sappenfield WM, Huang Y, Sherry B, Bensyl DM: The impact of the availability
of school vending machines on eating behavior during lunch: the Youth Physical Activity
and Nutrition Survey. J Am Diet Assoc 2010;110:1532-1536.
38. Burnham KP, Andersen LB: Model Selection and Multimodel Inference: A Practical
Information-Theoretic Approach. New York, Springer, 2002.
39. Cole TJ, Bellizzi MC, Flegal KM, Dietz WH: Establishing a standard definition for child
overweight and obesity worldwide: international survey. BMJ 2000;320:1240-1243.
40. Oberg T, Karsznia A, Oberg K: Basic gait parameters: reference data for normal subjects,
10-79 years of age. J Rehabil Res Dev 1993;30:210-223.

100
Figure. An illustration of the road-network buffer sizes used to measure the food environment.
The school is in the centre of the figure and is surrounded by increasing buffer sizes, including:
500 m, 750 m, 1000 m, 1500 m, 2000 m. The 5000 m buffer is omitted due to its large size.
500 m
750 m
1000 m
1500 m
2000 m

101
Table 1. Characteristics of the study sample participating in the 2009/2010 Health Behaviour
in School-aged Children Survey
N %
School-Level Variables
School Type
Secondary (grades 9 - 12)
Mixed
Urban Rural Status
Large urban centre (≥100,000 people) Medium urban centre (20,000 - 99,999)
Small urban centre (1,000 - 19,000)
Rural (<1,000)
94
64
62
15
38
43
59.5
40.5
39.2
9.5
24.1
27.2
Individual-Level Variables
Sex
Male
Female
Age (years)
13
14
15
16
Family Affluence Scale
Low
Moderate
High
Weight Status
Non-overweight
Overweight
Obese
Missing Data
Where Students Eat Mid-day Meal
At school
At home
In a snack bar, fast food restaurant or café
Never eat a midday meal
Somewhere else
At someone else‟s home
3381
3590
33
2339
3280
1319
560
2531
3880
4823
1018
346
784
4719
1056
517
307
209
163
48.5
51.5
0.5
33.6
47.1
18.9
8.0
36.3
55.7
69.2
14.6
5.0
11.3
67.7
15.2
7.4
4.4
3.0
2.3

102
Table 2. The distribution of food retailers within the various buffer sizes surrounding 158
schools from the 2009/2010 Health Behaviour in School-aged Children Survey
Buffer Size Total Number
of Food
Retailers
Minimum 25th
Percentile
50th
Percentile
75th
Percentile
Maximum
500 m
750 m
1000 m
1500 m
2000 m
5000 m
88
193
349
768
1279
4798
0
0
0
0
0
0
0
0
0
0
1
1
0
0
1
3
6
13
1
2
3
7
12
43
7
9
15
27
53
275

103
Table 3. Relationship between the presence of food retailers near schools and students eating lunch during the school week at a café, fast food restaurant or
snack bar according to various buffer sizes: different vs. identical exposure categories
No. of
Food
Retailers
No. of
Schools
(%)
Odds Ratio (95% Confidence Interval) No. of
Food
Retailers
No. of
Schools
(%)
Odds Ratio (95% Confidence Interval)
Model 1 Model 2 Model 3 Model 1 Model 2 Model 3
500 m
None
≥ 1
750 m
None
1
≥ 2
1000 m
None
1-2
≥ 3
1500 m
None
1-2
3-4
5-6
≥ 7
2000 m None
1-3
4-6
7-10
≥ 11
5000 m
None
1-9
11-19
20-29
30-39
≥ 40
117 (74.1)
41 (25.9)
89 (56.3)
26 (16.5)
43 (27.2)
62 (39.2)
51 (32.3)
45 (28.4)
43 (27.2)
25 (15.8)
20 (12.7)
26 (16.5)
44 (27.8)
34 (21.5)
28 (17.7)
25 (15.8)
22 (13.9)
45 (28.5)
30 (19.0)
35 (22.2)
31 (19.6)
11 (7.0)
11 (7.0)
40 (25.3)
1.00
2.15 (1.38-3.36)
1.00
1.44 (0.82-2.54)
2.84 (1.81-4.47)
1.00
1.24 (0.76-2.02)
3.49 (2.17-5.61)
1.00
1.21 (0.60-2.45)
1.45 (0.71-2.97)
1.88 (0.97-3.64)
3.06 (1.72-5.44)
1.00
1.34 (0.64-2.83)
1.50 (0.71-3.19)
2.37 (1.16-4.87)
2.56 (1.33-4.93)
1.00
1.39 (0.65-2.95)
1.65 (0.77-3.51)
2.04 (0.75-5.57)
2.22 (0.82-6.00)
2.09 (1.02-4.29)
1.00
2.20 (1.40-3.46)
1.00
1.50 (0.84-2.66)
2.90 (1.83-4.60)
1.00
1.25 (0.76-2.06)
3.55 (2.19-5.76)
1.00
1.20 (0.59-2.45)
1.43 (0.69-2.97)
1.91 (0.98-3.74)
3.13 (1.75-5.62)
1.00
1.32 (0.62-2.82)
1.54 (0.72-3.30)
2.43 (1.17-5.04)
2.57 (1.32-5.02)
1.00
1.38 (0.64-2.96)
1.69 (0.78-2.65)
2.01 (0.72-5.57)
2.18 (0.79-6.01)
2.11 (1.02-4.38)
1.00
2.27 (1.46-3.52)
1.00
1.40 (0.79-2.48)
2.74 (1.75-4.29)
1.00
1.20 (0.74-1.95)
3.42 (2.12-5.52)
1.00
1.22 (0.59-2.53)
1.37 (0.66-2.88)
1.85 (0.94-3.65)
2.96 (0.64-5.34)
1.00
1.38 (0.65-2.96)
1.50 (0.67-3.34)
2.28 (1.07-4.86)
2.48 (1.23-5.02)
1.00
1.26 (0.58-2.77)
1.48 (0.66-3.33)
1.94 (0.67-5.61)
1.95 (0.70-5.45)
1.81 (0.83-3.97)
500 m
None
1-2
≥ 3
750 m
None
1-2
≥ 3
1000 m
None
1-2
≥ 3
1500 m
None
1-2
≥ 3
2000 m
None
1-2
≥ 3
5000m
None
1-2
≥ 3
117 (74.1)
29 (18.4)
12 (7.6)
89 (56.3)
37 (23.4)
32 (20.3)
62 (39.2)
51 (32.3)
45 (28.5)
43 (27.2)
25 (15.8)
90 (57.0)
34 (21.5)
23 (14.6)
101 (63.9)
30 (19.0)
17 (10.8)
111 (70.3)
1.00
1.86 (1.12-3.09)
2.99 (1.48-6.06)
1.00
1.64 (1.00-2.67)
3.11 (1.91-5.09)
1.00
1.24 (0.76-2.02)
3.49 (2.17-5.61)
1.00
1.22 (0.59-2.50)
2.30 (1.34-3.92)
1.00
1.07 (0.47-2.30)
2.24 (1.23-4.10)
1.00
1.14 (0.45-2.89)
1.88 (0.98-3.61)
1.00
1.89 (1.13-3.17)
3.08 (1.50-6.31)
1.00
1.69 (1.03-2.79)
3.18 (1.93-5.24)
1.00
1.25 (0.76-2.06)
3.55 (2.19-5.76)
1.00
1.21 (0.58-2.51)
2.33 (1.35-4.02)
1.00
1.04 (0.46-2.36)
2.27 (1.23-4.19)
1.00
1.12 (0.44-2.89)
1.90 (0.98-3.67)
1.00
1.98 (1.20-3.27)
3.05 (1.53-6.06)
1.00
1.61 (0.99-2.63)
2.99 (1.83-4.88)
1.00
1.20 (0.74-1.95)
3.42 (2.12-5.52)
1.00
1.28 (0.60-2.70)
2.26 (1.25-3.29)
1.00
1.08 (0.48-2.45)
2.32 (1.21-4.46)
1.00
1.15 (0.45-2.92)
1.66 (0.81-3.42)
Model 1 is the bivariate analysis
Model 2 controlled for individual-level covariates (sex)
Model 3 controlled for individual-level covariates (sex) and area-level covariates (presence of following at school: cafeteria, sugared drinks vending, milk
vending, candy/potato chip vending, tuck/snack shop)

104
Table 4. Comparison of AIC values, relative likelihood, and Akaike‟s weights
across various buffer sizes: different vs. identical exposure categories
Buffer Size AIC
value
AIC vs.
1000 m
distance
Relative
Likelihood
e (-0.5 x AIC )
Akaike’s
Weight
(%)
Different Exposure
Categories
500 m
750 m
1000 m
1500 m
2000 m
5000 m
Total
3356.64
3353.12
3343.87
3360.21
3366.72
3373.94
12.77
9.25
0
16.34
22.85
30.07
0.00169
0.00980
1.00000
0.00028
0.00001
0.00000
1.01178
0.167
0.969
98.836
0.028
0.000
0.000
100
Identical Exposure
Categories 500 m
750 m
1000 m
1500 m
2000 m
5000 m
Total
3357.46
3353.11
3343.87
3362.14
3362.26
3368.93
13.59
9.24
0
18.27
18.39
25.06
0.00112
0.00985
1.00000
0.00011
0.00010
0.00000
1.01119
0.111
0.974
98.894
0.011
0.010
0.000
100

105
CHAPTER 6
Urban Sprawl and its Relationship with Active Transportation, Physical Activity and Obesity in
Canadian Youth

106
ABSTRACT
Introduction: Urban sprawl is a potential environmental factor associated with youth
overweight/obesity. Little is known about the association between urban sprawl and the
behavioural determinants of obesity among young people, including physical activity and active
transportation. Furthermore, existing studies of this relationship are limited in geographic scope
Methods: The study population consisted of 7,017 youth (aged 12-19 years) from Canada‟s 33
census metropolitan areas (CMAs) who participated in the 2007-2008 Canadian Community
Health Survey. Factor analysis was used to obtain an urban sprawl score for each CMA,
incorporating dwelling density, percentage of single or detached dwelling units, and percentage
of the population living in the urban core. Multilevel logistic regression examined whether urban
sprawl was associated with frequent active transportation (≥30 minutes/day), moderate-to-
vigorous physical activity (MVPA, ≥60 minutes/day) and overweight/obesity.
Results: Urban sprawl was not associated with active transportation in 16 to 19 year olds.
However, a positive association for active transportation was observed in 12 to 15 year olds, with
a relative odds of engaging in frequent active transportation of 1.24 (95% CI: 1.10-1.39) for each
standard deviation (SD) increase in the urban sprawl score. Within the entire sample, higher
urban sprawl levels were significantly associated with MVPA (odds ratio per SD increase = 1.10,
95% CI: 1.01-1.20) but not overweight/obesity (odds ratio per SD increase = 1.06, 95% CI: 0.94-
1.18).
Conclusions: Urban sprawl was associated with active transportation and MVPA in Canadian
youth, although in the opposite direction to what has previously been reported in the adult
literature.
107
INTRODUCTION
Over the past 30 years, the prevalence of overweight and obesity has increased
dramatically, nearly tripling among Canadian youth aged 12 to 17 years [1]. This is of concern
because of the many physical, mental, and social health problems associated with obesity in
young people [2-6]. Furthermore, obesity tracks strongly as people age, with 60 to 90% of obese
adolescents remaining obese into adulthood [7]. It is important to develop a comprehensive
understanding of the determinants of obesity to develop effective public health strategies. A lack
of moderate-to-vigorous physical activity (MVPA) is a known determinant of obesity [8-11], and
researchers are now interested in studying features of the surrounding environment that influence
obesity via mechanisms that inhibit MVPA [12].
Urban sprawl is one potential feature of the environment that may influence obesity. It is
a pattern of development whereby metropolitan areas extend over a large geographic region [13].
This pattern of development can make it difficult to travel between destinations by walking or
cycling, which can lead to greater driving and commute times and hence less physical activity
[14,15]. Evidence from two studies suggests there is an association between urban sprawl and
obesity and its causal behaviours in American adolescents [16,17]. Ewing et al. [16] found that
12 to 17 year olds living in a county with greater than average urban sprawl had a 16% (95% CI:
2-31%) increased likelihood of being overweight or obese compared to those who lived in a
county with less than average urban sprawl. Similarly, in a study of 8th
and 10th
grade youth,
Slater et al. [17] found that those living in areas with a lower than average urban sprawl had an
11.8% lower prevalence of obesity, but they found no association with MVPA.
Since higher urban sprawl may influence obesity through a greater reliance on
automobiles for travel and increased time spent driving, it is important to consider the role of
108
driving age on the association between urban sprawl and the behavioural determinants of obesity.
Trowbridge et al. [18] found that youth living in sprawling counties were more than twice as
likely to drive >32 km per day than youth living in compact counties. This evidence supports the
existence of an association between urban sprawl and driving patterns. However, youth who do
not yet have a driver‟s license may not be influenced by the same driving patterns. Instead, they
may be more reliant on physically active modes of transportation such as cycling and walking.
Few studies of young people have examined the potential moderating role of driving age, which
may have an impact on the associations between urban sprawl and obesity-related behaviours.
Large gaps in knowledge exist surrounding the association between urban sprawl and
obesity-related outcomes in youth. Existing studies have been limited to youth from the United
States and there is a need for a more generalizable evidence base. Furthermore, the inclusion of
active transportation as an outcome may provide a greater understanding of mechanisms
surrounding the association between urban sprawl, MVPA, and obesity in youth. It is expected
that the more compact a metropolitan area is, the higher the likelihood of engaging in active
transportation. The potential moderating role of driving age also requires consideration.
The primary objective of this study was to examine the association between urban sprawl
and the outcomes of: (1) overweight/obesity, (2) MVPA, and (3) active transportation in a large
sample of youth residing in Canada‟s metropolitan areas. A secondary objective was to examine
the role of driving age as a possible moderator of these associations. This study is important from
a public health perspective because it may improve our understanding of the broader
environment in which health behaviours occur. Given the negligible impact of interventions that
solely focus on changing an individual‟s behaviours [19-21], there is a need to recognize the
importance of modifying our surrounding environments to facilitate healthy behaviours. Sixty

109
eight percent of the Canadian population live within census metropolitan areas (CMAs) [22],
which are large urban centres with a population of 100,000 people or more. Therefore, even
modest changes in features of the built environment within large urban centres have the potential
to affect many people.
METHODS
Study Design
The study consisted of a multi-level cross-sectional analysis and examined the
associations between urban sprawl, obesity, and obesity-related behaviours in 12-19 year old
youth from Canada‟s 33 CMAs. Individual-level data on obesity, MVPA, active transportation,
and socio-demographic characteristics were obtained from a general health survey. Urban
sprawl and climate data were obtained for each CMA. The individual- and area-level data were
linked based upon the CMA identifier for each survey participant.
Study Sample
The study sample was obtained from the annual component of the 2007-2008 Canadian
Community Health Survey (CCHS). The CCHS is a large nationally representative cross-
sectional survey that collects information related to the determinants of health for Canadians 12
years of age and older [23]. The data collection protocol involved use of a complex sampling
strategy to ensure that the sample was representative of the health regions within all provinces
and territories. For more detailed information on the CCHS methodology, see Appendix D.
Demographic and health information was obtained from the survey, and the analysis was
restricted to respondents 12 to 19 years old. Since urban sprawl primarily applies to larger

110
metropolitan areas [13], only respondents living in CMAs were included in the present study.
For information on ethics approval for this manuscript, see Appendix A.
Outcomes
Self-reported heights and weights were obtained in the CCHS, and these were used to
calculate the body mass index (BMI, weight in kg / height in m2) for each participant. For 18
and 19 year olds, adult BMI thresholds of <25 kg/m2 (non-overweight), 25-29.9 kg/m
2
(overweight), and ≥30 kg/m2 (obese) were used to determine weight status. For respondents 12-
17 years of age, the age- and sex-specific International Obesity Task Force pediatric BMI
thresholds [24], which correspond to adult thresholds, were used to determine weight status.
Overweight and obese categories were combined into one group for the regression analyses. For
more detailed information on key variables of the CCHS used in this manuscript, see Appendix
E.
The CCHS respondents were asked to report the typical frequency of their engagement in
common physical activities, by indicating the number of times they participated in the activity
over the past 3 months (90 days) and choosing the appropriate category of duration. The
midpoints of the duration categories, which were obtained from the CCHS derived variable
documentation [25], were used to estimate the total number of minutes for each activity over the
90 days. The average daily duration of the activity was calculated multiplying the frequency and
duration and dividing this by 90.
Total MVPA was comprised of all activities, while active modes of transportation were
limited to walking, cycling, and rollerblading to work or school, or for leisure purposes. For
MVPA, respondents were placed into two groups based upon whether or not they met the current
public health guideline of 60 minutes/day of MVPA [26]. Since guidelines do not currently exist
111
for the duration of active transportation, a 30 minute/day cut-point was used to place participants
into two active transportation groups. This cut-point corresponded to the top quartile of active
transportation, and the proportion of study participants who met this active transportation cut-
point was similar to the proportion who met the 60 minute/day MVPA cut-point. Because
vehicle use may moderate the association between urban sprawl and obesity-related behaviours,
an interaction term between urban sprawl and age group was introduced into the analysis,
distinguishing those who were not of driving age from those who were (12-15 years vs. 16-19
years).
Exposure
Urban sprawl was measured for each of Canada‟s 33 CMAs using an adaptation of the
Canadian urban sprawl index developed by Ross et al. [27]. The index incorporated total
dwelling density, percentage of single or detached dwellings and the percentage of the
population living in the urban core of each CMA. Total dwelling density and the density of
single or detached dwelling units in each CMA were obtained using PCensus (2006 Census of
Canada Profile Data; Tetrad Computer Applications Inc., Vancouver BC). The percentage of the
population living in the urban core was obtained from Statistics Canada [28]. Instead of
weighting the 3 urban sprawl components equally to create a summary score, as done by Ross et
al. [27], a principal components factor analysis was performed. Results showed that the 3
components comprised a single factor and Cronbach‟s alpha for this factor was 0.89. The factor
loadings were 0.95 for dwelling density, 0.96 for density of single or detached dwellings, and
0.82 for percentage of the population living in the urban core of the CMAs. The three
components were used to create a standardized urban sprawl score, with a mean of 0 and a
standard deviation of 1.

112
Covariates
The individual-level covariates were obtained from the CCHS, and included age, sex,
socioeconomic status, and the season the survey was completed. Age was considered as a
covariate because as age increases, levels of physical activity decrease [29,30] and the
prevalence of overweight and obesity increases [7]. Sex was included as a covariate, due to
differences in physical activity behaviours in males and females [31]. Obesity is more prevalent
in Canadian youth of low socioeconomic status [32]. Therefore, the highest level of household
education and household income were included in the analysis as covariates. Responses for
household education ranged from less than high school to a post-secondary degree/diploma,
while household income was determined by a ratio of the income relative to a low income
threshold for a given household and community size [25]. Finally, because physical activity
varies by season [33], the season the survey was completed was included as a covariate.
Area-level covariates were also considered; these mainly focused upon climatic variables.
In addition to season, climate is a known correlate of physical activity participation in youth
[34]. The climate averages for each of Canada‟s 33 CMAs were obtained from Environment
Canada. These were based upon climate averages from 1972-2000 at the international airport or,
if unavailable, the municipal airport within each CMA [35], The climate data obtained consisted
of average daily temperature, average annual rainfall, and average annual snowfall. These were
transformed to have a mean of 0 and a standard deviation of 1 for the regression analyses.
Statistical Analysis
All analyses were conducted using SAS software version 9.2 (SAS Institute, Cary, NC).
The complex sampling procedures for the CCHS resulted in individuals within the target
population having unequal probabilities of being sampled. To account for this, 500 weighted
113
bootstrap replications were carried out using Statistics Canada‟s bootstrap weights for the
descriptive and regression analyses [36,37]. Multilevel logistic regressions were carried out
through a multi-step process to estimate the odds ratio (OR) of reporting: (1) an overweight or
obese BMI, (2) the accumulation of 60 minutes/day of MVPA; (3) the accumulation of 30
minutes/day of active transportation-related activities, in association with estimated levels of
urban sprawl.
We employed the following modeling strategy. First, an empty model was used to
determine the intra-class correlation (ICC) statistic for logistic regression. The ICC value
indicates the proportion of the total variation in the study outcome that was due to differences
across CMAs. Second, bivariate associations were examined between the study outcome and
each covariate. Next, the multivariate model building process began with the introduction of the
individual level variables and the interaction term, and proceeded using a backwards elimination
approach. The urban sprawl variable was forced into all models. The inclusion of the interaction
term at the beginning of the model building process was done to test the a priori hypothesis that
driving age was a moderator of the association between urban sprawl and the outcome variables.
Finally, for the MVPA and active transportation outcomes, the CMA-level climate variables
were then entered into the model using a backwards elimination approach. Season and climate
variables were not included in the analysis with the overweight and obesity outcome, since there
is no evidence of an association. To take into account the possibility that the association between
urban sprawl and the study outcomes may have been influenced by participants living in the
three largest CMAs (Montreal, Toronto and Vancouver), the analysis was repeated after
removing residents from these three cities.
114
RESULTS
A total of 7,017 respondents from the 2007-2008 CCHS met the inclusion criteria for this
study. Descriptive characteristics of the sample are in Table 1. Participants were equally
distributed across the two age groups. Of the respondents who provided the appropriate
information in the CCHS, approximately one in three met the MVPA guidelines, one in four
engaged in active transportation for at least 30 minutes per day. Also, one in four participants in
the study sample was either overweight or obese.
Table 2 provides the urban sprawl scores (standardized to a mean of 0 and SD of 1) and
the climate characteristics for each CMA. Positive urban sprawl scores indicate higher levels of
urban sprawl. Toronto, Montreal and Vancouver are the three largest urban centres, and also had
the lowest urban sprawl scores.
The ICC value for active transportation, which was calculated from the empty model,
indicated that only 0.21% of the variation in the outcome occurred at the CMA-level. Table 3
shows the results for the frequent active transportation outcome (≥30 minutes/day). The bivariate
analysis showed no association between urban sprawl and active transportation in the total
sample; however, since the interaction term between age and urban sprawl was statistically
significant (= -0.20, p<0.01), separate odds ratios were calculated for the two age groups. After
adjustment for the relevant individual- and area-level covariates, the final model suggested that
urban sprawl was associated with an increased likelihood of active transportation in 12 to 15 year
olds (OR per SD increase = 1.24, 95% CI: 1.10-1.39) but not in 16 to 19 year olds (OR per SD
increase = 1.02, 95% CI: 0.88-1.17).
Table 4 outlines the results of the analysis for MVPA (≥60 minutes/day). The ICC was
0.28%. The interaction term between the urban sprawl score and age group was not

115
significant= -0.01, p-value = 0.90), so the odds ratio for the urban sprawl score was
calculated for the entire study population, rather than by age group. The bivariate analysis
suggested that there was no statistically significant association between urban sprawl and
MVPA; however, after the relevant individual- and area-level confounders were added to the
model, there was a positive association between urban sprawl and MVPA (OR per SD increase =
1.10, 95%: 1.01-1.20). Amongst the covariates, sex, the season the survey was administered, and
the average daily temperature were related to MVPA.
Table 5 presents the results of the analysis of the association between urban sprawl and
overweight/obesity. The empty model indicated that the ICC was 0.90%. The bivariate analyses
indicated that there was no association between urban sprawl and overweight/obesity, and the
addition of the covariates into the model did not change this observation. Furthermore, the
interaction term between age group and urban sprawl was not statistically significant (=-0.02,
p-value=0.81).
The removal of participants who lived in the three largest CMAs (Montreal, Toronto and
Vancouver) did not substantially alter the relationship with overweight/obesity (OR per SD
increase = 0.97, 95% CI: 0.86-1.11). However, the association between urban sprawl and MVPA
was no longer statistically significant (OR per SD increase = 0.98, 95% CI: 0.88-1.09). In
addition, the association between urban sprawl and active transportation changed directions (OR
per SD increase = 0.93, 95% CI: 0.82-1.05). Finally, the age interaction term for the active
transportation outcome was longer statistically significant (=0.16, p-value=0.13), suggesting
there was no difference in associations between the two age groups.

116
DISCUSSION
A key finding of this study was that 12 to 15 year olds living in CMAs with high levels of
urban sprawl were more likely to participate in frequent active transportation and MVPA
compared to those living in relatively compact CMAs. Although the associations between urban
sprawl and the physical activity measures were relatively modest, the impact of urban sprawl on
the physical activity levels of young people may still be meaningful for the population as a
whole. The CMAs with the lowest urban sprawl scores were also the most populated (Toronto,
Montreal and Vancouver).
The findings of this study for the overweight/obesity outcome do not agree with the
results of previous research by Ewing et al. [16] and Slater et al. [17], who found that increased
urban sprawl was associated with a greater prevalence of overweight/obesity in American youth.
One possible reason for the discordant findings may be because the sprawl index used by Ewing
[16] and Slater [17] applied to counties, whereas our measure applied to CMAs. The larger
geographic size of our study areas may have obscured differences in overweight/obesity
prevalence. Another possible reason is that information on neighbourhood and traffic safety was
unavailable from the annual component of the CCHS, while they were accounted for in previous
studies [16,17]. Concerns about traffic safety and crime are negatively associated with active
transportation among young people [38,39]. In our study, the CMAs with the lowest levels of
urban sprawl were also the largest metropolitan areas, where traffic and safety concerns may be
more prevalent. Removal of the participants from the three largest CMAs supported this notion,
whereby urban sprawl was no longer positively associated with active transportation or MVPA.
This suggests that the increased likelihood of active transportation and MVPA associated with

117
increased sprawl in all 33 CMAs was accounted for in large measure by young people living in
Canada‟s three largest cities.
In contrast to what has been reported in adults from several countries [27,40-44], less
compact urban areas may encourage physical activity in young people. Slater et al. [17] found
that adolescents living in sprawling counties had higher rates of sports participation, with a 20
unit increase in the county-level urban sprawl score (approximately 1 SD) was associated with a
3.1% increase in sports participation. Furthermore, Mecredy et al. [45] found that Canadian
youth exposed to less densely connected streets were 21% (95% CI: 9-34%) more likely to be
active for at least 4 hours/week outside of school compared to those exposed to more densely
connected streets. Contradictory findings between urban sprawl and physical activity outcomes
in adults and youth suggest that the mechanisms explaining these associations vary by age.
Various experts and urban planning groups support initiatives to reduce urban sprawl in
Canadian cities [46,47] and worldwide [48]. These viewpoints are based in part on evidence
demonstrating various negative effects of urban sprawl, including: increased time spent in cars
[49] and elevated levels of air pollution [50]. In adult populations, urban sprawl has been
consistently associated with decreased active transportation and overall physical activity
[40,43,44]. However, some urban planning experts acknowledge the advantages of a suburban
lifestyle over densely populated urban areas, including: more affordable housing [51],
aesthetically pleasing green space [13], and decreased crime rates [52]. Clearly, urban sprawl is a
complex public health issue, with both positive and negative outcomes for increasing sprawl.
The findings of this study contribute to the positive health outcomes associated with urban
sprawl.

118
Strengths of this study include the large and diverse study sample, the examination of the
active transportation outcome, and the consideration of age as a moderator. As with any study,
this study was not void of limitations. One key limitation was that the ICC values for the
outcomes were small, possibly because the geographic area covered by the CMAs was too large
and resulted in little variation in outcomes across the CMAs. Furthermore, the CMAs include
areas of rural land, and because it was not possible to exclude these areas, some study
participants were not influenced by the patterns of development associated with urban sprawl.
Therefore, future studies should use urban sprawl measures that apply to smaller geographic
areas. A second limitation is that the BMI and physical activity measures were based on self-
reports, which likely resulted in an underestimate of the BMI values [53] and an overestimate of
the physical activity levels [54], potentially influencing the strength of the observed associations.
Finally, since this study used previously collected survey data, information on potentially
important covariates was not available. For example, although we determined if participants
were of driving age, we did not know whether they had a driver‟s license and access to a vehicle.
In conclusion, this study provides new insights into the associations between urban
sprawl, physical activity, and obesity within Canadian youth. The findings of this study do not
correspond with those found in adult populations. This is not unlike some other built
environment constructs that are relevant for physical activity, such as street connectivity [45,50],
wherein the associations between the built environment construct and physical activity are in
opposite directions in youth and adult populations. Therefore, age must be considered when
developing strategies around the built environment that are intended to increase physical activity
and decrease obesity within the population.

119
ACKNOWLEDGEMENTS
The authors of this study would like to thank Dr. Miu Lam and Eric Bacon for their
technical support with the bootstrapping techniques. Laura Seliske was supported by a Frederick
Banting and Charles Best Doctoral Research Award from the Canadian Institutes of Health
Research. Dr. Ian Janssen was supported by a Canada Research Chair and an investigator award
from the Ontario Ministry of Research and Innovation.

120
References
1. Shields M: Overweight and obesity among children and youth. Health Rep 2006;17:27-
42.
2. Thompson DR, Obarzanek E, Franko DL, Barton BA, Morrison J, Biro FM, Daniels SR,
Striegel-Moore RH: Childhood overweight and cardiovascular disease risk factors: the
National Heart, Lung, and Blood Institute Growth and Health Study. J Pediatr
2007;150:18-25.
3. Daniels SR, Morrison JA, Sprecher DL, Khoury P, Kimball TR: Association of body fat
distribution and cardiovascular risk factors in children and adolescents. Circulation
1999;99:541-545.
4. Freedman DS, Mei Z, Srinivasan SR, Berenson GS, Dietz WH: Cardiovascular risk
factors and excess adiposity among overweight children and adolescents: the Bogalusa
Heart Study. J Pediatr 2007;150:12-17 e12.
5. Goodman E, Whitaker RC: A prospective study of the role of depression in the
development and persistence of adolescent obesity. Pediatrics 2002;110:497-504.
6. Strauss RS, Pollack HA: Social marginalization of overweight children. Arch Pediatr
Adolesc Med 2003;157:746-752.
7. Freedman DS, Khan LK, Serdula MK, Dietz WH, Srinivasan SR, Berenson GS: The
relation of childhood BMI to adult adiposity: the Bogalusa Heart Study. Pediatrics
2005;115:22-27.
8. Kimm SY, Glynn NW, Obarzanek E, Kriska AM, Daniels SR, Barton BA, Liu K:
Relation between the changes in physical activity and body-mass index during
adolescence: a multicentre longitudinal study. Lancet 2005;366:301-307.

121
9. Dencker M, Thorsson O, Karlsson MK, Linden C, Eiberg S, Wollmer P, Andersen LB:
Daily physical activity related to body fat in children aged 8-11 years. J Pediatr
2006;149:38-42.
10. Saelens BE, Seeley RJ, van Schaick K, Donnelly LF, O'Brien KJ: Visceral abdominal fat
is correlated with whole-body fat and physical activity among 8-y-old children at risk of
obesity. Am J Clin Nutr 2007;85:46-53.
11. Patrick K, Norman GJ, Calfas KJ, Sallis JF, Zabinski MF, Rupp J, Cella J: Diet, physical
activity, and sedentary behaviors as risk factors for overweight in adolescence. Arch
Pediatr Adolesc Med 2004;158:385-390.
12. Srinivasan S, O'Fallon LR, Dearry A: Creating healthy communities, healthy homes,
healthy people: initiating a research agenda on the built environment and public health.
Am J Public Health 2003;93:1446-1450.
13. Frumkin H, Frank L, Jackson R: Urban Sprawl and Public Health: Designing, Planning
and Building for Healthy Communities. Washington, Island Press, 2004.
14. Frank L, Pivo G: Impacts of mixed use and density on utilization of three modes of
travel: single-occupant vehicle, transit, and walking: Transportation Research Record
1994;1466:44-52.
15. Holtzclaw J, Clear R, Dittmar H, Goldstein D, Haas P: Location efficiency: neighborhood
and socio-economic characteristics determine auto ownership and use - studies in
Chicago, Los Angeles and San Francisco. Transportation Planning and Technology
2002;25:1-27.
16. Ewing R, Brownson RC, Berrigan D: Relationship between urban sprawl and weight of
United States youth. Am J Prev Med 2006;31:464-474.
122
17. Slater SJ, Ewing R, Powell LM, Chaloupka FJ, Johnston LD, O'Malley PM: The
association between community physical activity settings and youth physical activity,
obesity, and body mass index. J Adolesc Health 2010;47:496-503.
18. Trowbridge MJ, McDonald NC: Urban sprawl and miles driven daily by teenagers in the
United States. Am J Prev Med 2008;34:202-206.
19. McGovern L, Johnson JN, Paulo R, Hettinger A, Singhal V, Kamath C, Erwin PJ,
Montori VM: Clinical review: treatment of pediatric obesity: a systematic review and
meta-analysis of randomized trials. J Clin Endocrinol Metab 2008;93:4600-4605.
20. Summerbell CD, Ashton V, Campbell KJ, Edmunds L, Kelly S, Waters E: Interventions
for treating obesity in children. Cochrane Database Syst Rev 2003:CD001872.
21. Kamath CC, Vickers KS, Ehrlich A, McGovern L, Johnson J, Singhal V, Paulo R,
Hettinger A, Erwin PJ, Montori VM: Clinical review: behavioral interventions to prevent
childhood obesity: a systematic review and metaanalyses of randomized trials. J Clin
Endocrinol Metab 2008;93:4606-4615.
22. Statistics Canada. Data Dictionary (rounded frequencies) CCHS 2007 - Master File 12
Month. www.statcan.gc.ca/imdb-bmdi/3226_D3_T9_V10-eng.pdf. Accessed November
2011.
23. Statistics Canada. Canadian Community Health Survey (CCHS) - Annual Component.
User Guide: 2007-2008 Microdata files.
24. Cole TJ, Bellizzi MC, Flegal KM, Dietz WH: Establishing a standard definition for child
overweight and obesity worldwide: international survey. BMJ 2000;320:1240-1243.

123
25. Statistics Canada. Canadian Community Health Survey (CCHS). 2008 (Annual
Component) and 2007-2008 Derived Variable (DV) Specifications. Master and Shared
Files.
26. Canadian Society for Exercise Physiology. Canadian Physical Activity Guidelines: 2011
Scientific Statements. http://www.csep.ca/CMFiles/Guidelines/CanadianPhysicalActivity
GuidelinesStatements_E.pdf. Accessed October 2011.
27. Ross NA, Tremblay S, Khan S, Crouse D, Tremblay M, Berthelot JM: Body mass index
in urban Canada: neighborhood and metropolitan area effects. Am J Public Health
2007;97:500-508.
28. Statistics Canada. 2006 Community Profiles. 2006 Census. Statistics Canada Catalogue
no. 92-591-XWE. Ottawa. Released March 13, 2007.
29. Nelson MC, Neumark-Stzainer D, Hannan PJ, Sirard JR, Story M: Longitudinal and
secular trends in physical activity and sedentary behavior during adolescence. Pediatrics
2006;118:e1627-1634.
30. Aaron DJ, Storti KL, Robertson RJ, Kriska AM, LaPorte RE: Longitudinal study of the
number and choice of leisure time physical activities from mid to late adolescence:
implications for school curricula and community recreation programs. Arch Pediatr
Adolesc Med 2002;156:1075-1080.
31. Sallis JF, Prochaska JJ, Taylor WC: A review of correlates of physical activity of
children and adolescents. Med Sci Sports Exerc 2000;32:963-975.
32. Willms JD, Tremblay MS, Katzmarzyk PT: Geographic and demographic variation in the
prevalence of overweight Canadian children. Obes Res 2003;11:668-673.
124
33. Beighle A, Alderman B, Morgan CF, Le Masurier G: Seasonality in children's
pedometer-measured physical activity levels. Res Q Exerc Sport 2008;79:256-260.
34. Belanger M, Gray-Donald K, O'Loughlin J, Paradis G, Hanley J: Influence of weather
conditions and season on physical activity in adolescents. Ann Epidemiol 2009;19:180-
186.
35. Environment Canada. National Climate Data and Information Archive. Canadian Climate
Normals or Averages 1971-2000. http://climate.weatheroffice.gc.ca/climate_normals
/index_e.html. Accessed Sept 2011.
36. Rust KF, Rao JN: Variance estimation for complex surveys using replication techniques.
Stat Methods Med Res 1996;5:283-310.
37. Rao JNK, Wu CFJ, Yue K: Some recent work on resampling methods for complex
surveys. Survey Methodology (Statistics Canada, Catalogue 12-001) 1992;18:209-217.
38. Hume C, Timperio A, Salmon J, Carver A, Giles-Corti B, Crawford D: Walking and
cycling to school: predictors of increases among children and adolescents. Am J Prev
Med 2009;36:195-200.
39. Grow HM, Saelens BE, Kerr J, Durant NH, Norman GJ, Sallis JF: Where are youth
active? Roles of proximity, active transport, and built environment. Med Sci Sports Exerc
2008;40:2071-2079.
40. Lee IM, Ewing R, Sesso HD: The built environment and physical activity levels: the
Harvard Alumni Health Study. Am J Prev Med 2009;37:293-298.
41. Lopez R: Urban sprawl and risk for being overweight or obese. Am J Public Health
2004;94:1574-1579.

125
42. Joshu CE, Boehmer TK, Brownson RC, Ewing R: Personal, neighbourhood and urban
factors associated with obesity in the United States. J Epidemiol Community Health
2008;62:202-208.
43. Garden FL, Jalaludin BB: Impact of urban sprawl on overweight, obesity, and physical
activity in Sydney, Australia. J Urban Health 2009;86:19-30.
44. Ewing R, Schmid T, Killingsworth R, Zlot A, Raudenbush S: Relationship between urban
sprawl and physical activity, obesity, and morbidity. Am J Health Promot 2003;18:47-57.
45. Mecredy G, Pickett W, Janssen I: Street connectivity is negatively associated with
physical activity in Canadian youth. International Journal of Environmental Research and
Public Health 2011;8:3333-3350.
46. Seasons M, Brown J, Frojmovic M, Hoemig H, LeClerc N, Parsons C, Whitelaw G:
Canadian Institute of Planners. The World Urban Forum 2006: Vancouver Working
Group Discussion Paper. http://www.cscd.gov.bc.ca/lgd/intergov_relations/library/
wuf_the_planning_city.pdf. Accessed Sept 2011.
47. Tomalty R, Haider M: BC Sprawl Report: Walkability and Health 2009.
http://www.smartgrowth.bc.ca/Portals/0/Downloads/sgbc-sprawlreport-2009-final-web
(2).pdf. Accessed Sept 2011.
48. United Nations Population Fund. State of the World Population 2007: Unleashing the
Potential of Urban Growth. http://www.unfpa.org/webdav/site/global/shared/documents/
publications/2007/695_filename_sowp2007_eng.pdf. Accessed Sept 2011.
49. Frank LD, Andresen MA, Schmid TL: Obesity relationships with community design,
physical activity, and time spent in cars. Am J Prev Med 2004;27:87-96.

126
50. Frank LD, Sallis JF, Conway TL, Chapman JE, Saelens BE, Bachman W: Many
pathways from land use to health: Associations between neighbourhood walkability and
active transportation, body mass index and air quality. J Am Plann Assoc 2006;72:75-87.
51. Song Y, Knaap J: New urbanism and housing values: A disaggregate assessment. J Urban
Econ 2003;54:218-238.
52. Cullen J, Levitt S: Crime, urban flight and the consequences for cities. Rev Econ Statist
1999;81:159-169.
53. Shields M, Gorber SC, Tremblay MS: Estimates of obesity based on self-report versus
direct measures. Health Rep 2008;19:61-76.
54. Troiano RP, Berrigan D, Dodd KW, Masse LC, Tilert T, McDowell M: Physical activity
in the United States measured by accelerometer. Med Sci Sports Exerc 2008;40:181-188.

127
Table 1. Demographic and health characteristics of the study population (N=6384)
N Percent (95% CI)
Sex
Male
Female
Age
12 - 15 years
16 - 19 years
Household Income
Deciles 1 - 3
Deciles 4 - 6
Deciles 7 - 10
Not stated
Highest Household Education
Less than secondary school
Secondary school
Post secondary
Not stated
Season Survey Administered
Winter (Dec - Feb)
Spring (Mar - May)
Summer (June - Aug)
Fall (Sept - Nov)
Active Transportation ≥ 30 min/day
Yes
No
Not Stated
MVPA ≥ 60 min/day
Yes
No
Not stated
Weight Status
Non-overweight
Overweight
Obese
Not stated
3587
3430
3522
3495
1729
1747
1890
1651
180
659
4666
1512
1527
1955
1489
2046
1669
4715
633
2402
3812
803
4975
933
307
802
51.3 (50.9-51.8)
48.7 (48.3-49.1)
51.0 (49.4-52.6)
49.0 (47.4-50.6)
27.4 (25.9-28.9)
24.3 (22.9-25.6)
23.7 (22.4-25.0)
24.6 (23.3-26.0)
2.8 (2.3-3.4)
9.0 (8.0-10.0)
68.6 (67.1-70.1)
19.6 (18.4-20.8)
23.2 (21.9-24.5)
27.4 (25.9-28.9)
22.4 (21.1-23.8)
27.0 (25.6-28.4)
22.2 (20.9-23.5)
68.6 (67.1-70.1)
9.2 (8.3-10.2)
32.8 (31.3-34.3)
56.2 (54.6-57.7)
11.0 (10.0-12.0)
71.7 (70.3-73.2)
12.1 (11.2-13.0)
4.2 (3.5-4.9)
11.9 (10.9-13.0)
MVPA = moderate-to-vigorous physical activity.
All N‟s are unweighted.
The proportions are weighted to take into account unequal sampling probabilities.

128
Table 2. Urban sprawl scores and climate characteristics for Canada‟s 33 census metropolitan
areas
Census Metropolitan Area Standardized
Urban
Sprawl Score
Average
Daily
Temp (C)
Average
Annual
Rainfall
(mm)
Average
Annual
Snowfall
(cm)
Montreal, QC
Toronto, ON
Vancouver, BC
Kitchener-Cambridge-Waterloo, ON
Hamilton, ON
Victoria, BC
Windsor, ON
Guelph, ON
Oshawa, ON
Calgary, AB
St. Catharines-Niagara, ON
Quebec City, QC
Barrie, ON
Abbotsford-Mission, BC
Winnipeg, MB
London, ON
St. John‟s, NF
Trois-Rivieres, QC
Regina, SK
Edmonton, AB
Sherbrooke, QC
Ottawa ON-Gatineau QC
Saskatoon, SK
Thunder Bay, ON
Brantford, ON
Kelowna, BC
Halifax, NS
Moncton, NB
Kingston, ON
Saguenay, QC
Saint John, NB
Peterborough, ON
Greater Sudbury, ON
-2.28
-2.15
-1.65
-1.51
-1.43
-1.21
-0.73
-0.65
-0.45
-0.35
-0.31
-0.21
-0.09
-0.04
0.05
0.05
0.07
0.20
0.37
0.38
0.41
0.51
0.65
0.70
0.86
0.93
0.96
0.98
1.05
1.11
1.17
1.24
1.35
6.2
7.5
10.1
6.7
7.6
9.7
9.4
6.5
7.7
4.1
8.8
4.0
6.7
10.0
2.6
7.5
4.7
4.9
2.8
2.4
4.1
6.0
2.2
2.5
8.0
7.7
6.3
5.1
6.7
2.3
5.0
5.9
3.7
764
685
1155
765
765
841
805
771
760
321
746
924
700
1508
416
818
1191
859
304
375
874
732
265
559
780
298
1239
865
795
661
1148
682
657
216
115
48
160
162
44
127
161
118
127
137
316
238
64
111
202
322
241
106
121
294
236
97
188
113
102
231
350
181
342
257
162
274

129
Table 3. Multilevel logistic regression examining the association between urban sprawl and
active transportation among Canadian youth (N=6384)
Bivariate Model Individual-Level
Model
Area-Level Model
Urban Sprawl Score
1 SD increase in sprawl score:
12 - 15 year olds
16 - 19 year olds
1.03 (0.94-1.12)
--
--
1.15 (1.03-1.27)
0.94 (0.77-1.15)
1.24 (1.10-1.39)
1.02 (0.88-1.17)
Individual-Level Variables
Age
12 - 15 years
16 - 19 years
Sex
Male
Female
Household Income
Deciles 1 - 3
Deciles 4 - 6
Deciles 7 - 10
Not stated
Household Education
Less than secondary school
Secondary school
Post secondary
Not stated
Season Survey Administered
Winter (Dec - Feb)
Spring (Mar - May)
Summer (June - Aug)
Fall (Sept - Nov)
1.00
1.03 (0.88-1.19)
1.00
0.74 (0.64-0.87)
1.00
0.80 (0.65-0.99)
0.72 (0.58-0.90)
0.94 (0.76-1.17)
1.00
1.62 (0.94-2.80)
1.32 (0.80-2.20)
1.80 (1.10-2.97)
1.00
0.92 (0.72-1.17)
1.39 (1.10-1.74)
1.16 (0.94-1.44)
1.00
0.84 (0.70-1.00)
1.00
0.73 (0.63-0.86)
1.00
0.77 (0.62-0.95)
0.69 (0.56-0.86)
0.90 (0.72-1.13)
1.00
0.92 (0.72-1.17)
1.40 (1.11-1.76)
1.16 (0.94-1.45)
1.00
0.84 (0.70-1.00)
1.00
0.73 (0.63-0.86)
1.00
0.77 (0.62-0.95)
0.69 (0.56-0.86)
0.90 (0.72-1.13)
1.00
0.92 (0.72-1.17)
1.40 (1.11-1.76)
1.16 (0.94-1.45)
Area-Level Variables
Avg. temperature (1 SD increase)
Avg. rainfall (1 SD increase)
Avg. snowfall (1 SD increase)
1.12 (1.02-1.23)
1.07 (0.97-1.17)
0.97 (0.88-1.06)
--
--
--
1.18 (1.06-1.32)
Data presented as odds ratio (95% confidence interval)
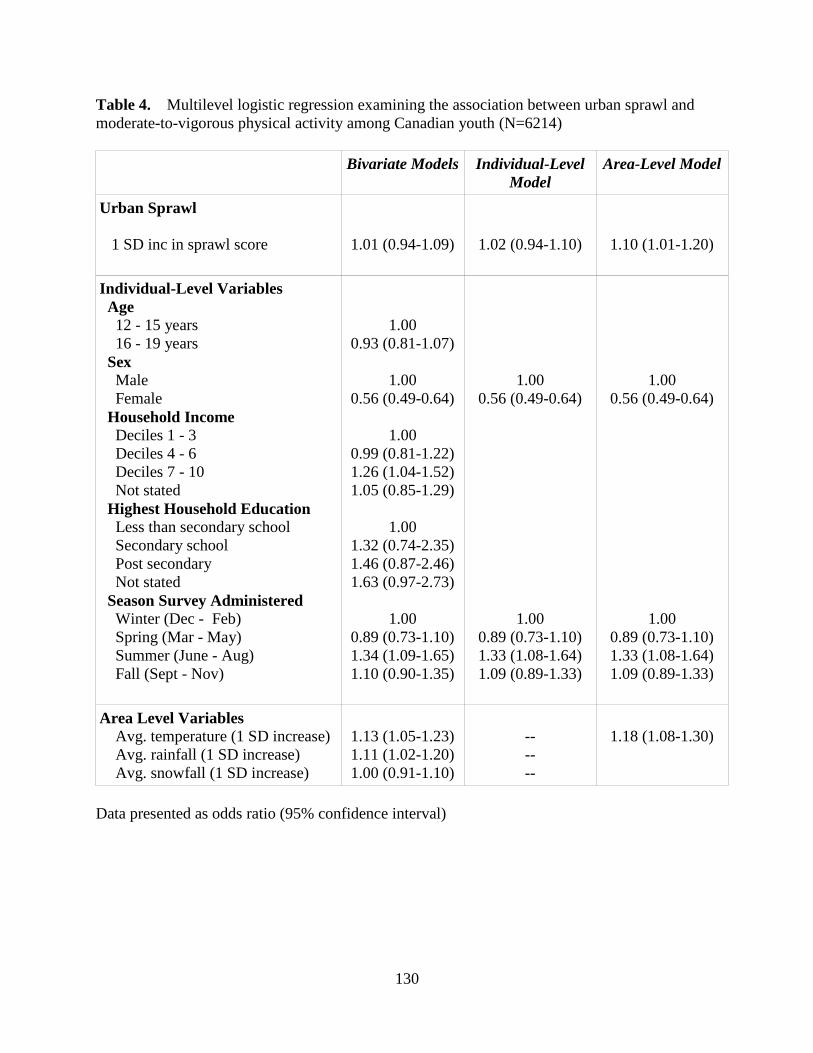
130
Table 4. Multilevel logistic regression examining the association between urban sprawl and
moderate-to-vigorous physical activity among Canadian youth (N=6214)
Bivariate Models
Individual-Level
Model
Area-Level Model
Urban Sprawl
1 SD inc in sprawl score
1.01 (0.94-1.09)
1.02 (0.94-1.10)
1.10 (1.01-1.20)
Individual-Level Variables
Age
12 - 15 years
16 - 19 years
Sex
Male
Female
Household Income
Deciles 1 - 3
Deciles 4 - 6
Deciles 7 - 10
Not stated
Highest Household Education
Less than secondary school
Secondary school
Post secondary
Not stated
Season Survey Administered
Winter (Dec - Feb)
Spring (Mar - May)
Summer (June - Aug)
Fall (Sept - Nov)
1.00
0.93 (0.81-1.07)
1.00
0.56 (0.49-0.64)
1.00
0.99 (0.81-1.22)
1.26 (1.04-1.52)
1.05 (0.85-1.29)
1.00
1.32 (0.74-2.35)
1.46 (0.87-2.46)
1.63 (0.97-2.73)
1.00
0.89 (0.73-1.10)
1.34 (1.09-1.65)
1.10 (0.90-1.35)
1.00
0.56 (0.49-0.64)
1.00
0.89 (0.73-1.10)
1.33 (1.08-1.64)
1.09 (0.89-1.33)
1.00
0.56 (0.49-0.64)
1.00
0.89 (0.73-1.10)
1.33 (1.08-1.64)
1.09 (0.89-1.33)
Area Level Variables
Avg. temperature (1 SD increase)
Avg. rainfall (1 SD increase)
Avg. snowfall (1 SD increase)
1.13 (1.05-1.23)
1.11 (1.02-1.20)
1.00 (0.91-1.10)
--
--
--
1.18 (1.08-1.30)
Data presented as odds ratio (95% confidence interval)

131
Table 5. Multilevel logistic regression examining the association between urban sprawl and
overweight and obesity among Canadian youth (N=6215)
Bivariate Model Individual-Level
Model
Urban Sprawl
1 SD increase in sprawl score
1.04 (0.94-1.16)
1.06 (0.94-1.18)
Individual Level Variables
Age
12 – 15 years
16 – 19 years
Sex
Male
Female
Household Income
Deciles 1 - 3
Deciles 4 - 6
Deciles 7 - 10
Not stated
Highest Household Education
Less than secondary school
Secondary school
Post secondary
Not stated
1.00
1.23 (1.04-1.46)
1.00
0.52 (0.44-0.62)
1.00
0.88 (0.69-1.12)
0.70 (0.55-0.89)
0.93 (0.72-1.19)
1.00
0.54 (0.31-0.95)
0.42 (0.25-0.71)
0.48 (0.28-0.83)
1.00
1.25 (1.05-1.49)
1.00
0.51 (0.43-0.61)
1.00
0.85 (0.66-1.08)
0.67 (0.52-0.85)
0.88 (0.68-1.14)
Data presented as odds ratio (95% confidence interval)

132
CHAPTER 7: GENERAL DISCUSSION
7.1 Summary of Key Findings
Findings from each manuscript of this thesis provided new insights into the influence of
the built environment on obesity-related behaviours in Canadian youth. Under this theme, key
relationships examined include: i) the school food retail environment and its association with
lunchtime eating behaviours, ii) urban sprawl and its association with active transportation,
physical activity and obesity in young people, and iii) important methodological issues related to
assessing the school food retail environment.
In the first manuscript, a validation study compared the measurement error present in two
geographical information systems (GIS) food retailer databases: an online database
(www.yellowpages.ca) and a commercial database (InfoCanada). This manuscript built on
previous work by not only considering whether food retailers are present or absent [1-4], but also
quantified the positional error of food retailer databases for a 1 km circular buffer surrounding 34
schools within southern Ontario. A greater percentage of food retailer addresses provided by the
online database were, in reality, located in the field, but no differences were found for the
positional error between the databases. When considering which food retailer database to use for
the subsequent two manuscripts, the online source was chosen based on the greater percentage of
food retailers identified in the field.
The primary objective of the second manuscript was to determine whether there was an
association between the presence of food retailers surrounding schools (fast food restaurants,
coffee/donut shops and convenience stores) and students‟ lunchtime eating behaviours. A
secondary objective was to determine whether a 1 km circular buffer or a 1 km road network-

133
based buffer was optimal in capturing food retailers near schools. This manuscript also provided
new insights into the relationship between the school food retail environment and lunchtime
eating behaviours by using context-specific measures which took into account where food was
obtained from. The presence of three or more food retailers within a 1 km road network buffer
surrounding schools was associated with students typically eating at a snack-bar, fast-food
restaurant or café at lunchtime during the school day. Similar associations were demonstrated for
the 1 km circular buffer, but only for the presence of five or more food retailers. Model fit
statistics confirmed that the 1 km road network buffer provided a more optimal fit compared to
the 1 km circular buffer.
The objective of the third manuscript was to determine the appropriate distance to use
when measuring the school food retail environment. It expanded upon the findings of the second
manuscript by creating a variety of road network-based buffers to capture food retailers
surrounding schools, ranging from 500 m to 5000 m in size. Results indicated that the 1000 m
road network buffer provided the best fit. Establishing a standard buffer size to measure the food
retail environment is important for two reasons. First, it would facilitate the comparison of study
findings by providing an evidence-based standardized measure of the food retail environment
surrounding schools, which is a limitation of the current studies [5,6]. Second, if a study used a
buffer that was either too large or too small, it may obscure relationships between the food retail
environment and eating behaviours.
Finally, the fourth manuscript examined the relationship between urban sprawl and the
outcomes of active transportation, moderate-to-vigorous physical activity (MVPA), and
overweight/obesity in young people. The inclusion of an interaction term based on driving age
(12 to 15 years vs. 16 to 19 years) provided new insights into the role of driving age as a

134
potential moderator of these relationships. Unlike previous studies of urban sprawl in American
adolescents [7,8], no associations were found with obesity, and associations with MVPA and
active transportation were in the opposite direction: higher levels of urban sprawl were
associated with an increased likelihood of active transportation, but only in the younger age
group. Our findings were consistent with previous research that showed an association between
lower levels of street connectivity and increased physical activity in Canadian youth [9].
In summary, the key methodological contributions of this thesis were the identification of
the optimal GIS food retailer database, buffer type, and buffer size to use when assessing the
food retail environment around schools. Etiologically, this thesis provided new insights into the
role of the food environment surrounding Canadian schools and students‟ lunchtime eating
behaviours, as well as the influence of urban sprawl on physical activity in Canadian youth.
7.2 Suitability for a Doctoral Dissertation in Epidemiology
There are several aspects of this thesis that meet the criteria for a doctoral dissertation in
epidemiology. First, the candidate demonstrated that she was able to summarize key issues in the
built environment literature and identify important gaps in knowledge in order to provide unique
contributions to the literature. The candidate was then able to plan, implement and carry out four
studies which addressed these gaps and provided a novel understanding of the influence of the
built environment on the health behaviours of Canadian youth.
The validation study showed that the candidate had an in-depth understanding of the
issues surrounding primary data collection of food retailer locations. She took into account
important study design issues such as obtaining an adequate sample size, ensuring sufficient
variability within the study sample and also showed an appreciation of how the accuracy of food

135
retailer databases affects the internal validity of studies of the food environment. Issues of
internal validity were also addressed in her second and third manuscripts, where she answered
important methodological questions regarding the size and type of buffer to use when measuring
the school food retail environment. Also, the focus on context-specific behavioural outcomes
(e.g. eating behaviours while at school) allowed her to show strong and consistent relationships
which had not been previously demonstrated in the food retail environment literature due to the
potential misclassificiation of the study outcomes.
Throughout the course of her thesis, the candidate showed an understanding of key
epidemiological issues surrounding confounding and effect modification. Careful consideration
was given to selecting the potential confounders to include in her analyses. In addition, the
candidate showed insights into potential biases introduced by the confounders that she was
unable to control for in her analyses. The exploration of the role of driving age as a potential
effect modifier in the relationship between urban sprawl and active transportation provided a
novel contribution to the urban sprawl literature. The analysis of large national survey data
provided more generalizable findings relative to some of the previous studies of the food retail
environment. Finally, the candidate demonstrated the mastery of complex epidemiological
analytical techniques, including multilevel modeling and bootstrapping.
7.3 Strengths and Limitations
There are several key strengths to this thesis. Each of the manuscripts surpasses many
existing studies with respect to sample size and geographic scope. The first manuscript improved
upon previous field validation studies by including 973 food retailers from the commercial
source and 676 food retailers from the online source in 22 cities and towns. The second and third
136
manuscripts had larger sample sizes and stronger associations compared to existing studies of the
food retail environment [10-12]. Finally, the sample size in the fourth manuscript was
sufficiently large to allow for the examination of driving age as a potential effect modifier, which
has not been done in previous research.
Obtaining a sufficient sample size is important in order to be able to detect relationships,
if they exist, and not all studies are adequately powered to do so. For example, Laska et al. [10]
were unable to find consistent relationships between the food retail environment surrounding
schools and obesity-related behaviours. This may be due to the fact that only 349 adolescents
within a single city were included in this study, and it was likely that many of them attended the
same schools. A study of the school food environment by van der Horst et al. [12] examined a
larger number of students (n=1,293), but only 15 schools were included in their study, which
may have explained the lack of notable relationships between the food environment surrounding
schools and students‟ eating behaviours. Therefore, it appears that an insufficient number of
study participants and schools prevent some studies from detecting relevant associations. In
addition, having sufficient geographical variation in study locations is important for
recommending standardized methods of measuring the food retail environment. Allowing for
adequate variability in food retail environments ensures the recommendations reflect the food
environment in a variety of locations, rather than being influenced by a small number of food
environments.
A second key strength of this thesis was related to the importance of context. For the
second and third manuscripts, information was included on where food was obtained, which had
not been done in previous studies. For example, measures such as 24 hour dietary recalls [10,13]
or questions on typical weekly food and drink intake [12] did not consider where the foods or

137
drinks are obtained. This made it impossible to attribute eating behaviours to specific
environments, and previous studies may have introduced misclassification into their study
outcomes by using these measures. The stronger findings within the second and third
manuscripts of this thesis highlight the importance of using context-specific measures of the food
retail environment and may guide future studies to consider similar outcome measures.
In addition to the importance of context within study measures, this thesis provided
insights on the influence of the built environment on obesity-related behaviours within the
broader Canadian context. There were contradictory findings between urban sprawl, MVPA and
active transportation between American and Canadian adolescents. Both Ewing et al. [7] and
Slater et al. [8] found that increased urban sprawl was associated with higher levels of obesity
among American youth. In contrast, findings from the fourth manuscript of this thesis showed no
relationship between urban sprawl and obesity, and greater urban sprawl was associated with
increased active transportation among 12 to 15 year olds, as well as increased MVPA among 12
to 19 year olds. This suggests there may be a different mechanism underlying this relationship
between the two countries. However, more research is needed to provide a detailed
understanding of this mechanism. Finally, this thesis examined the influence of the food retail
environment in Canada, which is important since there may be differences in the availability of
food retailers compared to other countries.
There were also some key limitations of this thesis which warrant discussion. One of the
main limitations was the reliance on cross-sectional data, which can make it difficult to establish
causal relationships. This is due to the uncertainty regarding whether the exposure preceded the
outcome or vice versa if they are measured at the same point in time, which is a typical
characteristic of cross-sectional studies. However, given that young people do not have a great

138
deal of autonomy in determining where they live and go to school compared to adults, it is more
likely that their environments influence their health behaviours rather than the opposite.
There are other characteristics of the relationships found in this study that do support a
causal relationship. The strength of the associations and the dose-response pattern seen for the
relationship between the food retail environment and eating behaviours in the second and third
manuscripts add further support for a causal relationship. These patterns are important because
having strong relationships supports the notion that the results are not due to some other
confounding factor. Having a dose-response pattern is important because when an increase in
exposure is followed by a proportional increase in the outcome, it suggests the presence of a
relationship between them. Support for a causal relationship was not as strong in the fourth
manuscript, since the relationship between active transportation is in the opposite direction
compared to previous studies [7,8]. However, the lack of consistency with previous research
does not necessarily discount the study findings, and may guide future research dedicated to
gaining a greater understanding the mechanism of this relationship.
A second limitation was the reliance on self-reported data provided by surveys. For
physical activity and dietary intake among young people, evidence suggests that physical activity
is overreported and poor eating behaviours are underreported due to biases towards socially
desirable behaviours [14]. For the second and third manuscripts, it is possible that students
underreported the frequency of eating lunch at a food retailer because it may be perceived as an
unhealthy behaviour. This may have varied by exposure status. For example, students with a
greater exposure to food retailers may have eaten out more often, and they may have
underreported this to a greater degree than students with fewer nearby food retailers. However, it
is also possible that the misclassification of eating behaviours was non-differential. Regardless,

139
the multiple exposure categories make it difficult to determine the direction of the
misclassification. For the fourth manuscript, misclassification may also have been present for
self-reported heights and weights, resulting in underestimates of BMI [15]. It is likely that this
misclassification is non-differential, since it was not expected to differ for areas of high and low
urban sprawl. This non-differential misclassification may have partly explained the lack of an
association between urban sprawl and obesity.
There are some other important limitations regarding food retailer measures used in the
second and third manuscripts. Only the top chain fast food and coffee/donut retailers were used
in the food retail environment studies. This excluded the smaller non-chain food retailers that
may also have been accessible from schools. In addition, only the top 75% of the chain food
retailers were used in this study and regional variations in smaller chains may not have been
reflected in the food retailer measures. The exclusion of the non-chain food retailers is
particularly problematic for the northern schools, which were oversampled within the Health
Behaviours in School-aged Children Survey. These regions may have a greater number of non-
chain food retailers that were not captured, resulting in an underestimation of the relationship
between food retailers and eating out for lunch during the school day.
Finally, there are some variables that have not been accounted for in the analyses and
may be suspected confounders. For example, peer influence is an important determinant of fast
food consumption in young people. Those who frequently eat at fast food restaurants are more
likely to report that their friends were not concerned about healthy eating [16,17]. However, peer
influence is not a likely confounder because no association is expected between the presence of
food retailers near schools (exposure) and peer influence (potential confounder).

140
There is some evidence to suggest that there are differences in the availability of food
retailers based on area-level socioeconomic status (SES). In the US, Great Britain and Australia,
fast food restaurants are more prevalent in areas with a high proportion of racial minorities [18]
and low SES [19,20]. In addition, areas with low SES tend to have fewer supermarkets [21,22].
In Canada, however, the evidence to support this relationship is mixed. Seliske et al. [23] found
no relationship between the SES of the areas surrounding Canadian schools and the presence of
various food retailers. Apparicio et al. [24] also found no differences in access to supermarkets
by area-level SES in Montreal, QC. However, Smoyer-Tomic [25] et al. found a greater
prevalence of fast food restaurants in areas of low SES in Edmonton, AB. Thus, two of the three
Canadian studies found no association between area-level SES and access to food retailers. This
suggests that the relationship between area-level SES and the presence of certain food retailers
may not be as strong in Canada, particularly for areas surrounding schools. Therefore, area-level
SES measures were not considered as confounders in the second and third manuscripts.
However, it is possible that not accounting for school-level SES may have confounded the
relationship between exposure to food retailers and eating out during lunchtime at school.
7.4 Methodological Contributions
This thesis provided some important methodological contributions to studies using GIS-
based measures to assess the food retail environment. Current studies typically did not include
the use of handheld global positioning systems (GPS) devices to record and compare accuracy of
food retailer listings, which was one of the methodological limitations of studies of the food
retail environment [26]. The GPS devices provided data on the actual locations of food retailers,

141
rather than simply identifying them as present or absent. This is important because it quantified
the level of error present in studies which rely on secondary databases for food retailers.
A second major measurement issue that was addressed was the evaluation of the buffer
type (circular vs. road network) and size used to capture the food retailers surrounding a specific
geographic location. Previous research has compared the type of buffer used to measure the
physical activity environment [27], and this thesis addressed the need for analogous research for
the food retail environment. In addition, the third manuscript addressed a key methodological
limitation regarding the optimal buffer size to measure the food retail environment. New insights
were gained by including model fit criteria, and the findings provided important information to
guide future studies regarding the choice of buffer.
7.5 Public Health and Policy Contributions
In spite of some modest relationships between aspects of the built environment and
obesity-related outcomes, the potential public health implications of this thesis are important. In
the fourth manuscript, a one standard deviation increase in the urban sprawl score was associated
a moderately increased likelihood of engaging in active transportation (OR=1.24, 95% CI: 1.10-
1.39) among 12 to 15 year olds. However, the urban sprawl score was the lowest in the largest
metropolitan areas (Montreal, Toronto and Vancouver), which suggests that a substantial number
of young people living in those locations could benefit from interventions directed at increasing
active transportation. Additional research is needed to understand the mechanism of the
relationship between urban sprawl and active transportation prior to implementing interventions.
However, the benefits of modifying the built environment in order to support active
transportation in young people may also have a positive effect on other age groups.

142
With respect to the food retail environment, interventions directed at improving eating
behaviours among young people have a great deal of potential to influence health outcomes at
the population level due to the large effect sizes observed in the second and third manuscripts. In
the second manuscript, relationships were relatively strong, with exposure to 5 or more food
retailers associated with a 3.5-fold increased likelihood of eating at a snack bar, fast food
restaurant or café, and it resulted in a population attributable risk of 58%. The large population
attributable risk suggests that changing lunchtime eating behaviours through the modification of
the food retail environment near schools could have a large impact. The concept of population
attributable risk is an important one for the built environment, where relatively modest effects
can have important public health implications due to the large number of people affected by the
features of the built environment [28].
The results of the research on the food retail environment could also have some important
policy implications. The third manuscript identified the appropriate buffer size to use to identify
food retailers when assessing their influence on eating behaviours. Knowledge of the appropriate
buffer size may play an important role in determining where to implement interventions directed
at the modification of the food retail environment. For example, it may not be feasible for
provincial and/or municipal policies, for example, to apply across the board restrictions on the
number of food retailers that sell primarily unhealthy foods. However, it may be feasible to apply
such restrictions in specific areas. For instance, policies may be able to restrict the number of
food retailers to no more than three for the 1 km road network distance surrounding schools. This
may be met with less opposition compared to large-scale restrictions on food retailers. A second
benefit of having a clear and specific definition of the size of the food retail environment is that it

143
informs policymakers of the relevant area to evaluate the effectiveness of policies directed at
changing students‟ eating behaviours.
7.6 Future Research
Further research is needed to build upon the findings of this thesis. For etiological studies
of the food retail environment, there is a need for more detailed information on the lunchtime
eating behaviours of students. The amount of agreement between self-reported and actual
lunchtime eating behaviours is currently unknown. There is also a need for more detailed
information on the specific food retailers that students visit during breaks in the school day, as
well as the food items that are purchased. Such information would help researchers gain a better
understanding of the health implications of eating at food retailers that are located off school
grounds. Finally, as more information is gained about relationships between the food retail
environment and eating behaviours, there is a need for studies to examine the feasibility and
effectiveness of policies that modify the food retail environment in order to change eating
behaviours. In spite of the growing body of research on the influence of the food retail
environment on obesity-related behaviours, there is a dearth of evidence assessing whether
policies that address these environments are feasible or effective in changing people‟s
behaviours.
The low ICC values (< 1%) obtained for the fourth manuscript of this thesis indicated
that there was very little variation in the obesity and physical activity outcomes across census
metropolitan areas. Therefore, the association between urban sprawl and active transportation
within Canadian youth should be explored on a smaller geographic scale in order to obtain
sufficient variation in outcomes. Also, findings from this study indicated that urban sprawl had

144
the opposite effect on young Canadians compared to other populations of young people [7,8] and
adults [29-31]. There is a need for future research to provide a more detailed understanding of
the mechanism behind this relationship in order to explain the divergent associations, and also to
help inform interventions directed at increasing the proportion of youth who frequently engage in
active transportation and moderate-to-vigorous physical activity.
There are also some measurement issues which could expand upon the findings of this
thesis. First of all, since the second and third manuscripts are among the first to examine the size
and type of buffers surrounding schools using model fit criteria, there is a need for other studies
to replicate these studies in other populations in order to establish whether the relationships are
consistent. Second, there is a need for analogous research to address the measurement issues
regarding buffer size and type for the food retail environments surrounding the homes of young
people. This would help make it possible to conduct studies that incorporate the home and school
food retail environments within the same study sample, which would provide a more
comprehensive assessment of the food retail environment. Finally, due to the lack of a proper
distinction between full service and fast food restaurants in the online food retailer database, only
chain food retailers were considered within this thesis. It may be worth examining whether
students purchase foods mainly from chain food retailers, or whether non-chain food retailers
have an important role in young peoples‟ food choices.
7.7 Conclusions
Given the lack of success of interventions focused individual-level factors, this thesis
provided important insights into the relationship between the built environment, eating
behaviours and active transportation among Canadian youth. It not only demonstrated

145
associations between the built environment and obesity-related behaviours, but it also addressed
important questions regarding how to measure the food retail environment. Understanding the
context in which health behaviours occur is important because interventions directed at
modifying the built environment have potentially wide-ranging public health implications due to
the large number of people they can affect. However, there is a need for a greater understanding
of how to effectively implement policies designed to facilitate healthy lifestyle choices through
the modification of the built environment.

146
7.8 References
1. Cummins S, Macintyre S: Are secondary data sources on the neighbourhood food
environment accurate? Case-study in Glasgow, UK. Prev Med 2009;49:527-528.
2. Bader MD, Ailshire JA, Morenoff JD, House JS: Measurement of the local food
environment: a comparison of existing data sources. Am J Epidemiol 2010;171:609-617.
3. Lake AA, Burgoine T, Greenhalgh F, Stamp E, Tyrrell R: The foodscape: classification
and field validation of secondary data sources. Health Place 2010;16:666-673.
4. Paquet C, Daniel M, Kestens Y, Leger K, Gauvin L: Field validation of listings of food
stores and commercial physical activity establishments from secondary data. Int J Behav
Nutr Phys Act 2008;5:58.
5. Fleischhacker SE, Evenson KR, Rodriguez DA, Ammerman AS: A systematic review of
fast food access studies. Obes Rev 2011;12:e460-471.
6. Casey R, Oppert JM, Weber C, Charreire H, Badariotti D, Banos A, Fischler C,
Giacoman Hernandez C, Chaix B, Simon C: Determinants of childhood obesity: What
can we learn from built environment studies? Food Qual Prefer. In Press.
7. Ewing R, Brownson RC, Berrigan D: Relationship between urban sprawl and weight of
United States youth. Am J Prev Med 2006;31:464-474.
8. Slater SJ, Ewing R, Powell LM, Chaloupka FJ, Johnston LD, O'Malley PM: The
association between community physical activity settings and youth physical activity,
obesity, and body mass index. J Adolesc Health 2010;47:496-503.
9. Mecredy G, Pickett W, Janssen I: Street connectivity is negatively associated with
physical activity in Canadian youth International Journal of Environmental Research and
Public Health 2011;8: 3333-3350.

147
10. Laska MN, Hearst MO, Forsyth A, Pasch KE, Lytle L: Neighbourhood food
environments: are they associated with adolescent dietary intake, food purchases and
weight status? Public Health Nutr 2010;13:1757-1763.
11. Skidmore P, Welch A, van Sluijs E, Jones A, Harvey I, Harrison F, Griffin S, Cassidy A:
Impact of neighbourhood food environment on food consumption in children aged 9-10
years in the UK SPEEDY (Sport, Physical Activity and Eating behaviour: Environmental
Determinants in Young people) study. Public Health Nutr 2009;13:1022-1030.
12. van der Horst K, Timperio A, Crawford D, Roberts R, Brug J, Oenema A: The school
food environment associations with adolescent soft drink and snack consumption. Am J
Prev Med 2008;35:217-223.
13. Davis B, Carpenter C: Proximity of fast-food restaurants to schools and adolescent
obesity. Am J Public Health 2009;99:505-510.
14. Klesges LM, Baranowski T, Beech B, Cullen K, Murray DM, Rochon J, Pratt C: Social
desirability bias in self-reported dietary, physical activity and weight concerns measures
in 8- to 10-year-old African-American girls: results from the Girls Health Enrichment
Multisite Studies (GEMS). Prev Med 2004;38 Suppl:S78-87.
15. Shields M, Gorber SC, Tremblay MS: Estimates of obesity based on self-report versus
direct measures. Health Rep 2008;19:61-76.
16. Bauer KW, Larson NI, Nelson MC, Story M, Neumark-Sztainer D: Socio-environmental,
personal and behavioural predictors of fast-food intake among adolescents. Public Health
Nutr 2009;12:1767-1774.

148
17. French SA, Story M, Neumark-Sztainer D, Fulkerson JA, Hannan P: Fast food restaurant
use among adolescents: associations with nutrient intake, food choices and behavioral
and psychosocial variables. Int J Obes Relat Metab Disord 2001;25:1823-1833.
18. Block JP, Scribner RA, DeSalvo KB: Fast food, race/ethnicity, and income: a geographic
analysis. Am J Prev Med 2004;27:211-217.
19. Reidpath DD, Burns C, Garrard J, Mahoney M, Townsend M: An ecological study of the
relationship between social and environmental determinants of obesity. Health Place
2002;8:141-145.
20. Cummins SC, McKay L, MacIntyre S: McDonald's restaurants and neighborhood
deprivation in Scotland and England. Am J Prev Med 2005;29:308-310.
21. Powell LM, Slater S, Mirtcheva D, Bao Y, Chaloupka FJ: Food store availability and
neighborhood characteristics in the United States. Prev Med 2007;44:189-195.
22. Moore LV, Diez Roux AV: Associations of neighborhood characteristics with the
location and type of food stores. Am J Public Health 2006;96:325-331.
23. Seliske LM, Pickett W, Boyce WF, Janssen I: Density and type of food retailers
surrounding Canadian schools: variations across socioeconomic status. Health Place
2009;15:903-907.
24. Apparicio P, Cloutier MS, Shearmur R: The case of Montreal's missing food deserts:
evaluation of accessibility to food supermarkets. Int J Health Geogr 2007;6:4.
25. Smoyer-Tomic KE, Spence JC, Raine KD, Amrhein C, Cameron N, Yasenovskiy V,
Cutumisu N, Hemphill E, Healy J: The association between neighborhood socioeconomic
status and exposure to supermarkets and fast food outlets. Health Place 2008;14:740-754.
149
26. Charreire H, Casey R, Salze P, Simon C, Chaix B, Banos A, Badariotti D, Weber C,
Oppert JM: Measuring the food environment using geographical information systems: a
methodological review. Public Health Nutr;13:1773-1785.
27. Oliver LN, Schuurman N, Hall AW: Comparing circular and network buffers to examine
the influence of land use on walking for leisure and errands. Int J Health Geogr
2007;6:41.
28. Rose G: Rose's Strategy of Preventive Medicine. Oxford, U.K., Oxford University Press,
2008.
29. Garden FL, Jalaludin BB: Impact of urban sprawl on overweight, obesity, and physical
activity in Sydney, Australia. J Urban Health 2009;86:19-30.
30. Lee IM, Ewing R, Sesso HD: The built environment and physical activity levels: the
Harvard Alumni Health Study. Am J Prev Med 2009;37:293-298.
31. Ross NA, Tremblay S, Khan S, Crouse D, Tremblay M, Berthelot JM: Body mass index
in urban Canada: neighborhood and metropolitan area effects. Am J Public Health
2007;97:500-508.

150
APPENDIX A
Ethics Approval

151
Manuscripts 2 & 3

152

153
Manuscript 4

154
Health Behaviour in School Aged Children (HBSC) Survey Ethics Approval

155
APPENDIX B
Health Behaviour in School-aged Children (HBSC) Survey Methodology

156
Overview
The second and third manuscripts of this thesis were based on data collected from the
2009/2010 Canadian Health Behaviour in School-Aged Children (HBSC). The HBSC survey is
a cross-sectional survey that obtains information on a variety of health behaviours, health
determinants, and personal characteristics of students in grades 6 to 10 (approximate ages of 11
to 16 years old). It is carried out in affiliation with the World Health Organization, and 43
countries in Europe and North America participated in the 2009/2010 survey. In addition to the
student questionnaire, the HBSC collects information on school characteristics using an
administrator survey that is completed by the principal or designate at each of the participating
schools.
Sampling Strategy
In Canada, a single stage cluster sampling approach was used to obtain participants, in
accordance with an international protocol [1], with an oversampling of youth from some of the
provinces and the northern territories. In 2009/2010, New Brunswick and Prince Edward Island
did participate; all other provinces and territories were included. There were a total of 26,078
respondents from 436 schools in the 2009/2010 Canadian HBSC, and the overall response rate
was approximately 75%. The sample was weighted to account for oversampling of certain
provinces and territories.
The primary sampling unit of the HBSC survey is the classroom, with eligible classrooms
in each school having the same probability of being selected for the survey. Classes were
systematically selected from an ordered list based on school jurisdiction, province or region,
language, public/roam Catholic designation, community size, and community location. Youth
attending private schools, incarcerated youth, students from special needs schools and home
157
schooled students were excluded. Together, these youth represent <10% of Canadian youth in
the studied age range. Permission to participate in the survey was obtained from the school
board and school, as well as from parents or guardians (either explicitly or implicitly determined
by school board policy) and individual students. Participation in the survey was voluntary.
Permission to carry out the survey was obtained from the Queen‟s University General Research
Ethics Board (see Appendix A for ethics permission).
Administration of the Survey
The HBSC is a classroom-based survey which is conducted during the school day and
which is administered by the classroom teachers. Having students seal un-signed surveys in
enveloped ensured anonymity. The survey takes approximately 45 minutes for students to
complete. There are core questions within the HBSC that must be asked in all participating
countries, as well as optional themed modules that are completed in some but not all countries, as
well as country specific items. Core information includes demographic information (e.g. age,
sex, grade), as well as health behaviours (e.g. diet, physical activity, drug and alcohol use),
health outcomes (e.g. physical and emotional well-being) and social support (e.g. family, peer
and teacher support). The administrator survey contains information on school policies (e.g.
whether students are permitted to leave school grounds during the school day) and resources (e.g.
nutritional programs, condition of sports fields, presence of bicycle racks, etc.). For the
2009/2010 survey, data collection occurred from October 2009 until May 2010.

158
School Administrator’s Survey
The Canadian HBSC also includes an 8 page survey completed by the school principal or
designate to collect information on school characteristics, school built environment features, and
school policies and programs that may influence the health of students. This includes policies
and programs to promote physical activity, such as the amount of class time allotted for physical
education, the promotion of active transportation (e.g. presence of bike racks), and the
availability of physical activity facilities (e.g. running track, gymnasium, indoor swimming pool,
etc.). In addition, information on food sources within schools (e.g. cafeterias, snack/tuck shops,
vending machines) is collected, along with healthy eating programs, such subsidized access to
fruits and vegetables. Finally, the survey also gathers information on the overall school climate
through questions on student absenteeism, conflict among students, as well as overall crime and
safety issues in the surrounding school neighbourhood.
Reference
1. Currie C, Griebler R, Inchley J, Theunissen A, Molcho M, Samdal O, Dur W: Health
Behaviour in School-aged Children (HBSC) Study Protocol: Background, Methodology
and Background Items for the 2009/10 Survey. Edinburgh: CAHRU & Vienna: LBIHPR.
Found at: http://www.hbsc.org. 2010.

159
APPENDIX C
Relevant Questionnaire Items from the Student and Administrator
Health Behaviour in School Aged Children (HBSC) Surveys

160
The following HBSC survey questions were used for Manuscripts 2 and 3
HBSC STUDENT SURVEY QUESTIONS
Outcome: Lunchtime Eating Behaviour
Where do you usually eat your lunch or mid-day meal on school days? 1 at school 5 at someone else‟s home
2 at home 6 in a snack-bar, fast-food restaurant, cafe
3
somewhere else. Please write down where:_________________________
4 I never eat a lunch or mid-day meal
Student-Level Covariates
a) Age & Sex
Are you male or female?
1 Male
2 Female
What month were you born?
1
2 3
4 5
6 7
8 9
10 11
12
Jan Feb Mar Apr May June July Aug Sept Oct Nov Dec
What year were you born?
1
2 3
4 5
6 7
8
1991 1992 1993 1994 1995 1996 1997 1998

161
b) Family Affluence Scale
The Family Affluence Scale is derived from the following four questions below. The values
beside the selected answers (1, 2 or 3) are added up to receive a total score. Respondents who
receive a score of 3 or less are categorized into the low affluence group. The medium affluence
group is comprised of those with a score of 4 or 5, while those with a score of 6 or more are
categorized into the high affluence group.
Do you have your own bedroom for yourself?
0 No 1 Yes
Does your family own a car, van or truck?
0 No 1 Yes, one 2 Yes, two or more
During the past 12 months, how many times did you travel away on holiday (vacation) with
your family?
0 Not at all 1 Once
2 Twice
3 More than twice
How many computers does your family own?
0 None 1 One
2 Two
3 More than two

162
HBSC ADMNISTRATOR SURVEY QUESTIONS
School-Level Covariates
20. Do students have access to the following facilities where they can buy foods or drinks?
Yes No
a. Cafeteria
b. School shop
c. Candy and potato chips vending machine
d. Drinks vending machine (e.g., coke, soft drinks, orange
juice)
e. Milk vending machine/ milk program (e.g., milk, chocolate
milk)

163
APPENDIX D
Canadian Community Health Survey (CCHS) Methodology

164
Overview
The CCHS is a large cross-sectional survey of the determinants of health of Canadians. It
was first conducted in 2000/2001 and was carried out every two years until 2005. Beginning in
2007, the survey was changed to include a core annual component which remains relatively
consistent across all years of the survey. The core annual component collects information on
demographic characteristics, socioeconomic status, self-rated health and health care utilization,
as well as selected health behaviours (e.g. smoking, diet, physical activity, etc.). The 2007-2008
annual component was comprised of 131,061 respondents [1]. In addition to the core annual
component, data are collected on particular themes. For example, the theme for the 2007-2008
CCHS was based on healthy living. There are also different themes that are collected each year
of the survey. For 2007, the theme was health services and access, and in 2008 it was prevention
of chronic illnesses. Finally, there is also optional content that can be administered by different
regions in Canada. For more details on the health data collected in the 2007-2008 CCHS, see the
overview provided by Statistics Canada [2]. The fourth manuscript of this thesis used data from
the core annual component of the 2007-2008 CCHS.
Sampling Strategy
The target population for the CCHS includes Canadians 12 years of age and older. The
survey covers a large geographic area, with coverage at 98% for the provinces, 90% in the
Yukon, 97% in the Northwest Territories and 71% in Nunavut [1]. The CCHS obtains
participants from all 121 health regions in Canada. A complex multi-stage sampling process is
used to select participants, whereby the number of respondents selected is proportional to the
size of the province/territory they live in as well as their health region. In order to acquire the
survey sample, 49% of the respondents are obtained by the area frame, 50% from a telephone list

165
and 1% from random digit dialing. The number of people contacted is inflated in order to take
into account non-response.
Administration of Survey
Participation in the CCHS is voluntary and interviews are conducted either in person or
by telephone. The survey is administered by trained interviewers who use computer-assisted
interview (CAI) software to conduct the survey. The CAI software allows the interviewer to be
directed through the survey questions based on the respondent‟s personal characteristics (e.g.
age, sex, etc) as well as answers to previous questions. The CAI also provides built-in checks for
implausible or inconsistent answers, which can be corrected immediately.
Access to Data
Some of the data collected from the CCHS is available through Public Use Microfiles,
which can be accessed through the Statistics Canada. Steps have been taken to ensure that
privacy and confidentiality standards are met prior to the data being made available to the public.
These data are available free of cost to universities and also to the general public for a fee [1]. In
order for researchers to gain access to the full dataset from Research Data Centres (RDCs) across
Canada, they must submit a proposal to be approved by Statistics Canada. Researchers must also
have their study results reviewed prior to release from the RDCs in order to ensure that there are
no violations of privacy or confidentiality.
Limitations
The CCHS has some limitations that warrant consideration. First, the target population
excludes individuals living on Indian Reserves or Crown Land, full-time members of the
Canadian Forces, as well as individuals living in remote regions. Second, because the survey is

166
cross-sectional, it is not possible to directly determine causality. Finally, because the survey data
are obtained through self-report, it is likely that some bias is present in the study responses.
References
1. Statistics Canada. 2007-2008 CCHS Microdata File User Guide. http://www.statcan.gc.ca
/imdb-bmdi/document/3226_D7_T9_V6-eng.pdf. Accessed November 2011.
2. Statistics Canada. Canadian community health survey (CCHS). Content overview for
2007, 2008 and 2007-2008. http://www.statcan.gc.ca/imdb-bmdi/document
/3226_D45_T9_V1-eng.pdf. Accessed November 2011.

167
APPENDIX E
Relevant Questionnaire Items from the
Canadian Community Health Survey (CCHS)

168
Outcome Variables:
Overweight and Obesity: This variable was derived from self-reported heights (which could be
provided in cm or inches/feet)and weights (which could be provided in kg or lbs). For youth
aged 12 to 17 years, the International Obesity Task Force thresholds were used (shown below).
For youth aged 18 and 19 years, adult body mass index (BMI) thresholds of <25 kg/m2 (non-
overweight), 25-29.9 kg/m2 (overweight), and ≥30 kg/m
2 (obese) were used to determine weight
status. To maintain consistency between the age groups the underweight and normal weight were
both considered non-overweight or obese.
The description of how this variable was derived is for 12 to 17 year olds is provided below:
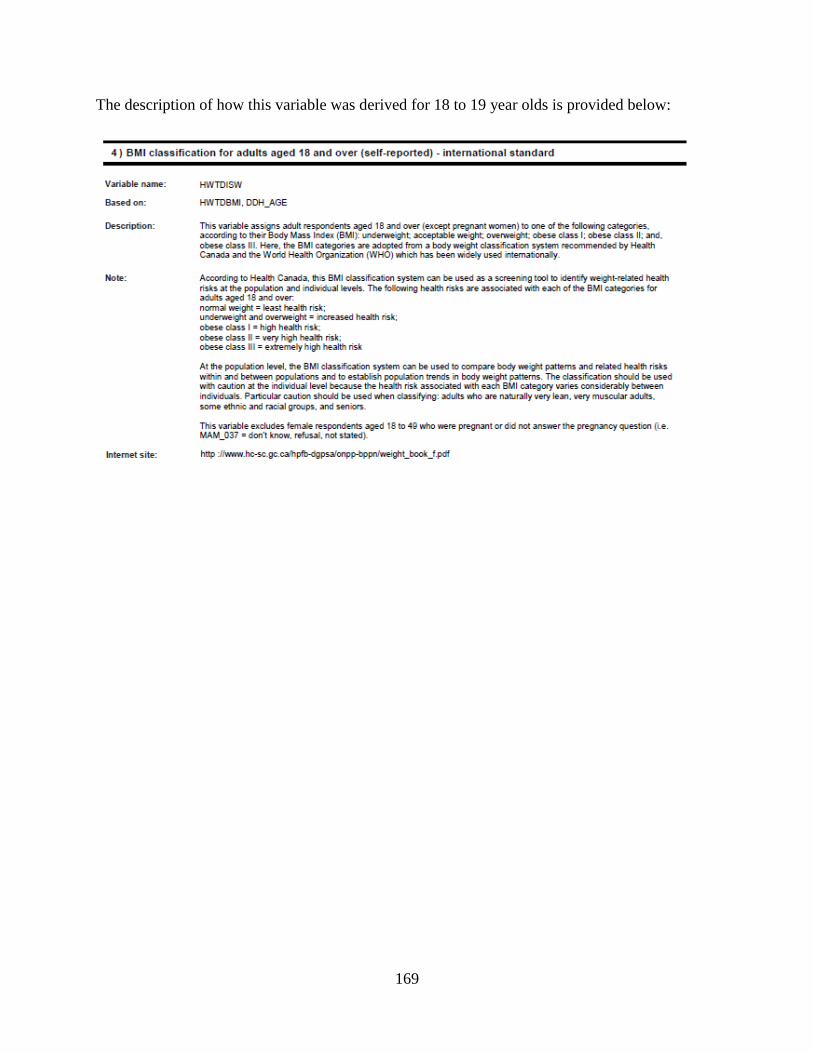
169
The description of how this variable was derived for 18 to 19 year olds is provided below:
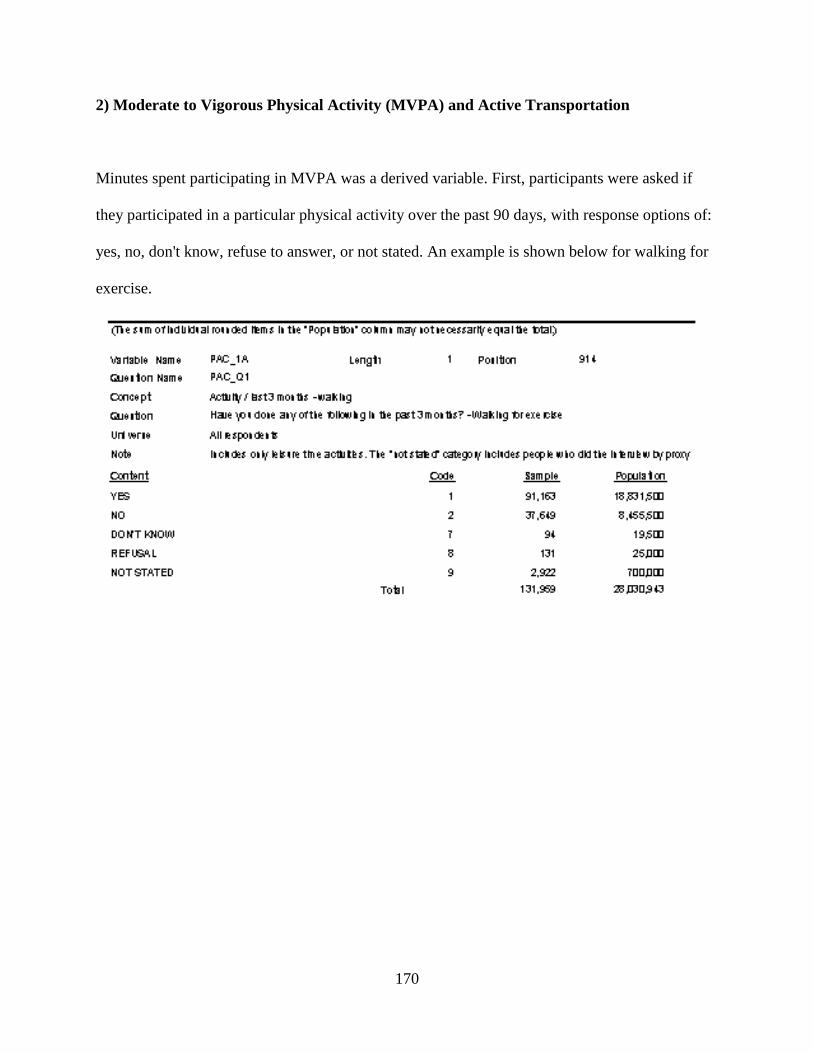
170
2) Moderate to Vigorous Physical Activity (MVPA) and Active Transportation
Minutes spent participating in MVPA was a derived variable. First, participants were asked if
they participated in a particular physical activity over the past 90 days, with response options of:
yes, no, don't know, refuse to answer, or not stated. An example is shown below for walking for
exercise.

171
For respondents who answered yes, don‟t know or refused to answer, they were asked follow up
questions to obtain the frequency and duration of the activity, which were both close-ended
categorical variables. The frequency of walking for exercise is shown below, with the number of
times permitted to range from 1 to 270.
Next, information is obtained on the typical duration of the activity:

172
To obtain the total number of minutes of walking for exercise over the past 3 months, the
frequency is multiplied by the number of minutes assigned to the duration categories. The
duration categories were used in the National Population Health Survey [1]. The number of
minutes corresponding to each category is provided in the Table 1 below:
Table 1. Duration of physical activity assigned to response categories in the CCHS
Category Duration
0 to 15 minutes
16 to 30 minutes
31 to 60 minutes
More than 60 minutes
13 minutes
23 minutes
45 minutes
60 minutes
The number of minutes of physical activity over the 3 month period was then divided by
90 to get the average daily physical activity. This was used to categorize participants based on
whether they obtained at least 60 minutes per day, which is in accordance with the Canadian
Physical Activity Guidelines [2].
To determine the total MVPA among participants, the responses to all physical activity
questions were used. Active transportation contained a subset of the activity. The specific
activities included in both outcomes are listed in Table 2.
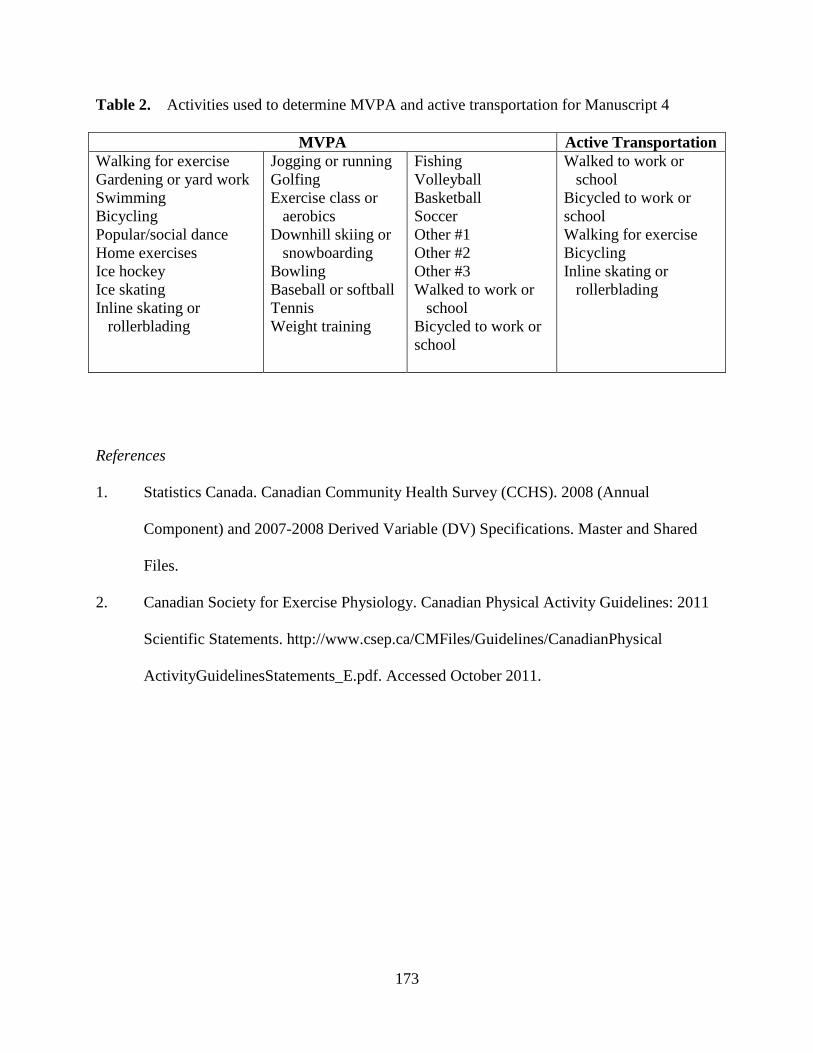
173
Table 2. Activities used to determine MVPA and active transportation for Manuscript 4
MVPA Active Transportation
Walking for exercise
Gardening or yard work
Swimming
Bicycling
Popular/social dance
Home exercises
Ice hockey
Ice skating
Inline skating or
rollerblading
Jogging or running
Golfing
Exercise class or
aerobics
Downhill skiing or
snowboarding
Bowling
Baseball or softball
Tennis
Weight training
Fishing
Volleyball
Basketball
Soccer
Other #1
Other #2
Other #3
Walked to work or
school
Bicycled to work or
school
Walked to work or
school
Bicycled to work or
school
Walking for exercise
Bicycling
Inline skating or
rollerblading
References
1. Statistics Canada. Canadian Community Health Survey (CCHS). 2008 (Annual
Component) and 2007-2008 Derived Variable (DV) Specifications. Master and Shared
Files.
2. Canadian Society for Exercise Physiology. Canadian Physical Activity Guidelines: 2011
Scientific Statements. http://www.csep.ca/CMFiles/Guidelines/CanadianPhysical
ActivityGuidelinesStatements_E.pdf. Accessed October 2011.

174
APPENDIX F
Geographical Information Systems (GIS) Methodology

175
Overview
In this Appendix a detailed description of the GIS-based measures used for Manuscript 1
is described in detail, followed by a similar description for the GIS-based measures used
Manuscripts 2 and 3. Next, key limitations inherent to GIS-based measures of the food retail
environment are outlined. Finally, the specific protocol that I developed to obtain food retailer
addresses and map the food retailers using GIS is included at the end of this Appendix.
Manuscript 1
Mapping School Locations
CanMaps Streetfiles (DMTI Spatial Inc., v.2009.4, Markham ON) was the source of
geographic data used. It provided information on features of the surrounding environment,
including: bodies of land and water, road networks, and schools. A GIS software program
(ArcGIS: ESRI, version 9.3) was used to create a 1 km circular buffer surrounding each of the 34
schools included in the field validation study. Contained within the 1 km buffer were: the school,
roads, and bodies of water.
Obtaining the Food Retailer Addresses
The addresses for the food retailers within 1 km of schools were obtained from an online
database (www.yellowpages.ca) and a commercial database (InfoCanada). Spreadsheets
containing the addresses of full service restaurants, limited service restaurants, and convenience
stores were created in Microsoft Excel. The relevant fields included the food retailer name, street
address, city, province and postal code. If any of the address fields were missing (i.e., not
provided by yellow pages), an online search was conducted to obtain the missing information.
Mapping the Food Retailer Addresses
176
The completed Excel spreadsheets were then uploaded into ArcGIS software and the
software‟s address locator tool was used to map the food retailers surrounding each of the 34
schools. When the initial mapping process was complete, the address locator provided a match
score out of 100, which indicated how accurate the mapping process was for each food retailer.
For food retailers with a score of less than 80, an online search was conducted to check whether
the address information was complete and accurate. If it was still not possible to improve the
match score to a value greater than 80, the Google Earth Street View tool (©2011 Google) was
used to visually locate the food retailer and to obtain the latitude and longitude coordinates that
could be used to manually map the food retailer.
Field Validation
For each of the 34 schools included in the validation study, a list of the food retailers to
be measured was generated along with a map of the roads within the school‟s 1 km buffer. Two
researchers (the PhD candidate and an undergraduate research assistant that was supervised by
the candidate) conducted the validation study, with each researcher responsible for one of the
databases (e.g., the commercial or yellow pages directory).
Once the food retailers were located within the field, their street entrances were recorded
using a handheld Global Positioning Systems (GPS) device (Garmin Dakota 10). If a food
retailer was not initially found, a phone call was made to the retailer to obtain information on its
location. GPS devices use satellites to obtain the longitude and latitude coordinates of a given
geographic location [4]. The Garmin 10 GPS device is accurate within 3 to 5 metres under
optimal conditions [5]. However, the presence of tall buildings and other obstructions to satellite
communications can affect accuracy [4].
177
After the field work was complete, the longitude and latitude coordinates recorded by the
GPS devices were then transferred to ArcGIS. For each food retailer found within the field, the
Euclidian distance (also referred to “as the crow flies” or the straight line distance) between the
GPS-recorded location and the listed address was calculated. The proportion of the listed food
retailers that were found in the field was obtained.
Manuscripts 2 and 3
Mapping School Locations
Similar to Manuscript 1, the locations of the 158 schools in Manuscripts 2 and 3 were
identified within the CanMaps Streetfiles databases. The location of each school was also
verified within Google Earth Street View (©2011 Google). For remote locations where Street
View was unavailable, the principal or other staff member was contacted to help identify the
school‟s location and map it using a satellite image. For Manuscript 2, a 1 km circular and 1 km
road network buffer were created around each school using ArcGIS. For Manuscript 3, six road
network buffers of varying sizes were created (500 m, 750 m, 1000 m, 1500 m, 2000 m and 5000
m).
Obtaining the Food Retailer Addresses
Since there was a higher proportion of food retailers located using the online databases
(www.yellowpages.ca), it was used as the source of food retailers for both the second and third
manuscripts. The food retailer types were chosen to correspond to the Health Behaviour in
School-Aged Children survey question which formed the outcome of both manuscripts. They
included fast food restaurants, coffee/donut shops and convenience stores.

178
Mapping the Food Retailers
The mapping procedure was similar to the process described for Manuscript 1, whereby
spreadsheets were created containing the name of the food retailer as well as the address
information (street address, city, province, and postal code). Efforts were made to find missing
information by carrying out online searches of food retailers. The locations of food retailers with
a match score of less than 80 were visually confirmed, and corrected if necessary, using Google
Earth Street View (©2011 Google). After the food retailers were mapped, the number of food
retailers within the buffer of interest was obtained using ArcGIS.
Limitations of GIS Measures of the Food Retail Environment
Although GIS-based measures of the food retail environment may avoid the biases
associated with subjective observations, they have some limitations which warrant consideration.
First, there is the possibility that the food retailer databases are not up to date. New food retailers
may not be listed or food retailers that have closed may not have been removed from the
databases. Secondly, there is the possibility that the address information is not accurate.
Although efforts were made to ensure that the address information was complete as possible, it is
possible that incorrect information was included, such as the wrong street number or street type
(e.g. avenue, street, road, boulevard, etc), which would not be detected by the match score.
Finally, for the online database, food retailers were obtained through an advertisement
subscription, so food retailers whose owners choose not to advertise within it are excluded.

179
COLLECTING ADDRESSES FOR MANUSCRIPT 1
Classifying Food Retailers:
Step 1: Setting Up Spreadsheets
In Excel, set up a spread sheet for each school with the following column titles: Food Retailer
Name, Category, Address, Postal Code, Distance From School. At the lower left hand corner of
the spread sheet, there are tabs labeled as „Sheet1‟, „Sheet2‟, and „Sheet3‟. Rename them as Full
Service Restaurants, Ltd. Service Chain Restaurants, and Convenience Stores and type in the
column headings described above for each of the sheets.
Step 2: Gathering Location Data for Restaurants
Go to www.yellowpages.ca and choose „Search by Proximity‟. Type in the school address and
the following key words (1 at a time):
- Restaurants
- Ice cream & frozen desserts
- Sandwiches
- Donut
For the first 4 key words, cut and paste the names of the restaurants, the location (street address),
postal code and distance from the school on the „Restaurants‟ sheet. Do this for the restaurants
1.2 km or closer. I‟m unsure of the accuracy of the distance from school in the yellowpages
website, so I want to overshoot the 1 km by a small margin for the time being.
Step 3: Copying and Pasting Selected Food Retailers into the Limited Service Spreadsheet
The next step is to review the restaurants found and identify limited service restaurant chains.
These include:
-Burger King
-Domino‟s Pizza
-McDonald‟s
-Wendy‟s
-Subway
-241 Pizza
-Tim Horton‟s
-Harvey‟s
-A&W
-Double Double Pizza Chicken
-Pizza Pizza
-Mr. Sub
-KFC
-Arby‟s
-Pita Pit
-Starbucks
-Baskin Robins
-Dairy Queen

180
-Country Style Donuts
At this point in time, this is an evolving list, so if you come across any others you think are
missing, email me and I‟ll add it to the list
-Currently, I am still waiting for a commercial list of food retailers around schools (i.e. we pay to
get a list created for us). Because I‟m unsure comparable they will be to the yellowpages, I just
want colour coded in the main “Restaurants” list so I can go back and retrace my steps if I need
to.
- Limited Service listed under Restaurant = Purple
- Limited Service listed under Sandwiches = Green
- Limited Service listed under Ice cream & Frozen Desserts = Orange
- Limited Service listed under Donuts = Blue
- Take all the highlighted food retailers and copy and paste into Ltd. Service Restaurants. Change
the colour of the restaurants back to white.
Step 4: Gathering Location Data for Convenience Stores
- Go back to www.yellowpages.ca and choose „Search by Proximity‟. Type in the school address
and the key word “Convenience Stores”. Copy the name, address and distance from the school
for each convenience store. For the time being, collect information for all convenience stores
within 1.3 km.

181
GIS FOOD RETAILER PROTOCOL
COLLECTING ADDRESSES FOR MANUSCRIPTS 2 & 3
A) Convenience Stores
Step 1. Go to www.yellowpages.ca and click on the „By proximity‟ Tab
Step 2. Fill in the school address information in the relevant boxes.
Tip: If you are performing multiple searches for the same school (i.e. later on, when you’re
looking for the location of multiple fast food restaurants), leave the “What?” box blank. For the
next step, the website will highlight the missing field and ask you to fill it in. If you use your back
button on your browser, then all you need to do is fill in different food retailer names without
typing in the school address over and over. This will save you some time.
Step 3: Click the „Find‟ button to obtain your results.
Important Note: If you’re collecting data for a small town and entering the street address
does not give you any results, then use the town name, and not the postal code. You will
know the street address is not coming up with results because it will say something to that
effect. If there are simply no restaurants within range, then generic web search results will
come up (similar to a Google search results page).
For my work with the food retailers surrounding schools, I am interested in the food retailer
addresses around a 5 km circular buffer. However, the distance information is not as precise
when I start mapping them in ArcGIS. For example, when I map in ArcGIS, the food retailer
within 5.2 km actually falls within the 5 km circular buffer created in ArcGIS. Therefore, I
overshoot a bit and include all the food retailers within a 5.5 km distance from the schools.
Back to the Montcalm Secondary School example, I need all the addresses from page 1 and the
first 7 from page 2.
A modified web browser should come up, and that is where I paste the website address for page
1 of my search results. After the result page loads, click „Import‟.
Step 4. Cleaning up the Data
You will notice that there is a lot of extra info in the header of the website (about 50ish lines
worth). I‟ve deleted all that and come to the first convenience store.
Keep the first 5 lines of text (the unusual numbering scheme here is due to a process in SAS).
Delete the intervening lines. This will make sense later when I process the Excel spreadsheet in
SAS.
1
2
3
4
0

182
I find it helpful here to check to see if there are any intervening lines of text that should not be
there.
When you‟re finished, save your work and make a note of the file location. Create a file for each
province with the type of food retailer in the name. Then save the results under the school name
e.g.
F:\Ontario - Convenience Stores\Montcalm SS.xlsx
Step 5. Importing & Processing Data into SAS
PROC IMPORT OUT= WORK.test
DATAFILE= "C:\Documents and Settings\Laura\My Documents\PhD
Thesis\Manuscripts 2 and 3\Ontario – Convenience Stores\Montcalm SS.xlsx"
DBMS=EXCEL REPLACE;
RANGE="Sheet1$";
GETNAMES=NO;
MIXED=NO;
SCANTEXT=YES;
USEDATE=YES;
SCANTIME=YES;
RUN;
This is where you import the file you just created in Excel.
*creating a variable x1 numbering the lines from 0 to 4;
data new;
set test;
x1 = mod(_n_, 5);
run;
This is where I tell SAS to number the lines from 0 to 4.
*deleting the lines numbered 0, 2 and 4, and keeping lines 1 and 3 (=name/distance & address);
data new2;
set new;
if x1 = 0 then delete;
if x1 = 2 then delete;
if x1 = 4 then delete;
run;
Next, we only want lines 1 and 3 (food retailer name and address), so the above code deletes the
other lines. The rest of the code in my SAS program is data management where I merge name
and addresses together into 1 dataset and get rid of extra variables I no longer need.
Delete
1
2
3
4
0 Delete
1
2
3
4
5
Delete

183
The one problem with the address field as given from the yellow pages website is that the
relevant info (street name, city, province, postal code) is separated by commas. I need each piece
of information as its own variable. The code below accomplishes this.
data nameadd3;
set nameadd2;
delim=',';
street_name = scan(address,1,delim);
city = scan(address,2,delim);
prov = scan(address,3,delim);
post_code=scan(address,4,delim);
run;
Note: For schools in Quebec, I needed to add another field for street number because they are
often separated by a comma from the street address. ( e.g. Depanneur 7 Jours address: 8864, rue
Centrale, Lasalle, QC, H8P1P4). I commented this out in the SAS code as well, and that code
will be used instead of the above code in Quebec.
Finally, if everything is working properly in the SAS program, we can export our SAS file back
into Excel. The code below does that. For naming the file to send it out, I created a file with the
province name, two letter abbreviation for the food retailer type, followed by the word geocode.
This is the file I will use to geocode in ArcGIS.
PROC EXPORT DATA= WORK.NAMEADDFINAL
OUTFILE= "C:\Documents and Settings\Laura\My Documents\PhD Thesis\Manuscripts
2 and 3\Ontario CS geocode\Montcalm SS.xls"
DBMS=EXCEL LABEL REPLACE;
SHEET="5km CS";
RUN;
Open the new excel file you have created, and you will need to do a few things
- Rename the F1 column as „name‟. For whatever reason, I could not properly rename it in SAS
- Check for duplicate entries for food retailers. Delete any duplicates you come across (duplicate
= same address & postal code, same or very similar names).
- Some postal codes may be missing from some retailers. Look up the food retailer address from
the food retailer‟s website. If that doesn‟t work, use Canada Post‟s online postal code finder
(www.canadapost.ca).
- Check to see if some entries have mall/shopping plaza addresses. If they do, look up the street
address of the mall/shopping plaza online and put that in the spreadsheet instead.
When you‟re finished, save your changes and start the next school

184
GEOCODING INSTRUCTIONS
General concepts for ArcGIS
- Working with layers. Need to be in a logical order, starting with land and water at the bottom,
street layer next, and school on top.
- Can drag layers to change their order, change colours (right mouse click) and shape (left mouse
click) and turn them off and on using the checkboxes.
- If you ever get lost somewhere in the map, right click the 5 km circular buffer layer and select
„Zoom to Layer‟
Step 1: Adding the appropriate layers to ArcGIS
i) Map Layers
You will find the layers stored in a similar way for each school. For example, for school number
388, which is Gleneagle Secondary School, located in Coquitlam, BC. Work with the data in the
Projected folder only.
E:\PhD Thesis\Manuscripts 2 and 3\5 km buffers\BC schools\388 Gleneagle SS\Projected
For this step, I have created the map layers that you will need. The layers that you will be using
are:
- school
- roads
- water (if appropriate)
-5 km buffer (edu_123), where 123 is the school ID number
You will need to add the layers mentioned above using the „Add Data‟ button and change the
colours as appropriate. Hold down the „Ctrl‟ button to select multiple layers at the same time.
ii) Food Retailer Addresses
The default view of the far left window in ArcGIS is the „Display‟ view. To add the spreadsheet
information to the map, switch to the „Source‟ tab.
Add in the spreadsheet with addresses for each food retailer type (coffee donuts, convenience
stores, limited service using the „Add Data‟ button as you did for the map layers.
Step 2: Geocoding the Addresses
Go to Tools Geocoding Geocode Addresses

185
A box will come up, prompting to you to select an Address Locator. This will be found in the
files Andrei put on your computer using the large USB device.
Go to the CanStreets file, and navigate your way to the provincial street file. The last 2 files
you‟ll go to are the province folder and the street folder. The address locator is the two letter
province followed by „rte‟. E.g. for British Columbia roads, the Address Locator is BCrte. You‟ll
only need to do this for the first food retailer type you geocode.
Click OK. A dialog box like this will then come up:
- Click the name of table you wish to geocode (coffee donuts in this example)
- Select „street_name‟ for the „Street or Intersection‟ box. „City‟ should already be selected.
- Choose a name for the resulting layer within the „Projected‟ file of the school you are
geocoding: „coffee donuts‟, „convenience stores‟ or „limited service‟.
- Click on the Advanced Geometry Options button and switch from the „Use the address
locator‟s spatial reference‟ (top option) to „Use the map‟s spatial reference‟ (middle option).
When you‟re done, click OK
Always click „Rematch‟ when you receive the summary box.
To determine if the addresses have been geocoded adequately, you will need to check by clicking
the „Rematch button‟. The Match Score is provided in the Interactive Rematch box below. The
match score is a rating out of 100, with 100 indicating a perfect match. Scores above 80 will be
deemed adequate for the purposes of my study.
Step 3: Fixing Unmatched Addresses:
There are 4 problems that usually arise when geocoding addresses.
Problem #1: Municipality does not correspond to one given in the address.
This is usually an issue with larger cities. For example, a street address from the Yellow Pages
might be given as „Toronto‟, but in the road network layer, the street address corresponds to a
smaller municipality such as Etobicoke, Mississauga, Vaughan, etc.
To fix this, right click on the road layer and select „Open Attribute Table‟. A spreadsheet should
come up listing all the streets. To sort them alphabetically, right click on the column with the
street name and select „Sort Ascending‟. Scroll through the list until you find the street name in
question. Look at the nearby municipality and if this differs from the one circled in red in the
address rematcher. If it is different, type the correct municipality in the Zone box, and hit the
search button at the bottom of the rematcher. If a match comes up with a score of 80 or above,
then select it and hit the „Match‟ button.

186
Problem #2: Yellow Pages Street address Number out of Range of the Geocoder
This is by far the most common source of unmatched addresses. The address geocoder for the
road networks is almost always incomplete. For example, say you have an address of 160 Main
Street, but the road network only has addresses locations available for 100 – 120 Main Street.
Although 160 Main Street is a completely valid address, it won‟t geocode properly. Instead, the
address matcher will pick the closest address it can find, and then assign it a score usually in the
mid 60 range.
To get a more precise location, we will need to use Google Earth:
- Type in the unmatched address in the „Fly to‟ box of Google Earth. This will centre your screen
over the address you‟re looking for
- Go to the Add menu bar and select Placemark. This will give you the Latitude and Longitude
coordinates of the address.
- We will be cutting and pasting the Latitude and Longitude coordinates into ArcGIS. NOTE:
The order of the latitude/longitude coordinates are the opposite in ArcGIS and Google Earth, so
ensure you cut and paste in the correct order. Degrees West are first in ArcGIS.
- To cut and paste the coordinates into ArcGIS, go to the XY box on the top menu bar in ArcGIS
Press the blue bull‟s eye button to put a point on that address on your map, and then select the
magnifying glass to zoom to it. I also like to use the dialog box (the one with XY in the square
box) to type in the address of this point in case the same address comes up later (i.e. a plaza with
multiple food retailers). Use the black arrow on the upper menu bar to double click to edit the
contents of the dialog box to change it from lat/long to a street address).
Bring up the Interactive Match dialog box again with the address you looked up highlighted in
bright blue and select the „Pick Address from Map‟ button (shown on the next page). Right click
the location you marked with the XY coordinates button.
Problem #3: Ties
Sometimes there will be a tie in address candidates, and 2 candidates will appear nearly identical
in the Candidate list box. In this case, use Google Earth to find the address. Select the candidates
one at a time in ArcGIS, and click the Zoom to Candidates button (just to the left of the „Pick
Address from Map‟ button). Choose the location that matches most closely to what you see in
Google Earth. These locations are usually quite close together.
Problem #4: Numbered Streets

187
For some reason, the address locator does not recognize numbered street names (i.e. 450 9th
Street). Andrei is working on fixing this. For now, I am not going to geocode addresses where
this is a predominant street address type (i.e. Alberta), but for the few streets like this that come
up, treat it as you would for problem #2 I outlined above.
Miscellaneous tips:
1. ArcGIS always goes to the last folder you were working in. When you start geocoding for the
next school, make sure your new layer is saved in the CORRECT folder
2. When you‟re finished geocoding and want to work with the next map, ArcGIS will ask you to
if you want to save your map as a .mxd file. You can go ahead and do this if you want to access
the map on your own computer. However, when I put the files on my computer, I will be adding
the layers (school, water, roads, buffer, food retailers) individually and those are always saved
properly regardless if the map is saved as a .mxd file or not.

188
References
1. Fleischhacker SE, Evenson KR, Rodriguez DA, Ammerman AS: A systematic review of
fast food access studies. Obes Rev 2011;12:e460-471.
2. Fraser LK, Edwards KL, Cade J, Clarke GP: The geography of Fast Food outlets: a
review. Int J Environ Res Public Health 2010;7:2290-2308.
3. Williams LK, Thornton L, Ball K, Crawford D: Is the objective food environment
associated with perceptions of the food environment? Public Health Nutr 2011:1-8.
4. Parkinson BW, Spliker J: The Global Positioning System: Theory and Applications.
American Institute of Aeornautics and Astronautics, 1996.
5. Garmin: Dakota 10 and 20 Owner's Manual. http://www8.garmin.com/manuals/
Dakota10_OwnersManual.pdf. Accessed November 2011.
6. Technomic. Top 200 Canadian Chain Restaurant Report. Chicago, IL: Technomic Inc;
2010.

189
APPENDIX G
Power and Sample Size

190
Manuscript 1
A priori sample size calculations were carried out in the planning stages of this study
using the tabulations for screening tests provided by Flahault et al. [1]. Estimated sensitivity
values were based on the relatively conservative findings reported by Paquet et al. [2]. An
expected sensitivity of 0.70 was chosen for the online food retailer database, with a lower
acceptable confidence value of 0.60. For the commercial database, the expected sensitivity was
0.85, and a lower acceptable confidence value of 0.75 was selected. Power was set at 80% and
the alpha value was equal to 0.05. The table below compares the target sample size and the
actual sample size.
Table. Comparison of the actual versus required sample sizes for Manuscript 1
Although the required sample sizes were not met for the individual food retailer types,
the total sample size for the total number of food retailers exceeded those suggested by the
sample size estimates.
Database
Full Service
(N)
Fast Food
(N)
Convenience
(N)
Total
(N)
Required
(N)
Online 368 140 87 595 248
Commercial 338 326 85 749 176

191
Manuscript 2
The a priori sample size calculation for this study was based on the presence or absence
of food retailers within approximately 1 km of schools. Studies have found that at this distance,
food retailer exposure ranged from 30 percent [3] to 58 percent [4]. Based on this range, an
exposure prevalence of 50% was used in the sample size calculation. At the time the sample size
calculation was carried out, the available literature suggested there were relatively modest
associations between the food retail environment and obesity outcomes, with odds ratios ranging
from 1.07 [5] to 1.30 [6]. Therefore, an estimated odds ratio of 1.20 was used, along with 80%
power and an alpha value of 0.05. The initial sample size calculated for this study was 2,844.
However, due to the clustered nature of the data, a design effect of 1.4 for the HBSC was used to
inflate the required sample size to 3,982 [7]. The sample size of 6,971 obtained in the second
manuscript demonstrated that the study was adequately powered.
It is important to note that when this study was carried out, having four exposure groups
rather than a dichotomous exposure may have influenced study power. However, the magnitude
of the relationships was also stronger than expected. Therefore, a posteriori calculations were
conducted to verify that sufficient study power was obtained. For the 1 km road network buffers,
study power was 65.9%. It increased and it increased to over 99% for the 3 to 4, and > 5 food
retailer exposure categories. For the circular buffers, study power was 2.6% for the 1 to 2 food
retailer exposure category, 91.8% for the 3 to 4 food retailer exposure category, to >99.9% for
the > 5 food retailer exposure group.

192
Manuscript 3
For the third manuscript, it was expected that associations between food retailers
surrounding schools and students‟ eating behaviours would not be strong for buffer sizes greater
than 1 km. For the distances of 500 m, 750 m and 1 km, the prevalence of exposure to all food
retailer types was estimated to be 20, 30 and 50 percent, respectively. Incorporating the same
power, alpha values and design effect as the second manuscript, the sample sizes obtained ranged
from 3,982 to 5,572. For the larger distances, exposure was anticipated to be measured in
quartiles, rather than a dichotomous exposure and the required sample size was calculated to be
5,688.
The primary objective of this manuscript was to determine the optimal buffer size rather
than to demonstrate etiological associations. Therefore, it was expected that associations between
the presence of food retailers and eating behaviour outcomes would be weak to non-existent for
distances greater than 1 km. Furthermore, at the smallest distances, there may not have been a
sufficient number of food retailers present to demonstrate an association. Since it was determined
that there was adequate power for the a posteriori calculations for the 1 km network distance, a
lack of power to detect associations with the largest and smallest buffer sizes is not a concern
and therefore a posteriori calculations were not conducted.
Manuscript 4
In the planning stages of this study, an expected odds ratio of 1.2 was used, which
corresponded to the associations between urban sprawl and obesity in American youth found by
Ewing et al. [8]. The prevalence of overweight and obesity included in the sample size
calculation was 25%, which corresponded to the levels found in Canadian youth [9]. Exposure to

193
urban sprawl was expected to be in tertiles. The initial sample size calculated with power set at
80% and an alpha value of 0.05 was 4,266. However, the design effect was not taken into
account because the issue of clustering was not immediately apparent. However, because of the
complex sampling design used for the 2007-2008 CCHS, a design effect of 2.25 required for the
sample size calculation [10], and resulted in a final sample size of 9,600. Since only 7,017
participants were included in the study, it is clear that there may be insufficient study power in
this manuscript.
References
1. Flahault A, Cadilhac M, Thomas G: Sample size calculation should be performed for
design accuracy in diagnostic test studies. J Clin Epidemiol 2005;58:859-862.
2. Paquet C, Daniel M, Kestens Y, Leger K, Gauvin L: Field validation of listings of food
stores and commercial physical activity establishments from secondary data. Int J Behav
Nutr Phys Act 2008;5:58.
3. Zenk SN, Powell LM: US secondary schools and food outlets. Health Place 2008;14:336-
346.
4. Seliske LM, Pickett W, Boyce WF, Janssen I: Association between the food retail
environment surrounding schools and overweight in Canadian youth. Public Health Nutr
2009;12:1384-1391.
5. Davis B, Carpenter C: Proximity of fast-food restaurants to schools and adolescent
obesity. Am J Public Health 2009;99:505-510.
6. Grafova IB: Overweight children: assessing the contribution of the built environment.
Prev Med 2008;47:304-308.

194
7. Health Behaviour in School-Aged Children: A WHO Cross-National Survey. Research
Protocol for the 1997-1998 Study. http://www.ruhbc.ed.ac.uk/hbsc/download
/respro98.pdf. Accessed November 2011.
8. Ewing R, Schmid T, Killingsworth R, Zlot A, Raudenbush S: Relationship between urban
sprawl and physical activity, obesity, and morbidity. Am J Health Promot 2003;18:47-57.
9. Shields M: Overweight and obesity among children and youth. Health Rep 2006;17:27-
42.
10. Statistics Canada. Canadian Community Health Survey (CCHS): 2007-2008 Public Use
Microdata Files Approximate Variability Tables. http://www.statcan.gc.ca/imdb-
bmdi/document/3226_D43_T9_V3-eng.pdf. Accessed November 2011.