Embed Size (px)
Citation preview
Pedro BentancourtANFAVEA Vice‐president
The Brazilian transport and
industry sectors
Brazilian Automotive Complex
2
EMPLOYMENT(Direct and indirect)1,3 million people
GDP SHARE (2015)(Including Autoparts Industry)
Industrial: 22%Total: 4%
WORLD RANKING
Sales: 8th position
Production: 9th position
REVENUE (2016)(Including Autoparts Industry)
US$ 46,9 billion
PLANTS65 Industrial Units
10 States42 Cities
TAXES (2016)R$ 45 billion
NATIONAL AUTOMOTIVE ENGINEERING
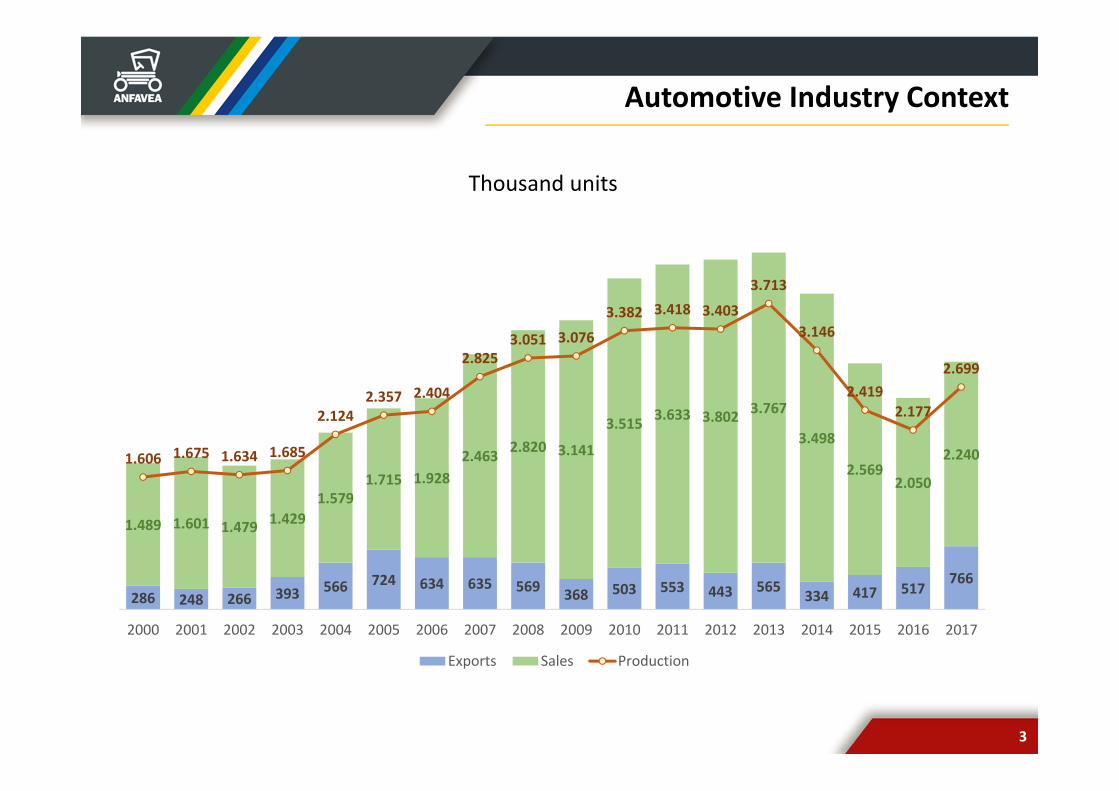
Automotive Industry Context
3
286 248 266 393 566 724 634 635 569 368 503 553 443 565 334 417 517766
1.489 1.601 1.479 1.4291.579
1.715 1.9282.463 2.820 3.141
3.515 3.633 3.802 3.767
3.498
2.5692.050
2.2401.606 1.675 1.634 1.685
2.1242.357 2.404
2.8253.051 3.076
3.382 3.418 3.403
3.713
3.146
2.4192.177
2.699
2000 2001 2002 2003 2004 2005 2006 2007 2008 2009 2010 2011 2012 2013 2014 2015 2016 2017
Exports Sales Production
Thousand units
4
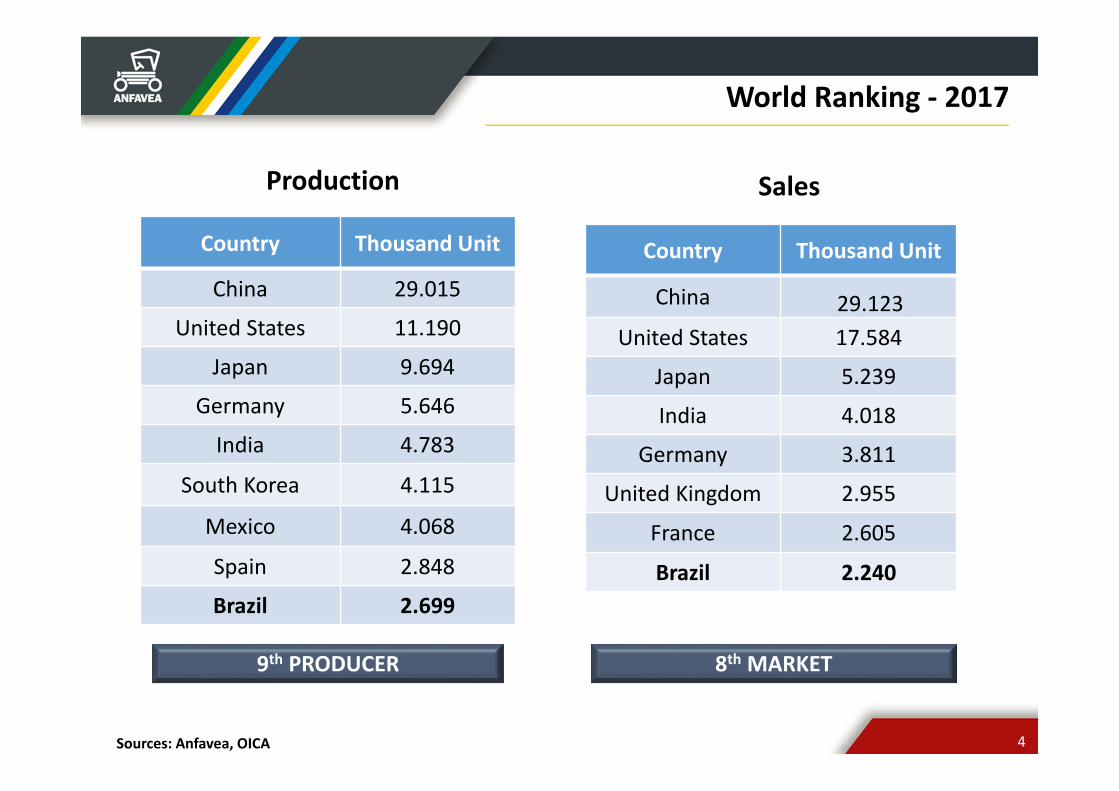
World Ranking ‐ 2017
Sources: Anfavea, OICA
9th PRODUCER 8th MARKET
Sales
Country Thousand Unit
China 29.015
United States 11.190
Japan 9.694
Germany 5.646
India 4.783
South Korea 4.115
Mexico 4.068
Spain 2.848
Brazil 2.699
Country Thousand Unit
China 29.123United States 17.584
Japan 5.239
India 4.018
Germany 3.811
United Kingdom 2.955
France 2.605
Brazil 2.240
Production
5
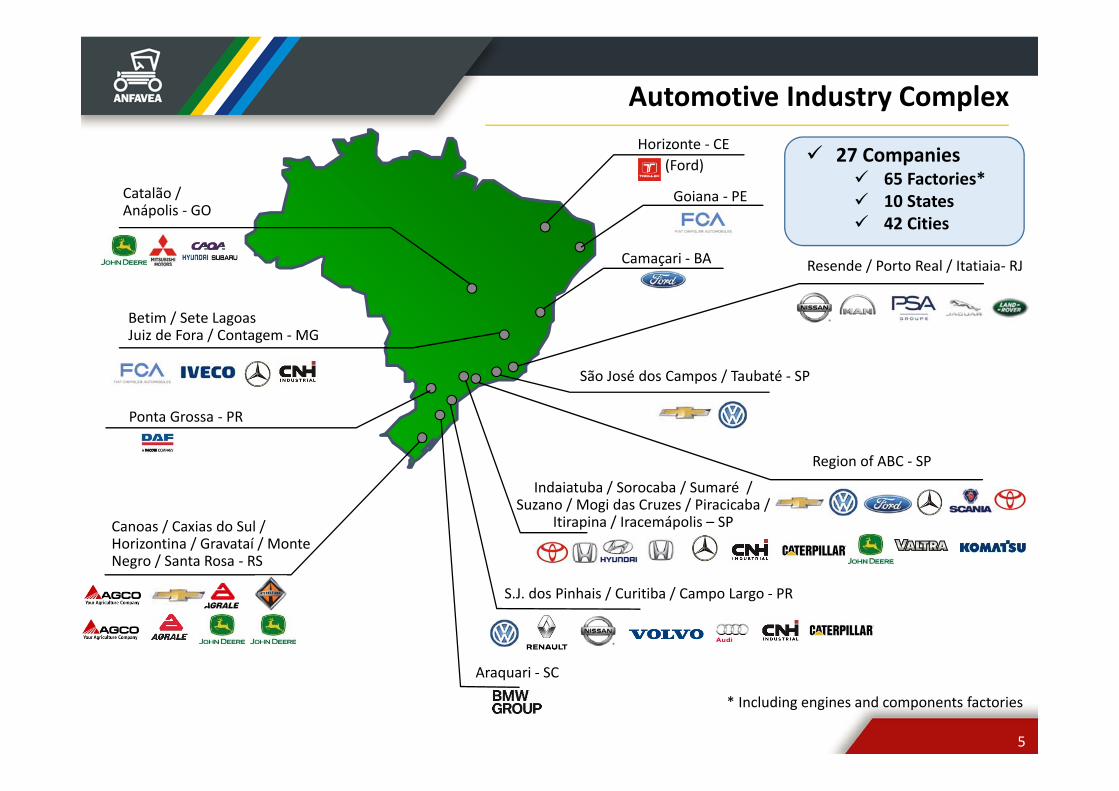
Automotive Industry Complex
Resende / Porto Real / Itatiaia‐ RJ
Region of ABC ‐ SP
S.J. dos Pinhais / Curitiba / Campo Largo ‐ PR
Indaiatuba / Sorocaba / Sumaré / Suzano / Mogi das Cruzes / Piracicaba /
Itirapina / Iracemápolis – SP
Betim / Sete LagoasJuiz de Fora / Contagem ‐MG
Catalão /Anápolis ‐ GO
São José dos Campos / Taubaté ‐ SP
Camaçari ‐ BA
Horizonte ‐ CE(Ford)
Ponta Grossa ‐ PR
Goiana ‐ PE
Canoas / Caxias do Sul / Horizontina / Gravataí / Monte Negro / Santa Rosa ‐ RS
Araquari ‐ SC
* Including engines and components factories
27 Companies 65 Factories* 10 States 42 Cities
Desafios dos Gases do Efeito Estufa
Motivados pelo desafio de reduzir os gases do efeito estufa, diversos países estabelecem metas e buscam as melhores soluções.
6
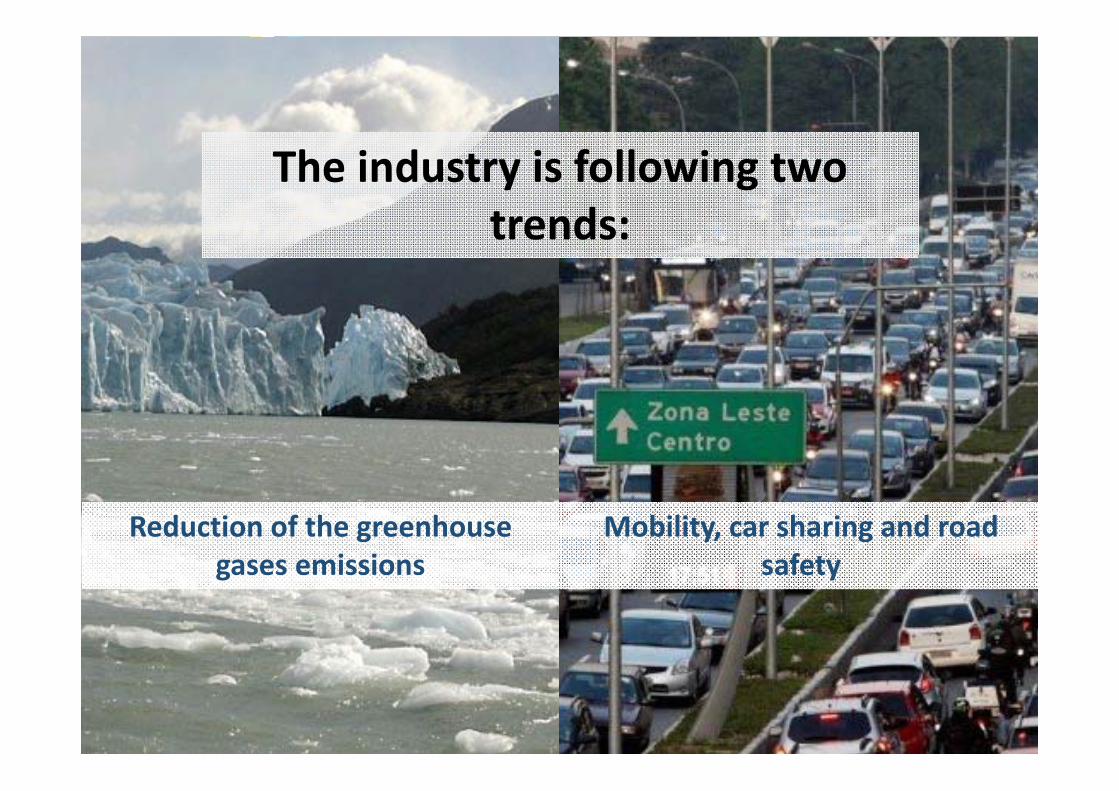
The industry is following two trends:
Reduction of the greenhouse gases emissions
Mobility, car sharing and road safety
7
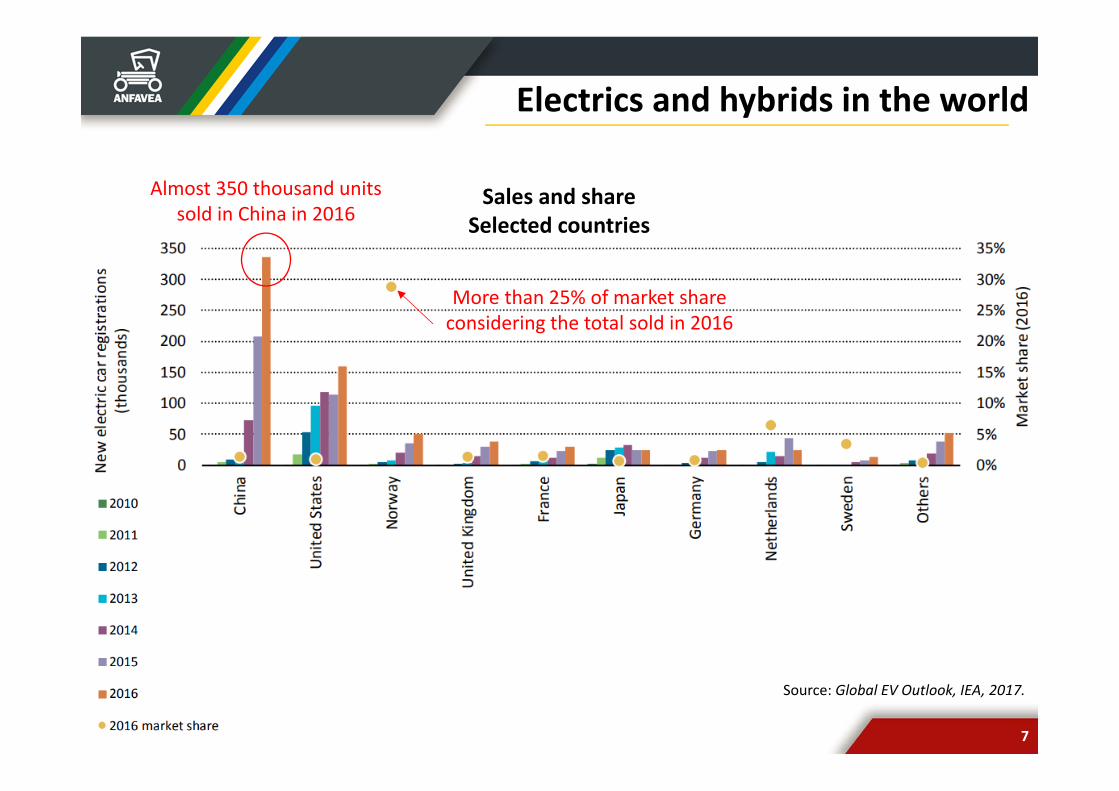
Electrics and hybrids in the world
Source: Global EV Outlook, IEA, 2017.
Sales and share Selected countries
Almost 350 thousand units sold in China in 2016
More than 25% of market share considering the total sold in 2016
8
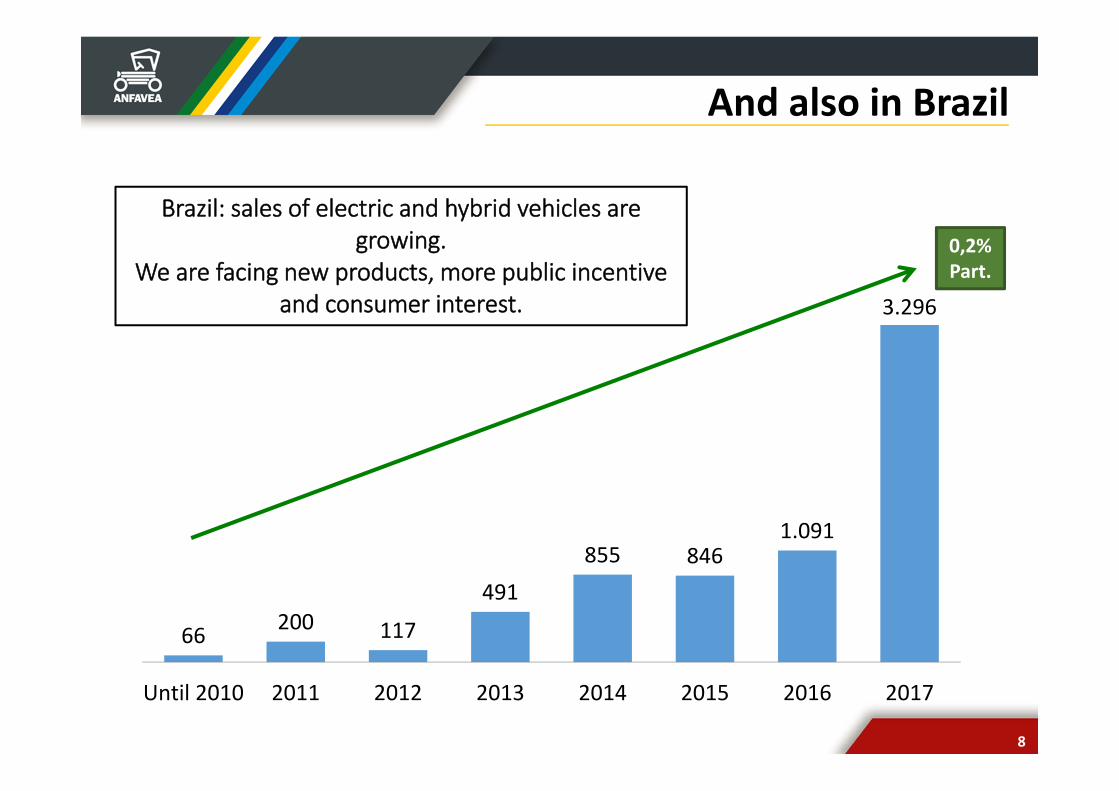
Brazil: sales of electric and hybrid vehicles are growing.
We are facing new products, more public incentive and consumer interest.
66 200 117
491855 846
1.091
3.296
Until 2010 2011 2012 2013 2014 2015 2016 2017
0,2%Part.
And also in Brazil
9
Motor a combustão
Our reality allows a little more...
...such as biofuels.
11
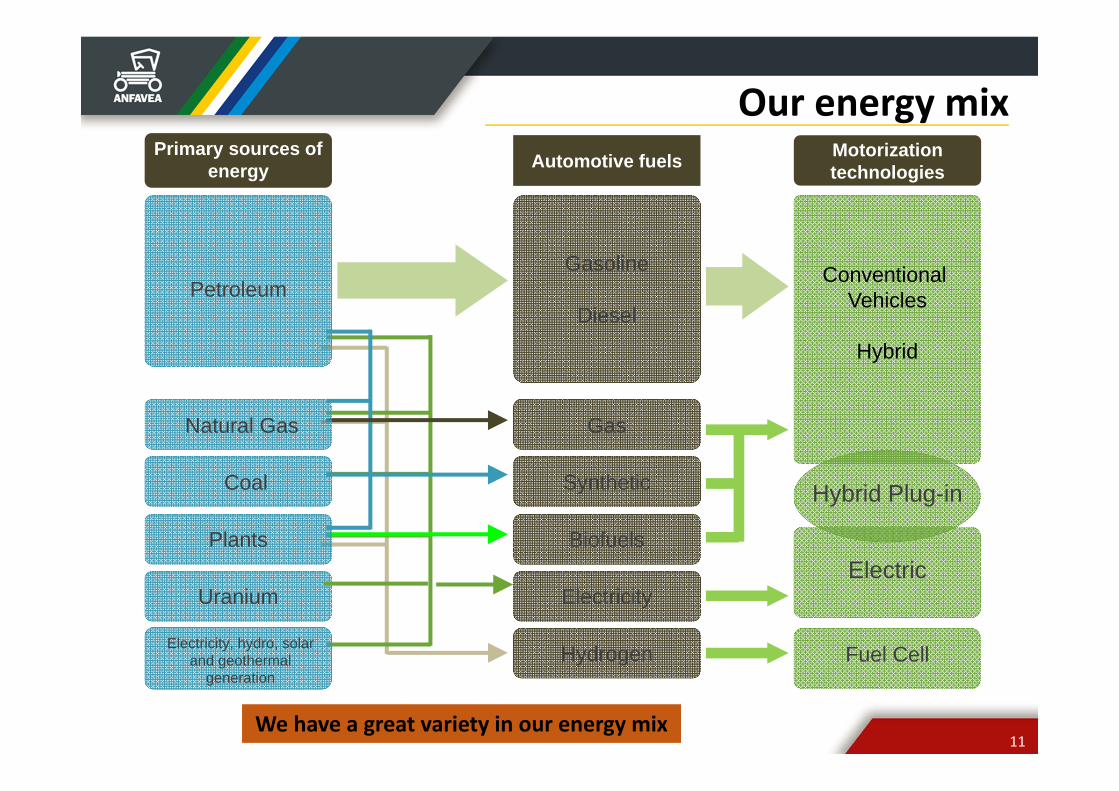
Biofuels
Primary sources of energy Automotive fuels Motorization
technologies
Petroleum
Natural Gas
Coal
Plants
Uranium
Electricity, hydro, solar and geothermal
generation
Gas
Synthetic
Electricity
Hydrogen
Diesel
Gasoline Conventional Vehicles
Hybrid
Electric
Fuel Cell
Hybrid Plug-in
Our energy mix
We have a great variety in our energy mix
12
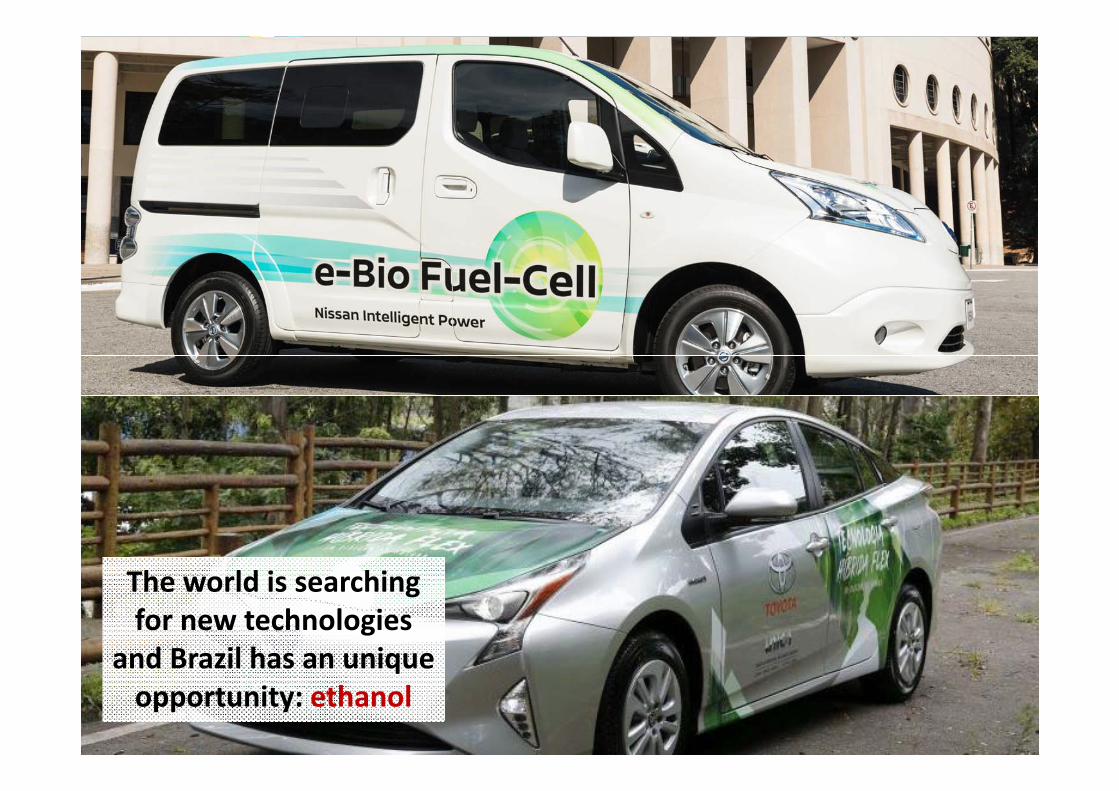
The world is searching for new technologies
and Brazil has an unique opportunity: ethanol
13
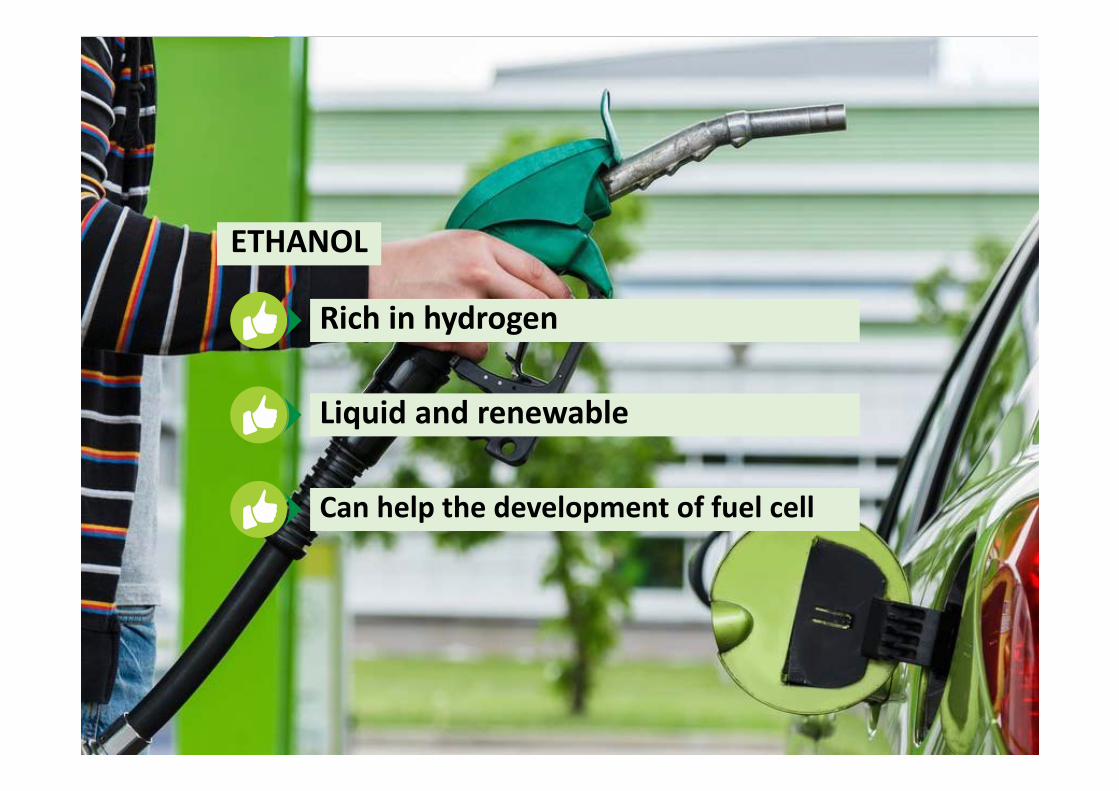
Rich in hydrogen
Liquid and renewable
Can help the development of fuel cell
ETHANOL
14
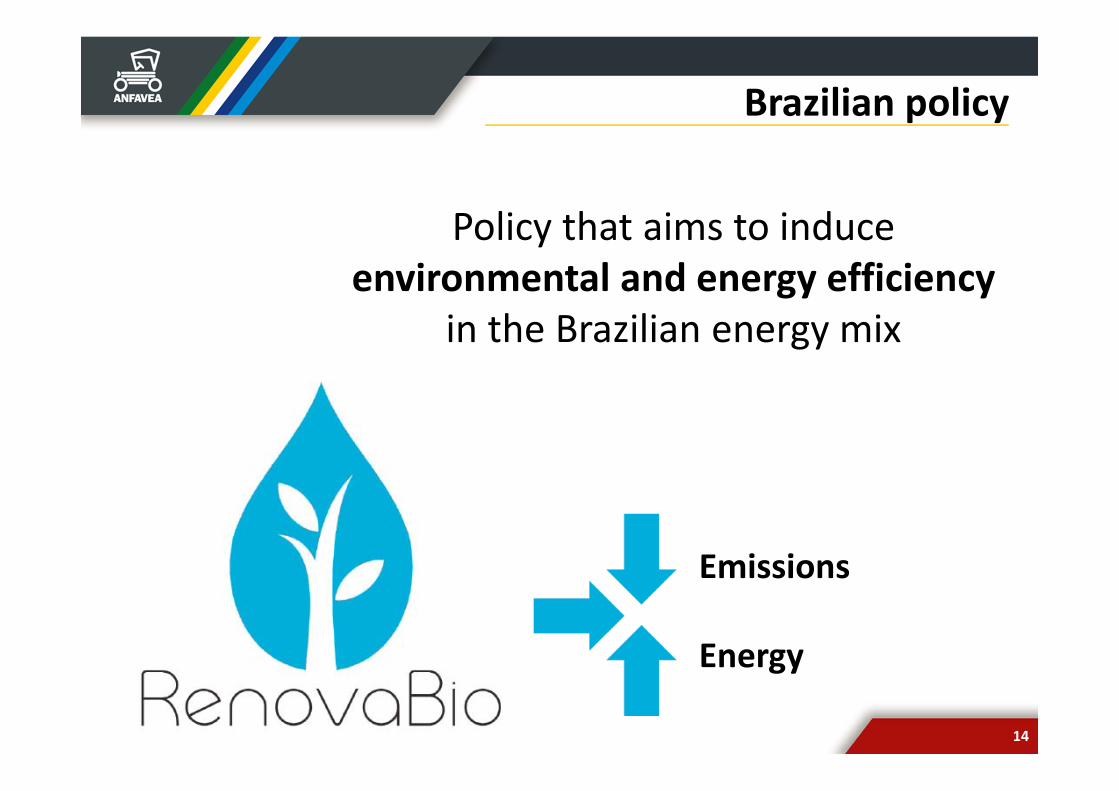
Brazilian policy
Policy that aims to induce environmental and energy efficiency
in the Brazilian energy mix
Emissions
Energy
15
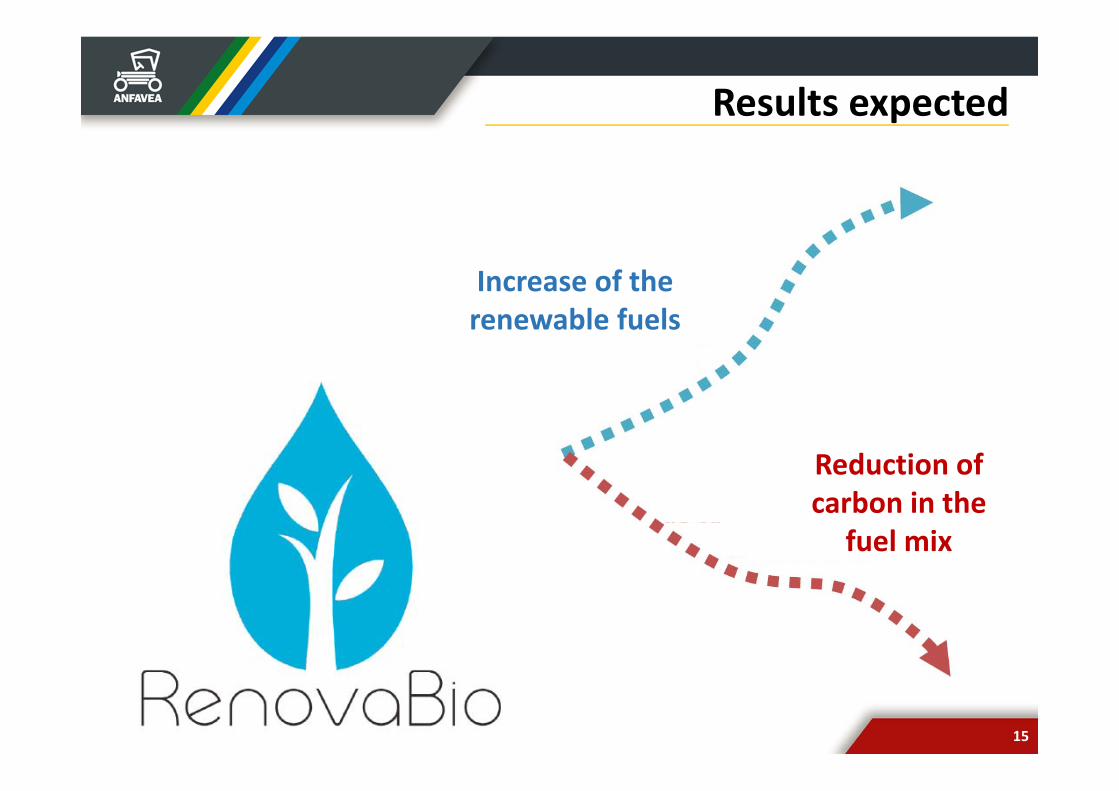
Results expected
Increase of the renewable fuels
Reduction of carbon in the
fuel mix
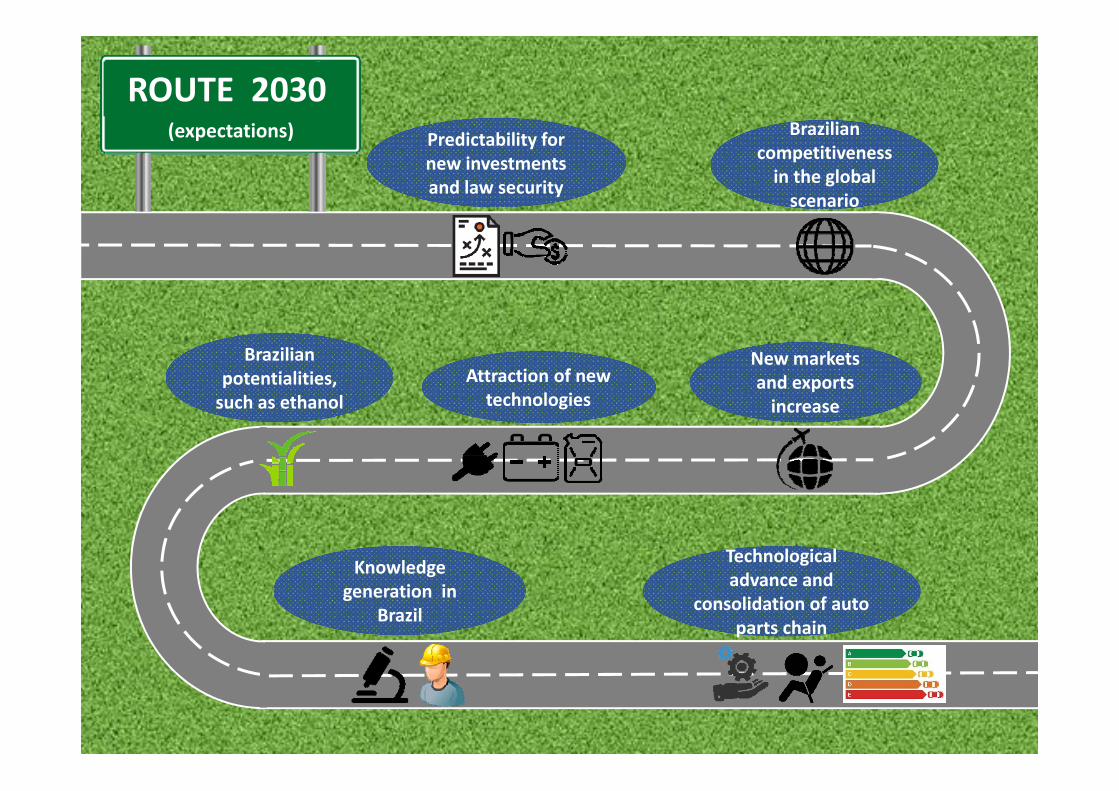
ROUTE 2030Predictability for new investments and law security
Attraction of new technologies
New markets and exports increase
Technological advance and
consolidation of auto parts chain
Brazilian potentialities, such as ethanol
Knowledge generation in
Brazil
Brazilian competitiveness in the global scenario
(expectations)
Thank you!
Pedro BentancourtANFAVEA Vice‐president
www.anfavea.com.br
17


![SUCDEN SUGAR MARKET REPORT€¦ · CS Brazilian production [Apr/March, Left: Mt sugar & Mm3 ethanol - Right: Mt cane] CS: CANE AND SUGAR MIX QUITE STABLE CS Brazilian cumulative rains](https://img.pdfslide.us/doc/110x75/5f31ee5d18ddf7479c1ba381/sucden-sugar-market-report-cs-brazilian-production-aprmarch-left-mt-sugar-.jpg)