Embed Size (px)
Citation preview
The Brazilian Agricultural
System
FarmSmart Conference 2015
Rozanski Hall University of Guelph
By Nadiel Pacheco Kowalski
Director of NPKConsultoria, Brazil

Filadélfia Farm – Mato Grosso State

Countries with nominal GDP over US$ 600 billion
Countries with population over 100
million
Countries with area over 2 million km²
Australia
Russia
USA
Brazil
China Japan
Bangladesh
Nigeria
Pakistan
Indonesia
Canada
France
Germany Italy
Spain
Mexico
South Korea Netherlands
India
U K
Turkey
Algeria
Argentina
Congo
Kazakhstan
Saudi Arabia
Sources: IMF(GDP), UN
B.R.I.C.S. in evidence

4 Sources:
Brazil - Banco Central do Brasil
Brazil 2014
GDP: US$ 2.24 tri
GDP per capita: U$ 11,067
Brazil: South America’s Powerhouse
Brazil represents 50%
of South America’s
total GDP

Greece
Ukraine
Bosnia
Croatia
Macedonia
Iceland
Yugoslavia
Norway
Finland
Switzerland
Belarus
Austria Hungary Romania Netherland Lithuania Italy Poland Estonia
Tchecoslováquia
France
Ireland
Belgium
Albania
Portugal
Spain Bulgaria
United Kingdom Germany
Latvia
Denmark
Sweden
Source: J. L. Coelho, John Deere, 2001. Source: J.L.Coelho, John Deere, 2001
Size is also a problem

A Country of Contrasts
Opposite HDI in different regions –HDI (Human Development Index) of Norway and Africa.
Country of contracts: One of the highest Gini coefficient.
“ Rich spends in three days what the poor spends in a year”
30% of population with 72% of total disposable income.
5% with less than $1.25/day
NORTHEAST
POP – 27,6%
PP – 18%
SOUTHEAST
POP – 42,6%
PP – 51,6% SOUTH
POP – 14,6%
PP – 18,4%
MID-WEST
POP – 7,1%
PP – 6,6%
NORTH
POP – 8,1%
PP – 5,4%
POP=Population
PP=Purchasing Power
Globo presentation to MBAs

The State of São Paulo
Sources: IBGE, Brazilian Central Bank and SEADE .

Canada & Brazil

Brazil:
Canada’s 13th Largest Export Market
Rank Country US Mi
01 United States 358,534.6
02 European Union 35,290.8
03 China 21,774.2
04 United Kingdom 14,751.7
05 Japan 10,937.0
06 Mexico 6,762.9
07 Hong Kong 4,689.8
08 Germany 4,073.1
09 Netherlands 3,677.2
10 South Korea 3,666.7
11 France 3,320.7
12 Belgium 2,643.0
13 Brazil 2,586.0

10
Top 10 Canadian Exports
Source: Statistics Canada
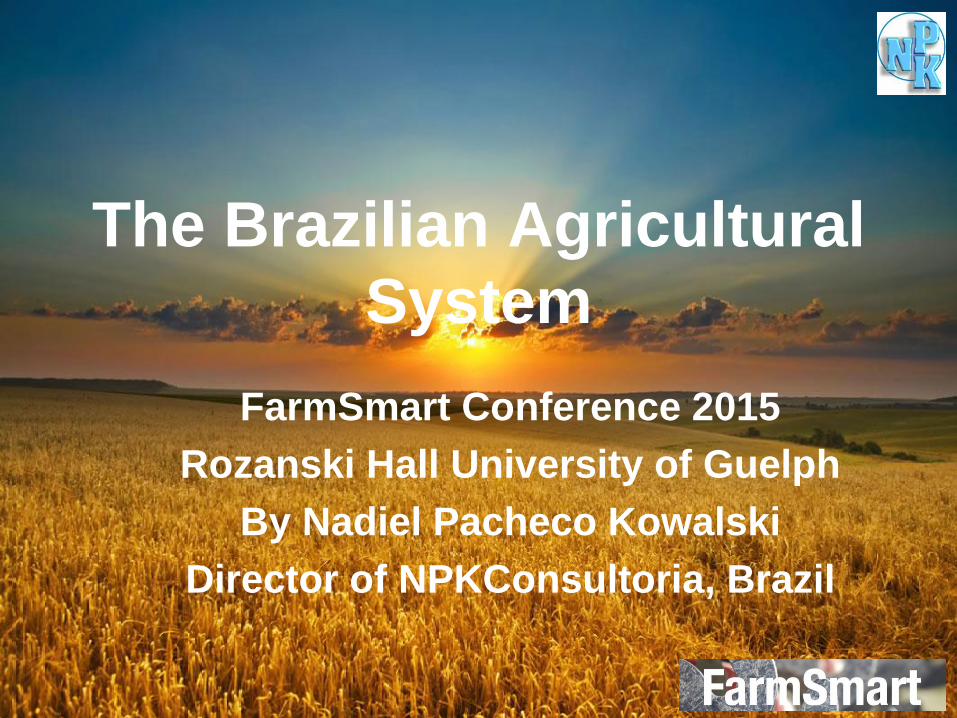
Top 10 Canadian Imports
Source: Statistics Canada

Canada & Brazil Bilateral Investments
CDI
C$ 9.8 billion
Sectors:
Agriculture, Mining,
Shopping Centres,
Telecommunications,
Software, Environmental
Ind. Automotive Parts
Brazil is the 12th largest
destination for Canadian
outward investment
FDI
C$ 15.8 billion
Sectors:
Mining,
Steel,
Beverages,
Cement,
Software
Canada is the 7th largest
destination for Brazilian
outward investment
Source: Statistics Canada.

Rural Investments in Brazil
• Would you like to invest in Brazil, maybe buy
10 or 20 thousand he in the Central West
Region by yourself or with 5 or 6 partners and
organize a rural condominium?
• You’ll need a local administrator;
• A Brazilian partner;
• There are always good opportunities!

Brazilian Agribusines System

(*) Not Available for agriculture/grazing: Amazon region, other forests, national and state parks, urban areas and water ressources.
First Expansion (70’s 80’s)
Second Expansion (90’s 00’s)
“Cerrados” diversification from the beef
and soy model to corn, cotton,
poultry, pork, sugarcane, dairy
and coffee
Brazil
(850 million ha) • Not available*: 460 million ha
• Agriculture: 60 million ha
• Pastures: 230 million ha
• Available land: 100 million ha
The New Agriculture Frontier

Brazil – Territorial Division
Divided in 5 different regions (by the Brazilian Institute of Geography and Statistics)
1) North Region 2) Northeast Region 3) Central-West Region 4) Southeast Region 5) South Region

Source: MAPA / Biomes MMA 2006 / ABRAF
Biomes

Current land use in Brazil
Limit states Amazon biome Pantanal biome Alto Paraguai river basin Areas planted with pa sture Areas used for crops/livestock Areas used for agriculture
Limit states
Amazon biome
Pantanal biome
Alto Paraguai river basin
Areas planted with pasture
Areas used for crops/livestock
Areas used for agriculture
Legend
Total area : . . . . . . . . . . . .851 M ha Land suitable for agriculture (65%): . . ..555 M ha Land in use (39%): . . . . . .330 M ha Area of rural properties INCRA 2010 (67%): . . . . . 572 M ha Conservation Units + Indigenous Lands (26%): .220 M ha

Current land use in Brazil
DISTRIBUTION
AREA
(million/he
%
Amazon rainforest 350
41,1
Pasture
220
25,9
Protected areas
55
6,5
Annual crops
47
5,5
Permanent crops
15
1,8
Cities, rivers, lakes, roads, etc
20
2,4
Reforestation areas
6
0,7
Total
713
83,8
Other uses
37
4,3
Available area for agriculture
101
11,9
Total
851
100,0
Fonte: IBGE, com adaptação do MAPA / ABRAF 2013

Source: Conab / MAPA and IBGE (pastures – 2013)
MAIN CROPS - Area
Most of recent expansion in
agricultural area is on
pasture land

Data from FAO, except for Brazil (IBGE), elaboration G.B.Martha.
Let’s Compare Agricultural Land Use

Let’s Compare Agricultural Land Use

Let’s Compare Agricultural Land Use
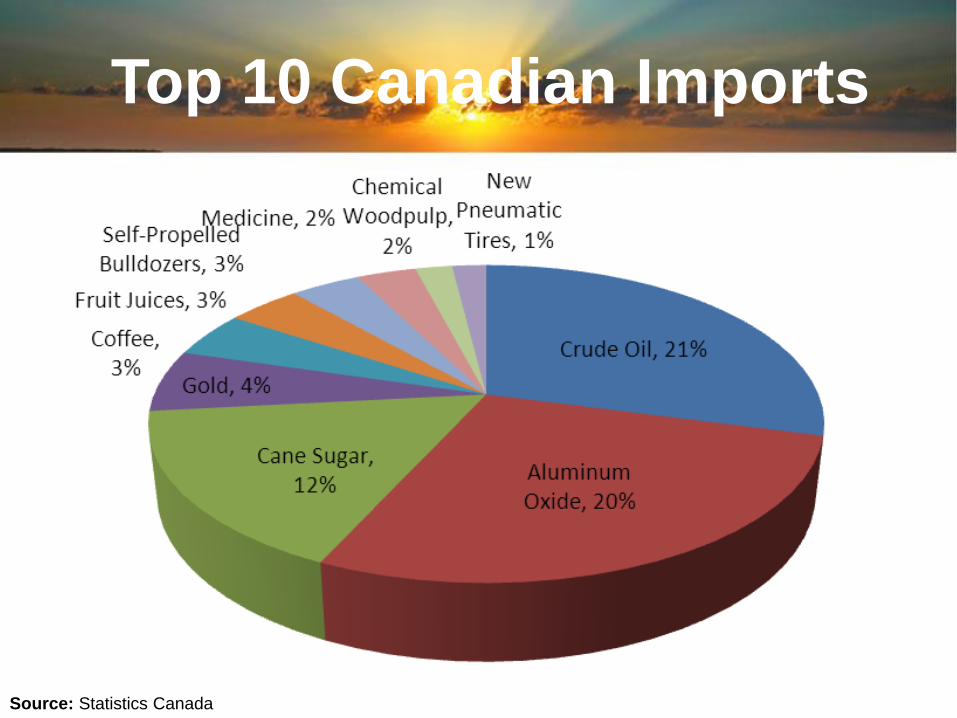
45.27% of the Brazil land area. Lowest populational density 2% of GDP. Key city to region development and trade – Manaus ( Zona Franca). Most of the Amazon Rainforest and indigenous tribes (2% of population). Main industry: lumber, mining (iron, aluminum and gold), agriculture, oil and gas and ecotourism.
7 states
Amazonas river Amazon Zona Franca
The North Region

30% of Brazil’s population. Poorest region of Brazil (12% of GDP). Main cities: Salvador, Recife and Fortaleza. Economy : sugar, cocoa and cotton and tourism. Semi-arid climate: Suffers from long droughts. Major industries: tourism, agriculture (sugar cane and cotton, coffee, soy) and extensive cattle breeding.
Salvador Sertão Nordestino Porto de Galinhas - Pernanbuco
9 states
The Northeast Region

Low demographic density (just 6.4%). Pantanal- world’s largest wetland area. Cerrado (the world largest savanna). Host of the capital city (Brasilia). Contributes with 8% of the GDP. Key industries: cattle breeding, mining, lumber, agriculture, services and ecotourism
4 states
The Pantanal Cerrado Savanna Brasilia
The Central-West Region

38% of the population. 58.5% of total GDP. Economy: mining, manufacturing (machinery, electronics, automobile and aviation), energy production, agriculture (coffee, sugar, dairy, eggs, rubber, fruits )tourism, petroleum, textiles, etc. Business economic centers of Brazil : largest cities and companies - Sao Paulo and Rio de Janeiro.
4 states
Rio de Janeiro Sao Paulo Industrial Parks
The South-East Region

Wealthiest region by GDP per Capita : highest standard of living in Brazil. 12.5% of Brazil’s population. 16.5% of the GDP Main industries: agriculture (dairy, pigs, chicken, soy, corn, coffee, sugarcane) machinery and automobile, textiles, tourism, energy. Coldest region of Brazil
3 states
Pomerode Curitiba Porto Alegre
The South Region

Brazilian Agribusinees
Evolution

Low Ag production and low yields Production concentrated in South/Southeast Food supply crisis Rural poverty Lack of specific knowledge on Tropical Agriculture Poor research Institutional void (ag research, education, markets, media
and governmental agencies, etc.)
The challenge: To move from very traditional European
model agriculture to tropical agriculture based on
science and with intensive use of technology
Brazilian Agriculture before 1970

20/09/10
• Fibers and wood (cotton, Eucalyptus) • Tropical (African) grasses (Brachiaria,
etc.) • Sugarcane and ethanol • No-tillage practices • Cerrado Agriculture • Biological control • N fixation • Poultry / pork • Zebu cattle • Soybean (photoperiodism) • Tropical plants and animals: • Horticulture • Acquacultue (fresh water)
Tropical Agriculture Achievements
No-till Cropping System

Evolution of the Grain Production
PRODUCTION
Million tons
201,6
123,2 119,1
96,8
37,8 40,2 47,4
144,1
122,5 131,8 114,7
49,1 47,9 46,2 47,4
149,3
135,1
47,7 47,4
162,8
49,9
188,7 193,5 149,2
AREA Million he
49,9 53,6 57,0 57,8
2001/02
2002/03
2003/04
2004/05
2005/06
2006/07
2007/08
2008/09
2009/10
2010/11
2011/12
2012/13
2013/14
2014/15*
* Estimativa.
Yield (kg/ha)
2.407
2.803
2.512
2.339
2.560
2.851
3.040
2.835
3.148
3.264
3.266
3.522
3.396
3.487
Fonte: Conab - 3º Levantamento de Grãos (Safra 2014/2015) - Dezembro2014. *Estimativa. 1

Evolution of the grain
and area production
Source: CONAB
Area + 46%
Production + 238%

Cultivated area under no-tillage systems around the world (1000 ha)
Source: Brazilian Federation of No-Till cropping system – FEBRAPDP, 2006

Economy of Scale and Double Crop Advantages
Fazenda Filadélfia - MT


Source: MAPA, 2010 – Photos by Votorantin Metais
Crop Livestock Forest Integration - CLFI

Biological Nitrogen Fixation
With Bradyrhizobium
Without Bradyrhizobium
Anual economy:
~ US$ 5 billion
Brazil has become the world leader in
replacing N fertilizers by biological N2 fixation (BNF)
Source: Contini and Martha Jr., 2010

Sources: Brazilian Ministry of Agriiculture
Production Areas
-Poultry
-Soy
-Corn
-Beef
-Soy
-Corn
100 million ha of unused land

05/21/09
1960
1975
2005
Evolution and expansion of soybean in Brazil

Small scale farmers and cooperatives
Large scale farmers
Soybeans

Corn
Main Poultry & Pork Regions
Main Corn Producing Regions

Beef Cattle
Main beef production & export Regions

Dairy Cattle
Main dairy cattle & dairy insdustries production regions
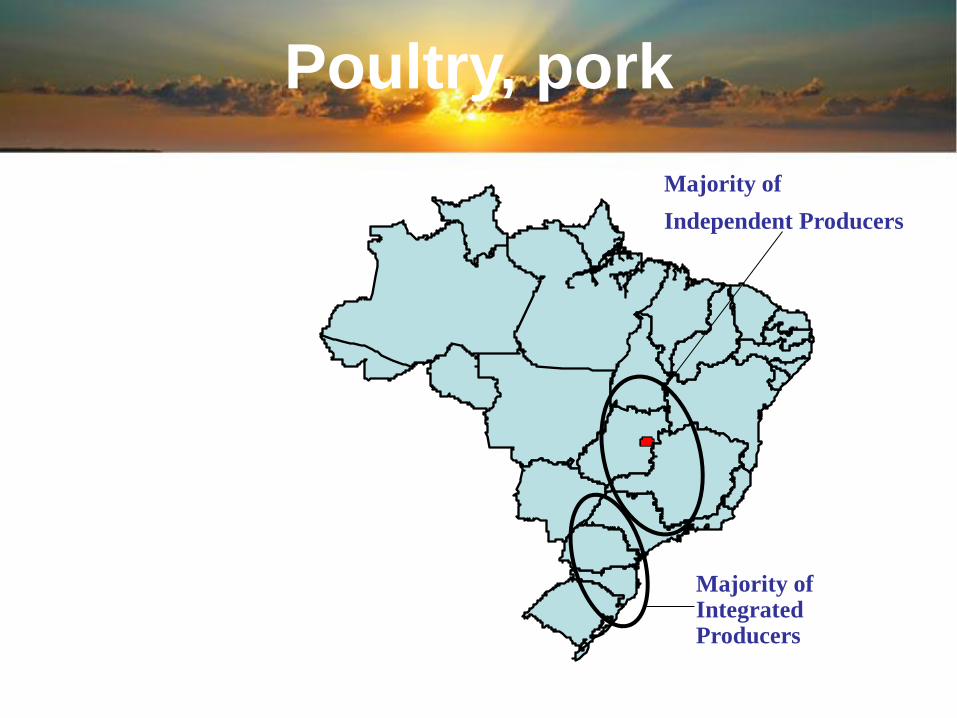
Poultry, pork
Majority of Integrated Producers
Majority of
Independent Producers

Sources: Conab, IBGE, MAPA
Domestic Consumption and Exports
0% 10% 20% 30% 40% 50% 60% 70% 80% 90% 100%
Cotton
Corn
Soybeans
Broiler
Beef
Coffee
Sugar
Ethanol
Internal Consumption Exports

Brazilian Production -World Ranking - 2013
Source: USDA (fev/2011) Note: 2010 (meat) and harvest 2009/10 (other products)
1th 1th 1th 1th 1th 2th 2nd 4th
80% 46% 34% 27% 20% 27% 18% 9%
1th 1th 3th 1th 2th 2th 3th 4th
53% 22% 15% 35% 16% 22% 7% 3%
Ex
po
rt.
Pro
du
çã
o
Suco Laranja Açúcar Comp. Soja Milho C. Suína
Elaboration: Fiesp-Deagro
Pro
du
ctio
n
Exp
ort
Sugar Coffee O.J. Poultry Beef Soybean Corn Pork

Source: CONAB
Agribusiness: “Green Anchor”
of the Trade Balance

We do have challanges

Bottlenecks
Country size;
Infrastructure;
Dollar rate;
Rocket interest rate;
Increasing inflation;
Governmental beaurocracy;
Inputs Importation;
Storage capacity;
Environmental restrictions;
Closed markets abroad and high subsidies.

Environmental Issues
Brazil is the country
with more restrictive
environmental laws
in the world
Legal
Reserve
Permanent
Protected
Area

Environmental Issues
Fonte: Aprosoja
* Rivers with less than 50 meters of width
Permanent Protected Area
0 Meter
0 Meter
30 Meters*
50 Meters*

Legal
Reserve
Environmental Issues
80%
Amazon Biom
35%
Cerrado
ZERO
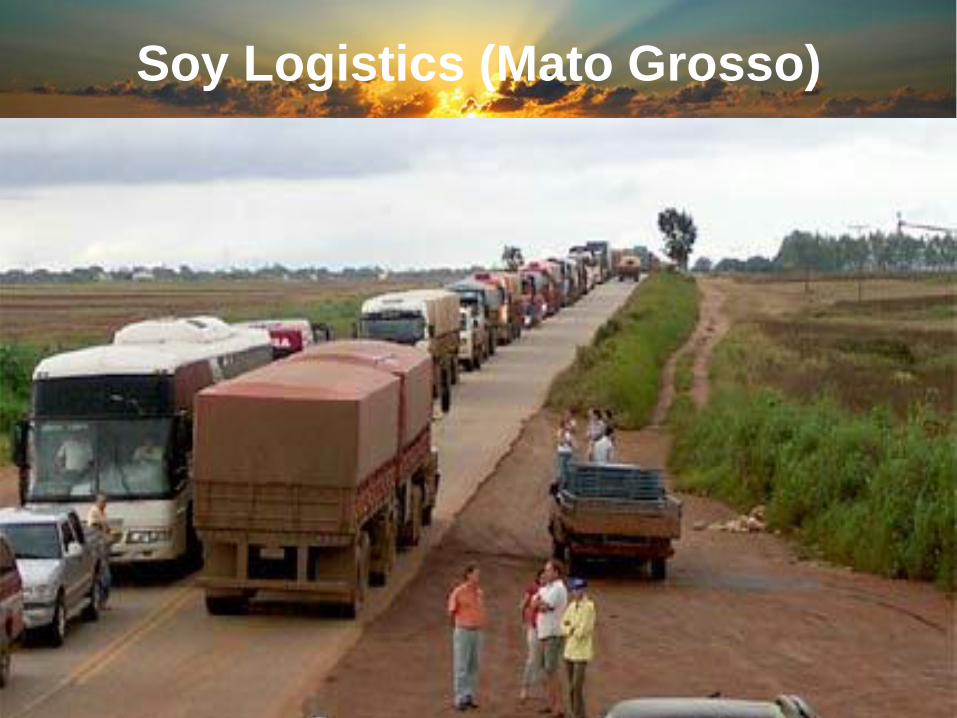
Soy Logistics (Mato Grosso)

Campo Novo do Parecis to Sapezal - MT

Access to Port of Santos

Railways density

Soybean Logistics in Brazil
Short Distances to Port

Source: Centrograos, Caramuru and Soy Transport Coalition, Aug.2010, BCR Rosário
China
Santos, Brazil Sorriso, Brasil
Transportation Costs Benchmarking
Road
US$ 125/Ton US$ 45/Ton
New Orleans,
USA Illinois, USA
Barge
US$ 25/Ton US$ 46/Ton
Santos, Brazil Córdoba,
Argentina Road
US$ 36/Ton US$ 66/Ton

Soybean Logistics in Brazil
10%
Fonte: MDIC , CONAB / Elaboração: Aprosoja
15%
25% 28%
5%
5% 2%
Soybean Production
15%
85%
Soy Complex Exports
50%
50% 7%

Highlights
Natural advantages (water, land availability, climate)
Double crop/year;
Large areas available for expantion;
Science, tropical ag research & technology
Agriculture is the “green anchor of economy”;
Improvement of managerial capabilities
Market deregulation and elimination of subsidies
Bio-energy potential (ethanol and biodiesel)
Vision of future;
Farmer age and family administration.


Think It Over
Will there be enoughf food
to feed the world in 2020?

Final Message
• Once the peasants decided to
meet in the center of the village
to pray after a long drought
period… but only a young boy
brought his umbrella…
• This is FAITH

Final Message
• When you through a baby into
the air he smiles because he
knows you will hold him on the
way down…
• This is TRUST

Final Message
• Every night when you go to sleep
you never know if you will wake
up tomorrow morning but you
set the alarm clock anyway…
• This is HOPE
Tks a lot!
Nadiel Pacheco Kowalski
Director of N.P.Kowalski & Cia Ltda
www.npkconsultoria.com
Invite your friends and come for an agricultural
technical tour in Brazil
I can take care of everything!
Pls, enjoy www.facebook.com/npkconsultoria