Embed Size (px)
Citation preview

B F I R E S E A R C H A N D S T A T I S T I C S P U B L I S H E D J U N E 2 0 1 7
THE BOXOFFICE 2016
UK box office revenues for 2016 exceeded £1.2 billion for the second year running, while annual admissions were 168.3 million.
FACTS IN FOCUS UK box office receipts in 2016 were £1,228 million, down 1% on 2015.
UK cinema admissions reached 168.3 million, down 2% on 2015.
A total of 821 films were released in the UK and Republic of Ireland.
UK films, including co-productions, accounted for 21% of releases and 36% of the market by value.
The box office share of UK independent films was 7.4%, down from 10.5% in 2015.
The top 100 films earned 92% of the gross box office, the joint second highest share since 2009.
A total of 46 3D films were released in 2016, up from 34 in 2015; their 3D takings accounted for 7% of UK and Republic of Ireland box office revenues, down from 11% in 2015.
Nineteen films were released in the 3D IMAX format, grossing £29 million, 2% of total box office.
UK films made with the backing of major US studios spent longer than other films, on average, in UK cinemas in 2016.
Image: Bridget Jones’s Baby ©2016 Universal Pictures. Courtesy of Universal Studios Licensing LLC
THE BOXOFFICE 2016
THE BOX OFFICE 2016
BFI STATISTICAL YEARBOOK 2017
3
UK CINEMA ADMISSIONS
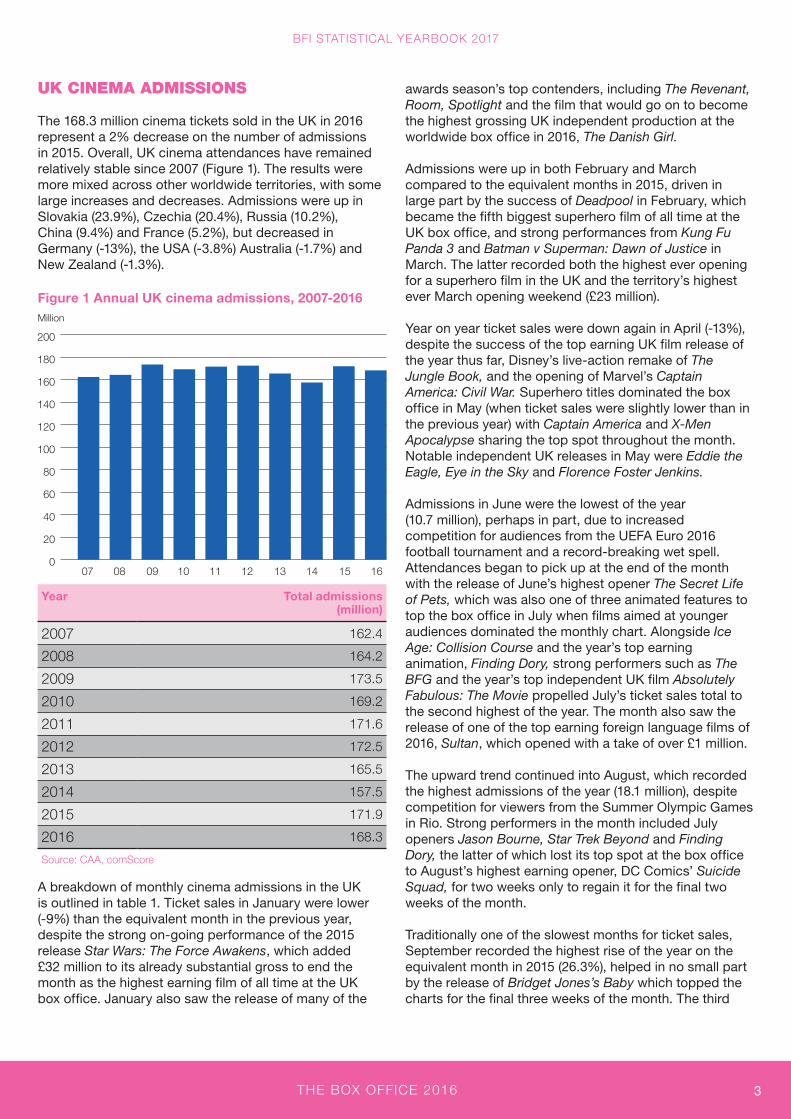
The 168.3 million cinema tickets sold in the UK in 2016 represent a 2% decrease on the number of admissions in 2015. Overall, UK cinema attendances have remained relatively stable since 2007 (Figure 1). The results were more mixed across other worldwide territories, with some large increases and decreases. Admissions were up in Slovakia (23.9%), Czechia (20.4%), Russia (10.2%), China (9.4%) and France (5.2%), but decreased in Germany (-13%), the USA (-3.8%) Australia (-1.7%) and New Zealand (-1.3%).
Figure 1 Annual UK cinema admissions, 2007-2016
Year Total admissions (million)
2007 162.4
2008 164.2
2009 173.5
2010 169.2
2011 171.6
2012 172.5
2013 165.5
2014 157.5
2015 171.9
2016 168.3
Source: CAA, comScore
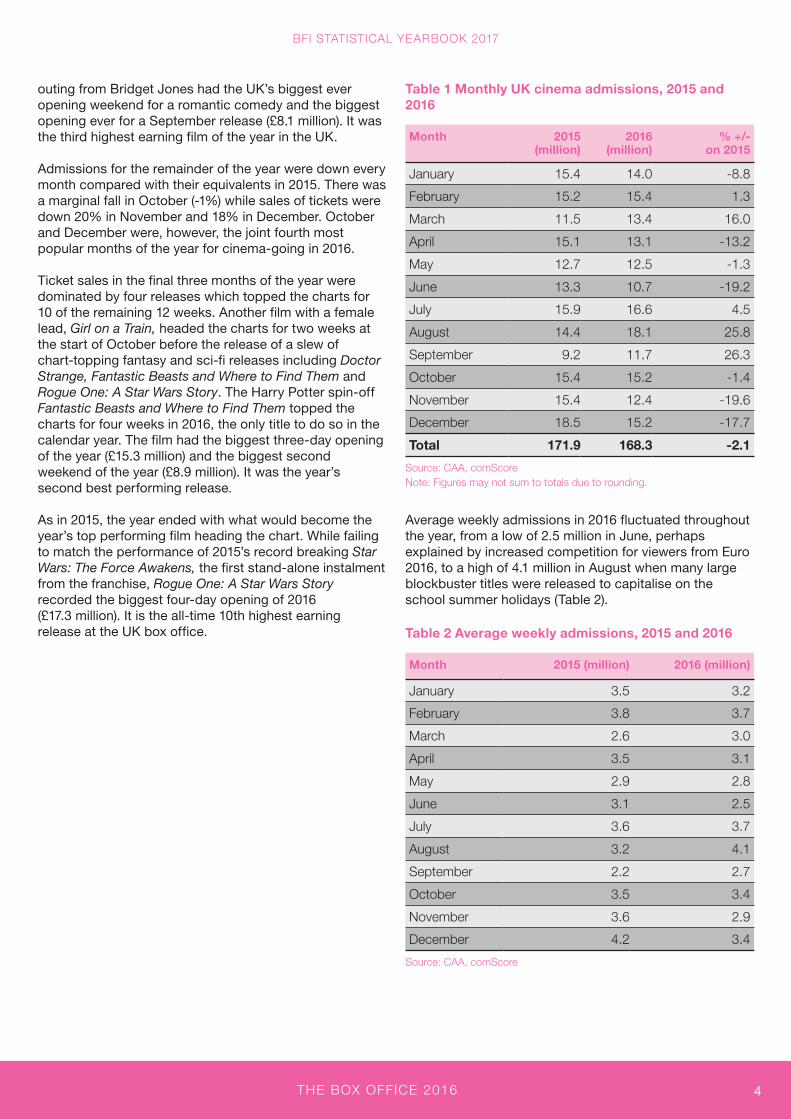
A breakdown of monthly cinema admissions in the UK is outlined in table 1. Ticket sales in January were lower (-9%) than the equivalent month in the previous year, despite the strong on-going performance of the 2015 release Star Wars: The Force Awakens, which added £32 million to its already substantial gross to end the month as the highest earning film of all time at the UK box office. January also saw the release of many of the
awards season’s top contenders, including The Revenant, Room, Spotlight and the film that would go on to become the highest grossing UK independent production at the worldwide box office in 2016, The Danish Girl.
Admissions were up in both February and March compared to the equivalent months in 2015, driven in large part by the success of Deadpool in February, which became the fifth biggest superhero film of all time at the UK box office, and strong performances from Kung Fu Panda 3 and Batman v Superman: Dawn of Justice in March. The latter recorded both the highest ever opening for a superhero film in the UK and the territory’s highest ever March opening weekend (£23 million).
Year on year ticket sales were down again in April (-13%), despite the success of the top earning UK film release of the year thus far, Disney’s live-action remake of The Jungle Book, and the opening of Marvel’s Captain America: Civil War. Superhero titles dominated the box office in May (when ticket sales were slightly lower than in the previous year) with Captain America and X-Men Apocalypse sharing the top spot throughout the month. Notable independent UK releases in May were Eddie the Eagle, Eye in the Sky and Florence Foster Jenkins.
Admissions in June were the lowest of the year (10.7 million), perhaps in part, due to increased competition for audiences from the UEFA Euro 2016 football tournament and a record-breaking wet spell. Attendances began to pick up at the end of the month with the release of June’s highest opener The Secret Life of Pets, which was also one of three animated features to top the box office in July when films aimed at younger audiences dominated the monthly chart. Alongside Ice Age: Collision Course and the year’s top earning animation, Finding Dory, strong performers such as The BFG and the year’s top independent UK film Absolutely Fabulous: The Movie propelled July’s ticket sales total to the second highest of the year. The month also saw the release of one of the top earning foreign language films of 2016, Sultan, which opened with a take of over £1 million.
The upward trend continued into August, which recorded the highest admissions of the year (18.1 million), despite competition for viewers from the Summer Olympic Games in Rio. Strong performers in the month included July openers Jason Bourne, Star Trek Beyond and Finding Dory, the latter of which lost its top spot at the box office to August’s highest earning opener, DC Comics’ Suicide Squad, for two weeks only to regain it for the final two weeks of the month.
Traditionally one of the slowest months for ticket sales, September recorded the highest rise of the year on the equivalent month in 2015 (26.3%), helped in no small part by the release of Bridget Jones’s Baby which topped the charts for the final three weeks of the month. The third
Million
0
20
40
60
80
100
120
140
160
180
200
16151413121110090807
THE BOX OFFICE 2016
BFI STATISTICAL YEARBOOK 2017
4
outing from Bridget Jones had the UK’s biggest ever opening weekend for a romantic comedy and the biggest opening ever for a September release (£8.1 million). It was the third highest earning film of the year in the UK.
Admissions for the remainder of the year were down every month compared with their equivalents in 2015. There was a marginal fall in October (-1%) while sales of tickets were down 20% in November and 18% in December. October and December were, however, the joint fourth most popular months of the year for cinema-going in 2016.
Ticket sales in the final three months of the year were dominated by four releases which topped the charts for 10 of the remaining 12 weeks. Another film with a female lead, Girl on a Train, headed the charts for two weeks at the start of October before the release of a slew of chart-topping fantasy and sci-fi releases including Doctor Strange, Fantastic Beasts and Where to Find Them and Rogue One: A Star Wars Story. The Harry Potter spin-off Fantastic Beasts and Where to Find Them topped the charts for four weeks in 2016, the only title to do so in the calendar year. The film had the biggest three-day opening of the year (£15.3 million) and the biggest second weekend of the year (£8.9 million). It was the year’s second best performing release.
As in 2015, the year ended with what would become the year’s top performing film heading the chart. While failing to match the performance of 2015’s record breaking Star Wars: The Force Awakens, the first stand-alone instalment from the franchise, Rogue One: A Star Wars Story recorded the biggest four-day opening of 2016 (£17.3 million). It is the all-time 10th highest earning release at the UK box office.
Table 1 Monthly UK cinema admissions, 2015 and 2016
Month 2015 (million)
2016 (million)
% +/- on 2015
January 15.4 14.0 -8.8
February 15.2 15.4 1.3
March 11.5 13.4 16.0
April 15.1 13.1 -13.2
May 12.7 12.5 -1.3
June 13.3 10.7 -19.2
July 15.9 16.6 4.5
August 14.4 18.1 25.8
September 9.2 11.7 26.3
October 15.4 15.2 -1.4
November 15.4 12.4 -19.6
December 18.5 15.2 -17.7
Total 171.9 168.3 -2.1
Source: CAA, comScore Note: Figures may not sum to totals due to rounding.
Average weekly admissions in 2016 fluctuated throughout the year, from a low of 2.5 million in June, perhaps explained by increased competition for viewers from Euro 2016, to a high of 4.1 million in August when many large blockbuster titles were released to capitalise on the school summer holidays (Table 2).
Table 2 Average weekly admissions, 2015 and 2016
Month 2015 (million) 2016 (million)
January 3.5 3.2
February 3.8 3.7
March 2.6 3.0
April 3.5 3.1
May 2.9 2.8
June 3.1 2.5
July 3.6 3.7
August 3.2 4.1
September 2.2 2.7
October 3.5 3.4
November 3.6 2.9
December 4.2 3.4
Source: CAA, comScore
THE BOX OFFICE 2016
BFI STATISTICAL YEARBOOK 2017
5
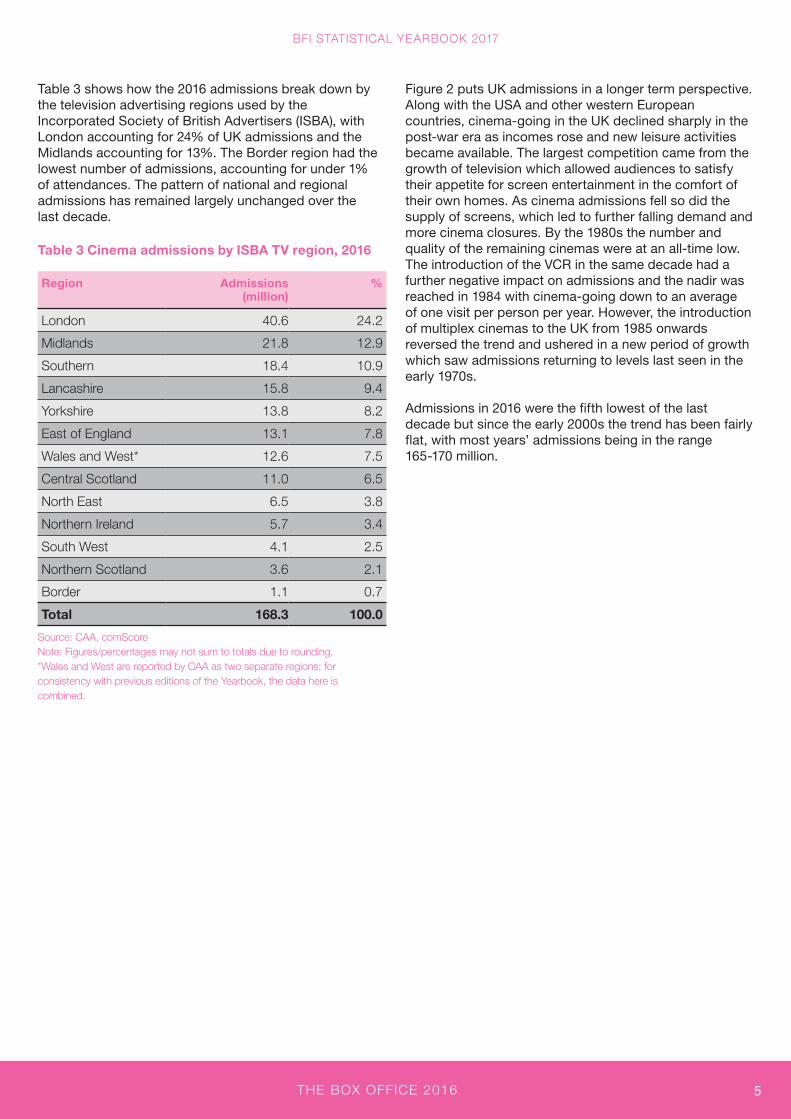
Table 3 shows how the 2016 admissions break down by the television advertising regions used by the Incorporated Society of British Advertisers (ISBA), with London accounting for 24% of UK admissions and the Midlands accounting for 13%. The Border region had the lowest number of admissions, accounting for under 1% of attendances. The pattern of national and regional admissions has remained largely unchanged over the last decade.
Table 3 Cinema admissions by ISBA TV region, 2016
Region Admissions (million)
%
London 40.6 24.2
Midlands 21.8 12.9
Southern 18.4 10.9
Lancashire 15.8 9.4
Yorkshire 13.8 8.2
East of England 13.1 7.8
Wales and West* 12.6 7.5
Central Scotland 11.0 6.5
North East 6.5 3.8
Northern Ireland 5.7 3.4
South West 4.1 2.5
Northern Scotland 3.6 2.1
Border 1.1 0.7
Total 168.3 100.0
Source: CAA, comScore Note: Figures/percentages may not sum to totals due to rounding. *Wales and West are reported by CAA as two separate regions; for consistency with previous editions of the Yearbook, the data here is combined.
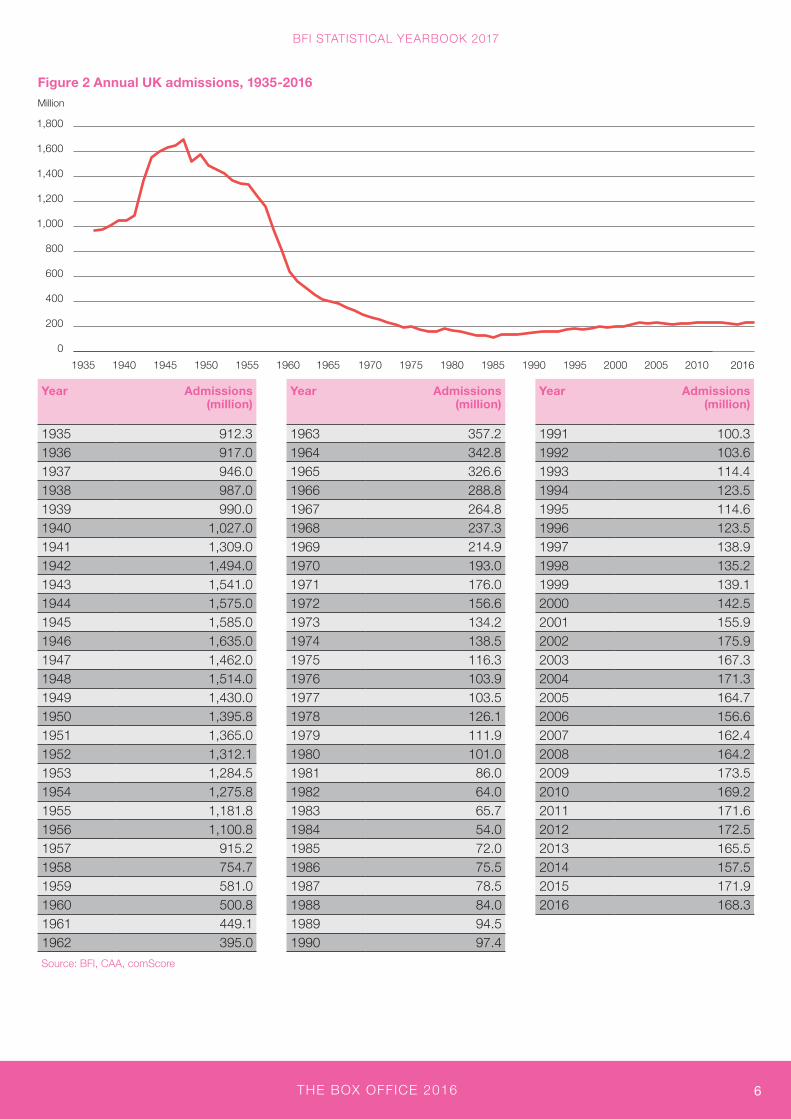
Figure 2 puts UK admissions in a longer term perspective. Along with the USA and other western European countries, cinema-going in the UK declined sharply in the post-war era as incomes rose and new leisure activities became available. The largest competition came from the growth of television which allowed audiences to satisfy their appetite for screen entertainment in the comfort of their own homes. As cinema admissions fell so did the supply of screens, which led to further falling demand and more cinema closures. By the 1980s the number and quality of the remaining cinemas were at an all-time low. The introduction of the VCR in the same decade had a further negative impact on admissions and the nadir was reached in 1984 with cinema-going down to an average of one visit per person per year. However, the introduction of multiplex cinemas to the UK from 1985 onwards reversed the trend and ushered in a new period of growth which saw admissions returning to levels last seen in the early 1970s.
Admissions in 2016 were the fifth lowest of the last decade but since the early 2000s the trend has been fairly flat, with most years’ admissions being in the range 165-170 million.
THE BOX OFFICE 2016
BFI STATISTICAL YEARBOOK 2017
6
Figure 2 Annual UK admissions, 1935-2016Million
2010200520001995199019851980197519701965196019551950194519401935 2016
Year Admissions (million)
Year Admissions (million)
Year Admissions (million)
1935 912.3 1963 357.2 1991 100.31936 917.0 1964 342.8 1992 103.61937 946.0 1965 326.6 1993 114.41938 987.0 1966 288.8 1994 123.51939 990.0 1967 264.8 1995 114.61940 1,027.0 1968 237.3 1996 123.51941 1,309.0 1969 214.9 1997 138.91942 1,494.0 1970 193.0 1998 135.21943 1,541.0 1971 176.0 1999 139.11944 1,575.0 1972 156.6 2000 142.51945 1,585.0 1973 134.2 2001 155.91946 1,635.0 1974 138.5 2002 175.91947 1,462.0 1975 116.3 2003 167.31948 1,514.0 1976 103.9 2004 171.31949 1,430.0 1977 103.5 2005 164.71950 1,395.8 1978 126.1 2006 156.61951 1,365.0 1979 111.9 2007 162.41952 1,312.1 1980 101.0 2008 164.21953 1,284.5 1981 86.0 2009 173.51954 1,275.8 1982 64.0 2010 169.21955 1,181.8 1983 65.7 2011 171.61956 1,100.8 1984 54.0 2012 172.51957 915.2 1985 72.0 2013 165.51958 754.7 1986 75.5 2014 157.51959 581.0 1987 78.5 2015 171.91960 500.8 1988 84.0 2016 168.31961 449.1 1989 94.51962 395.0 1990 97.4
Source: BFI, CAA, comScore
0
200
400
600
800
1,000
1,200
1,400
1,600
1,800
THE BOX OFFICE 2016
BFI STATISTICAL YEARBOOK 2017
7
UK BOX OFFICE EARNINGS
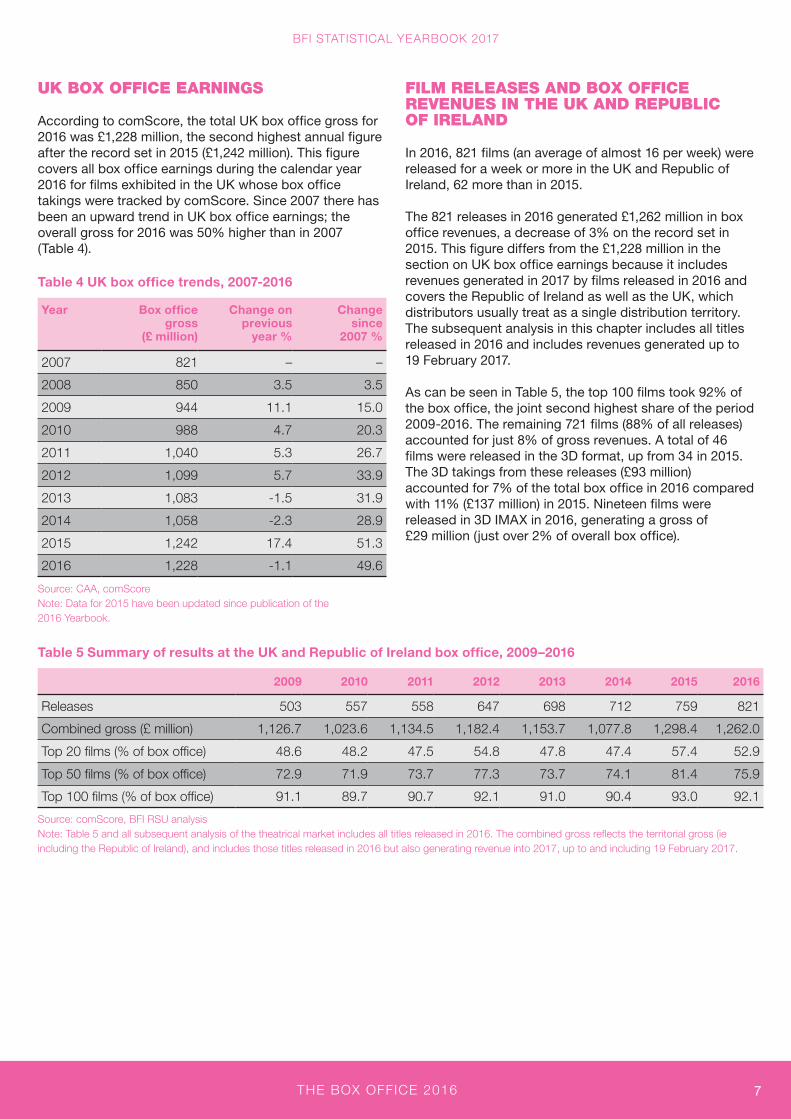
According to comScore, the total UK box office gross for 2016 was £1,228 million, the second highest annual figure after the record set in 2015 (£1,242 million). This figure covers all box office earnings during the calendar year 2016 for films exhibited in the UK whose box office takings were tracked by comScore. Since 2007 there has been an upward trend in UK box office earnings; the overall gross for 2016 was 50% higher than in 2007 (Table 4).
Table 4 UK box office trends, 2007-2016
Year Box office gross
(£ million)
Change on previous
year %
Change since
2007 %
2007 821 – –
2008 850 3.5 3.5
2009 944 11.1 15.0
2010 988 4.7 20.3
2011 1,040 5.3 26.7
2012 1,099 5.7 33.9
2013 1,083 -1.5 31.9
2014 1,058 -2.3 28.9
2015 1,242 17.4 51.3
2016 1,228 -1.1 49.6
Source: CAA, comScore Note: Data for 2015 have been updated since publication of the 2016 Yearbook.
FILM RELEASES AND BOX OFFICE REVENUES IN THE UK AND REPUBLIC OF IRELAND
In 2016, 821 films (an average of almost 16 per week) were released for a week or more in the UK and Republic of Ireland, 62 more than in 2015.
The 821 releases in 2016 generated £1,262 million in box office revenues, a decrease of 3% on the record set in 2015. This figure differs from the £1,228 million in the section on UK box office earnings because it includes revenues generated in 2017 by films released in 2016 and covers the Republic of Ireland as well as the UK, which distributors usually treat as a single distribution territory. The subsequent analysis in this chapter includes all titles released in 2016 and includes revenues generated up to 19 February 2017.
As can be seen in Table 5, the top 100 films took 92% of the box office, the joint second highest share of the period 2009-2016. The remaining 721 films (88% of all releases) accounted for just 8% of gross revenues. A total of 46 films were released in the 3D format, up from 34 in 2015. The 3D takings from these releases (£93 million) accounted for 7% of the total box office in 2016 compared with 11% (£137 million) in 2015. Nineteen films were released in 3D IMAX in 2016, generating a gross of £29 million (just over 2% of overall box office).
Table 5 Summary of results at the UK and Republic of Ireland box office, 2009–2016
2009 2010 2011 2012 2013 2014 2015 2016
Releases 503 557 558 647 698 712 759 821
Combined gross (£ million) 1,126.7 1,023.6 1,134.5 1,182.4 1,153.7 1,077.8 1,298.4 1,262.0
Top 20 films (% of box office) 48.6 48.2 47.5 54.8 47.8 47.4 57.4 52.9
Top 50 films (% of box office) 72.9 71.9 73.7 77.3 73.7 74.1 81.4 75.9
Top 100 films (% of box office) 91.1 89.7 90.7 92.1 91.0 90.4 93.0 92.1
Source: comScore, BFI RSU analysis Note: Table 5 and all subsequent analysis of the theatrical market includes all titles released in 2016. The combined gross reflects the territorial gross (ie including the Republic of Ireland), and includes those titles released in 2016 but also generating revenue into 2017, up to and including 19 February 2017.
THE BOX OFFICE 2016
BFI STATISTICAL YEARBOOK 2017
8
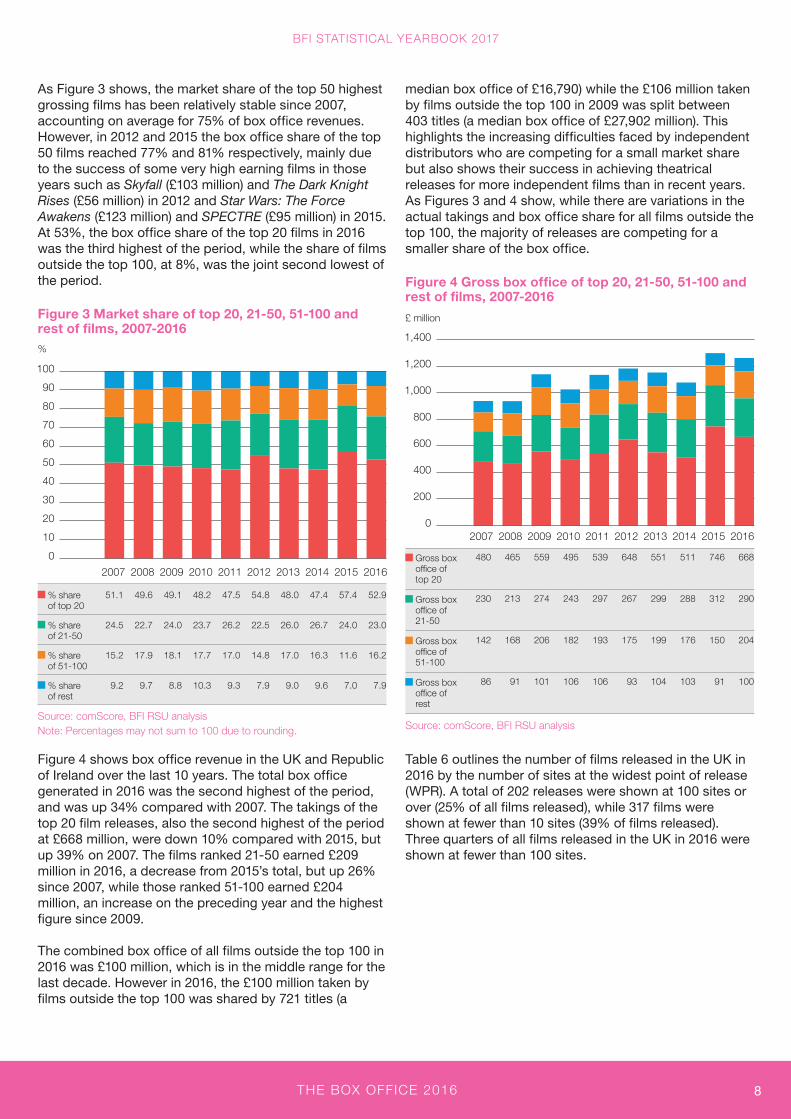
As Figure 3 shows, the market share of the top 50 highest grossing films has been relatively stable since 2007, accounting on average for 75% of box office revenues. However, in 2012 and 2015 the box office share of the top 50 films reached 77% and 81% respectively, mainly due to the success of some very high earning films in those years such as Skyfall (£103 million) and The Dark Knight Rises (£56 million) in 2012 and Star Wars: The Force Awakens (£123 million) and SPECTRE (£95 million) in 2015. At 53%, the box office share of the top 20 films in 2016 was the third highest of the period, while the share of films outside the top 100, at 8%, was the joint second lowest of the period.
Figure 3 Market share of top 20, 21-50, 51-100 and rest of films, 2007-2016
% share of top 20
51.1 49.6 49.1 48.2 47.5 54.8 48.0 47.4 57.4 52.9
% share of 21-50
24.5 22.7 24.0 23.7 26.2 22.5 26.0 26.7 24.0 23.0
% share of 51-100
15.2 17.9 18.1 17.7 17.0 14.8 17.0 16.3 11.6 16.2
% share of rest
9.2 9.7 8.8 10.3 9.3 7.9 9.0 9.6 7.0 7.9
Source: comScore, BFI RSU analysis Note: Percentages may not sum to 100 due to rounding.
Figure 4 shows box office revenue in the UK and Republic of Ireland over the last 10 years. The total box office generated in 2016 was the second highest of the period, and was up 34% compared with 2007. The takings of the top 20 film releases, also the second highest of the period at £668 million, were down 10% compared with 2015, but up 39% on 2007. The films ranked 21-50 earned £209 million in 2016, a decrease from 2015’s total, but up 26% since 2007, while those ranked 51-100 earned £204 million, an increase on the preceding year and the highest figure since 2009.
The combined box office of all films outside the top 100 in 2016 was £100 million, which is in the middle range for the last decade. However in 2016, the £100 million taken by films outside the top 100 was shared by 721 titles (a
median box office of £16,790) while the £106 million taken by films outside the top 100 in 2009 was split between 403 titles (a median box office of £27,902 million). This highlights the increasing difficulties faced by independent distributors who are competing for a small market share but also shows their success in achieving theatrical releases for more independent films than in recent years. As Figures 3 and 4 show, while there are variations in the actual takings and box office share for all films outside the top 100, the majority of releases are competing for a smaller share of the box office.
Figure 4 Gross box office of top 20, 21-50, 51-100 and rest of films, 2007-2016
Gross box office of top 20
480 465 559 495 539 648 551 511 746 668
Gross box office of 21-50
230 213 274 243 297 267 299 288 312 290
Gross box office of 51-100
142 168 206 182 193 175 199 176 150 204
Gross box office of rest
86 91 101 106 106 93 104 103 91 100
Source: comScore, BFI RSU analysis
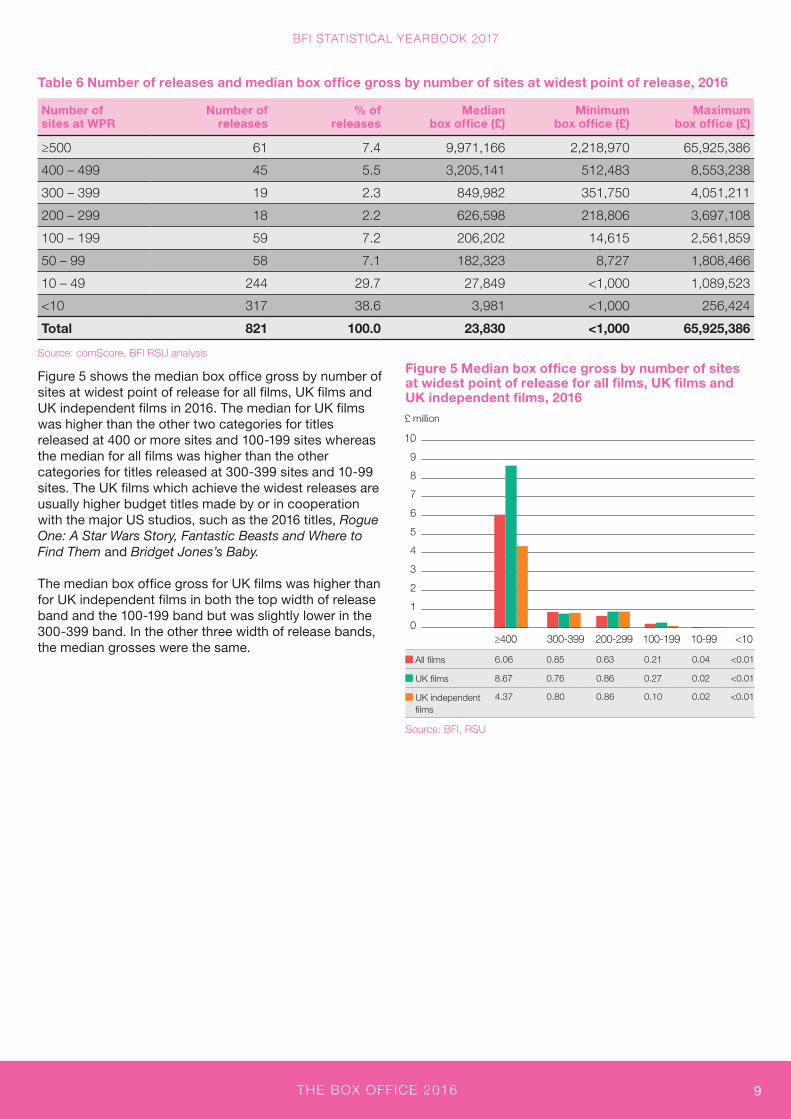
Table 6 outlines the number of films released in the UK in 2016 by the number of sites at the widest point of release (WPR). A total of 202 releases were shown at 100 sites or over (25% of all films released), while 317 films were shown at fewer than 10 sites (39% of films released). Three quarters of all films released in the UK in 2016 were shown at fewer than 100 sites.
%
£ million
0
200
400
600
800
1,000
1,200
1,400
2016201520142013201220112010200920082007
0
10
20
30
40
50
60
70
80
90
100
2016201520142013201220112010200920082007
THE BOX OFFICE 2016
BFI STATISTICAL YEARBOOK 2017
9
Figure 5 shows the median box office gross by number of sites at widest point of release for all films, UK films and UK independent films in 2016. The median for UK films was higher than the other two categories for titles released at 400 or more sites and 100-199 sites whereas the median for all films was higher than the other categories for titles released at 300-399 sites and 10-99 sites. The UK films which achieve the widest releases are usually higher budget titles made by or in cooperation with the major US studios, such as the 2016 titles, Rogue One: A Star Wars Story, Fantastic Beasts and Where to Find Them and Bridget Jones’s Baby.
The median box office gross for UK films was higher than for UK independent films in both the top width of release band and the 100-199 band but was slightly lower in the 300-399 band. In the other three width of release bands, the median grosses were the same.
Figure 5 Median box office gross by number of sites at widest point of release for all films, UK films and UK independent films, 2016
All films 6.06 0.85 0.63 0.21 0.04 <0.01
UK films 8.67 0.76 0.86 0.27 0.02 <0.01
UK independent films
4.37 0.80 0.86 0.10 0.02 <0.01
Source: BFI, RSU
Table 6 Number of releases and median box office gross by number of sites at widest point of release, 2016
Number of sites at WPR
Number of releases
% of releases
Median box office (£)
Minimum box office (£)
Maximum box office (£)
≥500 61 7.4 9,971,166 2,218,970 65,925,386
400 – 499 45 5.5 3,205,141 512,483 8,553,238
300 – 399 19 2.3 849,982 351,750 4,051,211
200 – 299 18 2.2 626,598 218,806 3,697,108
100 – 199 59 7.2 206,202 14,615 2,561,859
50 – 99 58 7.1 182,323 8,727 1,808,466
10 – 49 244 29.7 27,849 <1,000 1,089,523
<10 317 38.6 3,981 <1,000 256,424
Total 821 100.0 23,830 <1,000 65,925,386
Source: comScore, BFI RSU analysis
£ million
0
1
2
3
4
5
6
7
8
9
10
≥400 300-399 200-299 100-199 10-99 <10
THE BOX OFFICE 2016
BFI STATISTICAL YEARBOOK 2017
10
COUNTRY OF ORIGIN OF FILM RELEASES
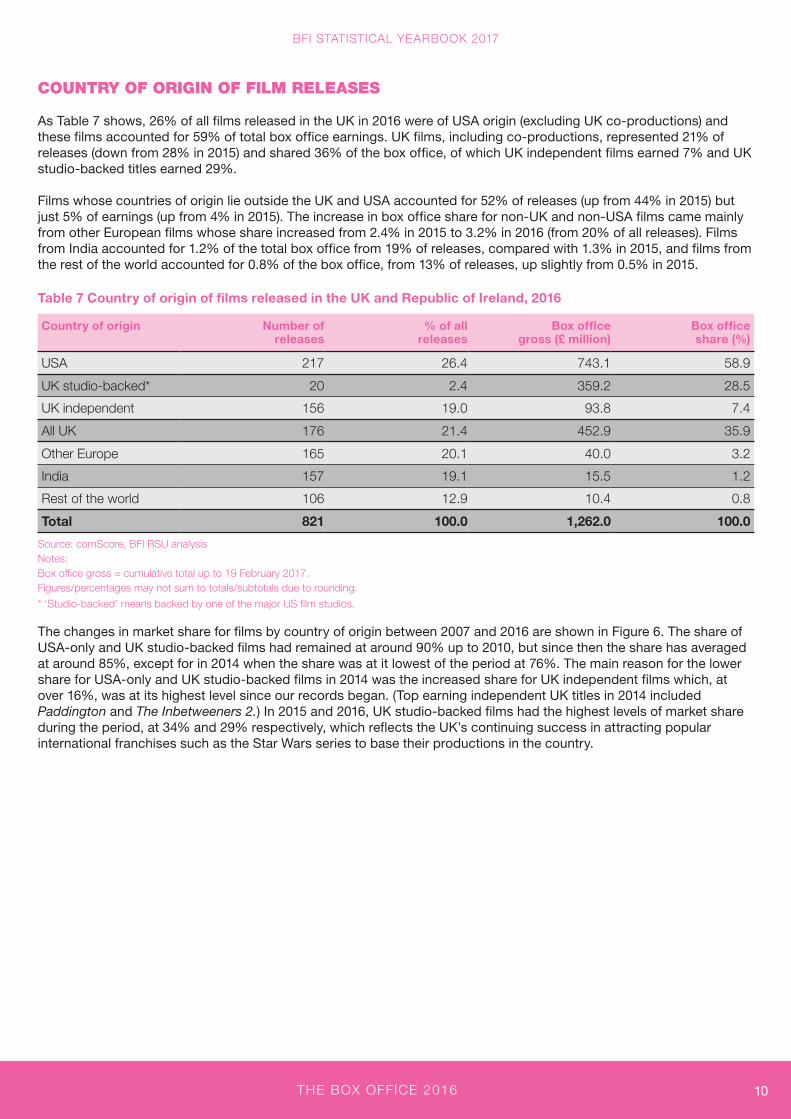
As Table 7 shows, 26% of all films released in the UK in 2016 were of USA origin (excluding UK co-productions) and these films accounted for 59% of total box office earnings. UK films, including co-productions, represented 21% of releases (down from 28% in 2015) and shared 36% of the box office, of which UK independent films earned 7% and UK studio-backed titles earned 29%.
Films whose countries of origin lie outside the UK and USA accounted for 52% of releases (up from 44% in 2015) but just 5% of earnings (up from 4% in 2015). The increase in box office share for non-UK and non-USA films came mainly from other European films whose share increased from 2.4% in 2015 to 3.2% in 2016 (from 20% of all releases). Films from India accounted for 1.2% of the total box office from 19% of releases, compared with 1.3% in 2015, and films from the rest of the world accounted for 0.8% of the box office, from 13% of releases, up slightly from 0.5% in 2015.
Table 7 Country of origin of films released in the UK and Republic of Ireland, 2016
Country of origin Number of releases
% of all releases
Box office gross (£ million)
Box office share (%)
USA 217 26.4 743.1 58.9
UK studio-backed* 20 2.4 359.2 28.5
UK independent 156 19.0 93.8 7.4
All UK 176 21.4 452.9 35.9
Other Europe 165 20.1 40.0 3.2
India 157 19.1 15.5 1.2
Rest of the world 106 12.9 10.4 0.8
Total 821 100.0 1,262.0 100.0
Source: comScore, BFI RSU analysis Notes: Box office gross = cumulative total up to 19 February 2017. Figures/percentages may not sum to totals/subtotals due to rounding.
* ‘Studio-backed’ means backed by one of the major US film studios.
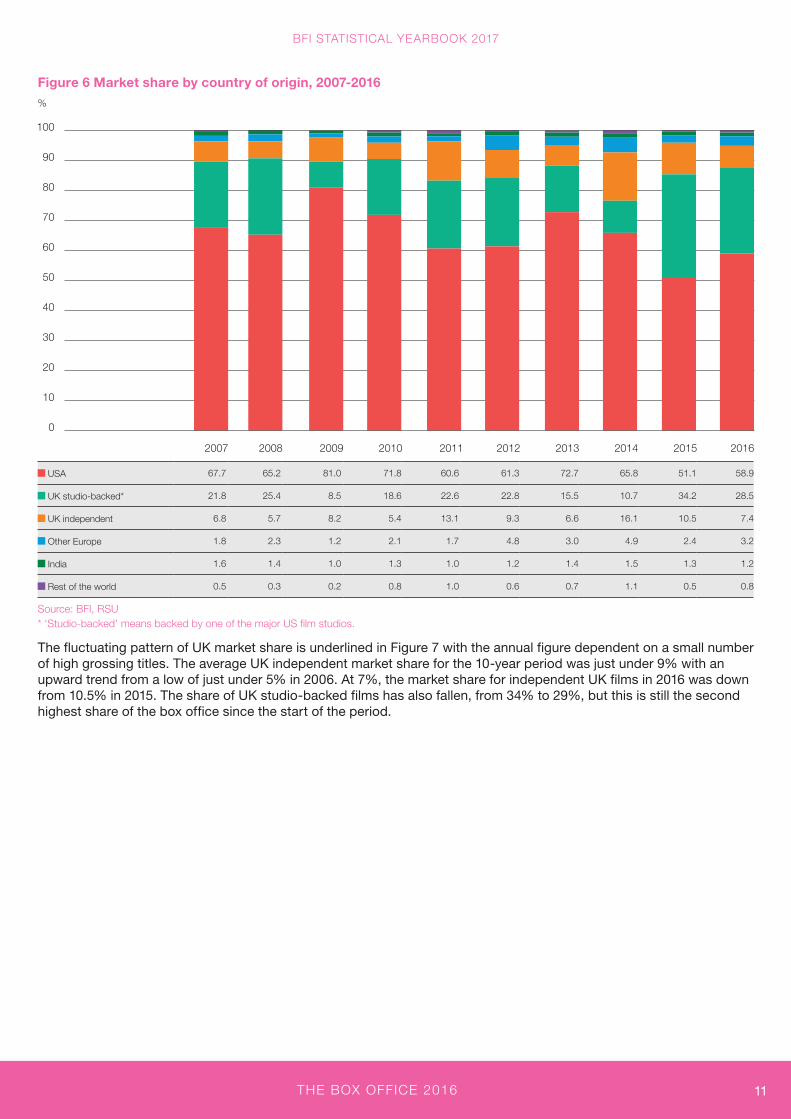
The changes in market share for films by country of origin between 2007 and 2016 are shown in Figure 6. The share of USA-only and UK studio-backed films had remained at around 90% up to 2010, but since then the share has averaged at around 85%, except for in 2014 when the share was at it lowest of the period at 76%. The main reason for the lower share for USA-only and UK studio-backed films in 2014 was the increased share for UK independent films which, at over 16%, was at its highest level since our records began. (Top earning independent UK titles in 2014 included Paddington and The Inbetweeners 2.) In 2015 and 2016, UK studio-backed films had the highest levels of market share during the period, at 34% and 29% respectively, which reflects the UK’s continuing success in attracting popular international franchises such as the Star Wars series to base their productions in the country.
THE BOX OFFICE 2016
BFI STATISTICAL YEARBOOK 2017
11
Figure 6 Market share by country of origin, 2007-2016
USA 67.7 65.2 81.0 71.8 60.6 61.3 72.7 65.8 51.1 58.9
UK studio-backed* 21.8 25.4 8.5 18.6 22.6 22.8 15.5 10.7 34.2 28.5
UK independent 6.8 5.7 8.2 5.4 13.1 9.3 6.6 16.1 10.5 7.4
Other Europe 1.8 2.3 1.2 2.1 1.7 4.8 3.0 4.9 2.4 3.2
India 1.6 1.4 1.0 1.3 1.0 1.2 1.4 1.5 1.3 1.2
Rest of the world 0.5 0.3 0.2 0.8 1.0 0.6 0.7 1.1 0.5 0.8
Source: BFI, RSU * ‘Studio-backed’ means backed by one of the major US film studios.
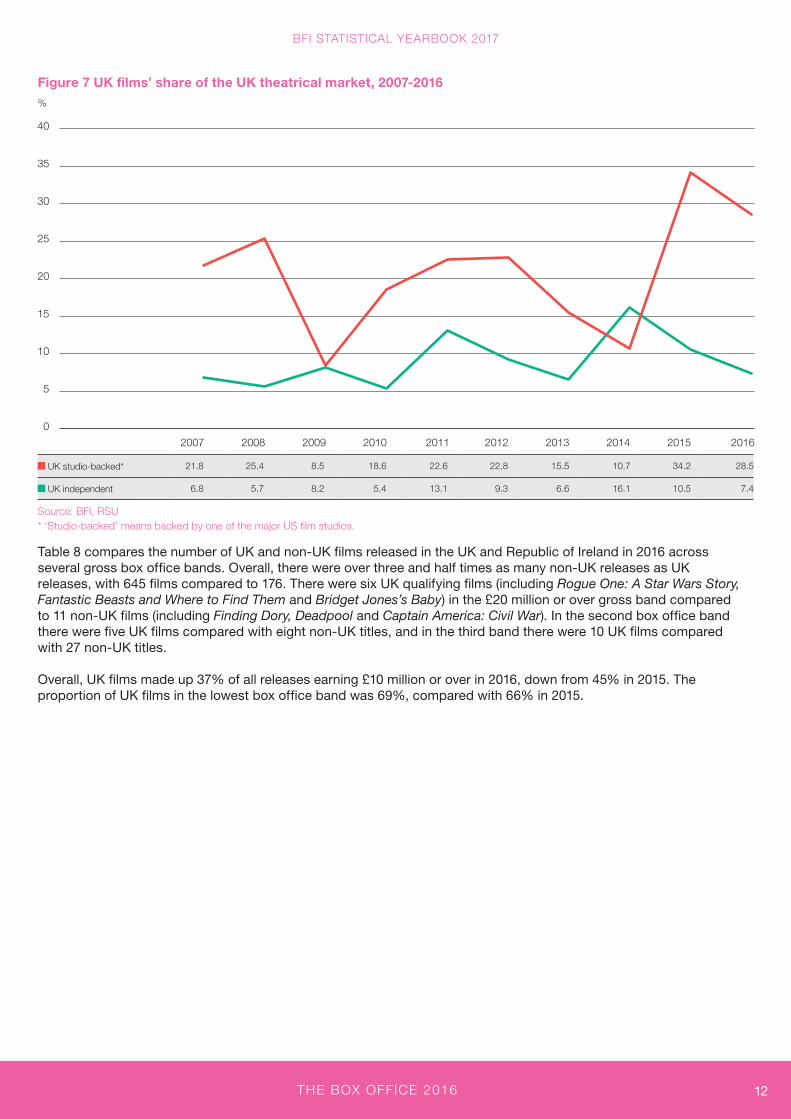
The fluctuating pattern of UK market share is underlined in Figure 7 with the annual figure dependent on a small number of high grossing titles. The average UK independent market share for the 10-year period was just under 9% with an upward trend from a low of just under 5% in 2006. At 7%, the market share for independent UK films in 2016 was down from 10.5% in 2015. The share of UK studio-backed films has also fallen, from 34% to 29%, but this is still the second highest share of the box office since the start of the period.
%
0
10
20
30
40
50
60
70
80
90
100
2016201520142013201220112010200920082007
THE BOX OFFICE 2016
BFI STATISTICAL YEARBOOK 2017
12
Figure 7 UK films’ share of the UK theatrical market, 2007-2016
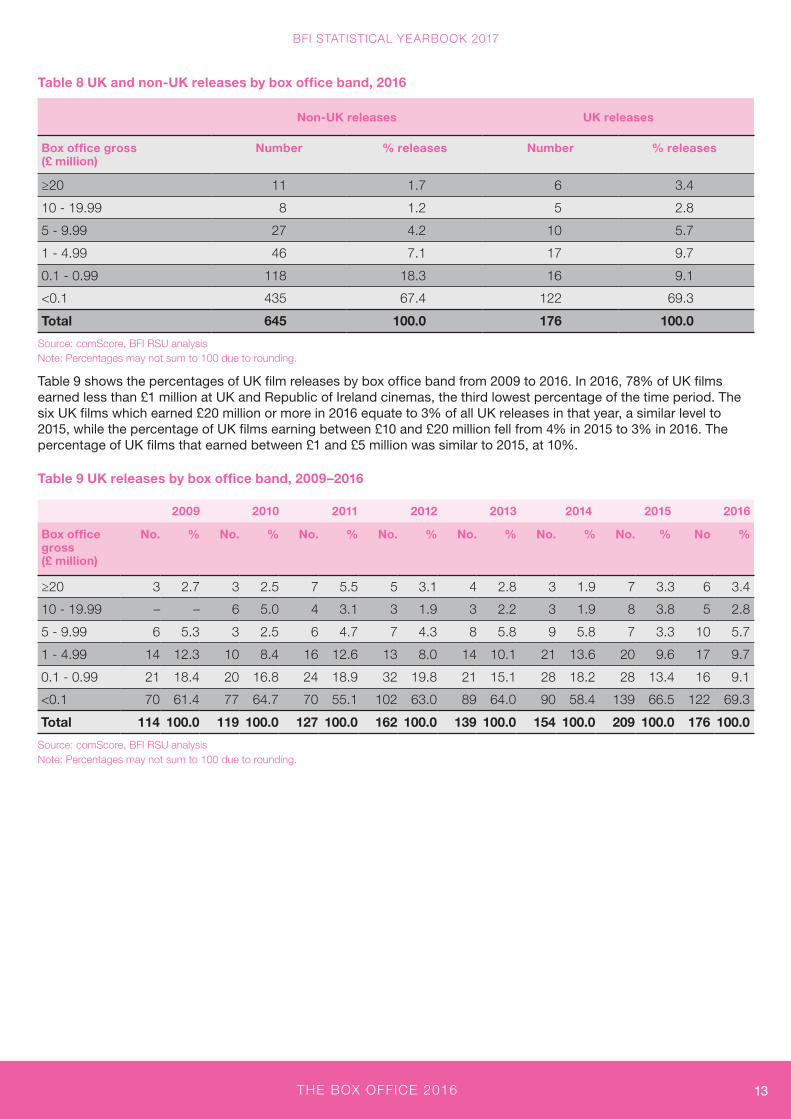
Table 8 compares the number of UK and non-UK films released in the UK and Republic of Ireland in 2016 across several gross box office bands. Overall, there were over three and half times as many non-UK releases as UK releases, with 645 films compared to 176. There were six UK qualifying films (including Rogue One: A Star Wars Story, Fantastic Beasts and Where to Find Them and Bridget Jones’s Baby) in the £20 million or over gross band compared to 11 non-UK films (including Finding Dory, Deadpool and Captain America: Civil War). In the second box office band there were five UK films compared with eight non-UK titles, and in the third band there were 10 UK films compared with 27 non-UK titles.
Overall, UK films made up 37% of all releases earning £10 million or over in 2016, down from 45% in 2015. The proportion of UK films in the lowest box office band was 69%, compared with 66% in 2015.
0
5
10
15
20
25
30
35
40
2016201520142013201220112010200920082007
%
UK studio-backed* 21.8 25.4 8.5 18.6 22.6 22.8 15.5 10.7 34.2 28.5
UK independent 6.8 5.7 8.2 5.4 13.1 9.3 6.6 16.1 10.5 7.4
Source: BFI, RSU * ‘Studio-backed’ means backed by one of the major US film studios.
THE BOX OFFICE 2016
BFI STATISTICAL YEARBOOK 2017
13
Table 8 UK and non-UK releases by box office band, 2016
Non-UK releases UK releases
Box office gross (£ million)
Number % releases Number % releases
≥20 11 1.7 6 3.4
10 - 19.99 8 1.2 5 2.8
5 - 9.99 27 4.2 10 5.7
1 - 4.99 46 7.1 17 9.7
0.1 - 0.99 118 18.3 16 9.1
<0.1 435 67.4 122 69.3
Total 645 100.0 176 100.0
Source: comScore, BFI RSU analysis Note: Percentages may not sum to 100 due to rounding.
Table 9 shows the percentages of UK film releases by box office band from 2009 to 2016. In 2016, 78% of UK films earned less than £1 million at UK and Republic of Ireland cinemas, the third lowest percentage of the time period. The six UK films which earned £20 million or more in 2016 equate to 3% of all UK releases in that year, a similar level to 2015, while the percentage of UK films earning between £10 and £20 million fell from 4% in 2015 to 3% in 2016. The percentage of UK films that earned between £1 and £5 million was similar to 2015, at 10%.
Table 9 UK releases by box office band, 2009–2016
2009 2010 2011 2012 2013 2014 2015 2016
Box office gross (£ million)
No. % No. % No. % No. % No. % No. % No. % No %
≥20 3 2.7 3 2.5 7 5.5 5 3.1 4 2.8 3 1.9 7 3.3 6 3.4
10 - 19.99 – – 6 5.0 4 3.1 3 1.9 3 2.2 3 1.9 8 3.8 5 2.8
5 - 9.99 6 5.3 3 2.5 6 4.7 7 4.3 8 5.8 9 5.8 7 3.3 10 5.7
1 - 4.99 14 12.3 10 8.4 16 12.6 13 8.0 14 10.1 21 13.6 20 9.6 17 9.7
0.1 - 0.99 21 18.4 20 16.8 24 18.9 32 19.8 21 15.1 28 18.2 28 13.4 16 9.1
<0.1 70 61.4 77 64.7 70 55.1 102 63.0 89 64.0 90 58.4 139 66.5 122 69.3
Total 114 100.0 119 100.0 127 100.0 162 100.0 139 100.0 154 100.0 209 100.0 176 100.0
Source: comScore, BFI RSU analysis Note: Percentages may not sum to 100 due to rounding.
THE BOX OFFICE 2016
BFI STATISTICAL YEARBOOK 2017
14
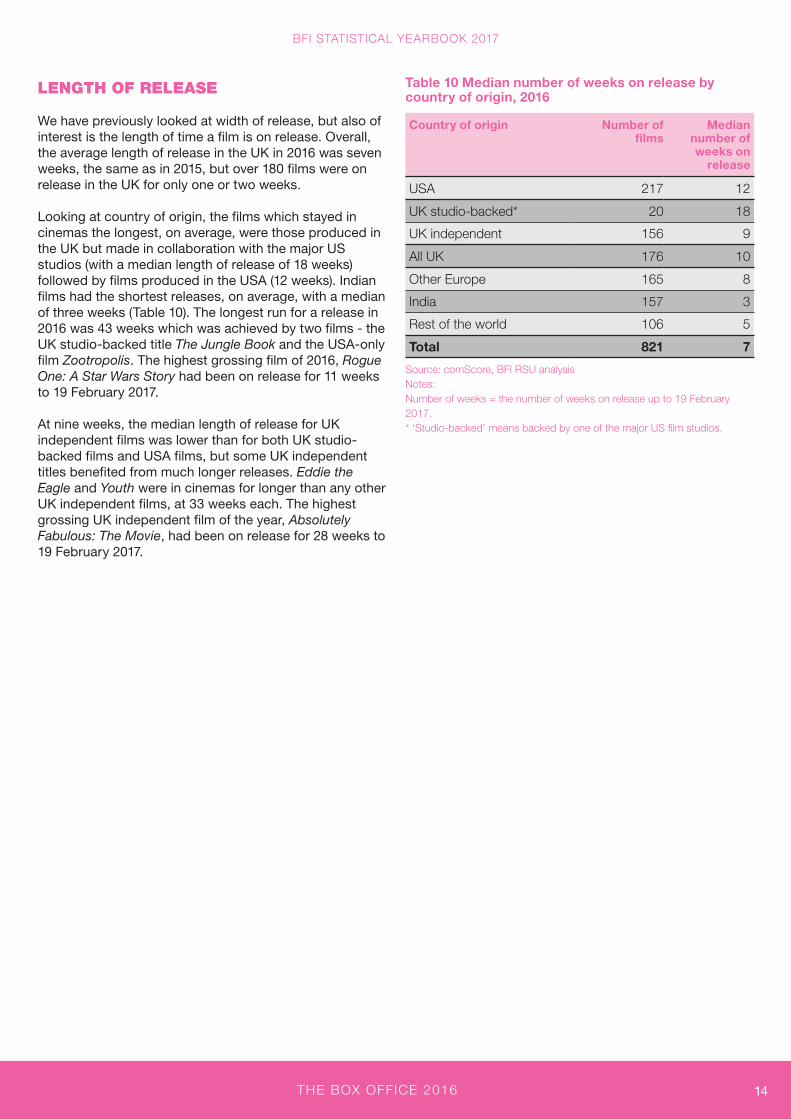
LENGTH OF RELEASE
We have previously looked at width of release, but also of interest is the length of time a film is on release. Overall, the average length of release in the UK in 2016 was seven weeks, the same as in 2015, but over 180 films were on release in the UK for only one or two weeks.
Looking at country of origin, the films which stayed in cinemas the longest, on average, were those produced in the UK but made in collaboration with the major US studios (with a median length of release of 18 weeks) followed by films produced in the USA (12 weeks). Indian films had the shortest releases, on average, with a median of three weeks (Table 10). The longest run for a release in 2016 was 43 weeks which was achieved by two films - the UK studio-backed title The Jungle Book and the USA-only film Zootropolis. The highest grossing film of 2016, Rogue One: A Star Wars Story had been on release for 11 weeks to 19 February 2017.
At nine weeks, the median length of release for UK independent films was lower than for both UK studio-backed films and USA films, but some UK independent titles benefited from much longer releases. Eddie the Eagle and Youth were in cinemas for longer than any other UK independent films, at 33 weeks each. The highest grossing UK independent film of the year, Absolutely Fabulous: The Movie, had been on release for 28 weeks to 19 February 2017.
Table 10 Median number of weeks on release by country of origin, 2016
Country of origin Number of films
Median number of weeks on
release
USA 217 12
UK studio-backed* 20 18
UK independent 156 9
All UK 176 10
Other Europe 165 8
India 157 3
Rest of the world 106 5
Total 821 7
Source: comScore, BFI RSU analysis Notes: Number of weeks = the number of weeks on release up to 19 February 2017. * ‘Studio-backed’ means backed by one of the major US film studios.

Research & Statistics Unit21 Stephen Street, London W1T 1LN
bfi.org.uk/statistics