Embed Size (px)
Citation preview

The Bonding Hypothesis of Takeover Defenses: Evidence from IPO Firms
William C. Johnson Whittemore School of Business and Economics
University of New Hampshire Durham, NH 03824
Jonathan M. Karpoff Foster School of Business University of Washington
Seattle, WA 98195 [email protected]
Sangho Yi Sogang Business School
Sogang University Seoul, South Korea
First draft: September 6, 2011 Under revision: March 15, 2013
We thank Audra Boone, Bruce Carlin, John Coates, Kimberly Cornaggia, Rob Daines, Laura Field, Eli Fich, Wayne Guay, Michael Klausner, Naveen Khanna, Charles Knoeber, Michelle Lowry, David Offenberg, Micah Officer, Urs Peyer, Andrei Shleifer, Jeff Zweibach, and participants at the 2011 Financial Research Association conference and seminars at Auburn University, the University of Calgary, Emory University, Florida State University, and the University of New Hampshire for helpful comments. Karpoff also would like to thank the Foster School Research Fund for support. Many additional tests and robustness checks are reported in an Internet Appendix that accompanies this paper, available at: http://www.wsbe.unh.edu/sites/default/files/internet_appendix_why_do_ipo_firms_have_takeover_defenses.docx.

The Bonding Hypothesis of Takeover Defenses: Evidence from IPO Firms
Abstract
We propose and test an efficiency explanation for why firms deploy takeover defenses
using IPO firm data. Takeover defenses bond the firm’s commitments by reducing the likelihood
that an outside takeover will change the firm’s operating strategy and impose costs on its trading
partners. This bond, in turn, encourages the firm’s trading partners to invest in their business
relationship with the firm. Consistent with this hypothesis, we find that IPO firms deploy more
takeover defenses when they have customers, suppliers, or strategic partners that are vulnerable to
changes in the firm’s operating strategy. An IPO firm’s valuation and subsequent operating
performance both are positively related to its use of takeover defenses, particularly when it has
dependent customers, suppliers, or strategic partners. The IPO announcement is associated with
increases in share values at the IPO firm’s dependent customers, but only when the IPO firm
deploys takeover defenses. We also find that the IPO firm’s use of takeover defenses is positively
related to the longevity of its business relationships, indicating that the defenses do in fact help
the IPO firm bond its commitments to its business partners. These results indicate that takeover
defenses are one mechanism by which IPO firms can ameliorate the hold-up problem that arises
when firms develop close working relationships with customers, suppliers, and strategic partners.
*This paper is a partially revised version of a paper that previously was titled, “Why do IPO firms have takeover defenses?”
Many additional tests and robustness checks are reported in an Internet Appendix. The Internet Appendix also is being revised, but a previous version is available at: http://www.wsbe.unh.edu/sites/default/files/internet_appendix_why_do_ipo_firms_have_takeover_defenses.docx.

1
The Bonding Hypothesis of Takeover Defenses: Evidence from IPO Firms
I. Introduction
Takeover defenses remain one of the most controversial aspects of corporate governance.
Conventional wisdom holds that takeover defenses serve primarily to entrench managers at
shareholders’ expense.1 Reflecting this view, shareholder advisory groups frequently advise their
clients to vote against the adoption of new defenses and for the repeal of existing defenses.2
Researchers frequently use the G-Index and E-Index as measures of governance quality, with
higher numbers of takeover defenses indicating poorer governance (e.g., Masulis, Wang, and Xie,
2007).
A counterargument, however, is that takeover defenses convey benefits to shareholders.
DeAngelo and Rice (1983) and Stulz (1988) show that defenses can increase managers’ ability to
extract higher premiums in the event of takeover. Stein (1988) and Chemmanur and Jiao (2012)
argue that defenses can protect valuable firm projects that uninformed or myopic investors
undervalue in financial markets. These views are espoused by leading practitioners (e.g., see
Lipton 2002), and some empirical research supports these views (e.g., see Cen, Dasgupta, and
Sen 2011; Humphrey-Jenner 2013; Smith 2013).
In this paper we examine a different path by which takeover defenses can create value.
Knoeber (1986) and Shleifer and Summers (1988) propose that takeover defenses increase firm
value by committing the firm to a business strategy that cannot easily be reversed via outside
takeover.3 This decreases the probability that the firm will act opportunistically towards its large
customers and other stakeholders, encouraging them to invest in relationship-specific assets. By
1 For examples, see Easterbrook and Fischel (1991), Bebchuk, Coates and Subramanian, (2002), and Gompers, Ishii, and Metrick (2003). 2 See, for examples: “The Shareholder Rights Project 2012 Report,” Harvard Law School, February 13, 2013, available at http://srp.law.harvard.edu/releases/SRP-2012-Annual-Report.pdf; “Insitutional Shareholder Services Releases 2013 Proxy Voting Policies,” November 16, 2012, available at http://www.issgovernance.com/press/2013policies. 3 See also Agrawal and Knoeber (1998), Coates (2001), Pontiff, Shleifer, and Weisbach (1990), and Cremers, Nair, and Peyer (2008), and Cen, Dasgupta, and Sen (2012).

2
bonding its contractual performance with counterparties, the firm gains favorable contracting
terms that increase firm value. We call this the bonding hypothesis of takeover defenses.
The bonding hypothesis can be illustrated with an example. LMI Aerospace, Inc. produces
close tolerance aluminum and specialty alloy components for the aerospace and defense
industries. LMI’s largest customer, accounting for 10% of sales in the year it went public (1998),
is The Boeing Company. Boeing, in turn, relies heavily on LMI for specialty parts. It has invested
heavily in its business relationship with LMI, to the point where LMI’s engineers have detailed
knowledge of Boeing’s design and manufacturing processes. Boeing’s investment in and reliance
upon its partnership with LMI exposes it to what Klein, Crawford, and Alchian (1978) call a
hold-up problem: LMI could opportunistically abrogate its contracts with Boeing and demand a
higher payment, which in the short run Boeing may very well be willing to pay. That is, Boeing’s
investment in its business relationship with LMI creates a quasi-rent that potentially is
appropriable by LMI.
What keeps LMI from breaking the contract and holding Boeing up for a higher price? One
deterrent is that LMI’s short-term gain would come at the expense of its long-term sales to
Boeing and other customers, or what Karpoff and Lott (1993) call a reputational loss. But as
Klein and Leffler (1981) show, under some conditions the reputational loss is insufficient to deter
opportunistic behavior. Another deterrent is that LMI’s managers have personal connections and
reputations that would be sullied if the firm held Boeing up for a short-term gain. But, as Shleifer
and Summers (1988) point out, such personal commitments have little value if the managers are
removed in a takeover and replaced by different managers who have no commitment to the
business relationship. This is how takeover defenses can be valuable. When it went public in
1998, LMI had three takeover defenses. The bonding hypothesis holds that these defenses worked
to insulate LMI’s managers from the threat of outside takeover, thereby bonding LMI’s
commitment to its Boeing relationship and encouraging Boeing to continue to invest in the
relationship.

3
This paper tests the bonding hypothesis of takeover defenses using data from firms that
went public between 1997 and 2005. In principle, the bonding hypothesis applies to both IPO
and seasoned firms and could be tested using data from seasoned firms. One disadvantage to
using IPO firm data to examine the hypothesis is that IPO firms may face business risks that are
unique and not generalizable to seasoned firms. There are several offsetting advantages, however,
to using IPO firm data. The first advantage is that IPO firms’ takeover defenses are likely to
result from an explicit consideration of their costs and benefits. Seasoned firms’ takeover
defenses are sticky over time and tend to ratchet only in one direction, toward more defenses
(Hannes 2006). This suggests that many seasoned firms’ takeover defenses are the legacies of
past business conditions and decisions. A second advantage is that IPO firms tend to be small
and are more likely to have values that depend heavily upon their relationships with specific
business partners. For example, Johnson, Kang, and Yi (2012) report that 65% of IPO firms
disclose a large customer, whereas Cen, Dasgupta, and Cen (2011) report that 41% of
COMPUSTAT-listed industrial firms rely on such large customers. This implies that the benefits
of any bonding from takeover defenses are likely to be larger and more apparent among IPO
firms than among seasoned firms. A third advantage is that the IPO event dramatically increases
the probability that the (formerly private) company will receive an unsolicited takeover offer.
This increases the risk of appropriation for the firm’s counterparties, and according to the
bonding hypothesis, increases the value of a takeover defense more than for a firm that has been
publicly traded for some time. A fourth advantage of using IPO firm data is that we are able to
construct reasonable instrumental variables based on the identity of the IPO firm’s law firm.
An additional benefit of using IPO firm data is that the bonding hypothesis offers a
resolution to an IPO puzzle: Why do so many firms adopt takeover defenses when they go public?
Identifying this puzzle, Daines and Klausner (2001) note that, if takeover defenses lower share
values as is widely presumed, it would be irrational for pre-IPO shareholders to implement them
and suffer the resulting loss when shares are sold to outside investors. The bonding hypothesis

4
implies that many IPO firms adopt takeover defenses because, contrary to common belief, they
increase firm value.
To implement tests of the bonding hypothesis, we construct three measures of the quasi-
rents that potentially are appropriable by the IPO firm. The first, Large customer, indicates the
presence of a large customer on whom the IPO firm relies for a significant portion of its sales – as
in the LMI-Boeing example. The second measure, Large supplier, is an indicator that the IPO
firm is a large and dominant customer for one or more of its suppliers. This measure recognizes
that a large customer can hold up its supplier. In our example, Boeing is not the only party at risk
of a hold-up, as LMI also has made fixed investments and earns quasi-rents from the relationship.
The third measure is an indicator of a Strategic alliance between the IPO firm and another firm.
For each measure, the presence of a large customer, large supplier, or strategic alliance partner
indicates that the IPO firm’s trading partner has made relationship-specific investments that give
rise to appropriable quasi-rents. The bonding hypothesis implies that IPO firms with significant
trading partners are more likely to deploy takeover defenses than other IPO firms, and that
takeover defenses are more likely to create value when the IPO firms have such trading partners.
We use these three measures of appropriable quasi-rents to conduct five main categories of
tests of the bonding hypothesis. First, we find that an IPO firm’s number of takeover defenses is
positively related to all three measures of appropriable quasi-rents. We also examine in more
detail a subsample of IPO firms that have a large customer that itself is publicly traded. Among
these firms, the number of takeover defenses is positively related to four additional measures that
reflect the importance of the large customer’s quasi-rents: (i) whether there is a social link
between the IPO firm’s CEO and the customer firm’s CEO, (ii) whether there is a long-term
contract between the two firms, (iii) the pre-IPO length of the business relationship, and (iv)
whether the IPO firm sells primarily to that one customer. These results strongly support the
hypothesis that takeover defenses are deployed to help bond the firm’s commitment when it has
important trading relationships that create appropriable quasi-rents.

5
In our second set of tests we examine firm valuation at the IPO, using multiples based on
earnings and sales. Firm valuation is positively related to the number of takeover defenses,
primarily when the IPO firm has a large customer, large supplier, or strategic partner. These
results support the view that takeover defenses are valuable to the IPO firm when its
counterparties have quasi-rents that are at risk of appropriation by the IPO firm.
Firm value and the deployment of takeover defenses are most likely endogenous, so the
positive correlation between firm value and takeover defenses need not be causal. To explore
causality, we use instrumental variables that rely on the identity or characteristics of the IPO
company’s law firm. As discussed by Coates (2001), an IPO firm’s law firm can help to explain
the number of takeover defenses it deploys. In addition, IPO firms tend to choose their lawyers
well before the IPO. This implies that law firm identity and characteristics meet both relevance
and exclusion criteria as an instrument for the number of takeover defenses. Using these
instruments as controls for endogeneity, we continue to find that firm value at the IPO is
positively related to the use of takeover defenses, and that the positive relation appears only when
important counterparty quasi-rents are at stake. These results support the inference that takeover
defenses not only are correlated with higher value, but also are a cause of the higher value.
In our third set of tests we find that takeover defenses are associated with higher operating
performance after the IPO. Once again, the positive relation arises only in the presence of
appropriable quasi-rents among the IPO firm’s counterparties, and persist in tests that use
instrumental variables for the firm’s use of takeover defenses. These results indicate that the
higher valuations observed when IPO firms deploy takeover defenses are consistent with these
firms’ subsequent performance. They also show how IPO firms benefit from their takeover
defenses, as they also earn quasi-rents from the ongoing relationships with their counterparties.
In our fourth set of tests we examine the impact of the IPO firm’s takeover defenses on its
large customers. When an IPO firm announces it decision to go public, its large customers’
abnormal stock return is positively related to the IPO firms’ use of takeover defenses. Once again,

6
the marginal impact of the takeover defenses is positively related to our measures of the value of
the trading relationship. Furthermore, the positive share impact of the IPO firm’s takeover
defenses is observed only at its large customer, and not among other firms in the customer’s
industry.
In our fifth set of tests we find that the duration of the business relationship between the
IPO firm and its large customer increases with the takeover defenses deployed at the time of the
IPO. The duration effect of takeover defenses is particularly strong when there is a social link
between the IPO and customer firms’ CEOs, and when there is a strategic alliance between the
two firms. These results provide further support for the bonding hypothesis of takeover defenses,
because they indicate that takeover defenses are in fact related to the longevity of the business
relationship.
Section 5 reports on several supplementary tests of the bonding hypothesis and an
extensive set of robustness tests. We find evidence of a negative spillover effect on the IPO
firm’s important counterparties when the IPO firm is acquired, and that takeover defenses
are associated with a lower incidence of forced CEO turnover. We consider alternate
measures of a firm’s takeover defenses and the existence of appropriable quasi-rents, and
examine the impact of venture capital and the IPO’s public float on our results and inferences.
We also test three possible alternative interpretations of our findings. All of these robustness test
results are consistent with the bonding hypothesis of takeover defenses.
Taken together, these results indicate that takeover defenses help to bond the IPO firm’s
guarantees to its counterparties by decreasing the probability that current management will be
replaced, and company policy changed, through an outside takeover. This, in turn, encourages the
counterparties – including large customers, large suppliers, and strategic partners – to make long-
term relationship-specific investments. Some of the benefits of these long-term relationships
accrue to the IPO firm in the form of higher IPO valuation and improved long-run operating

7
performance. This implies that many IPO firms adopt takeover defenses precisely because pre-
IPO shareholders benefit from them.
These results help to explain the puzzle of why many IPO firms have defenses. To the
extent they resolve one puzzle, however, they create another: If takeover defenses create value
for many IPO firms, why are they frequently associated with lower share values at seasoned firms?
We hypothesize that takeover defenses confer both benefits and costs, as the bonding and
entrenchment hypotheses of takeover defenses are not mutually exclusive. Our tests indicate that,
among IPO firms whose important business partners have relationship-specific quasi-rents at
stake, the bonding benefits exceed the costs of entrenchment, on average. It is possible, however,
that among seasoned firms, the bonding benefits of takeover defenses are relatively small and/or
the entrenchment costs are relatively high. If this is the case, the entrenchment hypothesis applies
more generally to seasoned firms than to IPO firms. This, in turn, implies that the relative costs
and benefits of takeover defenses tend to change as a firm matures. Exactly how and when such
changes occur, however, is a topic for further research.4
This paper proceeds as follows. In section II we describe the bonding hypothesis and the
proxy variables we use to test it in our sample of IPO firms. Section III describes the data. Section
IV presents the results of our five main empirical tests of the bonding hypothesis. Section V
reports on several extensions of the bonding hypothesis. Section VI applies our findings to the
IPO takeover defense puzzle, and section VII concludes.
4 Cen, Dasgupta, and Sen (2011) find that the passage of a business combination law is associated with an increase in performance in firms with large customers that are publicly traded corporations, and an increase in the length of the business relationship with the large customer. These results suggest that the bonding benefits that we document for IPO firms can also be important for some seasoned firms, at least for one type of takeover defense.

8
II. The bonding hypothesis of takeover defenses II.A. The main idea
The main idea of the bonding hypothesis is that takeover defenses can guarantee the firm’s
commitment not to act opportunistically to appropriate its counterparties’ quasi-rents. Quasi-rents
arise when a counterparty makes a relationship-specific investment that would lose value if the
firm changes its operating strategy. Quasi-rents are important for understanding a wide range of
economic phenomena, including CEOs’ employment contracts (Gillan, Hartzell, and Parrino
2009), contract enforcement (Klein and Leffler 1981), and rent-seeking (Posner 1975). The
archetypal example discussed by Klein, Crawford, and Alchian (1978) involves Fisher Body and
General Motors (GM). GM entered into a long-term contract to buy essentially all of the exterior
shells for its closed body automobiles from Fisher Body at a price set on a cost-plus basis. The
contract and GM’s specific investments in the trading relationship made GM vulnerable to
appropriation by Fisher Body. Sure enough, once GM was locked into the contract Fisher Body
began to increase its price, justifying the price increase by claiming higher costs.
Klein et al. (1978) and Williamson (1979) argue that one solution to such hold-up problems
is vertical integration, and in fact, GM purchased Fisher Body several years into the firms’ joint
arrangement. Vertical integration, however, is itself costly and not likely to be an optimal solution
to all hold-up problems. (For example, Grossman and Hart (1986) and Hart and Moore (1990)
show that vertical integration can distort incentives in ways that destroy value.) As a result, some
otherwise efficient contracts between firms and their customers will not be made, as the risk of a
hold-up undermines the customer’s willingness to invest in the trading relationship.
Shleifer and Summers (1988), Coates (2001), and Stout (2002) suggest that an alternative
solution is for managers to contract implicitly to not act opportunistically. For example, Fisher
Body’s managers could promise not to raise prices to appropriate GM’s quasi-rents. By their
nature, implicit contracts are enforced informally through personal connections and reputation

9
(e.g., see Klein and Leffler 1981). The firm’s managers tie their reputations to a business strategy
that encourages their business partners to make relation-specific investments.5
The problem with such implicit commitments – even when managers make good-faith
efforts to abide by them – is that the managers can be replaced in a hostile takeover. New owners
would not have any personal or reputational commitment to the firm’s former business strategy,
allowing them to breach the former managers’ commitments and appropriate the counterparty’s
quasi-rent. This is where takeover defenses become important. By decreasing the likelihood of
outside takeover, takeover defenses bond the firm’s guarantees to abide by its implicit agreements
with its counterparties. This induces the counterparties to make relation-specific investments that
benefit the firm. In the LMI-Boeing example discussed in the introduction, LMI had three
takeover defenses when it went public, including a classified board and a restriction on
shareholders’ right to act by written consent. The bonding hypothesis holds that these defenses
helped to encourage Boeing to continue to invest in and rely upon its relationship with LMI as a
supplier for important specialty aerospace products.
Another illustrative example is discussed by Cremers, Nair, and Peyer (2006) and Arlen
(2006). PeopleSoft, Inc. produced a complex software product that required a large up-front
investment by customers, who in turn relied on PeopleSoft’s ongoing vendor support. When in
2003 Oracle made a hostile takeover bid for PeopleSoft, PeopleSoft’s customers objected
strongly, concerned that their products would no longer be supported by the merged company.6
That is, PeopleSoft’s customers had quasi-rents that would be lost if Oracle did not continue the
same level of customer support for PeopleSoft’s products.
5 Shleifer and Summers(1988) argue that managers are selected for their personal commitment to the firm’s counterparties: “It is probably most likely that prospective managers are trained or brought up to be committed to stakeholders … they find stakeholder welfare has now entered their preferences, thus making them credible upholders of implicit contracts” (p. 40). 6 “PeopleSoft Director Explains Rejection Bid,” The New York Times, October 14, 2004.

10
II.B. Measuring the existence of appropriable quasi-rents
The key insight of the bonding hypothesis is that takeover defenses can be valuable when
the IPO firm’s counterparties earn quasi-rents that can be appropriated if the IPO firm breaches
its implicit contracts. To test the bonding hypothesis, we require measures of the existence of a
counterparty’s appropriable quasi-rents. Our main tests emphasize three such measures and the
Internet Appendix reports results using four additional measures. The results using all of these
measures are similar, indicating that the existence, value, and performance effects of an IPO
firm’s takeover defenses are positively related to the existence of counterparty quasi-rents.
Our first measure, Large customer, is an indicator variable set equal to one if the IPO firm
has at least one large customer that accounts for 10% or more of its sales.7 Our rationale is that
relationship-specific quasi-rents are more likely to arise when the IPO firm has an obviously
dominant trading relationship with a single customer. Fisher Body’s relation with General Motors,
as described by Klein, Crawford, and Alchian (1978) is an example, as is the LMI Aerospace, Inc.
– Boeing example discussed in the introduction. Consistent with these examples, Joskow (1987)
and Klein (1988) argue that large customers frequently are exposed to hold-up problems. The
potential for a hold-up arises as the customer invests in specialized employee training or build
distribution channels with their suppliers. We hypothesize that the potential for a hold-up problem
increases with the size of the trading relationship, and we use Large customer to measure the size
of the trading relationship.
Not only can the seller (Fisher Body, LMI) potentially hold up its large customer (GM,
Boeing). The customer also can hold up the seller. LMI, for example, has invested heavily in
7 The data come from the COMPUSTAT segment customer database, which contains customer disclosures following U.S. disclosure rules. FAS No.131 requires firms to report of the presence of all customers responsible for over 10% of their annual revenues. This is the database used in Fee and Thomas (2004) and Hertzel, Li, Officer, and Rodgers (2008). Frequently, the data report not only on the existence of a large customer, but also on the fraction of the IPO firm’s sales that go to that customer. As reported in the Internet Appendix, our results do not change appreciably when we use this fractional amount instead of the Large customer dummy variable, or when we include only customers with >15% of sales, >20% of sales, or >25% of sales.

11
relationship-specific assets by locating its plant close to Boeing’s production facility.8 This
creates a quasi-rent that arises from LMI’s lower transportation costs, which Boeing could
appropriate by offering to pay a price that covers only LMI’s variable costs. If Boeing were going
public, the bonding hypothesis implies that it could adopt takeover defenses as a way of bonding
its commitments to LMI. That is, the IPO firms in our sample may not only have important
relationships with their customers, but also with their suppliers. Our second measure of
appropriable quasi-rents therefore is Large supplier, which is an indicator taking a value of one if
the IPO firm is a customer accounting for more than 10% of the sales of another firm.
Our third measure of appropriable quasi-rents is Strategic alliance, an indicator variable set
equal to one if the firm has entered into a strategic alliance with another firm. Chan, Kensinger,
Keown and Martin (1997) argue that strategic alliances encourage partners to make irreversible
alliance-specific investments. Williamson (1985) and Joskow (1987) argue that long term
contracts, such as occurs in strategic alliances, involve investments in fixed assets that give rise to
potentially appropriable quasi-rents. The bonding hypothesis implies that takeover defenses will
be particularly valuable when the firm has entered into a strategic alliance.
In some tests below we emphasize the Large customer measure of appropriable quasi-rents.
This is because we have good data to identify large customers, and Large customer = 1 for 60%
of the sample IPO firms. In contrast, Large supplier = 1 for only 4% of the sample IPO firms, and
Strategic alliance = 1 for 31% of the sample. Because many of the IPO firms have large
customers, a substantial number (209) of the large customers are themselves publicly traded
corporations. This makes data available with which we can conduct additional tests of the
bonding hypothesis. In section 4.1 we use data on the characteristics of the large customer firm
(e.g., whether the CEOs of the IPO firm and its large customer have a social connection) to gauge
8 LMI even states that “part of its strategy was to establish facilities near to the Company’s principal customers” (LMI prospectus filing, http://www.sec.gov/Archives/edgar/data/1059562/0000950124-98-003679.txt).

12
the importance of the business relationship. Also, in section 4.4 we examine the share price
impacts of the IPO firm’s takeover defenses on the subsample of publicly traded large customers.
III. Data and summary statistics
Our sample is generated from the Security Data Corporation (SDC) new issues database
from 1997-2005. We remove finance and utilities firms, firms making unit offerings, closed end
funds, Real Estate Investment Trusts (REITs), American Depository Receipts (ADRs), IPO firms
headquartered outside the U.S., and firms with an offer price below $5. Since IPO relative
valuation is a key component of our study, we also restrict the sample to include firms with sales
(COMPUSTAT data item SALE) and EBITDA (COMPUSTAT data item OIBDP) in the fiscal
year prior to the IPO. This yields a sample of 1,219 firms.
Some of the variables used in our tests are available from the COMPUSTAT dataset. But
much of the data were compiled manually from the IPO firms’ prospectuses. The hand-collected
data include all takeover defense measures; the exact amounts sold to large customers and
purchased from large suppliers; indications of strategic alliances, and venture backing; CEO
characteristics such as compensation, tenure, and age; firm governance characteristics such as
inside ownership, board size and independence; and underwriter characteristics.
Panel A of Table 1 reports summary statistics about the sample firms. The mean IPO firm
has a book value of assets of $362 million, mean market capitalization at the time of the IPO of
$714 million, and mean sales in the year before the IPO of $116 million. Panel B of Table 1
reports summary measures of the three measures of appropriable quasi-rents. A total of 60% of
the IPO firms have a large customer, 4% have a large supplier, and 31% have entered a strategic
alliance.
In our empirical tests we use three measures of a firm’s takeover defenses. The first is the
FK-index of up to 10 takeover defenses used by Field and Karpoff (2002) in their analysis of IPO
firms, which is also used by Chemmanur, Paeglis, and Simonyan (2011). The second is Gompers,

13
Ishii, and Metrick’s (2003) G-index, which counts up to 24 takeover defenses. And the third is
Bebchuk, Cohen, and Ferrell’s (2009) E-index, which counts up to six takeover defenses. Each of
these indices has advantages and drawbacks in what it counts as a takeover defense.9 In our
sample, the correlation between the FK-index and the G-index is 0.51. The correlation between
the FK-index and the E-index is 0.60, and the correlation between the G-index and the E-index is
0.72. We find similar results using all three indices, although in two specific tests (out of dozens)
the results are not significant using the G-index while they are significant using the FK-index and
the E-index. We point out these two specific exceptions below.
As reported in Table 1 Panel C, the mean value of the FK-index is 3.16. This is higher than
the mean of 2.56 reported by Field and Karpoff (2002), but closer to that of Chemmanur, Paeglis,
and Simonyan (2011) for the same index. This is because our sample period of 1997-2005
postdates that of Field and Karpoff (2002), and there is a secular increase in the number takeover
defenses at IPO firms over this time period. The mean G-index value of 9.59 is similar to that
reported by Gompers, Ishii, and Metrick (2003). Our E-index mean, however, is below the mean
reported by Bebchuk, Cohen, and Ferrell (2009). This is because few IPO firms adopt poison pills
(Field and Karpoff (2002) report an adoption rate of 2.3%) compared to the mature firms in the
Bebchuk et al. (2009) sample (62.1%).
In the empirical tests we control for a variety of managerial and firm characteristics. The
control variables are identical to those examined by Field and Karpoff (2002) and Chemmanur,
Paeglis, and Simonyan (2011), except that we add underwriter rank as a control for the quality of
the offering. Panel D of Table 1 reports on summary statistics for some of these variables. These
9 For example, the G-index has an advantage of including the largest number of defenses, including coverage by state antitakeover laws. However, it double counts some provisions that largely are redundant (director indemnification, indemnification contracts, and indemnification insurance) and groups together other defenses that most likely are distinct (e.g., counting control share acquisition laws as similar to supermajority vote requirements). The E-index was constructed to count only the defenses that its creators judge to be most important, but possibly misses other important defenses. The FK-index includes several additional provisions that the E-index does not, but it also combines certain provisions (e.g., restrictions on shareholders’ right to act by written consent or to call special shareholder meetings) that the G-Index treats as separate, and does not include state antitakeover laws. Details of how each index is constructed are reported in the Appendix.

14
descriptive results are similar to those reported by others. For example, on average, the CEO is 47
years old and has been at the firm for 5.9 years, 56% of the CEOs are also chairman of the board,
and the mean board size is 6.6. These averages are similar to those reported by Boone et al. (2007)
for their sample of IPOs. One noteworthy difference is that the average CEO compensation is
$430,000 in our sample, which is smaller than that reported by Coates and Kraakman (2011).
IV. Empirical tests of the bonding hypothesis
IV.A. Takeover defenses at the IPO
IV.A.1. Univariate comparisons
We first measure whether IPO firms use more takeover defenses when their counterparties
have potentially appropriable quasi-rents. Table 2 reports on univariate comparisons. Our first
measure for the existence of appropriable quasi-rents, Large customer, indicates whether the IPO
firm has at least one customer who accounts for 10% or more of the firm’s total sales at the time
of the IPO. Using any of the three indices of takeover defenses, the mean number of defenses at
firms with large customers is significantly larger than for IPO firms without large customers.
Using the G index, for example, the mean value is 9.81 for firms with large customers and 9.27
for firms without large customers. This difference is significant at the 1% level. Similar results
obtain using the non-parametric Mann-Whitney test statistic.
Panels B and C of Table 2 show that similar results obtain using our other measures of
appropriable quasi-rents, Large supplier and Strategic alliance. In each case, our measures of
counterparty quasi-rents are associated with a larger number of takeover defenses at the IPO firm.
In tests reported in the Internet Appendix, we examine whether the results in Table 2 are
affected by any particular takeover defenses. We re-tabulate the Table 2 results after alternately
omitting miscellaneous defenses, blank check preferred stock, supermajority vote requirements,
and classified boards from the takeover defense indices, or by treating classified boards as the
only relevant defense. In all cases, the results are qualitatively the same as in Table 2. This

15
implies that IPO firms with important counterparties use a broad mix of takeover defenses rather
than relying on any one type of defense.
IV.A.2. Multivariate tests
Table 3, Panel A reports the results from nine specifications of a Poisson maximum
likelihood regression in which the dependent variable is the Field-Karpoff index (Models 1-3), G-
index (Models 4-6), or E-index (Models 7-9), measured at the IPO. Each regression includes all
of the control variables examined by Field and Karpoff (2002) and Chemmanur, Paeglis, and
Simonyan (2011) in their tests for takeover defenses at IPO firms, plus the underwriter’s rank and
the number of pre-IPO takeovers in the IPO industry. There is evidence of industry clustering, as
an analysis of variance on industry effects yields a value of F = 1.47 (p-value = 0.03), so we
include industry controls as well. As reported in the Internet Appendix, the results are similar
when we use an OLS model as an alternative to the Poisson model, or if we the same control
variables as Field and Karpoff (2002) and Chemmanur, Paeglis, and Simonyan (2011).
In Model 1 the coefficient for Large customer is 0.094 and is statistically significant at the
1% level. In Model 2 the coefficient for Large supplier is 0.155, and in Model 3 the coefficient
for Strategic alliance is 0.057 (both significant at the 5% level). Similar results obtain in Models
4 – 6 using the G-index as the dependent variable, and in Models 7 – 9 using the E-index. These
results indicate that the univariate comparisons reported in Table 2 maintain even controlling for
other possible determinants of a firm’s use of takeover defenses.
As a sensitivity test, we estimated logistic models in which the dependent variable equals 1
if the firm has more than the median number of takeover defenses, using each of the three indices.
This measure is similar to that used by Chemmanur, Paeglis, and Simonyan (2011). The results
are similar to those reported here.10
10 Chemmanur, Paeglis, and Simonyan (2011) also suggest that the use of takeover defenses is related to managerial quality. When we control for the variables used by Chemmanur, Paeglis, and Simonyan (2011)

16
For 209 of the 1,219 IPO firms in our sample, Large customer = 1 and the large customer is
itself a publicly traded firm. (When a particular IPO firm has multiple large customers, we
identify the customer that purchases the largest amount as our sample customer.) This allows us
to collect data on four additional measures of the importance of the IPO firm’s takeover defenses
in protecting the large customer’s quasi-rents. Social links is set equal to one when there is a
social link between the IPO firm’s CEO and the large customer’s CEO, as defined by Hwang and
Kim (2009). A social link between CEOs is likely to reinforce the IPO firm’s CEO’s commitment
to the trading relationship, increasing the bonding value of a takeover defense. Long term
contract indicates the existence of a long-term contract between the two trading partners. Pre-
IPO relationship length measures the number of years that the two trading partners have done
business. Percent of IPO firm sales is the dollar sales of the IPO firm to its large public customer
divided by the total IPO firm sales. The Internet Appendix reports on summary statistics for each
of these variables.
Panel B of Table 3 reports the results of tests using these four additional measures of the
importance of the trading relationship. These results use the FK-index of takeover defenses,
although the results are similar using the G-index or E-index. Each regression includes all of the
control variables reported in Panel A, although the control variable results are not reported in the
table. Using any of the four additional measures, the number of takeover defenses is positively
related to the importance of the trading relationship with the IPO firm’s large customer. In Model
5 we include all four variables. These four measures are positively correlated, so including them
all at once can induce an attenuation bias (Wooldridge, 2002). Despite such an effect, the
coefficients for Social links, Long-term contract, and Percent of IPO firms sales remain
statistically significant. These results further support the bonding hypothesis, which holds that
to proxy for managerial characteristics, our results are qualitatively unchanged. These test results are tabulated in the Internet Appendix.

17
IPO firms are more likely to adopt takeover defenses when they have important trading
relationships that give rise to appropriable quasi-rents.
IV.B. Takeover defenses and IPO firm valuation
IV.B.1. Univariate comparisons
The bonding hypothesis implies that takeover defenses are adopted because they increase
firm value, at least among firms that seek to provide guarantees that they will not act
opportunistically to appropriate their counterparties’ quasi-rents. In this section we examine this
implication of the bonding hypothesis using a difference-in-difference test, multiple regression,
and instrumental variable tests. To measure IPO firm value, we use four different measures used
in prior research: (i) the ratio of share price to EBITDA per share (P/EBITDA) (see Ritter and
Kim 1999; Purnanadam and Swaminathan 2004; Smart et al. 2008; Chemmanur and Loutskina
2009); (ii) price divided by sales per share (P/Sales) (Ritter and Kim 1999; Purnanadam and
Swaminathan 2004); (iii) price divided by cash flow (Ohlson 1990; Chemmanur and Loutskina
2006); and (iv) earnings divided by price (Smart et al. 2008). We use several different measures
because, as Chemmanur and Loutskina (2006) point out, each measure is subject to unique
criticism about whether it accurately reflects fundamental firm value.
In addition to examining alternate measures, we also compare each IPO firm’s value to that
of a control firm matched by industry, sales, and EBITDA/sales. For each IPO firm, all firms in
its Fama-French industry are grouped into a 3x3 matrix by sorting by sales and EBITDA/sales.
Within its matching 3x3 cell, the firm with sales closest to that of the IPO firm is selected as its
control firm. The tests reported here use the offer price to measure the share price. The Internet
Appendix reports similar results that use the share price measured at the close of the first day of
trading. We also focus on tests that use Large customer as our measure of appropriable quasi-
rents and that use the FK-index of takeover defenses, although (as tabulated in the Internet

18
Appendix) the results are similar in tests that use our other measures of appropriable quasi-rents
and takeover defenses.
Using the FK-index, the median number of takeover defenses among our IPO firms is three,
so we sort the sample into firms with fewer than three defenses (N=384), exactly three defenses
(N=371), and more than three defenses (N=464).11 Panel A of Table 4 reports on the mean and
median ratios of P/EBITDA for the IPO firm to P/EBITDA for its matched control firm. If the
IPO firm and its matched control have identical pricing relative to their cash flows, this ratio will
equal one. The conventional agency view of takeover defenses implies that defenses decrease
firm value, implying that the ratio should be negatively related to the firm’s use of takeover
defenses. The bonding hypothesis, in contrast, implies that takeover defenses increase firm value
when the firm has counterparties with appropriable quasi-rents, implying that the ratio should be
positively related to the use of takeover defenses for this subset of firms.
As reported in Table 4, the median ratio for firms with fewer than three defenses is 1.71.
The distribution of P/EBITDA is skewed, so the mean ratio is much larger, 10.55. The median
ratio for firms with exactly three defenses is 2.87 (mean = 23.31), and the median ratio for firms
with more than three defenses is 2.59 (mean = 21.41). The difference between firms with fewer
than three defenses and more than three defenses is statistically significant using both a t-test and
the Mann-Whitney nonparametric test.
The association between takeover defenses and firm value, however, is not apparent in all
IPO firms. Rather, it appears only among firms for which Large customer = 1. Among such firms
that have fewer than three defenses, the median valuation ratio is 1.78 (mean = 6.25). Among
firms with large customers that have more than three defenses, the median ratio is 2.98 (mean =
23.60). This difference is significant at the 5% level using a paired t-test, and at the 0.1% level
using the Mann-Whitney test. Among firms without a large customer, in contrast, there is no
11 The results are qualitatively similar using different sorts, for example, splitting the IPO firms into quintiles.

19
significant difference in the valuation ratios among firms with few or many takeover defenses.
Again, similar results obtain when we use Large supplier or Strategic alliance to indicate the
existence of appropriable quasi-rents. These results are consistent with the inference that takeover
defenses create value when they help to secure a valuable trading relationship, as implied by the
bonding hypothesis.
Panel B reports the results of similar comparisons using price divided by sales per share
(P/Sales) as the measure of valuation. Panel C uses price to cash flow, and Panel D uses earnings
divided by price. The results are similar to those in Panel A. Firms with more than three takeover
defenses have relatively high valuations, but this effect appears only among the subsample of IPO
firms with large customers. (For this version of the paper as of March 15, 2013, Panels C and D
have not yet been added to Table 4.)
In Panels A through C, the valuation measures for IPO firms with exactly three takeover
defenses are slightly larger than those for firms with more than three defenses. This difference,
however, is not statistically significant. In terms of their valuation effects, firms with exactly three
defenses appear similar to firms with more than three defenses. In fact, if we partition the IPO
firms into two groups – those with 0-2 defenses vs. those with 3 or more defenses – the empirical
results are even stronger than those reported in Table 4. More importantly, the multivariate tests
reported below do not suggest evidence of a structural break at three defenses. We infer that the
relatively high valuation ratios for firms with exactly three defenses are due to other firm
characteristics that are controlled for in the multivariate tests.
IV.B.2. Multivariate tests for firm valuation
Table 5 reports the results of multivariate tests that examine the effect of takeover defenses
on IPO firm valuation. To control for skewness, the dependent variable is the log of the relative
valuation ratio reported in Panel A of Table 4. Each test includes the same control variables
reported in Table 3, with the addition of log(IPO proceeds), the percent of the shares that are

20
primary shares, and IPO firm R&D/assets. For brevity, we do not report the control variable
results in the table. The regressions also include year and industry indicators. Models 1-3 show
that, including the control variables, IPO valuation remains positively related to the IPO firm’s
use of takeover defenses using any of the three indices of takeover defenses.
Models 4 – 6 report results in which we interact our three measures of appropriable quasi-
rents with the FK-index of takeover defenses (results are similar using the other indices). In
Model 4, the coefficient for the FK-index is insignificant, as is the coefficient for Large customer.
But the coefficient on the interaction of the two variables is positive and significant at the 5%
level. Similarly, in Models 5 and 6, the interaction of the FK-index with Large supplier or
Strategic alliance is positively and significantly related to the IPO firm’s valuation. These results
indicate that IPO valuation is not mechanically or universally related to the use of takeover
defenses. Rather, takeover defenses are associated with an increase in value only when the IPO
firm’s counterparties have large appropriable quasi-rents.
IV.B.3. Alternative valuation measures
Bhojraj and Lee (2002) discuss problems with firm valuation measures, including skewness
and measurement error. Such problems may affect our results, too. As one indication, the point
estimates in Table 5 imply larger economic effects than one might expect. In Model 1 of Table 5,
the point estimate of 0.075 implies that deploying one additional defense increases the log
relative valuation ratio from 1.02 to 1.09, or the ratio of IPO firm to matching firm from 2.77 to
2.97, an increase of 10%. Holding the matching firm size constant, this translates into an increase
in market capitalization of $17 million for the median IPO firm.
To investigate whether our results are affected by our choice of valuation measure, we
repeated our tests using the three other valuation measures reported in Table 4. These alternate
measures also are subject to measurement error. Nonetheless, in all tests we find that firm

21
valuation is positively related to the use of takeover defenses. In most tests, the positive relation
is concentrated among firms with large customers. Details are reported in the Internet Appendix.
IV.B.4. Endogeneity
The results in Tables 4 and 5 indicate that takeover defenses are positively associated with
IPO firm value when the firm has important counterparties with appropriable quasi-rents.
However – and as with most empirical tests in which firm value is the dependent variable and
some firm characteristic is the independent variable – we cannot make a strong argument that the
relation is causal. It is possible that firm value, counterparty quasi-rents, and the use of defenses
all reflect the firm’s underlying economic environment. For example, suppose that firms with
important counterparties tend to have good performance, and that good performance grants self-
serving CEOs latitude to adopt takeover defenses. The defenses would be associated with high
firm valuation when the firm has important counterparties, but the causality would be reversed.
The results in Models 4 – 6 of Table 5 indicate that this endogeneity scenario is unlikely
because high firm valuation is not significantly related to the presence of an important
counterparty. Rather, it is only the interactions of the takeover defense index with the indicators
for important counterparties that are significantly related to firm value. Nonetheless, to examine
the possibility that our results reflect endogeneity in the determination of defenses, counterparties,
and value, we conduct instrumental variable tests using three different instruments for takeover
defenses. Coates (2001) demonstrates that law firms have different tendencies to recommend
takeover defenses to their client firms, and that takeover defenses are heavily influenced by the
IPO firm’s law firm. It is important also to note that IPO firms typically choose their attorneys
long before their decision to go public and for reasons that appear to be unrelated to the use of
takeover defenses at a future IPO. Our first instrument uses this regularity by using dummy
variables for the firms’ law firms in a first stage regression.

22
Coates (2001) identifies another regularity that motivates our second instrument. Some law
firms encourage their IPO clients to adopt corporate charter provisions that work at odds with one
another. For example, a firm can adopt a staggered board takeover defense and simultaneously
include a charter provision that allows shareholders to remove directors by written consent – thus
partially offsetting the effect of the staggered board. Coates (2001) argues that the number of
takeover defenses tends to be higher in firms that have such offsetting provisions. We therefore
include as an instrument an indicator variable, Law firm gaffe, that equals one if the firm has at
least one pair of takeover defenses or charter provisions that offset or contradict each other.
Our third instrument, Law firm acquisition experience, equals the number of takeovers the
IPO firm’s law firm advised in the two years before the IPO. Our rationale is that the law firm’s
acquisition-related experience can affect its knowledge and recommended use of takeover
defenses. So it is likely to meet the relevance criterion. But this experience is unlikely to be
directly related to the IPO firm’s value. Even if there were a general relation between the law
firm’s identity and the IPO firm’s valuation (i.e., our first instrument does not meet the exclusion
criterion), it is unlikely that such a relation would arise from the law firm’s recent experience in
the acquisitions market. This is particularly likely because we measure acquisition experience
over the previous two years, whereas many IPO firms acquire their law firms more than two years
before their IPOs.
The first stage results, reported as Model 1 in Table 6, show that all three instruments meet
the relevance criterion for a good instrument. Law firm gaffe is positively related to the number
of takeover defenses, Law firm acquisition experience is negatively related to the number of
defenses, and many of the individual law firm dummy variables also are significant in the first
stage regression. (The F-statistic on the joint significance of the law firm indicator variables is 2.2
x 105.) Again, a firm’s lawyers typically are chosen long before the firm goes public, so it is
unlikely that the IPO valuation is directly related to these instruments. This implies that the
instruments also meet the exclusion restriction.
23
Model 2 in Table 6 reports the results of the second stage regression for IPO firm value
when the law firm indicator variables are used to construct the instrument. The coefficient on the
instrument for the number of takeover defenses is 0.148 and is significant at the 1% level. This
result implies that takeover defenses are not just correlated with higher IPO firm value, but are
also a cause of the enhanced value.
The Internet Appendix reports the results of several tests in which we use only one or two
of the three law firm-related instruments. The findings are similar to those in Table 6, and
indicate that all three of these instruments yield similar results. Models 3 and 4 of Table 6 also
reports the results of a test in which we use a California firm location indicator as an alternative
instrumental variable. This variable is motivated by Coates’ (2001) finding that Silicon Valley
firms are less likely to adopt takeover defenses (see also Tian 2011). The results using this
alternative instrument also support the inference that takeover defenses are associated with higher
IPO firm values.
The results in Table 5 indicate that the positive relation between IPO firm valuation and the
number of takeover defenses occurs particularly among firms that have business relationships
with large customers, large suppliers, or strategic partners. Models 5 and 6 of Table 6 report the
second stages of tests that examine this relation using instrumental variables. For Model 5, we
estimate two first-stage regressions to construct two instruments, one for the number of takeover
defenses and the other for the interaction of the number of takeover defenses with the presence of
a large customer. For Model 6, we consider that the number of takeover defenses and the
presence of appropriable quasi-rents both may be endogenous. Johnson, Kang, and Yi (2010)
show that a useful instrument for having a large customer is an indicator variable that is set equal
to one if the firm is in an industry with above the median number of firms having a large
customer (excluding the large customer itself). We use this indicator variable to construct an
instrument for the presence of appropriable quasi-rents among the firm’s customers. We then
estimate three first-stage regressions (one for the number of takeover defenses, one for the

24
presence of a large customer, and one for the interaction). Model 6 reports on the second stage
regression results.
In both Models 3 and 4, the coefficient on the interaction term is positive and statistically
significant at the 10% level. That is, when IPO firms have an important large customer, their
deployment of takeover defenses tends to increase their valuation at the time of the IPO.
IV.C. IPO firm operating performance
IV.C.1. Univariate comparisons
If the conventional agency cost view of takeover defenses is correct, then IPO firms that
adopt takeover defenses should experience poorer operating performance after they go public.
This is because the defenses presumably entrench managers who run the firm inefficiently or
consume large private benefits. Field and Karpoff (2002) examined this issue and found that,
contrary to expectations, IPO firms with takeover defenses subsequently had better long term
operating performance than IPO firms without defenses. They acknowledged that this result is
inconsistent with the conventional view of takeover defenses, but otherwise left the result
unexplained.
The bonding hypothesis provides an explanation for this result because it implies that
takeover defenses improve firm value by bonding the firm’s commitments to its counterparties.
The higher valuations documented in Tables 4 – 6 plausibly should manifest as superior operating
performance after the IPO. As the LMI-Boeing example cited earlier illustrates, both Boeing (the
customer) and LMI (the IPO firm) earn quasi-rents from the trading relationship. Higher quasi-
rents at the IPO firm typically will appear as a higher level of measured operating performance
because the value of the quasi-rent is not reflected in the book value of assets. Thus, the bonding
hypothesis implies that IPO firms that have significant trading relationships and deploy takeover
defenses will earn higher (measured) operating profits than other IPO firms.
Table 7 reports on univariate difference-in-difference tests of the bonding hypothesis.
Following Kaplan (1989), Jain and Kini (1994), Field and Karpoff (2002), and others, we

25
measure the change in each IPO firm’s ROA from the year of the IPO to the following year,
adjusted for the contemporaneous change in ROA for the IPO firm’s control firm. (Our results are
qualitatively similar using ROA changes of up to four years after the IPO.) As before, we
partition the sample into three groups: firms with fewer than 3 takeover defenses (N=384), those
with exactly 3 takeover defenses (N=371), and those with more than 3 takeover defenses (N=464).
Again, we use the FK-index in the results reported in the tables, but the results are similar using
the G-index and E-index (reported in the Internet Appendix).
In the overall sample, the adjusted change in ROA is –.0326 for IPO firms with fewer than
three defenses and .0076 for firms with more than three defenses. The difference is significant at
the 10% level. This difference, however, is driven by the subset of IPO firms for which Large
customer = 1. In this subgroup, the mean adjusted ROA is –.0504 for IPO firms with fewer than
three defenses and .0053 for firms with more than three defenses, a difference that is significant at
the 5% level. The difference is not significant among firms that do not have a large customer.
Although Table 7 reports on a partition using Large customer as the measure of appropriable
quasi-rents, the results are similar using Large supplier or Strategic alliance. This result suggests
that the general pattern in operating performance observed by Field and Karpoff (2002) is
attributable to the subgroup of firms with major trading relationships.
IV.C.2. Multivariate tests
Table 8 reports on multivariate tests of the relation between operating performance and the
use of takeover defenses. The tests include the same control variables as in Table 5, but the
control variable results are suppressed in the table. The adjusted change in ROA is positively
related to the FK-index and the E-index, although the coefficient on the G-index in Model 2 is not
significant. Models 4 – 6 report results when we include interactions with measures of the
counterparties’ appropriable quasi-rents. In each regression the interaction term is positive and
statistically significant. This indicates that takeover defenses are associated with operating

26
performance improvements when the IPO firm has a counterparty that plausibly has a large
appropriable quasi-rent. Note that the presence of appropriable quasi-rents by itself is negatively
associated with changes in ROA: the coefficient on Large customer in Model 4, for example, is
–0.044 and is significant at the 5% level. Combined with the point estimate of 0.010 for the
interaction term, this implies that the adjusted change in ROA among firms with large customers
is negative, on average, when the firm has four or fewer takeover defenses, and is positive for
firms with five or more defenses. These results indicate that the IPO firms’ change in ROA does
not increase with the presence of a large customer, large supplier, or strategic partner per se.
Rather, ROA is higher when the trading relationship with the important counterparty is protected
by takeover defenses.
As with our valuation tests, we estimated instrumental variable models to examine whether
the results in Models 1 – 6 are affected by endogeneity issues. Model 7 in Table 8 reports on the
first stage regression using the three law firm-related instruments first examined in Table 6, and
Model 8 reports the second stage results. The coefficient on the instrumented number of takeover
defenses is positive and significant at the 10% level. This result is consistent with the view that
takeover defenses contribute to operating performance improvements. In general, however, the
instrumental variable tests for operating performance are not robust. If we include year fixed
effects, the coefficient on the instrumented number of takeover defenses becomes insignificant.
Others have noted similar effects of year fixed effects in instrumental variables tests, and suggest
that annual dummy variables introduce severe multicollinearity issues in two-stage tests that limit
the test’s power (e.g., see Cliff and Denis 2004).
IV.D. Impacts of takeover defenses on the IPO firms’ large customers
IV.D.1. Univariate comparisons
If takeover defenses help to bond the IPO firm’s commitments to its trading partners and
protect their quasi-rents, the defenses should have value consequences for the partners. In this
27
section we examine the spillover effect on the IPO firm’s large customers, using data on the 209
large customers which themselves are publicly traded.
Table 9 reports the cumulated abnormal return over the seven-day period centered on the
IPO firm’s prospectus filing date for the IPO firms’ large customers. The prospectus filing date is
when the IPO firm’s use of takeover defenses is revealed to the investing public. CAR(-3, 3) is
calculated using parameters estimated from the market model over days -255 to -46 relative to the
filing date with the equally weighted CRSP index as the market proxy.12 Measured over all 209
firms, the mean CAR(-3, 3) is 1.17%. This is similar to the finding by Johnson, Kang, and Yi
(2010).
Table 9 also reports the mean CAR(-3,3) when the sample is partitioned into groups based
on the number of defenses at the IPO firm. When the IPO firm has fewer than three defenses, the
mean return for large customers is –0.75%. When the IPO firm has more than three defenses the
mean return for large customers is 4.66%. The difference is statistically significant implying that
the positive spillover effect on large customers’ values is positively related to the IPO firm’s
adoption of takeover defenses.
IV.D.2. Multivariate comparisons
Table 10 reports the results of multivariate tests of the relation between the spillover effect
and the IPO firm’s takeover defenses. All regressions include the following control variables:
customer market capitalization; customer leverage; an indicator for the customer having a credit
rating as reported in COMPUSTAT; the underwriter rank of the IPO offering; the size of the IPO
firm; the IPO firm leverage. The control variable results are not reported in the table. Models 1 –
3 show that CAR(-3,3) for the IPO firm’s large customer is positively related to the number of
12 We use a CAR(-3, 3) abnormal return because Johnson, Kang, and Yi (2010) report that there is substantial pre- and post-prospectus filing stock price drift. Our results are qualitatively similar using CAR(-1, 1). We also repeated our analysis using industry adjusted returns from Ken French’s web site (http://mba.tuck.dartmouth.edu/pages/faculty/ken.french/data_library.html) The results are similar to those reported here.

28
takeover defenses at the IPO firm, although the coefficient for the G-index in Model 2 is not
significant.
Models 4 – 8 include interactions with five measures of the potential value of a takeover
defense in bonding the IPO firm’s commitment to its large customer. In Model 4, CAR(–3,3) is
positively related to the use of takeover defenses, negatively related to the presence of a social
link between the CEOs of the IPO and its large customer firms, and positively related to the
interaction of the two. This indicates that the spillover effect is negative when there is a strong
social connection and the IPO firm does not use takeover defenses, presumably because a
valuable trading relationship is at risk. The use of takeover defense partially or fully offsets this
bad news, depending on how many defenses are deployed.
Similar results obtain in Models 5 – 8, when we use Long-term contract, Long pre-IPO
relationship length, High % of IPO firm sales, and Strategic alliance with large customer as our
measures of the potential importance of the IPO firm’s takeover defenses. (The results are similar
using Percent of IPO firm sales in place of the dummy variable, High % of IPO firm sales.)
Together, these results indicate that the IPO firm is not the only one to benefit from its takeover
defenses. Its large customers also benefit, and they benefit particularly when the takeover
defenses protect a valuable trading relationship between the IPO firm and its large customer. By
making explicit and implicit contracts more secure, thus protecting the IPO firms’ large
customers’ quasi-rents, the defenses have positive spillover effects on the large customers.
IV.D.3. IPO effect vs. industry-wide shock
An alternate interpretation of the results in Tables 9 and 10 is that the apparent spillover
effect is spurious. For example, suppose the IPO is timed to exploit a simultaneous increase in
demand for the large customer’s products and that, for some unobserved reason, the number of
takeover defenses increases with the size of the demand shock. This could account for the finding
that there is a positive spillover effect on the IPO firms’ large customers that increases with the

29
number of takeover defenses at the IPO firm. To test this possibility we examine spillover effects
on other firms with the same CRSP 4-digit SIC code as the IPO firm’s large customer. The
bonding hypothesis implies that the spillover effects should be specific to the large customer,
whereas the industry-wide shock story implies that spillover effects also will be observed among
other firms in the same industry.
We calculate the market model abnormal returns of portfolios of competitors of each IPO
customer. There are N=192 IPO customer competitor portfolios with sufficient data to calculate
abnormal returns using a market model. The customer competitor CAR(-1, 1) is 0.01% and
CAR(-3, 3) is 0.78%, both of which are statistically insignificant. There is no relation between the
industry portfolio returns and the number of takeover defenses at the IPO firm. These results
indicate that the takeover defenses at the IPO firm positively impact the firms that have a direct
trading relationship with the IPO firm, but not firms in the same industry with no trading
relationship. That is, we are not observing a general industry spillover, but rather, the impact of
the IPO on firms with an actual trading relationship with the IPO firm.
IV.E. The impact of takeover defenses on the length of the post-IPO relationship
The bonding hypothesis implies that takeover defenses help to guarantee the IPO firm’s
contractual performance with its counterparties, i.e., that the IPO firm will not act
opportunistically to abrogate the relationship. This implies that the use of defenses should
correspond to business relationships that do, in fact, persist over time. To examine this
implication, we examine the association between the deployment of takeover defenses and the
longevity of the business relationship. We use data from the 209 instances in which the IPO firm
has a large customer that is itself a publicly traded firm.
Table 11 reports on the univariate comparisons. On average, the business relationship
survives 2.73 years after that IPO. Among the 64 cases in which the IPO firm has fewer than
three defenses, the relationship lasts an average of 2.17 years. Among the 68 cases in which the

30
IPO firm has more than three defenses, the relationship lasts an average of 3.32 years. The
difference is significant at the 1% level. This is consistent with the notion that takeover defenses
are associated with longer business relationships.
Table 12 reports the results of several specifications of a non-parametric Cox hazard model
where the dependent variable is post-IPO length of the relationship, measured in years.
Coefficients above one indicate a higher hazard rate and shorter relationship, whereas coefficients
below one indicate a lower hazard rate and longer relationship. As control variables, we use the
same variables used by Fee, Hadlock, and Thomas (2006) and Johnson, Kang, Masulis, and Yi
(2011), including: R&D/assets, IPO firm percent of sales to the large customer, the square of the
IPO firm’s percent of sales to the large customer, log (IPO firm assets), and an indicator for
negative free cash flows. We omit the strategic alliance control in models 1-7, although there is
no substantive change in results adding this control to the regressions.
In all models estimated, the length of the business relationship is positively related to the
number of takeover defenses. For example, in Model 1 the coefficient on the number of takeover
defenses is 0.797 and is significantly different from one at the 1% level. Models 2 – 6 include
interaction terms that reflect the importance of a takeover defense in protecting appropriable
quasi-rents. In Model 2, the longevity of the relationship is positively related to the number of
takeover defenses, the presence of a social link between the IPO firm and large customer’s CEOs,
and also to the interaction of the two terms. This implies that the marginal effect of a takeover
defense is larger when there is a social link between the CEOs. The results in Model 6 indicate
that strategic alliances endure longer, on average, when the IPO firm has takeover defenses. The
coefficients for interaction terms in Models 3 through 5 are insignificant, but even in these
models the relationship length is positively related to use of takeover defenses.
Models 7-8 report on an instrumental variables test that attempts to account for the possible
endogeneity of relationship length and the use of takeover defenses. Model 7 uses our law firm-
related instruments to model the number of takeover defenses. Model 8 reports the second stage

31
results. Here, the dependent variable is the termination rate. (We use a linear model here to
avoid biases associated with the use of a non-linear model in the second stage of an instrumental
variables test.) The negative coefficient for the instrumented number of takeover defenses
indicates that the use of takeover defenses is associated with a lower termination rate, or a longer
duration of the business relationship.
These results indicate that takeover defenses are associated with longevity of the business
relationship with the IPO firm’s large customer. This is consistent with the implication of the
bonding hypothesis that takeover defenses do, in fact, credibly commit the IPO firm to
maintaining its important business relationships. In addition, takeover defenses are particularly
useful in bonding and preserving the business relationship when the IPO firm’s CEO has a social
connection to the large customer’s CEO or when the two firms have entered a strategic alliance.
V. Additional tests of the bonding hypothesis
V.A. Supplementary tests and evidence
V.A.1. Spillovers upon IPO firm acquisition
If the bonding hypothesis is correct, we should observe a spillover effect on the IPO firm’s
counterparties if the IPO firm opportunistically takes action to abrogate the business relationship.
Furthermore, the spillover effect should be larger when the IPO firm previously bonded its
commitment to the business relationship by adopting takeover defenses. We do not have direct
indications of opportunism by the IPO firms, but an indirect indicator is whether an IPO firm
subsequently is acquired. It is plausible that, at least in some acquisitions, the commitments to the
firm’s counterparties were abrogated.
In our sample, there are 43 IPO firms with large public customers that were acquired
within three years of the IPO. Ten of these firms had fewer than three takeover defenses. The
mean CAR (-1, 1) is –0.37% for the large customers of these IPO firms. Fifteen of these firms
had more than three takeover defenses, and the mean CAR (-1, 1) is –1.41% for the large

32
customers of these firms. The difference between these two abnormal returns is statistically
significant at the 10% level (t-statistic = –1.88). These results are consistent with the bonding
hypothesis of takeover defenses, because they indicate that the negative spillover effects are
largest where the IPO firm previously had made a significant commitment (via the use of
takeover defenses) not to change the business relationship with its large customer.
We also investigate whether the business relationship is affected when the IPO firm is
acquired. For the 43 IPO firms with large customers that were acquired within three years of the
IPO, the business relationship with their large customers lasts 2.6 years. For the 176 IPO firms
that were not acquired, the average duration of the business relationship is 3.2 years. The t-
statistic for the difference in means is 1.81. This finding is consistent with the proposition that
takeovers are, in fact, associated with a shortening of the IPO firm’s business relationships.
V.A.2. Takeover defenses and forced CEO turnover
The bonding hypothesis – as well as the agency cost view of takeover defenses – implies
that takeover defenses deter unsolicited takeover bids and help managers to keep their jobs. We
follow the Parrino, Sias, and Starks (2003) method to classify forced CEO turnover. Of the 1,219
IPO firms in our sample, there are 32 instances of forced CEO turnover within three years of the
IPO. Firms with forced CEO turnover have fewer takeover defenses than firms without forced
turnover (2.66 versus 3.17), a difference that is statistically significant at the 5% level (t-statistic
= 2.06). We also find that the rate of forced turnover rate declines with the use of takeover
defenses. Among firms with fewer than three defenses (using the F-K index), 3.65% have a
forced CEO turnover. For firms with three defenses, the rate of forced turnover if 2.43%, and for
firms with more than three defenses, the rate of forced turnover is 1.94%. These results are
consistent with the notion that takeover defenses do in fact help top managers keep their jobs.

33
V.A.3. Changes in percent of sales and R&D investment
The bonding hypothesis implies that firms adopting more takeover defenses will have
stronger relationships with their large customers in the future. One measure of the relationship’s
durability is how the percent of sales made to the large customer changes over time. In the year
after the IPO, IPO firms with fewer than three defenses have a decline in the percent of sales to
their large customer of 8.3%. IPO firms with more than three defenses have a much smaller
decline in the percent of sales to their large customer of 1.5%. This difference, however, is not
statistically significant (t-statistic = 1.32).
The bonding hypothesis also implies that IPO firms adopting takeover defenses will
themselves invest more highly in relationship-specific assets. To measure relationship-specific
investment, we use the IPO firm’s investment in R&D/assets. Firms with fewer than three
defenses have a decline in R&D/assets of 12.3% in the year after the IPO. Firms with more than
three takeover defenses, in contrast, have a smaller decline in R&D/assets of 4.2%. The
difference is statistically significant at the 1% level. These results provide additional support for
the hypothesis that takeover defenses encourage long-term investment in important business
relationships.
V.B. Alternate specifications and robustness tests
V.B.1. Classified boards
Daines and Klausner (2001) and Bebchuk, Coates, and Subramanian (2002) argue that
staggered boards and dual-class shares are much more important than other types of takeover
defenses. An extreme view is that these are the only defenses that matter, in which case the Field-
Karpoff index, G-index, and E-index of takeover defenses are extremely noisy measures of a
firm’s takeover defenses. To examine this issue we repeat many of our tests replacing the index
of takeover defenses with a dummy variable that indicates the presence or absence of a classified

34
board. (Dual class shares are uncommon in our sample, and the results are not affected if we
include them.)
The results, which are tabulated in the Internet Appendix, are similar to those reported in
our main tests, although some p-values are larger. For example, 65.6% of IPO firms with large
customers adopt classified boards, compared to 60.6% of IPO firms without a large customer (the
difference is significant at the 10% level); 68.9% of IPO firms with strategic alliances adopt
classified boards, compared to 61.4% of IPO firms without large customers (the difference is
significant at the 5% level). IPO firms with classified boards have an average relative valuation of
23.25 where IPO firms without classified boards have a valuation of 10.39, a difference that is
significant at the 5% level. In multivariate tests measuring IPO valuation, the coefficient on the
classified board indicator is positive and significant at the 1% level. These results indicate support
for the bonding hypothesis even if we measure a firm’s takeover defenses only by the presence of
a classified board.
V.B.2. Additional quasi-rent measures
Large customers, large suppliers, and strategic partners are not the only counterparties
with potentially appropriable quasi-rents that can be protected by takeover defenses. In the
Internet Appendix we report the results of tests that use four alternate measures of the existence
of appropriable quasi-rents: (i) overfunded pension assets, (ii) low employee turnover, (iii) high
selling, general, and administrative expenses, and (iv) high trademark intensity. The first of these
is prompted by Pontiff, Shleifer, and Weisbach’s (1990) observation that acquirers of firms with
overfunded pensions have incentive to distribute the excess assets to themselves. The second and
third measures are suggested by Titman and Wessels (1988). They argue that employees in
industries with low employee turnover tend to have greater job-specific skills, creating quasi-
rents that can be appropriated. They also argue that firms with high selling, general, and
administrative expenses have unique and differentiated products. As such, these products would

35
be difficult to replace with a new supplier, potentially imposing costs on the firm’s customers.
Firms in industries with many trademarks provide differentiated products. Employees and
suppliers of firms selling unique products are likely to have job-specific skills and capital, and
their customers may find it difficult to find alternative servicing for their differentiated products.
Thus, the degree of product differentiation as measured by high trademark industry can reflect the
size of appropriable quasi-rents.
A priori, we would expect these alternative measures to be quite noisy. For example, a
high SGA expense could reflect administrative inefficiencies and not the uniqueness of the firm’s
product. Nonetheless, and as reported in the Internet Appendix, most of the results using these
alternative measures are similar to the results reported in the main body of the paper.
Finally, we constructed “multiple quasi-rent” measures. These are indicators for the
simultaneous presence of at least two among our three primary indicators of the existence of
quasi-rents: large customers, large suppliers, and strategic alliances at the IPO firm. In general,
the results for firms with multiple quasi-rents are even stronger than those reported in our main
tests. This is consistent with the notion that the value of a takeover defense increases with the size
of the quasi-rents that are at stake.
V.B.3. Venture capital, public float, and acquisition risk
Many of our findings are stronger in the subset of IPO firms that are backed by venture
capital investors. For example, the empirical measures of the relation between firm value and the
use of takeover defenses that are reported in Table 5 are generally more significant in venture-
backed firms than in non-venture backed firms. One interpretation of this result is that venture-
backed firms are more likely to deploy takeover defenses optimally, presumably because they can
take advantage of the expertise of their venture capital investors. These additional tests are
tabulated in the Internet Appendix.

36
For many firms, the public float of shares remains small after the IPO (e.g., see Field and
Hanka (2001)). For such firms the risk of outside takeover, and the benefits of a takeover defense,
may be relatively small. Including the public float as an additional control variable, however, or
focusing only on firms with a large float at the time of the IPO, has no qualitative effect on our
results. (These tests are summarized in the Internet Appendix.) We infer that takeover defenses
help to bond the IPO firm’s relationships with important business partners even when the public
float is relatively small. It is possible that the IPO is merely a first step in the public float of
shares, and that the future risk of takeover increases substantially even when the public float
initially is relatively small.
V.C. Alternate explanations
V.C.1. Takeovers and toeholds by the IPO firm’s large customer
The IPO firm may adopt takeover defenses not to bond its commitments with important
counterparties, but rather, because IPO managers seek protection against an unsolicited bid from
the firm’s large customer. This conjecture is consistent with our finding that IPO firms tend to
adopt more defenses when they have large customers. One problem with this conjecture,
however, is that it does not explain our other findings, including the positive relation between the
use of takeover defenses and firm value and operations when there is an important counterparty.
Furthermore, we find no evidence that an IPO firm’s large customer is, in fact, a likely acquirer.
Of the 43 IPO firms in our sample that were acquired within three years of the IPO, none were
acquired by its large customer.
Alternatively, the IPO firm’s large customer may own an equity stake in the firm, thus
mitigating the threat of takeover by unrelated firms and decreasing the benefit of any takeover
defenses. In our sample, large customers own equity shares of 2% or larger in 49 of our sample
firms. To examine whether such toeholds affect our results, we replicated our tests after
37
eliminating these 49 firms. The results are qualitatively the same as the tests reported in the paper,
and are tabulated in the Internet Appendix.
V.C.2. Anticipation and supply chain spillovers
Another possibility is that takeover defenses signal that the IPO firm is likely to be acquired
with a takeover premium. This could explain our finding that IPO firm value is positively related
to the use of takeover defenses. This conjecture also could explain our finding that IPO firms’
large customers have positive share price reactions when the IPO firm has a large number of
defenses. As Ahern and Harford (2012) report, an increased likelihood of takeover could signal
increases in the acquisition likelihoods at the IPO firm’s suppliers and customers.
While this anticipation hypothesis is consistent with these two findings, it does not explain
the full complement of our empirical results. For example, it does not explain why takeover
defenses are particularly common when the IPO firm has counterparties with large quasi-rents at
stake. It also does not explain our results regarding operating performance or the duration of the
IPO firm’s business relationships with important customers.
We nonetheless test one variation of the anticipation story, which is that the IPO firm’s use
of takeover defenses reveals that the firm is in an industry in which acquisitions are likely. This
implies that the IPO firm’s use defenses reveals that acquisition likelihoods for all firms in the
same industry are higher than previously believed. We examined this conjecture by measuring
the effect of the IPO announcement on the values of other firms in the same industry. The results,
which are reported in the Internet Appendix, show that the mean three-day announcement period
abnormal return for other firms in the industry is not significantly different from zero. Nor is it
significantly related to the number of takeover defenses deployed by the IPO firm. These results
are inconsistent with the conjecture that takeover defenses at the IPO firm signal that the firm is
in an acquisitive industry.

38
V.C.3. Bargaining power
Another conjecture is that our results reflect the view that takeover defenses increase
managers’ bargaining power in the event of a takeover bid, as proposed by DeAngelo and Rice
(1983). Kadyrzhanova and Rhodes-Kropf (2010) argue that bargaining enhancements, such as
takeover defenses, are particularly valuable when more value is at stake, and they use industry
concentration to proxy for the importance of bargaining power. It is possible that the presence of
a large customer, supplier, or strategic partner indicates that the IPO firm has a high value that
makes increased bargaining power more important. This conjecture could explain our findings
that takeover defenses are more common when the IPO firm has an important counterparty, and
that defenses are positively related to the IPO firm’s valuation.13
Cremers, Nair, and Peyer (2007) find that takeover defenses are more common in
competitive than concentrated industries, a result that is inconsistent with the argument that they
will be used for increased bargaining in concentrated industries. Field and Karpoff (2002) find no
relation between takeover premiums and the use of takeover defenses in their sample of IPO
firms, a result that is inconsistent with the bargaining power hypothesis for IPO firms in general.
Nonetheless, we investigate the bargaining power hypothesis with two tests. First, we include a
measure of industry concentration, the Herfindahl index, as an additional control variable in all of
our primary tests. In some specifications the use of takeover defenses is more common in
competitive industries, similar to the findings by Cremers et al. (2007). In none of the tests,
however, does the inclusion of the Herfindahl index have a noticeable impact on our main
findings. These results are tabulated in the Internet Appendix.
In a second test, we examine whether there is any direct evidence that takeover defenses at
IPO firms are associated with higher takeover premiums for the 43 IPO firms with large
13 Although, as with the other alternate explanations we have considered, it is difficult to explain the full complement of our results with the bargaining power hypothesis. In particular, the bargaining power conjecture does not explain our findings regarding IPO firm operating performance, spillover effects on the IPO firm’s important counterparty, or the duration of the trading relationship.

39
customers that were acquired within three years of their IPOs. As tabulated in the Internet
Appendix, we consistently find that takeover premiums are not significantly related to an IPO
firm’s use of takeover defenses. In the majority of specifications the point estimates of the
relation are negative. These results are inconsistent with a bargaining power interpretation of our
results.
VI. The IPO takeover defense puzzle
The fact that IPO firms have takeover defenses runs counter to our profession’s views of
IPO firms, takeover defenses, or both. We typically view IPO firms as adopting the value-
maximizing mix of governance and operating characteristics because the pre-IPO firm principals
internalize most of this value. And we typically view takeover defenses as value-reducing
entrenchment devices. Easterbrook and Fischel (1991, pp. 204-5) reflect conventional wisdom
when they argue – erroneously – that “Firms go public in easy to acquire form: no poison pill
securities, no supermajority rules or staggered boards. Defensive measures are added later, a
sequence that reveals much.” To the contrary, 98.5% of the IPO firms in our sample from 1997-
2005 have at least one takeover defense when they go public, and the average firm has three such
defenses.
The bonding hypothesis offers a resolution to this puzzle: Takeover defenses are deployed
at the IPO stage because, contrary to common assumption, they increase firm value. The increase
in firm value does not arise from an increase in bargaining power as modeled by DeAngelo and
Rice (1983) and Stulz (1988), or because of market myopia as in Stein (1988) and Chemmanur,
Paeglis, and Simonyan (2011). Rather, defenses increase firm value because they help to protect
the IPO firm’s important business partners from opportunistic hold-up problems. This latter
claim is supported by evidence that takeover defenses are used particularly when the IPO firm has
important counterparties with appropriable quasi-rents at stake, and that defenses increase value
and operating performance only at such IPO firms.

40
Our findings are at odds with Field and Karpoff (2002)’s conclusions about takeover
defenses at IPO firms. They find that the likelihood that a firm has at least one takeover defense
is positively related to the CEO’s compensation, Board size, and Dual CEO/chair, and negatively
related to CEO age, Inside ownership, and Board independence. They infer that agency problems
at the pre-IPO stage enable managers to implement self-serving takeover defenses at the expense
of other pre-IPO shareholders, and that takeover defenses are more likely to be deployed at the
IPO stage when senior managers derive large private benefits and are subject to relatively weak
internal controls.
We do not dispute the notion that even IPO firms may face severe agency problems, and
the bonding and agency hypotheses of takeover defenses are not mutually exclusive. We find,
however, that the variables that are significantly related to the likelihood of takeover defenses in
the Field and Karpoff (2002) sample are not, in general, statistically significant in our tests. As
reported in the Internet Appendix, we replicate the Field and Karpoff (2002) results when we
omit industry fixed effects and our measures of appropriable quasi-rents. When we include these
measures, however, the agency-related variables based on board and CEO characteristics become
statistically insignificant, while the variables that reflect the importance of counterparty quasi-
rents – Large customer, Large supplier, or Strategic partner – are statistically significant.
VII. Conclusions
In this paper we propose and test an efficiency explanation for takeover defenses using data
from IPO firms. Borrowing from Knoeber (1986), Shleifer and Summers (1988), Coates (2001),
and Pontiff, Shleifer, and Weisbach (1990), we argue that takeover defenses can help to bond the
IPO firm’s explicit and implicit commitments to its stakeholders, including customers, suppliers,
and strategic partners. By insulating current managers from the threat of ouster, takeover defenses
increase the value of managers’ commitments to maintain their promised operating strategy and
not to opportunistically exploit their counterparties’ investments in the IPO firm. This bond, in

41
turn, encourages the firm’s counterparties to invest in the business relationship, yielding benefits
for the IPO firm. We call this the bonding hypothesis of takeover defenses.
We test five implications of the bonding hypothesis using data on IPO firms. The tests rely
on three measures of the importance of the quasi-rents earned by the IPO firm’s counterparties.
Such quasi-rents arise from the counterparties’ investments in the business relationship, and
would be at risk if the IPO firm abrogates its commitments. Our measures include indicators for
the presence of a large customer, large supplier, or strategic alliance. In summary, our results
indicate that:
(1) IPO firms deploy more takeover defenses when they have large customers, large
suppliers, or strategic partners;
(2) The IPO firm’s value is positively related to its use of takeover defenses, particularly
when it has large customers, large suppliers, and/or strategic partners;
(3) The IPO firm’s subsequent operating performance is positively related to its use of
takeover defenses, particularly when it has large customers, large suppliers, and/or strategic
partners.
(4) When the IPO firm announces its intention to go public, its large customers experience
an increase in share values that is positively related to the IPO firm’s use of takeover defenses;
and
(5) After the IPO, the longevity of the IPO firm’s business relationship with its large
customer is positively related to its use of takeover defenses.
We conduct several additional tests that complement these results. These tests indicate that
IPO firms are more likely to deploy takeover defenses particularly when their bonding value is
high. The results are not sensitive to how takeover defenses are counted, as we examine three
different indices of takeover defenses, and are not substantially affected even when we arbitrarily
omit particular defenses (e.g., staggered boards) from these indices. The results also persist when,
as reported in the Internet Appendix, we use alternate measures of the IPO firm’s counterparties’

42
appropriable quasi-rents. Several supplementary tests also are consistent with the bonding
hypothesis and are inconsistent with alternate explanations for our findings, as reported in Section
V.
At first glance, these results are surprising because they run counter to our profession’s
view – and our own prior view – of takeover defenses. Upon reflection, however, the bonding
hypothesis and its empirical support are consistent with a broader view of the contracting problem
discussed by Akerlof (1970), Klein, Crawford, and Alchian (1978), Williamson (1979),
Grossman and Hart (1986), and others. Explicit contracts are costly to specify and enforce,
creating the potential for opportunism by both buyers and sellers in most trading relationships.
Coase (1960) argues that market transactions and contracts tend to arise when the costs of
executing such contracts is less than the gain from trade. Viewed this way, takeover defenses help
to economize on the cost of building and maintaining value-increasing trading relationships
between the IPO firm and its counterparties. Our results do not address whether takeover defenses
entrench managers and decrease firm value at seasoned firms where agency problems are more
severe. At IPO firms, however, the evidence supports the view that takeover defenses increase
value because they facilitate the development of value-increasing business relationships with
customers, suppliers, and strategic partners.

43
References
Akerlof, George A., 1970, The market for lemons: Quality uncertainty and the market mechanism, Quarterly Journal of Economics 84, 488–500.
Agrawal, A, and C. Knoeber, 1998, Managerial compensation and the threat of takeover, Journal
of Financial Economics 47, 219-239. Arlen, Jennifer, 2006, Regulating post-bid embedded defenses: Lessons from Oracle and
PeopleSoft, Harvard Negotiation Law Review. Bebchuk, Lucian A., John C. Coates and Guhan Subramanian, 2002, The powerful antitakeover
force of staggered boards: further findings and a reply to symposium participants, Stanford Law Review 55, 885-917.
Bebchuk, Lucian A., Alma Cohen, and Allen Ferrell, 2009, What matters in corporate governance?
Review of Financial Studies 22, 738-827. Boone, A., L. Field, J. Karpoff, and C. Raheja, 2007, The determinants of corporate board size
and composition: An empirical analysis, Journal of Financial Economics 85, 67-101. Cen, Ling, S. Dasgupta, and R. Sen, 2012, Discipline or disruption? Stakeholder relationships and
the effect of takeover threat, University of Toronto Working Paper. Chan, S. H., J. Kensinger, A. Keown, and J. Martin, 1997, Do strategic alliances create value?,
Journal of Financial Economics 46, 199-221. Chemmanur, T.J. and Y. Jiao, 2012, Dual class IPOs: A theoretical analysis, Journal of Banking
and Finance 36, 305-319. Chemmanur, T.J. and I. Paeglis, and K. Simonyan, 2011, Management quality and anti-takeover
provisions, Forthcoming, Journal of Law and Economics. Chemmanur, T.J. and E. Loutskina, 2006, The role of venture capital backing in initial public
offerings: Certification, screening, or market power, Boston College Working Paper. Coase, R. H., 1960, The Problem of Social Cost, Journal of Law and Economics 3, 1-44. Coates, J., 2001, Explaining variation in takeover defenses: Blame the lawyers, California Law
Review 89, 1301-1422. Coates, J., and Kraakman, R., 2011, The link between the acquisitions market and the market for
CEOs, Harvard Law School working paper. Cremers, K., J. M., V. B. Nair, and U. Peyer, 2006, Weak shareholder rights: a product market
rationale, Yale Working paper. Cremers, K., J. M., V. B. Nair, and U. Peyer, 2008, Takeover defenses and competition, Journal
of Empirical Legal Studies 5, 791-818.

44
Daines, Robert and Michael Klausner, 2001, Do IPO Charters Maximize Firm Value? Antitakeover Protection in IPOs, Journal of Law, Economics, and Organization 17, 83-120.
DeAngelo, Harry and Edward M. Rice, 1983, Antitakeover charter amendments and shareholders
wealth, Journal of Financial Economics 11, 329-60. Degeorge, F., and R. Zeckhauser, 1993, The reverse LBO decision and firm performance: Theory
and evidence, Journal of Finance 48, 1323-1348. Easterbrook, Frank H., and Daniel R. Fischel, 1991, The economic structure of corporate law,
Harvard University Press (Cambridge, MA). Fee, C. E., C. Hadlock, and S. Thomas, 2006, Corporate equity ownership and the governance of
product market relationships, Journal of Finance 61, 1217-1251. Fee, C. E., S. Thomas, 2004, Sources of gains in horizontal takeovers: Evidence from customer,
supplier, and rival firms, Journal of Financial Economics 74, 423-460. Felli, L., and K. Roberts, 2002, Does competition solve the hold-up problem? London School of
Economics working paper. Field, L.S. and G. Hanka, 2001, The expiration of IPO share lockups, Journal of Finance 56, 101-
117. Field, L.S. and J. M. Karpoff, 2002, Takeover defenses of IPO firms, Journal of Finance 57,
1857-1889. Gillan, S. L., Hartzell, J. C., and R. Parrino, 2009, Explicit vs. implicit contracts: Evidence from
CEO employment agreements, Journal of Finance 64, 1629-1655. Gompers, Paul, Joy Ishii, and Andrew Metrick, 2003, Corporate governance and equity prices,
Quarterly Journal of Economics 118, 107-155. Grossman, S. J., and O. D. Hart, 1986, The cost and benefits of ownership: A theory of vertical
and lateral integration, Journal of Political Economy 4, 691-719. Hannes, Sharon, 2006, A Demand-Side Theory of Antitakeover Defenses, Journal of Legal
Studies 35(2), 475-524. Hart, O. D., and J. Moore, 1990, Property rights and the nature of the firm, Journal of Political
Economy 98, 1119-1158. Hertzel, M., Li, Z., Officer, M. and Rodgers, K., 2008, Inter-firm linkages and the wealth effects
of financial distress along the supply chain, Journal of Financial Economics 87, 374-387. Hwang, B. and S. Kim, 2009, It pays to have friends, Journal of Financial Economics 93, 138-158. Jain, B., and O. Kini, 1994, The post-issue operating performance of IPO firms, Journal of
Finance 49, 1699-1726.

45
Johnson, W. C., J. Kang, and S.Yi, 2010, The certification role of large customers in the new issues market, Financial Management 39, 1425-1474.
Johnson, W. C., J. Kang, Masulis, R. W., and S.Yi, 2011, Supply-chain spillover effects and the
interdependence of firm financing decisions, Working paper, University of New South Wales. Joskow, P. L., 1987, Contract duration and relationship-specific investments: Empirical evidence
from coal markets, The American Economic Review 77, 168-185.. Kaplan, S., 1989, The effect of management buyouts on operating performance and value,
Journal of Financial Economics 24, 217-254. Karpoff, J. and J. R. Lott, 1993, The reputational penalty firms bear for committing criminal
fraud, Journal of Law and Economics 36, 757-802. Klausner, Michael D., 2003, Institutional Shareholders, Private Equity, and Antitakeover
Protection at the IPO Stage. University of Pennsylvania Law Review, Vol. 152. Klein, B., Crawford, R. G., Alchian, A. A., 1978. Vertical integration, appropriable rents, and the
competitive contracting process. Journal of Law and Economics 21, 297-326. Klein, B. and K. B. Leffler, 1981, The role of market forces in assuring contractual performance,
Journal of Political Economy 89, 615-641. Klein, B., 1988, Vertical integration as organizational ownership: The Fisher Body - General
Motors relationship revisited, The Journal of Law, Economics and Organization 4, 199-213. Knoeber, Charles R., 1986, Golden parachutes, shark repellents, and hostile tender
offers, American Economic Review 76, 155-167. Lipton, Martin, 2002, Pills, polls, and professors redux, The University of Chicago Law Review
69: 1037. Masulis, R.W., C. Wang, and F. Xie, 2007, Corporate Governance and Acquirer Returns, The
Journal of Finance 62 (4), 1851–1889. Ohlson, J., 1990, A synthesis of security valuation theory and the role of dividends, cash flows,
and earnings, Contemporary Accounting Review 6, 648-676. Pontiff, J., A. Shleifer, and M. S. Weisbach, 1990, Reversions of excess pension assets after
takeovers, Rand Journal of Economics 21, 600-613. Posner, R. A., 1975, The social costs of monopoly regulation, Journal of Political Economy 83,
807-827. Shleifer, A. and L. Summers, 1988, Breach of Trust in Hostile Takeovers, in A.J. Auerbach (ed.),.
Corporate Takeovers: Causes and Consequences (University of Chicago Press, Chicago). Smart, Scott B., Ramabhadran S. Thirumalai, and Chad J. Zutter, 2008, What's in a vote? The
short- and long-run impact of dual-class equity on IPO firm values, Journal of Accounting and Economics 45, 94-115.

46
Smith, Erin, 2013, Do shareholders want less governance? New York University working paper. Stein, J., 1988, Takeover threats and managerial myopia, Journal of Political Economy 96, 61-80. Stout, L., 2002, Do antitakeover defenses decrease shareholder wealth? The ex post / ex ante
valuation problem, Stanford Law Review 55, 845-861. Stulz, R., 1988, Managerial control and voting rights: Financial policies and the market for
corporate control, Journal of Financial Economics 20, 25-54. Tian, Xuan, 2011, The causes and consequences of venture capital stage financing, Journal of
Financial Economics 101, 132-159. Titman, S. and R. Wessels, 1988, The determinants of capital structure choice, Journal of Finance
43, 1-19. Williamson, O. E., 1979, Transaction cost economics: The governance of contractual relations,
Journal of Law and Economics 22, 233-261. Williamson, O. E., 1985, The economic institutions of capitalism (The Free Press, N.Y.). Wooldridge, Jeffrey M., 2002, Econometric analysis of cross section and panel data (MIT Press,
Cambridge, Massachusetts).

47
Appendix: Takeover defense indices
We use three indices of takeover defenses, or antitakeover provisions. Each index is a
count of the number of specified defenses the firm has at the time of its IPO. See the original
sources for definitions of each defense listed.
The FK-index from Field and Karpoff (2002) includes the following ten defenses:
Table A.1. Takeover defenses in the FK-index
1. Antigreenmail provision 2. Blank check preferred stock 3. Classified board 4. Fair price provision 5. Poison pill 6. Stakeholder clause 7. Shareholder meeting restrictions Meetings called only by directors or executives Advance notice requirement Restrictions on action by written consent 8. Supermajority voter requirements Supermajority required to approve mergers Supermajority required to replace directors 9. Unequal voting rights 10. Miscellaneous antitakeover provisions Board can be removed only for cause Merger must be approved by an inside director Restrictions on transfer of common stock Merger must be approved by separate class of stock Restrictions on how many IPO shares may be purchased Restrictions on votes each shareholder may cast
The G-index from Gompers, Ishii, and Metrick (2003) includes the following 24 defenses:
Table A.2. Takeover defenses in the G-index
1. Blank check preferred stock 2. Classified board 3. Restrictions on calling a special meeting 4. Restrictions on written consent 5. Compensation plans with change in control provisions 6. Director indemnification contracts 7. CEO golden parachute 8. Director indemnification in the charter or bylaws 9. Charter amendments limiting director liability 10. Severance packages for management 11. Bylaw amendment restrictions 12. Charter amendment restrictions 13. Does not have cumulative voting 14. Does not have secret ballots 15. Supermajority to approve mergers Control-share acquisition laws (state) 16. Unequal voting rights 17. Antigreenmail Antigreenmail law (state)
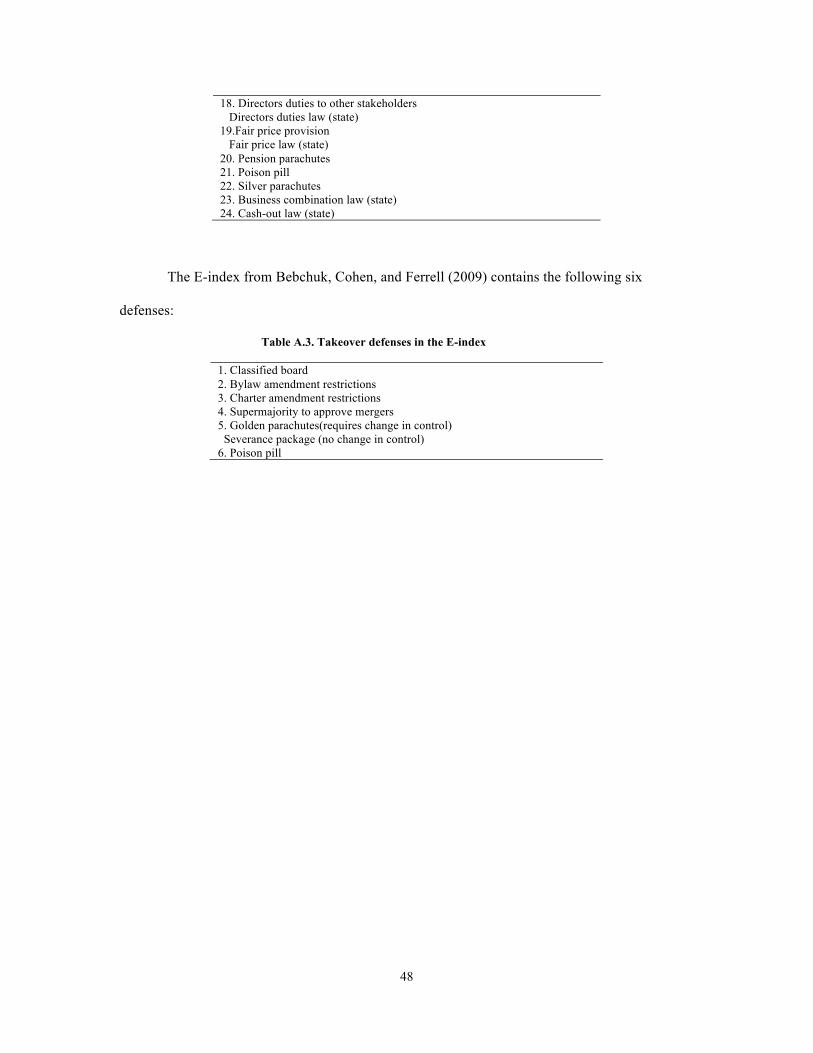
48
18. Directors duties to other stakeholders Directors duties law (state) 19.Fair price provision Fair price law (state) 20. Pension parachutes 21. Poison pill 22. Silver parachutes 23. Business combination law (state) 24. Cash-out law (state)
The E-index from Bebchuk, Cohen, and Ferrell (2009) contains the following six
defenses:
Table A.3. Takeover defenses in the E-index
1. Classified board 2. Bylaw amendment restrictions 3. Charter amendment restrictions 4. Supermajority to approve mergers 5. Golden parachutes(requires change in control) Severance package (no change in control) 6. Poison pill

49
Variable Definitions
This appendix provides a detailed description of the construction of all the variables used in the tables. Variable Name Definition Takeover defense indices F-K index An index adding up the total number of ten takeover defenses as in Field and Karpoff
(2002) based on their presence in the firm charter and bylaws as disclosed in the IPO firm prospectus.
G-index An index adding up the total number of 24 takeover defenses present as in Gompers, Ishii, and Metrick (2003) based on their presence in the firm charter and bylaws as disclosed in the IPO firm prospectus.
E-index An index adding up the total number of 6 takeover defenses present as in Bebchuck, Cohen, and Ferrell (2009) based on their presence in the firm charter and bylaws as disclosed in the IPO firm prospectus.
Appropriable quasi-rent measures Large customer (indicator) An indicator taking a value of one if the IPO firm has a large customer based on the
COMPUSTAT segment level database. All observations are hand-checked using the IPO firm prospectuses.
Large supplier (indicator) An indicator taking a value of one if the IPO firm is disclosed by another firm as a large customer based on the COMPUSTAT segment level database. All observations are hand-checked using firm annual reports.
Strategic alliance (indicator) An indicator taking a value of one if the IPO firm has a strategic alliance with another firm as disclosed in the IPO firm prospectus.
Managerial characteristics CEO salary ($ thousands) The dollar value of total cash compensation as disclosure in the IPO firm prospectus. CEO tenure (years) The number of years the CEO has been with the firm as disclosed in the IPO firm
prospectus. CEO age (years) The age of the CEO as disclosed in the IPO firm prospectus. Other IPO firm characteristics Inside ownership The percent of shares held by inside managers of the firm as collected from the IPO
prospectus. Venture capital backed (indicator) An indicator variable taking a value of one if the IPO firm has a venture capital
investor as a pre-IPO shareholder. Development firm (indicator) An indicator variable taking a value of one if the IPO firm has zero sales at the time of
the IPO based on COMPUSTAT data. Board independence The percent of the board that is made up of outsiders as collected from the IPO firm
prospectus. Board size The total size of the IPO firm board as collected from the IPO prospectus. Dual CEO/chair An indicator variable taking a value of one if the CEO is also the chairman of the board
and zero otherwise. Total assets COMPUSTAT data item AT. Leverage COMPUSTAT data item (DLTT+DLC)/AT Market capitalization Number of shares outstanding after the IPO times (CRSP shrout) the first available
closing price of the IPO firm (CRPS prc). Sales COMPUSTAT data item SALE. State antitakeover provisions An indicator variable taking a value of one if the state of IPO firm incorporate has a
state level antitakeover provision. Delaware incorporation An indicator taking a value of one if the IPO firm is incorporated in Delaware Number of acquisitions The number of acquisitions in the IPO firm Fama and French (1997) industry in the
three years leading up to the IPO year measured in hundreds. Underwriter rank The rank of the lead underwriter of the offering as provided by Jay Ritter
(http://bear.warrington.ufl.edu/ritter/ipodata.htm) IPO firm-customer relationship characteristics
CEO with social links to customer (indicator)
An indicator variable taking a value of one if the CEO has social links to the large customer CEO as defined by Hwang and Kim (2009).
Percent of IPO firm sales The dollar value of sales to the large customer in the IPO year divided by COMPUSTAT data item SALE.
Long term contract An indicator variable taking a value of one if the IPO firm discloses a long term contract with the large public customer and zero otherwise.
Pre-IPO relationship length The number of years the relationship has existed as disclosed in the IPO firm prospectus.

50
Table 1. IPO firm characteristics
The sample consists of 1,219 IPOs reported in the Securities Data Corporation (SDC) New Issues database from 1997-2005. All REITs, unit offerings, closed end funds, ADRs, firms not covered by CRSP, firms that belong to either the financial services or utilities industries, and IPOs with an offer price below $5 are excluded from the sample. We use the COMPUSTAT Customer Segment database to identify whether the IPO firms have large public corporate customers. A large public corporate customer is defined as a customer whose sales account for more than 10% of the IPO firm’s total sales. When there are multiple large corporate customers for each IPO firm, the customer that purchases the largest amount is identified as the sample customer. To determine whether a corporate customer is publicly traded or privately held, we match the names of large corporate customers in the COMPUSTAT Segment Customer database with those of firms in COMPUSTAT.
Panel A. IPO firm characteristics N Mean Median Standard deviation IPO firm CEO characteristics CEO compensation ($ thousands) CEO tenure (years) CEO age (years) IPO firm characteristics Inside ownership Venture capital backed (indicator) Development firm (indicator) Board independence Board size Dual CEO/chair (indicator) Total assets ($ millions) Leverage Market capitalization ($ millions) Sales ($ millions) State antitakeover provisions (indicator) Delaware incorporation (indicator) Number of acquisitions Underwriter rank
1,219 1,219 1,219
1,219 1,219 1,219 1,219 1,219 1,219 1,219 1,219 1,219 1,219 1,219 1,219 1,219 1,219
429.60
5.88 47.38
0.58 0.52 0.03 0.28 6.60 0.56
362.29 0.37
714.32 116.18
0.95 0.78 255 7.87
252.00
4.00 47.00
0.60 1.00 0.00 0.25 7.00 1.00
99.45 0.25
292.53 80.84 1.00 1.00 201 9.00
1,133.47
6.23 8.58
0.29 0.50 0.18 0.17 2.02 0.49
1,874.31 0.36
1,685.43 97.84 0.22 0.41 200 1.71
Panel B. Appropriable quasi-rents Large customer (indicator) Large supplier (indicator) Strategic alliance (indicator)
1,219 1,219 1,219
0.6005 0.0443 0.3068
1.0000 0.0000 0.0000
0.4899 0.2058 0.4614
Panel C. Takeover defenses of IPO firms Field and Karpoff (2002) index of takeover defenses G-index E-index
1,219 1,219 1,219
3.16 9.59 1.50
3.00 10.00 1.00
1.40 2.50 1.19

51
Table 2. IPO firm takeover defenses and appropriable quasi-rents
The sample consists of 1,219 IPOs reported in the Securities Data Corporation (SDC) New Issues database from 1997-2005. All REITs, unit offerings, closed end funds, ADRs, firms not covered by CRSP, firms that belong to either the financial services or utilities industries, and IPOs with an offer price below $5 are excluded from the sample. We use the COMPUSTAT Customer Segment database to identify whether the IPO firms have large public corporate customers. Panel A partitions firms according to whether they have a large customer that accounts for 10% or more of the firm’s sales. Panel B partitions firms according to whether they have a large supplier, for which 10% or more of its sales is to the IPO firm. Panel C partitions firms according to whether an IPO firm has a strategic alliance with another firm.
Panel A: Number of takeover defenses partitioned by the presence of a large customer IPO firms without large customers
(N=487) IPO firms with large customers
(N=732) Test of Difference
Mean Median Mean Median t-statistic Mann-Whitney z-test IPO firm F-K Index IPO firm G-Index IPO firm E-Index
3.05 9.27 1.42
3.00 9.00 1.00
3.24 9.81 1.56
3.00 10.00 1.00
2.33** (0.02) 3.71*** (0.00) 2.10** (0.04)
2.87*** (0.00) 3.43*** (0.00) 2.35** (0.02)
Panel B: Number of takeover defenses partitioned by the presence of a large supplier IPO firms without a large supplier
(N=1,165) IPO firms with a
large supplier (N=54) Test of Difference
Mean Median Mean Median t-statistic Mann-Whitney z-test IPO firm Field-Karpoff Index IPO firm G-Index IPO firm E-Index
3.13 9.57 1.49
3.00 10.00 1.00
3.76 10.19 1.81
4.00 10.00 1.00
3.22*** (0.00) 1.78* (0.08) 1.96** (0.05)
2.84*** (0.00) 1.72* (0.09) 1.48 (0.14)
Panel C: Number of takeover defenses partitioned by the presence of a strategic alliance IPO firms without strategic alliance
(N=865) IPO firms with strategic alliance
(N=354) Test of Difference
Mean Median Mean Median t-statistic Mann-Whitney z-test IPO firm Field-Karpoff Index IPO firm G-Index IPO firm E-Index
3.06 9.43 1.42
3.00 9.00 1.00
3.40 9.99 1.70
3.00 10.00 1.00
3.86*** (0.00) 3.61*** (0.00) 3.65*** (0.00)
4.30*** (0.00) 4.03*** (0.00) 3.89*** (0.00)

52
Table 3. Determinants of IPO firms’ takeover defenses
Each column reports the results of a Poisson maximum-likelihood model in which the dependent variable is the number of takeover defenses as measured by one of three measures: the Field-Karpoff (2002) index, the G-Index (Gompers, Ishii, and Metrick 2003), or the E-Index (Bebchuk et al. 2007). The regressors are defined in the Appendix. The sample consists of 1,219 IPOs reported in the Securities Data Corporation (SDC) New Issues database between 1997 and 2005. Panel A reports results from nine regressions using the full sample, and Panel B reports results using a sub-sample in which the IPO firm has a large (10% of sales or greater) customer and the large customer is a publicly traded firm. The regressions include dummy variables for each year and Fama and French (1997) industry. Standard errors clustered by industry are reported below the regression coefficients. ***, **, and * denote two-tailed significance levels of the parameter estimates at the 0.01, 0.05, and 0.10 levels.
Panel A: Full sample results (continued on following page) FK-index as dependent variable G-index as dependent variable E-index as dependent variable (1) (2) (3) (4) (5) (6) (7) (8) (9) Measures of appropriable quasi-rents:
Large customer (indicator)
Large supplier (indicator)
Strategic alliance (indicator)
Control Variables:
Log(1+CEOsalary)
CEO tenure (years)
CEO age (years) Inside ownership Venture capital backed (indicator) Development firm (indicator) Board independence Board size Dual CEO/chair Log (total assets)
0.095*** (0.026)
0.008* (0.005) 0.001
(0.002) 0.000
(0.001) -0.048 (0.031)
0.070*** (0.027) -0.072 (0.067) 0.124
(0.114) 0.018** (0.007) 0.026
(0.030) 0.029*** (0.011)
0.155*** (0.060)
0.010* (0.005) 0.001
(0.002) 0.000
(0.001) -0.045 (0.029) 0.063** (0.027) -0.048 (0.069) 0.114
(0.108) 0.018** (0.007) 0.035
(0.029) 0.023** (0.012)
0.073*** (0.027)
0.009* (0.005) 0.001
(0.002) 0.000
(0.001) -0.046 (0.030) 0.069** (0.027) -0.079 (0.068) 0.112
(0.110) 0.015** (0.007) 0.032
(0.030) 0.028*** (0.011)
0.075*** (0.016)
0.003 (0.002) -0.001 (0.001) 0.000
(0.001) -0.018 (0.023) 0.046** (0.018) 0.011
(0.041) 0.129*** (0.047)
0.011*** (0.004) 0.002
(0.019) -0.004 (0.005)
0.060** (0.030)
0.003 (0.002) -0.001 (0.001) 0.000
(0.001) -0.019 (0.024) 0.043** (0.018) 0.032
(0.043) 0.124*** (0.044)
0.010*** (0.003) 0.007
(0.019) -0.007 (0.006)
0.036*** (0.012)
0.003 (0.002) -0.001 (0.001) 0.000
(0.001) -0.019 (0.024) 0.045** (0.018) 0.016
(0.043) 0.123*** (0.044) 0.009** (0.004) 0.006
(0.019) -0.005 (0.006)
0.156*** (0.045)
0.012* (0.007) -0.006* (0.004) -0.001 (0.002) -0.086 (0.067)
0.113*** (0.043) -0.068 (0.072) 0.378** (0.178)
0.035*** (0.007) 0.054
(0.081) 0.021
(0.016)
0.197** (0.092)
0.015** (0.007) -0.006* (0.004) -0.001 (0.002) -0.088 (0.067) 0.103** (0.042) -0.025 (0.074) 0.360** (0.173)
0.034*** (0.007) 0.066
(0.080) 0.013
(0.016)
0.122** (0.051)
0.014** (0.007) -0.006* (0.004) -0.001 (0.002) -0.085 (0.068) 0.109** (0.044) -0.078 (0.078) 0.352** (0.178)
0.029*** (0.006) 0.064
(0.080) 0.019
(0.017)

53
Leverage State antitakeover law (indicator) Delaware incorporation (indicator) Number of acquisitions Underwriter Rank
Year indicators Industry indicators Sample size Log pseudolikelihood
-0.036 (0.040) 0.096
(0.085) -0.059* (0.033) 0.010
(0.013) 0.034*** (0.009)
Yes Yes
1,219 -2145.261
-0.030 (0.040) 0.094
(0.081) -0.059* (0.032) 0.017
(0.014) 0.037*** (0.009)
Yes Yes
1,219 -2146.632
-0.017 (0.040) 0.100
(0.085) -0.060* (0.034) 0.014
(0.013) 0.036*** (0.009)
Yes Yes
1,219 -2146.807
-0.076*** (0.017)
0.316*** (0.033)
-0.101*** (0.014) 0.018* (0.010)
0.016*** (0.006)
Yes Yes
1,219 -2813.569
-0.071*** (0.017)
0.316*** (0.033)
-0.103*** (0.013) 0.022** (0.010)
0.018*** (0.006)
Yes Yes
1,219 -2819.132
-0.066*** (0.016)
0.318*** (0.032)
-0.103*** (0.014) 0.021** (0.010)
0.018*** (0.006)
Yes Yes
1,219 -2818.641
-0.148*** (0.056)
0.314*** (0.089) -0.045 (0.055) 0.033
(0.038) 0.038* (0.022)
Yes Yes
1,219 -1777.680
-0.137** (0.055)
0.313*** (0.087) -0.049 (0.054) 0.042
(0.038) 0.042* (0.022)
Yes Yes
1,219 -1780.422
-0.117** (0.052)
0.319*** (0.091) -0.049 (0.051) 0.039
(0.038) 0.040* (0.023)
Yes Yes
1,219 -1779.464
Panel B: Effects of the importance of the trading relationship with a large customer FK-index as dependent variable (10) (11) (12) (13) (14)
Social Links between IPO CEO and customer CEO (indicator) Long term contract (indicator) Pre-IPO relationship length (years) Percent of IPO firm sales
Control Variables Year indicators Industry indicators Sample size Log pseudolikelihood
0.215*** (0.054)
Yes Yes Yes 209
-337.164
0.197*** (0.073)
Yes Yes Yes 209
-336.785
0.015* (0.009)
Yes Yes Yes 209
-337.832
0.322*** (0.114)
Yes Yes Yes 209
-337.745
0.231*** (0.052)
0.179*** (0.065) 0.014
(0.009) 0.287** (0.123)
Yes Yes Yes 209
-334.093

54
Table 4. IPO firm valuation, univariate comparisons
Mean and median ratios of the IPO firm’s relative valuation. In Panel A, relative valuation is calculated as the ratio of shares outstanding times the offer price to EBITDA for the IPO firm divided by the ratio of market capitalization to EBITDA for its matched firm. In Panel B, relative valuation is calculated as the ratio of shares outstanding times the offer price to sales for the IPO firm divided by the ratio of market capitalization to sales for its matched firm. The matched firms are selected by sorting the Fama and French (1997) industry into three portfolios based on sales in the year before the IPO. Each of these portfolios is then sorted into three additional portfolios based on EBITDA/sales, producing a matrix of 3x3 portfolios for each industry. Then, within each portfolio, the firm with sales closest to the IPO firm is selected as the matched firm. A large customer is defined as a customer whose sales account for more than 10% of the IPO firm’s total sales. ***, **, and * indicate significance at the 1%, 5%, and 10% levels.
Panel A: IPO firm offer value/matching firm value (using EBITDA) partitioned by the number of takeover defenses Number of IPO firm takeover defenses
Total sample (N=1,219)
IPO firms without a large customer (N=487) IPO firms with a large customer
(N=732) N Mean Median N Mean Median N Mean Median < 3 takeover defenses (a) 384 10.55 1.71 187 15.09 1.66 197 6.25 1.78 3 takeover defenses 371 23.31 2.87 130 16.04 2.72 241 27.22 3.02 > 3 takeover defenses (b) 464 21.41 2.59 170 17.61 1.96 294 23.60 2.98 Difference (b – a) using t-test / Mann-Whitney (p-value)
1.91* (0.06)
2.62** (0.01)
0.27 (0.79)
0.23 (0.82)
2.40** (0.02)
3.00*** (0.00)
Panel B: IPO firm offer value/matching firm value (using sales) partitioned by the number of takeover defenses Number of IPO firm takeover defenses
Total sample (N=1,219)
IPO firms without a large customer (N=487) IPO firms with a large customer
(N=732) N Mean Median N Mean Median N Mean Median < 3 takeover defenses (a) 384 37.72 1.81 187 58.94 1.59 197 17.58 2.03 3 takeover defenses 371 27.25 3.29 130 24.10 2.91 241 28.70 3.54 > 3 takeover defenses (b) 464 32.61 2.93 170 42.31 2.61 294 27.01 3.00 Difference (b – a) using t-test / Mann-Whitney (p-value)
0.26 (0.80)
2.80** (0.01)
0.39 (0.70)
1.34 (0.18)
0.67 (0.52)
2.38** (0.02)

55
Table 5. IPO firm valuation, multivariate tests
Ordinary least squares estimates in which the dependent variable is log(relative valuation). Relative valuation is calculated as the ratio of shares outstanding times the offer price to EBITDA for the IPO firm divided by the ratio of market capitalization to EBITDA for its matched firm. The matched firms are selected by sorting the Fama and French (1997) industry into three portfolios based on sales in the year before the IPO. Each of these portfolios is then sorted into three additional portfolios based on EBITDA/sales, producing a matrix of 3x3 portfolios for each industry. Then, within each portfolio, the firm with sales closest to the IPO firm is selected as the matched firm. Large customer, Large supplier, and Strategic alliance are indicator variables that reflect the existence of an important business relationship with the IPO firm. Control variables include IPO firm underwriter rank, log(IPO proceeds), an indicator taking a value of one if the IPO is venture backed, the percent of the shares that are primary shares, IPO firm leverage, and IPO firm R&D/assets. ***, **, and * indicate significance at the 1%, 5%, and 10% levels.
(1) (2) (3) (4) (5) (6) Takeover defense measures: F-K Index G-index E-index Measures of appropriable quasi-rents: Large customer Large customer x takeover defense index Large supplier Large supplier x takeover defense index Strategic alliance (indicator): Strategic alliance x takeover defense index Control Variables Year indicators Industry indicators Sample size Adjusted R2
0.075*** (0.026)
Yes Yes Yes
1,219 0.16
0.058*** (0.019)
Yes Yes Yes
1,219 0.17
0.089*** (0.032)
Yes Yes Yes
1,219 0.16
0.010 (0.039)
-0.057 (0.159) 0.110** (0.051)
Yes Yes Yes
1,219 0.17
0.057** (0.025)
-0.597 (0.527) 0.225** (0.098)
Yes Yes Yes
1,219 0.17
0.034 (0.029)
-0.066 (0.276) 0.122* (0.072)
Yes Yes Yes
1,219 0.17

56
Table 6. Instrumental variable tests for firm valuation
The first stage (Model 1) uses three instruments for the number of takeover defenses at the IPO firm: (i) indicator variables for the IPO firm’s law firm, and (ii) Law firm gaffe, and Law firm acquisitions experience. The estimated the number of takeover defenses from the first stage is used in the second stage regression (Model 2), in which the dependent variable is log(relative valuation). Models (3) and (4) report the results using Firm located in California to instrument for the number of takeover defenses. Models (5) and (6) report just the second stage results of tests in which the three law firm variables in Model 1 are used to instrument for the number of takeover defenses, and additional instruments are constructed for the presence of a large customer and the interaction of Large customer with the number of takeover defenses. Relative valuation is calculated as the ratio of shares outstanding times the offer price to EBITDA for the IPO firm divided by the ratio of market capitalization to EBITDA for its matched firm. The matched firms are selected by sorting the Fama and French (1997) industry into three portfolios based on sales in the year before the IPO. Each of these portfolios is then sorted into three additional portfolios based on EBITDA/sales, producing a matrix of 3x3 portfolios for each industry. Then, within each portfolio, the firm with sales closest to the IPO firm is selected as the matched firm. ***, **, and * indicate significance at the 1%, 5%, and 10% levels.
First Stage Dependent variable = number of defenses
(1)
Second Stage Dependent variable = IPO firm valuation
(2)
First Stage Dependent variable = number of defenses
(3)
Second Stage Dependent variable = IPO firm valuation
(4)
Second Stage Dependent variable = IPO firm valuation
(5)
Second Stage Dependent variable = IPO firm valuation
(6) Instrumental variables for number of ATPs Law firm acquisition experience Law firm gaffe (indicator) Law firm indicator variables Firm located in California (indicator) Instrumented number of takeover defenses Instrumented (Large customer x number of
takeover defenses) Instrumented large customer Control variables for IPO firm value: Log (IPO proceeds) Venture capital backed (indicator) Fraction sold Leverage R&D/assets Underwriter rank Controls for the number of takeover defenses Log (1+CEO salary) CEO tenure (years) CEO age (years) Inside Ownership Development firm (indicator) Board independence Board size Dual CEO / chair (indicator) Log (total assets) State ATP Law (indicator) Delaware Incorporation (indicator) Number acquisitions (hundreds) Large customer (indicator) Year indicators Industry indicators Sample size Adj R2 / Root MSE
-0.007** (0.003)
0.778*** (0.125)
Included
-0.040 (0.093) 0.170* (0.105) 0.186** (0.092)
-0.291** (0.130) -0.018 (0.057) 0.086** (0.034)
0.028* (0.015) 0.011
(0.008) -0.004 (0.005) -0.261* (0.153) -0.152 (0.249) 0.274
(0.306) 0.070*** (0.024) 0.045
(0.089) 0.122* (0.067) 0.104
(0.223) 0.072
(0.129) 0.000
(0.000)
Yes Yes
1,219 0.16
0.148*** (0.035)
0.634*** (0.095)
0.418*** (0.120)
-0.598*** (0.085)
-0.440*** (0.071)
0.120*** (0.041) -0.053* (0.028)
-0.053***
(0.014) -0.021***
(0.006) -0.001 (0.006) 0.093
(0.125) 0.520* (0.279) -0.122 (0.253) -0.012 (0.027) 0.072
(0.115) -0.394***
(0.069) -0.105 (0.176) -0.077 (0.109)
0.001*** (0.000)
Yes Yes
1,219 0.21
-0.349*** (0.093)
0.003 (0.085)
0.303*** (0.094)
0.232*** (0.087) -0.166 (0.119) -0.025 (0.051)
0.105*** (0.030)
0.026* (0.014) 0.002
(0.007) -0.001 (0.005) -0.165 (0.141) -0.127 (0.229) 0.402
(0.282) 0.052** (0.023) 0.098
(0.083) 0.095
(0.061) 0.152
(0.201) -0.102 (0.113) 0.025
(0.029)
Yes Yes
1,219 0.10
0.915*** (0.306)
0.630*** (0.152) 0.216* (0.127)
-0.801** (0.130)
-0.339** (0.123) 0.139** (0.070)
-0.132** (0.038)
-0.072** (0.024)
-0.023** (0.007) 0.000
(0.007) 0.212
(0.137) 0.619* (0.373) -0.461 (0.527) -0.056 (0.053) -0.010 (0.133)
-0.474** (0.101) -0.322 (0.304) 0.060
(0.145) 0.056* (0.028)
Yes Yes
1,219 0.22
0.027 (0.046) 0.115* (0.063)
0.615*** (0.091)
0.343*** (0.116)
-0.577*** (0.098)
-0.421*** (0.079) 0.097** (0.038) -0.057* (0.029)
-0.050***
(0.012) -0.022***
(0.006) 0.000
(0.006) 0.098
(0.131) 0.361
(0.285) -0.135 (0.245) -0.008 (0.025) 0.060
(0.112) -0.362***
(0.058) -0.101 (0.153) -0.127 (0.097)
0.001*** (0.000) -0.154 (0.199)
Yes No
1,219 0.18
0.022 (0.044) 0.121* (0.062) -0.120 (0.210)
0.614
(0.091) 0.344*** (0.116)
-0.576*** (0.099)
-0.423*** (0.079)
0.097*** (0.038)
-0.058** (0.029)
-0.050** (0.013)
-0.022*** (0.007) 0.000
(0.006) 0.101
(0.129) 0.343
(0.288) -0.136 (0.243) -0.007 (0.024) 0.059
(0.112) -0.361***
(0.058) -0.100 (0.153) -0.127 (0.096)
0.001*** (0.000)
Yes No
1,219 0.18

57
Table 7. Change in operating performance, univariate comparisons
Mean and median change in IPO firm ROA from the year of the IPO to the year after the IPO minus the corresponding change in ROA at the matched firm. Matched firms are selected based on industry, year, and ROA values within 10% of the IPO firm ROA. A large customer is defined as a customer whose sales account for more than 10% of the IPO firm’s total sales. ***, **, and * indicate significance at the 1%, 5%, and 10% levels.
IPO firm change in ROA to year +1 adjusted by matching firm change in ROA Number of IPO firm takeover defenses
Total sample (N=1,219)
IPO firms without a large customer (N=487) IPO firms with a large customer
(N=732) N Mean Median N Mean Median N Mean Median < 3 takeover defenses (a:) 384 -0.0326 -0.0074 187 -0.0113 0.0146 197 -0.0504 -0.0151 3 takeover defenses 371 -0.0148 -0.0155 130 0.0371 -0.0163 241 -0.0401 -0.0147 > 3 takeover defenses (b:) 464 0.0076 0.0091 170 0.0118 0.0088 294 0.0053 0.0106 Difference (b – a) using t-test / Mann-Whitney (p-value)
1.83* (0.07)
0.87 (0.39)
0.57 (0.57)
0.43 (0.66)
2.25** (0.02)
1.62 (0.11)
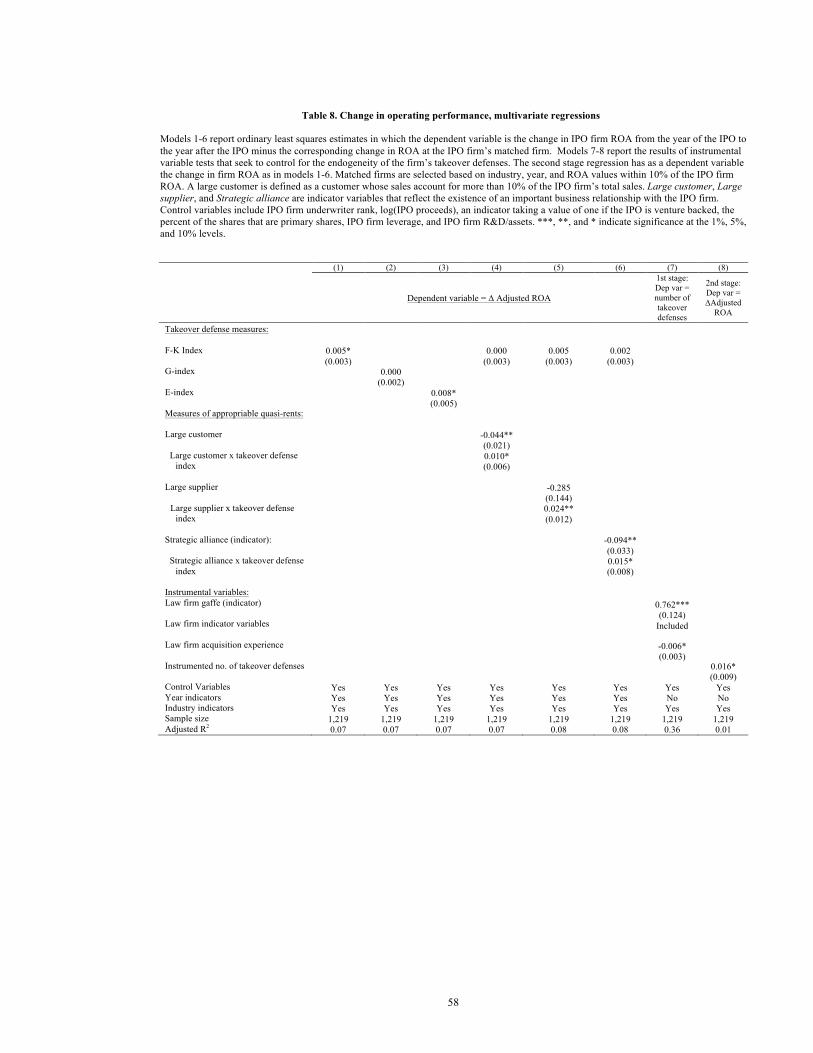
58
Table 8. Change in operating performance, multivariate regressions
Models 1-6 report ordinary least squares estimates in which the dependent variable is the change in IPO firm ROA from the year of the IPO to the year after the IPO minus the corresponding change in ROA at the IPO firm’s matched firm. Models 7-8 report the results of instrumental variable tests that seek to control for the endogeneity of the firm’s takeover defenses. The second stage regression has as a dependent variable the change in firm ROA as in models 1-6. Matched firms are selected based on industry, year, and ROA values within 10% of the IPO firm ROA. A large customer is defined as a customer whose sales account for more than 10% of the IPO firm’s total sales. Large customer, Large supplier, and Strategic alliance are indicator variables that reflect the existence of an important business relationship with the IPO firm. Control variables include IPO firm underwriter rank, log(IPO proceeds), an indicator taking a value of one if the IPO is venture backed, the percent of the shares that are primary shares, IPO firm leverage, and IPO firm R&D/assets. ***, **, and * indicate significance at the 1%, 5%, and 10% levels.
(1) (2) (3) (4) (5) (6) (7) (8)
Dependent variable = ∆ Adjusted ROA
1st stage: Dep var = number of takeover defenses
2nd stage: Dep var = ∆Adjusted
ROA
Takeover defense measures: F-K Index G-index E-index Measures of appropriable quasi-rents: Large customer Large customer x takeover defense
index Large supplier
Large supplier x takeover defense index
Strategic alliance (indicator): Strategic alliance x takeover defense
index Instrumental variables: Law firm gaffe (indicator) Law firm indicator variables Law firm acquisition experience Instrumented no. of takeover defenses Control Variables Year indicators Industry indicators Sample size Adjusted R2
0.005* (0.003)
Yes Yes Yes
1,219 0.07
0.000 (0.002)
Yes Yes Yes
1,219 0.07
0.008* (0.005)
Yes Yes Yes
1,219 0.07
0.000 (0.003)
-0.044** (0.021) 0.010* (0.006)
Yes Yes Yes
1,219 0.07
0.005 (0.003)
-0.285 (0.144) 0.024** (0.012)
Yes Yes Yes
1,219 0.08
0.002 (0.003)
-0.094** (0.033) 0.015* (0.008)
Yes Yes Yes
1,219 0.08
0.762*** (0.124)
Included
-0.006* (0.003)
Yes No Yes
1,219 0.36
0.016* (0.009)
Yes No Yes
1,219 0.01
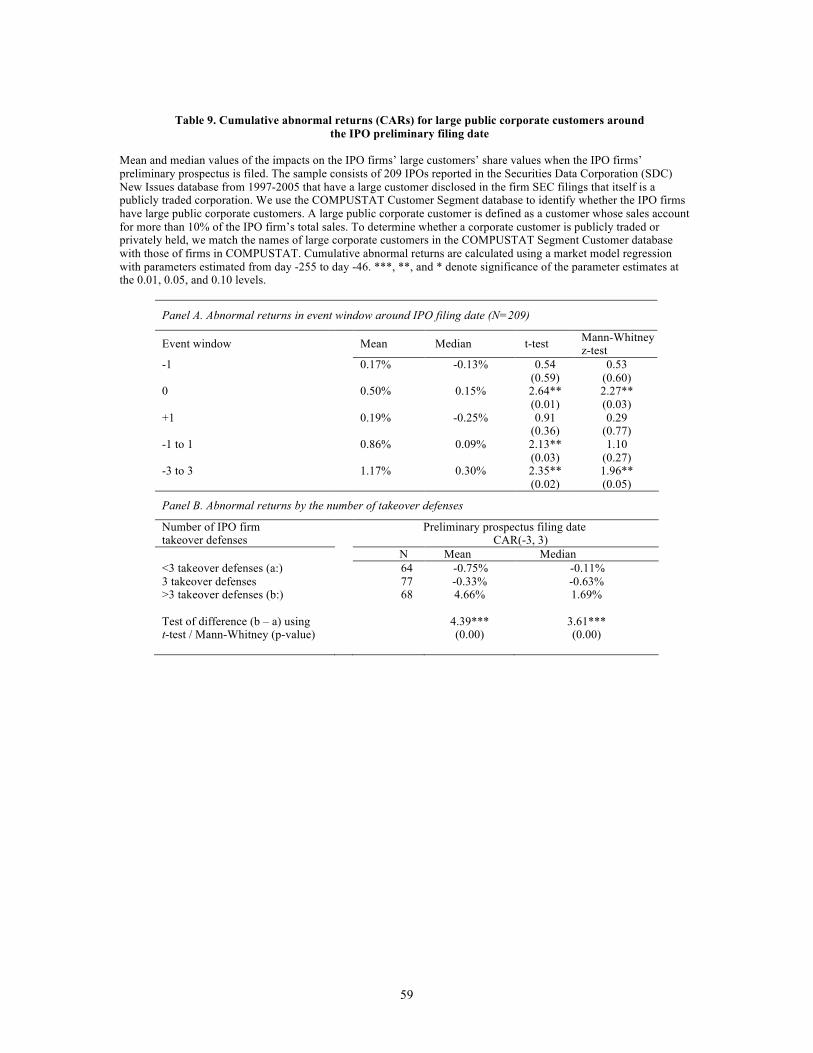
59
Table 9. Cumulative abnormal returns (CARs) for large public corporate customers around
the IPO preliminary filing date
Mean and median values of the impacts on the IPO firms’ large customers’ share values when the IPO firms’ preliminary prospectus is filed. The sample consists of 209 IPOs reported in the Securities Data Corporation (SDC) New Issues database from 1997-2005 that have a large customer disclosed in the firm SEC filings that itself is a publicly traded corporation. We use the COMPUSTAT Customer Segment database to identify whether the IPO firms have large public corporate customers. A large public corporate customer is defined as a customer whose sales account for more than 10% of the IPO firm’s total sales. To determine whether a corporate customer is publicly traded or privately held, we match the names of large corporate customers in the COMPUSTAT Segment Customer database with those of firms in COMPUSTAT. Cumulative abnormal returns are calculated using a market model regression with parameters estimated from day -255 to day -46. ***, **, and * denote significance of the parameter estimates at the 0.01, 0.05, and 0.10 levels.
Panel A. Abnormal returns in event window around IPO filing date (N=209)
Event window Mean Median t-test Mann-Whitney z-test
-1 0 +1 -1 to 1 -3 to 3
0.17% 0.50% 0.19% 0.86% 1.17%
-0.13%
0.15%
-0.25%
0.09%
0.30%
0.54 (0.59) 2.64** (0.01) 0.91
(0.36) 2.13** (0.03) 2.35** (0.02)
0.53 (0.60) 2.27** (0.03) 0.29
(0.77) 1.10
(0.27) 1.96** (0.05)
Panel B. Abnormal returns by the number of takeover defenses
Number of IPO firm takeover defenses
Preliminary prospectus filing date CAR(-3, 3)
N Mean Median <3 takeover defenses (a:) 64 -0.75% -0.11% 3 takeover defenses 77 -0.33% -0.63% >3 takeover defenses (b:) 68 4.66% 1.69% Test of difference (b – a) using t-test / Mann-Whitney (p-value)
4.39*** (0.00)
3.61*** (0.00)

60
Table 10. Multivariate regressions of cumulative abnormal returns (CARs) for large public corporate customers
This table reports results from eight OLS regressions in which the dependent variable is the cumulative abnormal return over days (0,5) relative to the IPO firm’s preliminary prospectus filing date for the IPO firms’ large public customers. The sample consists of 209 IPOs reported in the Securities Data Corporation (SDC) New Issues database from 1997-2005 that have a large public customer disclosed in the firm SEC filings. We use the COMPUSTAT Customer Segment database to identify whether the IPO firms have large customers. A large customer is defined as a customer whose sales account for more than 10% of the IPO firm’s total sales. When there are multiple large customers for each IPO firm, the customer that purchases the largest amount is identified as the sample customer. To determine whether a corporate customer is publicly traded, we match the names of large corporate customers in the COMPUSTAT Segment Customer database with those of firms in COMPUSTAT. Cumulative abnormal returns are calculated using a market model regression with parameters estimated from day -255 to day -46 relative to the IPO firm’s preliminary prospectus filing date. ***, **, and * denote significance of the parameter estimates at the 0.01, 0.05, and 0.10 levels.
(1) (2) (3) (4) (5) (6) (7) (8) F-K index a: G-index E-index Interfirm characteristics Social Links between IPO CEO and customer CEO (indicator) b: a x b Long term contract (indicator) c: a x c Long pre-IPO relationship length (indicator) d: a x d High percent of IPO firm sales (indicator) e: a x e Strategic alliance with customer (indicator) f: a x f Control Variables Year indicators Industry indicators Sample size Adjusted R2
1.940*** (0.451)
Yes Yes Yes 209 0.22
0.148 (0.188)
Yes Yes Yes 209 0.14
0.571* (0.300)
Yes Yes Yes 209 0.15
1.633*** (0.548)
-8.454** (3.528) 2.561** (1.217)
Yes Yes Yes 209 0.24
1.524*** (0.442)
-6.460** (2.699)
1.945*** (0.664)
Yes Yes Yes 209 0.24
0.820** (0.340)
-1.845 (2.642) 1.518* (0.830)
Yes Yes Yes 209 0.26
0.859 (0.545)
-5.759** (2.280) 1.861* (0.964)
Yes Yes Yes 209 0.24
0.093 (0.609)
-6.918* (3.939) 3.030** (1.285)
Yes Yes Yes 209 0.28

61
Table 11. Takeover defenses and relationship duration, univariate comparisons
This table reports the mean and median length, in years, of the post-IPO business relationship between the IPO firm and its large publicly traded customer. Panel A reports on the total subsample of 209 IPOs reported in the Securities Data Corporation (SDC) New Issues database between 1997 and 2005 that had large public customers at the time of their IPO. Panel B reports on the subsample partitioned by the IPO firm’s number of takeover defenses at the time of the IPO, using the Field-Karpoff (2002) index as described in the Appendix. ***, **, and * denote the significance of the parameter estimates at the 0.01, 0.05, and 0.10 levels, respectively.
Panel A. Post-IPO relationship length for IPO firms with large public customers Post-IPO relationship length
(years)
N Mean Median 209 2.73 2.00 Panel B. Post-IPO relationship length by the number of takeover defenses Number of IPO firm takeover defenses
Post-IPO relationship length (years)
N Mean Median <3 takeover defenses (a:) 64 2.17 2.00 3 takeover defenses 77 2.68 2.00 >3 takeover defenses (b:) 68 3.32 3.00 Test of difference (b – a) using t-test / Mann-Whitney (p-value)
3.59*** (0.00)
3.27*** (0.00)

62
Table 12. Takeover defenses and relationship duration, multivariate tests
Models 1-6 report on non-parametric (Cox) survival analysis tests in which the dependent variable is the post-IPO length of the business relationship between the IPO firm and its large publicly traded customer. Models 7-8 report the results of an instrumental variable tests that seek to control for the endogeneity of the firm’s takeover defenses. The second stage regression dependent variable is an indicator for the year the relationship terminates where there is the same number of year observations for each firm as the length of the relationship. The sample consists of 209 IPOs reported in the Securities Data Corporation (SDC) New Issues database between 1997 and 2005 that have large public customers at the time of their IPO. All REITs, unit offerings, closed-end funds, ADRs, firms not covered by CRSP, firms that belong to either the financial services or utilities industries, IPOs with an offer price below $5, and IPOs without earning or sales data in the year before the IPO are excluded from the sample. We use the COMPUSTAT Segment Customer database to identify whether the IPO firms have large corporate customers. A large corporate customer is defined as a customer whose sales account for more than 10% of the IPO firm’s total sales. When there are multiple large corporate customers for each IPO firm, the customer that purchases the largest amount is identified as the sample customer. To determine whether a corporate customer is publicly traded or privately held, we match the names of large corporate customers in the COMPUSTAT Segment Customer database with those of all firms in COMPUSTAT. The Field and Karpoff (2002) index is described in the Appendix. ***, **, and * denote the significance of the parameter estimates at the 0.01, 0.05, and 0.10 levels, respectively.
(1) (2) (3) (4) (5) (6) (7) (8)
Dependent variable = Post-IPO length of business relationship
1st stage: Dep var = number of takeover defenses
2nd stage: Dep var =
Relationship termination
rate F-K index a: Interfirm characteristics Social Links between IPO CEO and customer CEO (indicator) b: a x b Long term contract (indicator) c: a x c Long pre-IPO relationship length (indicator) d: a x d High percent of IPO firm sales (indicator) e: a x e Strategic alliance with customer (indicator) f: a xf Instrumental variables: Law firm gaffe (indicator) Law firm indicator variables Law firm acquisition experience Instrumented number of takeover defenses Control Variables Year indicators Industry indicators Sample size Log pseudolikelihood
0.797*** (0.044)
Yes Yes Yes 209
-907.749
0.829*** (0.045)
3.526*** (1.668)
0.690*** (0.084)
Yes Yes Yes 209
-906.129
0.780*** (0.046)
0.767 (0.372) 1.100
(0.139)
Yes Yes Yes 209
-907.612
0.813*** (0.043)
1.017 (0.319)
0.975
(0.108)
Yes Yes Yes 209
-907.704
0.797*** (0.041)
0.689 (0.362) 1.069
(0.180)
Yes Yes Yes 209
-907.283
0.858** (0.057)
1.619* (0.439)
0.864* (0.067)
Yes Yes Yes 209
-907.161
0.697*** (0.128)
Included
-0.021*** (0.003)
Yes Yes Yes
1,219 0.80
-0.032** (0.016)
Yes Yes Yes 577 0.19