Embed Size (px)
Citation preview
The Board of Regents of the University of Wisconsin System
Cognitive Development among Young Children in Ecuador: The Roles of Wealth, Health, andParentingAuthor(s): Christina Paxson and Norbert SchadySource: The Journal of Human Resources, Vol. 42, No. 1 (Winter, 2007), pp. 49-84Published by: University of Wisconsin PressStable URL: http://www.jstor.org/stable/40057298 .Accessed: 09/02/2011 11:37
Your use of the JSTOR archive indicates your acceptance of JSTOR's Terms and Conditions of Use, available at .http://www.jstor.org/page/info/about/policies/terms.jsp. JSTOR's Terms and Conditions of Use provides, in part, that unlessyou have obtained prior permission, you may not download an entire issue of a journal or multiple copies of articles, and youmay use content in the JSTOR archive only for your personal, non-commercial use.
Please contact the publisher regarding any further use of this work. Publisher contact information may be obtained at .http://www.jstor.org/action/showPublisher?publisherCode=uwisc. .
Each copy of any part of a JSTOR transmission must contain the same copyright notice that appears on the screen or printedpage of such transmission.
JSTOR is a not-for-profit service that helps scholars, researchers, and students discover, use, and build upon a wide range ofcontent in a trusted digital archive. We use information technology and tools to increase productivity and facilitate new formsof scholarship. For more information about JSTOR, please contact [email protected].
University of Wisconsin Press and The Board of Regents of the University of Wisconsin System arecollaborating with JSTOR to digitize, preserve and extend access to The Journal of Human Resources.
http://www.jstor.org

Cognitive Development among Young Children in Ecuador The Roles of Wealth, Health, and Parenting
Christina Paxson Norbert Schady
ABSTRACT
We examine the relationship between early cognitive development, socio- economic status (SES), child health, and parenting quality in a developing country. We use a sample of more than 3,000 predominantly poor preschool- aged children from Ecuador, and analyze determinants of their scores on a widely used test of language ability. We find that household wealth and parental education are associated with higher scores, and that these asso- ciations are larger among older children. Child health and measures of parenting quality are associated with test performance, and account for a fraction, although not the majority, of the association between SES and cognitive development.
I. Introduction
A growing body of research suggests that low levels of cognitive de- velopment in early childhood have adverse long-term consequences for adult well- being. Research based on the 1958 National Child Development Study shows that performance on mathematics and reading tests at age 7 predicts test scores at later ages, as well as educational attainment and wages as adults (Case and Paxson 2006; Connolly, Micklewright, and Nickell 1992; Currie and Thomas 1999; Robertson
Christina Paxson is a professor of economics and public affairs at Princeton University. Norbert Schady is a Senior Economist at the World Bank. They acknowledge the collaboration at every stage of this project with their colleagues at the Secretaria Tecnica del Frente Social in Ecuador, in particular Santiago Izquierdo, Mauricio Leon, Ruth Lucio, Juan Ponce, Jose'Rosero and Yajaira Vazquez. They also thank Harold Alderman, Maria Caridad Araujo, Pedro Carneiro, Jishnu Das, Daniel Dulitzky, Lant Pritchett, Carolina Sdnchez- Pdramo, three anonymous referees, and seminar participants at the Inter-American Development Bank, Princeton University, Swarthmore College, and the Tenth Annual Meeting of the Latin American and Ca- ribbean Economic Conference held in Paris on October 27-29, 2005 for their comments. Tom Vogl provided excellent research assistance. The data used in this article can be obtained beginning August 2007 through July 2010 from Norbert Schady, World Bank, [email protected]. [Submitted March 2005; accepted April 2006] ISSN 022-166X E-ISSN 1548-8004 © 2007 by the Board of Regents of the University of Wisconsin System
THE JOURNAL OF HUMAN RESOURCES • XLII • 1

50 The Journal of Human Resources
and Symons 2003). Evidence from a later-born cohort indicates that tests adminis- tered as early as 22 months of age are also associated with adult education outcomes (Feinstein 2003). Several of these authors find that the predictive effects of test per- formance in childhood on adult education and wages are particularly large for chil- dren from households with lower socioeconomic status (SES) (Currie and Thomas 1999; Feinstein 2003). l These results underscore the importance of understanding the determinants of cognitive development, especially among poor children.
Research on both industrialized and developing countries has focused on identify- ing environmental factors that affect cognitive development. A common finding in the U.S. literature is that higher SES, as measured by income, wealth, or parental ed- ucation, is associated with better cognitive development of children.2 The extent to which this association is causal is a topic of live debate. More resources for children, better parenting skills, increased cognitive stimulation of children, and lower inci- dence of maternal depression and stress all have been proposed as "pathways" from high SES to high levels of cognitive development of children.
In contrast with the U.S. literature, research on developing countries has placed greater emphasis on child health as a determinant of cognitive development and little emphasis on parenting. Numerous studies report an association between cognitive development and malnutrition (Powell et al. 1995; Pollitt, Watkins, and Husaini 1997), iron deficiency (Lozoff, Jimenez and Hagen 2000; Grantham-McGregor and Ani 2001; Stoltzfus, Kvalsvig, and Chwaya 2001) and, more recently, other micronutrients such as zinc, iodine, and vitamin B-12 (Black 2003). Helminth infec- tions also have been implicated as a route through which SES affects cognitive de- velopment. Children infected with intestinal helminths are more likely to be malnourished and to have iron deficient anemia, which could impair their ability to learn (Dickson, Awasthi, and Williamson 2000; Miguel and Kremer 2004).
The emphasis on child health in developing countries is understandable - the health problems children face may be so pressing that other factors are of secondary importance. However, a number of important issues have received little attention in poor countries. One issue is the relationship between economic status and cognitive development. Although there is abundant evidence that children in poorer households are generally in worse health (for reviews, see Behrman and Deolalikar 1988; Strauss and Thomas 1998), relatively little is known about socioeconomic gradients in cog- nitive development (Schady 2006). Furthermore, the evidence that exists yields mixed conclusions. In the Philippines, Ghuman et al. (2005) focus on a sample of children ages 0-36 months and find evidence that children in households with fewer assets have lower performance on tests of receptive language and expressive lan- guage, as do children whose parents are shorter and have fewer years of schooling; however, only the associations between household assets and receptive language skills are significant at standard levels. In Latin America, Halpern et al. (1996)
1. In much of this research, and in what follows, the term "SES" is used as shorthand to refer to a set of socioeconomic factors, including wealth, parental education, family structure, and maternal age. We do not mean to suggest that the components of SES measure the same things, and the variables included in SES could be related to children's cognitive ability in quite different ways. 2. Key references include Smith, Brooks-Gunn, and Klebanov (1997); Blau (1999); Guo and Harris (2000); Waldfogel, Han, and Brooks-Gunn (2002); Aughinbaugh and Gittleman (2003); Baum (2003); Ruhm (2004); Taylor, Dearing, and McCartney (2004); Berger, Paxson, and Waldfogel (2005).

Paxson and Schady 51
and Vitora, Barros, and Vaughan (1989) analyze a sample of children born in hospi- tals in the city of Pelotas in the state of Rio Grande do Sul in Brazil, and report gra- dients between income and child development, including cognitive development, even after controlling for child birthweight, which is correlated with income; how- ever, Fernald et al. (2006) find no evidence of socioeconomic gradients in a sample of poor children in Mexico. The extent to which there are socioeconomic gradients in child cognitive development is important for a number of reasons. If poorer children in developing countries grow up with poorer cognitive skills, leading to lower incomes in adulthood, which in turn influence the cognitive skills of their own chil- dren, then low levels of cognitive development in early childhood may be one way in which poverty is transmitted across generations.
Another issue that has received little attention is the importance of parenting rel- ative to health in children's cognitive development. Research from Jamaica by Grantham-McGregor and her co-authors provides compelling evidence that parent- ing interventions may be more effective than health interventions in improving cog- nitive outcomes. In one study, a lottery was used to divide a group of stunted children aged 9-24 months into four groups, one of which received a food transfer, a second group which received an early stimulation and parenting intervention, a third group which received both interventions, and a fourth group which served as a control. Results from these studies show that, after two years both the nutritional supplement and stimulation interventions had positive impacts on child development; however, when children in the original study were revisited at ages 7-8, and again at 11-12 years, the effects of the nutritional supplement were no longer apparent, while chil- dren who had received the stimulation intervention continued to significantly outper- form those in the control group on a variety of tests (Grantham-McGregor et al. 1991; Grantham-McGregor et al. 1997; Walker et al. 2000; see also Powell et al. 2004). Although these results are based on small samples of children (fewer than 200) from only one country, they suggest that research on children's cognitive development in poor countries should not ignore the roles of parenting and cognitive stimulation.
A final issue that has received little attention in developing countries is how cog- nitive development at young ages influences later educational outcomes. There is a large body of research on the determinants of low educational attainment among school-aged children in developing countries (for a review, see Glewwe 2002). A common finding is that children from poorer households are less likely to go to school, less likely to make satisfactory progress conditional on school attendance, and less likely to learn and acquire skills in school. However, if the factors that affect school performance (and eventually earnings) are determined at earlier ages, then policies that focus on school-aged children may be less effective than those that con- centrate on children at younger ages. Indeed, there is reason to believe that there are "sensitive" periods in brain development that severely limit the degree to which def- icits in cognitive development at early ages can be made up later on in life - see, for example Cunha et al. (2005), which reviews both the medical and economic litera- ture on this topic.
This paper examines the role of SES, child health and parenting in the cognitive development of 3,153 Ecuadorean children between 36 and 71 months old at the time of assessment. The children in the sample are predominantly poor - all live in house- holds that fall into one of the lower three quintiles of a nationwide wealth index, and

52 The Journal of Human Resources
the majority are from the bottom two quintiles. Cognitive development is assessed using the Test de Vocabulario en Imageries Peabody (TVIP), the Spanish version of the Peabody Picture Vocabulary Test (PPVT), a test of vocabulary recognition that has been widely used as a general measure of cognitive development.3 The data in- clude measures of SES, including household composition, maternal and paternal education, housing characteristics and household assets; direct assessments of child health, including blood hemoglobin levels, child height and weight, and maternal reports of breastfeeding duration; and measures of parenting quality, including paren- tal responsivity and punitiveness, time spent reading to the child, and the number of other children in the household.
The analysis contributes to the existing literature in a number of ways. First, our paper documents a clear association between SES and cognitive development among poor children in Ecuador. Moreover, the associations between some components of SES and cognitive development become larger with the age of the child. For exam- ple, the association between wealth and the TVIP score is two-and-a-half times as large among older children in our sample, aged 54-71 months, as among younger children, aged 36-53 months. The same is true of maternal education. Although it is not possible to rule out all other alternatives, a plausible explanation for this find- ing is that the effect of high SES on cognitive development is cumulative. As a result, poorer children in Ecuador arrive at the threshold of formal schooling at a significant disadvantage - a disadvantage that may be further compounded if they attend lower- quality schools.
Second, the analyses show that some measures of child health, in particular height- for-age and hemoglobin levels, and some parenting measures, in particular parental responsivity and punitiveness and whether children are read to, are strongly associ- ated with cognitive development. Health and parenting account for a portion, but not all, of the associations between measures of SES and test scores.
Third, the estimation method explicitly accounts for censoring in the test scores: In the sample of Ecuadorean children in this paper, as in many samples of poor chil- dren, a fraction of children are unable to make any progress on the test, or receive raw scores that are so low given their age that their scores cannot be normed. Rather than exclude these children from the analysis - which would result in biased esti- mates of the associations between cognitive development, SES, health and parenting quality - the estimation framework is based on censored regression and censored least absolute deviations methods. The associations of SES, health, and parenting quality with child development are substantially larger when we account for censoring.
The rest of the paper proceeds as follows: Section II briefly describes the Ecuador- ean setting, the sample used for the analysis, and the main variables. Section III dis- cusses the empirical strategy. The main results in the paper are presented in Section IV. We present evidence on how cognitive test scores are related to socioeconomic characteristics, child health, and measures of parenting. We also compare our results for Ecuador with results for a sample of children in the United States from the National Longitudinal Survey of Youth. Section V concludes.
3. Earlier studies that have used the PPVT include Desai, Chase-Lansdale, and Michael (1989); Baydar and Brooks-Gunn (1991); Blau and Grossberg (1992); Parcel and Menaghan (1994); Rosenzweig and Wolpin (1994); Blau (1999); McCulloch and Joshi (2002).

Paxson and Schady 53
II. Sample and Measures
The sample used in this paper includes 3,153 children in 158 parishes in six provinces in Ecuador.4 This section briefly describes some important features of the Ecuador setting and the sample, and then turns to a discussion of the measures of cognitive development, SES, child health, and parenting quality.
A. The Sample
Ecuador is a lower-middle income country. In 2002, its per capita GDP was U.S. $ 1,796, about half the population- weighted Latin American average of U.S. $ 3,740. An estimated 18 percent of the population lives on less than a dollar per person per day, and more than 40 percent live on less than two dollars per day (World Bank 2004). Overall health indicators for Ecuador are roughly on par with those of other Latin American countries. However, Ecuador does worse on measures of child nutri- tion: One of every four children younger than five has low height-for-age (stunting), a figure that is comparable to other "Andean" countries in the region (Bolivia, Peru) but is far above the Latin American average of 15 percent. Moreover, one in ten chil- dren has low weight-for-height (wasting), a very high figure by regional standards. Preventable, communicable diseases such as diarrhea and acute respiratory infections are the main source of morbidity and mortality among children in Ecuador (Vos et al. 2004). Intestinal parasitic infections (IPIs) are also widespread: One recent study finds that more than 90 percent of children in a study area in the rural highlands of Ecuador were infected with one or more pathogenic IPIs, and more than one-half the children were infected with helminths (Sackey, Weigel, and Armijos 2003). We are not aware of any published studies that measure hemoglobin levels or cognitive development among preschool children in Ecuador.
The sample in this paper contains urban and rural children, and is drawn from a survey conducted between October 2003 and September 2004. This survey is intended as a baseline for an evaluation of the Bono de Desarrollo Humano, the larg- est social transfer program in Ecuador. Until recently, the existing transfer program was poorly targeted, so that many nonpoor families received transfers and many poor families did not receive benefits. The government of Ecuador is in the process of redesigning the Bono, so that families in the bottom two quintiles of the nation's wealth distribution will be added to the program roster and those in the top three quintiles will be removed. In addition, to receive transfers families with preschool children will be required to take them for regular health center visits, and families with older children will be required to enroll them in school. The planned evaluation will focus on new entrants to the social transfer program who have preschool but no school-aged children (and so will be bound by the requirement to take preschool chil- dren to health clinics); as a consequence, these groups were oversampled. Of the children in the sample, 82 percent are in the bottom two quintiles of the wealth dis- tribution; 98 percent have no school-age siblings; and none received social transfers
4. The provinces are Azuay, Loja, and Pichincha in the sierra or highlands region of the country, and Esmeraldas, El Oro, and Los Rfos on the coast. Parishes, or "parroquias," are the smallest administrative units in Ecuador. There are 1,149 parishes in the country.
54 The Journal of Human Resources
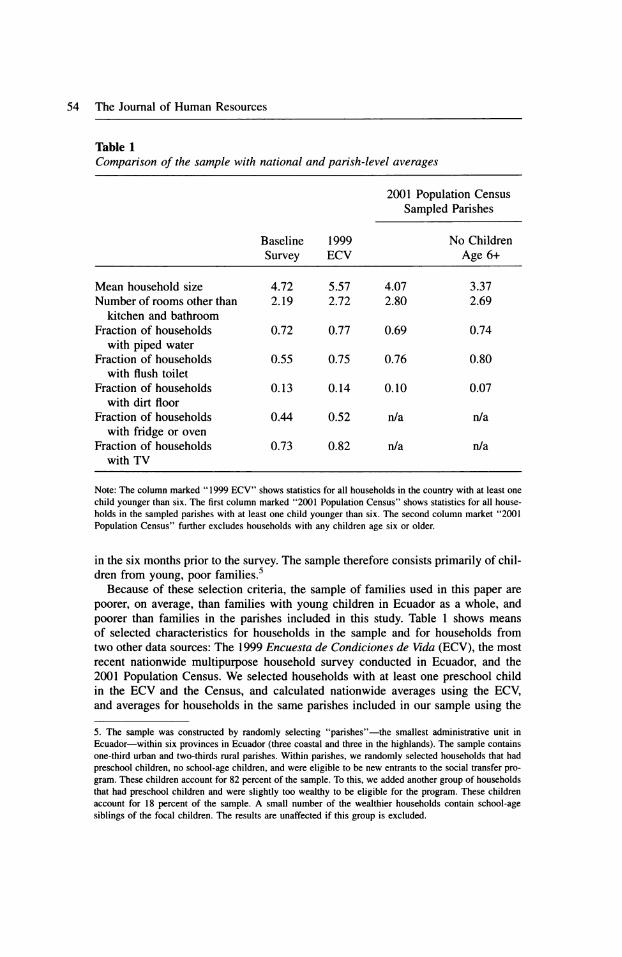
Table 1 Comparison of the sample with national and parish-level averages
2001 Population Census Sampled Parishes
Baseline 1999 No Children Survey ECV Age 6+
Mean household size 4.72 5.57 4.07 3.37 Number of rooms other than 2.19 2.72 2.80 2.69
kitchen and bathroom Fraction of households 0.72 0.77 0.69 0.74
with piped water Fraction of households 0.55 0.75 0.76 0.80
with flush toilet Fraction of households 0.13 0.14 0.10 0.07
with dirt floor Fraction of households 0.44 0.52 n/a n/a
with fridge or oven Fraction of households 0.73 0.82 n/a n/a
with TV
Note: The column marked "1999 ECV" shows statistics for all households in the country with at least one child younger than six. The first column marked "2001 Population Census" shows statistics for all house- holds in the sampled parishes with at least one child younger than six. The second column market "2001 Population Census" further excludes households with any children age six or older.
in the six months prior to the survey. The sample therefore consists primarily of chil- dren from young, poor families.5
Because of these selection criteria, the sample of families used in this paper are poorer, on average, than families with young children in Ecuador as a whole, and poorer than families in the parishes included in this study. Table 1 shows means of selected characteristics for households in the sample and for households from two other data sources: The 1999 Encuesta de Condiciones de Vida (ECV), the most recent nationwide multipurpose household survey conducted in Ecuador, and the 2001 Population Census. We selected households with at least one preschool child in the ECV and the Census, and calculated nationwide averages using the ECV, and averages for households in the same parishes included in our sample using the
5. The sample was constructed by randomly selecting "parishes" - the smallest administrative unit in Ecuador - within six provinces in Ecuador (three coastal and three in the highlands). The sample contains one-third urban and two-thirds rural parishes. Within parishes, we randomly selected households that had preschool children, no school-age children, and were eligible to be new entrants to the social transfer pro- gram. These children account for 82 percent of the sample. To this, we added another group of households that had preschool children and were slightly too wealthy to be eligible for the program. These children account for 18 percent of the sample. A small number of the wealthier households contain school-age siblings of the focal children. The results are unaffected if this group is excluded.

Paxson and Schady 55
Census. A comparison of Columns 1 and 2 indicates that, relative to the national average, households in our sample tend to be worse off: They have fewer rooms, and are less likely to have access to services such as piped water and flush toilets, are more likely to have dirt floors, and are less likely to have assets like a refrigerator, oven, or television. Table 1 also suggests that households in our sample are generally worse off than other households in these parishes, especially when the comparison group is limited to households in the Census who do not have children aged six or older (Column 4).
A subsample of 3,153 children was used for the analyses in this paper: First, we selected 3,854 children who were between the ages of 36 and 71 months at the time of the survey - the TVIP was not administered to younger children.7 Second, because the TVIP is administered in Spanish, we excluded 79 children whose mothers spoke a language other than Spanish (even if they spoke Spanish as well), or who were re- ported by their mothers to speak a language other than Spanish.8 This selection ensures that Spanish was the primary language of children being tested. An addi- tional 552 children were excluded because of missing information on the control var- iables used in the analyses. In most cases, missing values were due to noncompletion of the health assessments, because either children were not present in the household at the time of the interview or the mother refused permission for the health assess- ment, most often for the blood draw required to measure hemoglobin. Finally, we excluded 70 children who were present at the time of the interview but were not ad- ministered the TVIP. A comparison of the mean characteristics of the full sample of children and the subsample of children used in the analysis, presented in Appendix 1 , suggests that differences between the two groups are not large.
B. Measures
Descriptive statistics are shown in Table 2. The outcome measure for the analysis in this paper is a child's score on the TVIP. The TVIP is a test of receptive language that is frequently used to evaluate Spanish-speaking children and adults (Munoz et al. 1989; Umbel et al. 1992). The test is designed to be administered to children as young as 30 months; however, because we anticipated that the test would prove to be difficult for the youngest children in the sample, we administered it only to chil- dren aged 36 months and older. The test is administered by showing the child a series of slides, each of which contains four pictures, and asking him or her to point to or otherwise identify a picture that corresponds to a word stated by the interviewer.
6. The ECV is a household survey, and has the advantage of having more detailed information than the Census. However, it is not large enough to produce reliable statistics for the subsample of parishes we use. 7. The TVIP was designed to be used on children as young as 30 months. However, statistics from the test
publisher indicate that reliability on the TVIP is lower for children younger than 36 months than it is for older children. Further evidence on reliability, validity, and norming procedures are provided at http:// www.agsnet.com/assessments/technical/tvip.asp. 8. On a national scale, 6.1 percent of the population of Ecuador consider themselves "indigenous," and 4.6
percent speak a language other than Spanish (Leon 2003). However, younger adults are less likely than older adults to speak a language other than Spanish, and the provinces covered by the baseline do not have
particularly large concentrations of indigenous populations - especially the three provinces on the coast. For both of these reasons, it is not surprising that our sample includes few families that are not exclusively Spanish speaking.

56 The Journal of Human Resources
Table 2 Descriptive statistics (3,153 children ages 36 to 71 months)
Standard 10th 90th Mean Deviation Percentile Percentile
Standardized TVIP (M= 100, SD= 15) 86.4 17.1 65 110 Indicator: Standardized TVIP is censored 0. 1 1 - - - Child's age (months) 50.29 9.59 38 64 Indicator: Child is male 0.50 - - -
Household socioeconomic characteristics Wealth index 0.06 3.03 -3.87 4.17 Mother's years of education 7.89 3.53 4 12 Mother's age in years 25.54 6.33 20 33 Indicator: Father lives at home 0.71 - - - Father's years of education 7.88 4.09 4 12 Number of adults in household 2.61 1.76 2 5 Indicator: Rural household 0.69 - - -
Child health measures Height-for-age z-score -1.17 1.30 -2.70 0.33 Weight-for-height z-score -0.17 1.24 -1.58 1.24 Hemoglobin level (elevation adjusted) 11.11 1 .44 9.3 12.9 Months breastfed 5.67 3.30 1 12
Parenting measures Number of other children in household 1.14 1.33 0 2 HOME scale: parenting index (higher 2.30 2.32 0 6
values represent harsher/less responsive parenting)
Indicator: Child is read to 0.27 - - -
Later slides are gradually more difficult, and the test stops when the child has made six mistakes in the last eight slides. Test items have been selected for their univer- sality and appropriateness to Spanish-speaking communities, and the test has been widely used in Latin American countries and with Spanish-speaking children in the United States.9
The analysis examines performance on the TVIP for children of different ages, which requires the use of age-normed scores. The results shown in this paper use standardized scores using the norms published by the test developers. These norms set the mean at 100 and the standard deviation at 15 at each age. The main advantage
9. One possible concern with the TVIP is that scores may be sensitive to testing conditions - so that, for example, children may perform more poorly if the home is overly noisy. If testing conditions are correlated with socioeconomic status, this could produce a spurious correlation between SES and test scores. To min- imize problems of this type, interviewers were trained to instruct others who were present to remain quiet and away from the child while the child was being tested.
Paxson and Schady 57
of this approach is that it allows comparisons to be made between the TVIP score of children in the study sample and the score they "should" have at a given age. How- ever, the samples that were used to norm the test are relatively small - 1,219 Mex- ican children and 1,488 Puerto Rican children - and may not be appropriate for the sample of poor Ecuadorean children. For this reason, we also conducted all of our analyses using "within-sample" standardized scores, which were calculated as age-specific z-scores of the raw TVIP test scores. In what follows, we do not present these results, but do note how results using the "within-sample" standardized score differ from those shown here.10
An important feature of the TVIP is that scores can be censored. The norms pro- vided by the test developers give a minimum raw score that can be normed for chil- dren of each age. For children younger than 60 months, normed scores are available for raw scores of one or more. For these children, the normed scores that correspond to a raw score of one declines with age. For example, a raw score of one translates into a normed score of 87 for 36-month-old children, and into a normed score of 57 for those aged 59 months. For children aged 60 months and older, the minimum raw score that can be normed rises with age, from a value of two for 60-month-olds to nine for 71 -month-olds. For these children, the minimum raw score always corre- sponds to a normed score of 55. The existence of these "minimum" scores is a chal- lenge for the analysis. A fraction of children in the sample do not attain the minimum raw score that can be normed. Some of the younger children have a raw score of 0 - indicating that they were not advanced enough to make any progress, even though an attempt was made to administer the test - and some of the older children have raw scores below the minimum that can be normed for their age group.11 A common practice is to exclude children with censored scores from the analysis, but this will generally result in biased parameter estimates. Instead of dropping these children, we assign them the minimum normed score for that age. The score assigned to these children therefore represents an upper bound on the child's language ability. We then adopt estimation methods, discussed in more detail below, that account for this censoring.
Including the censored values, average performance on the TVIP test is low rela- tive to the external norms provided by the test developers: The mean of 86.4 indi- cates that, on average, the children in the sample are nearly one standard deviation below the mean of the group used for norming the TVIP. Eleven percent of children in the sample have censored TVIP scores. When the censored group is excluded, the mean TVIP score rises to 88.1, still well below the normed mean. The average TVIP scores of children in our sample are similar to those of poor Mex- ican children being studied for the evaluation of the Oportunidades program.12
10. The full set of results using both methods of standardizing the scores can be found at the Journal of Human Resources website, at www.ssc.wisc.edu/jhr/ 11. Children are taught how to do the test using two "training" slides that contain very simple items. Chil- dren proceed to the test only after they demonstrate, using the training slides, that they understand the test. Here, a score of zero indicates that the interviewer was unable to teach the child how to use the test, or that the child seemed to understand the training slides but was unable to get any answers correct on the test itself. 12. A recent report on Oportunidades indicates that, on average, children ages 3 to 6 scored at the 17th
percentile on the TVIP (Gertler and Fernald 2004), which corresponds to a standardized score 85.5.

58 The Journal of Human Resources
Explanatory variables fall into one of three broad categories: Socioeconomic var- iables, measures of child health and nutrition, and measures of parenting quality. The socioeconomic variables include a wealth index, parental education, an indicator for whether the father lives at home, the number of adults in the household, and an in- dicator of rural status. To calculate the wealth index, we follow Filmer and Pritchett (2001) and aggregate a variety of household assets and dwelling characteristics by principal components. The wealth index used in the paper is given by the value of the first principal component.13 Similar wealth indices have been used extensively in the medical, demographic, health, and economics literatures.14 As a robustness test, we also considered an alternative measure of household assets, which is a simple count of the number of durable goods in a household (see Case et al. 2004 for a sim- ilar approach). The results are not sensitive to the exact choice of variables included in the index or to alternative ways of aggregating them.
The education of the parents is given in single years. The regressions also include an indicator for whether the child's father lives at home. Twenty-nine percent of the children in the sample have absent fathers. Despite high levels of internal and inter- national migration in Ecuador (World Bank 2004), migration is responsible for rel- atively few absent fathers in our sample. Of all children with absent fathers, only 121 had fathers who were reported to have migrated to another country or province, 30 had fathers who were deceased, and the rest had fathers who were reported to be separated from or to have never resided with the family. In addition to wealth and parental education, the analysis includes the mother's age as a socioeconomic vari- able because it may be an indication of unmeasured labor market potential if women who are more productive choose to postpone childbearing. Maternal age also may have an impact on child health if children born to very young or very old mothers are at greater risk of health problems, and it may be associated with parenting skills. Finally, the number of adults in the household is included. Many families contain older relatives (the average number of adults is 2.6), and children with absent fathers typically live with their mothers and other relatives, such as grandparents.
The paper uses four measures of child health and nutritional status: height- for-age and weight-for-height z-scores, altitude-adjusted hemoglobin levels, and the number of months the child was breastfed. The z-scores were computed using the U.S. Cen- ters for Disease Control (CDC) growth charts. On average, children have a height- for-age z-score that is 1.2 standard deviations below U.S. norms, and 23.4 percent of children in the sample are stunted (height-for-age z- score less than -2). Consis- tent with other evidence on Ecuador, stunting (low height-for-age) is more common
13. Specifically, we took questions in the survey on the type of dwelling, the material of the floor, roof, and walls, and the number of rooms and their uses; the availability of piped water, toilet, shower, and lighting; the type of fuel used for cooking, and the way in which the household disposes of its garbage; and whether the household owned a sewing machine, refrigerator, stove, oven, blender, waffle-maker, iron, radio, TV, stereo, fan, AC unit, bicycle, motorcycle, car, typewriter, computer and washing machine (all of which were asked separately). Where a question had more than two possible responses (for example, "type of floor"), a dummy variable was generated for each response. All of the questions were then aggregated by principal components. 14. For recent examples from the medical, health and demographic literatures, see Mohan (2005), Raso, Utzinger, and Silue (2005), Wagstaff and Watanabe (2003) and Burgard (2002). For examples in the eco- nomics literature, see Sahn and Stifel (2003) for a general discussion, Evans and Miguel (2004) and McKenzie (2005).

Paxson and Schady 59
than wasting (low weight-for-height). Hemoglobin levels were measured in the field using pinprick tests, and values were corrected for elevation with data on the mean altitude of the parish. Elevation-adjustment was done with the CDC guidelines (CDC 1989). The average elevation-adjusted hemoglobin level is 11.1, exactly equal to the threshold value that is often used to define anemia for children in this age range. Us- ing this threshold, 48.0 percent of children in the sample are anemic. Breastfeeding duration is based on retrospective questions asked of the mother for each of her chil- dren; the average duration of reported breastfeeding is 5.7 months.
Three measures of parenting quality are included in the analysis. The first is based on the widely used Home Observation for Measurement of the Environment (HOME) scale (Bradley 1993; Caldwell and Bradley, 1984; Bradley et al. 2001). This is constructed from 1 1 items that are assessed by interviewers at the close of the interview, and measures punitiveness (for example, whether parents yelled at or hit children during the interview), and responsivity to children (for example, whether they responded to and encouraged children in a positive way during the in- terview). Each item is scored as a dichotomous variable; the final scale ranges from zero to 1 1 , with higher values corresponding to less responsive and harsher behavior. (Details of the HOME scale are provided in Appendix 2.) Low values are more com- mon than high values: The mean HOME score is 2.3, 31.8 percent of children have parents with a score of zero, and 85.9 percent have scores of five or less. The second measure of parenting quality is an indicator for whether the child was read to in the week before the survey. Seventy-three percent of the children were not read to, even though only a very small number of mothers in our sample - 56 out of 3,153 - were illiterate. Finally, the analysis includes a variable for the number of other children in the household. More children in the household may imply less parental time per child.15 Close child spacing, resulting in more children, also may have negative implications for child health and development.
III. Methods
The analysis starts by specifying the TVIP score to be a function of the child's age, gender, and a set of child and household characteristics that may influence test scores:
( 1 ) TVIPia = da + X I (Male) + Xia p + &ia where TVlPia is the TVIP score of child i of age a, aa is an age fixed effect (in months), X captures systematic differences in test scores between boys and girls, and Xia is a set of child and household characteristics. We begin by showing results when Xia includes only SES, and then add measures of child health and the parenting the child receives.
The age fixed effects in Equation 1 allow the TVIP score to vary in a flexible way across children of different ages, but impose the restriction that associations between
15. See Blake (1989) and Parcel and Menaghan (1994) on "resource dilution" caused by additional children in a household.
60 The Journal of Human Resources
the variables included in Xia and the TVIP score do not vary with the age of the child.16 This restriction may be unrealistic if SES has cumulative effects on cognitive development - so that longer "exposures" to poverty or parents with low levels of education have increasingly large effects on test scores. The sample is not large enough to allow the coefficients included in P to differ in a completely flexible way for each month of age. Instead, we estimate Equation 1 separately for younger children aged 36 to 53 months, and older children aged 54 to 71 months, and test for differences in the coefficients in the Xia across the two age groups.
The results below report estimates of Equation 1 based on three estimation meth- ods: OLS, censored normal (maximum likelihood) and censored least absolution deviation (CLAD) techniques. OLS estimates are likely to be biased due to the presence of censored test scores. Typically, censoring leads to OLS estimates that are biased toward zero, since variation in the censored test score masks the true effects of independent variables on actual cognitive ability.
Models that explicitly account for censoring can be specified as follows:
V (2) ; rvm = TVIPia if ** + XI(Male) + X«P + 8<« > c° V ; rvm ia = ca if aa + k I (Male) + Xfap + eto < ca
where TVIP°ia denote the observed value of verbal ability, TVIPia denote the true value (as expressed by Equation 1), and ca is the censoring threshold - the minimum normed score for children of age a. Censored normal estimates of Equation 2 are consistent only if the error term is normally distributed and homoskedastic. There is no reason to believe that these conditions will be fulfilled. The CLAD estimates represent a nonparametric alternative to maximum likelihood. The CLAD estimation procedure is iterative: First, Equation 1 is estimated as a quantile (median) regres- sion, using the full sample including censored observations. Then, observations with predicted values of the dependent variable below ca are "trimmed" from the sample, and the quantile regression is reestimated. The process of trimming and estimating is repeated until the parameter estimates converge - see Powell (1984, 1986) and Chay and Powell (2001); standard errors are bootstrapped using 100 replications. CLAD estimates have a clear advantage over the censored normal estimates - they assume only that the error term has a median of zero, and will be consistent even if errors are neither normal nor homoskedastic.
Although the results provide useful information on the associations between test scores, SES, child health, and parenting quality, they must be interpreted with cau- tion. As is stressed by Todd and Wolpin (2003) in an article on cognitive develop- ment, strong assumptions are required to draw causal inferences from results based on observational data, especially from a single cross-section. While these issues are well understood, several are worth highlighting.
16. We include age effects for the exact month of age up to 59 months, and then include age effects for whether the child was 60 or 61 months, 62 or 63 months, 64 or 65 months, 66 or 67 months, 68 to 69 months, and 70 or 7 1 months. We group the age effects for older children because there are relatively small numbers of children at the highest ages, and we had convergence problems with the nonparametric models presented below when a full set of age effects were included. Two-month age groups for older children were chosen because, for these children, the age norms for the TVIP are the same for children within each of these groups (for example, the norms for children ages 60 and 61 months are identical).
Paxson and Schady 61
First, it is possible that associations between measures of SES (as well as other variables) and test scores are driven by unobserved variables that influence both SES and test scores. For example, parents with higher cognitive ability may achieve higher SES, and their children may inherit their higher ability, producing a spurious correlation between child cognitive ability and SES. There is a large literature on this issue, mainly from industrialized countries, that relies on studies of twins, siblings, or adopted children to tease apart the effects of SES and innate ability (Plomin 1994; Petrill 2003).
17 The evidence to date indicates that both genetic and environmental factors contribute to child cognitive ability, and that maternal warmth and socioeco- nomic status are among the environmental factors that are important (Petrill and Deater-Deckard 2004).
Second, the fact that cognitive development is a cumulative process complicates the interpretation of the associations, especially for time-varying variables. A find- ing, for example, that low levels of hemoglobin are negatively associated with test scores of four-year-old children would not necessarily indicate that this is a "critical age" at which iron deficiency has a large effect on development. The reason is that low hemoglobin at age four is likely to be correlated with low levels of hemoglobin at earlier ages (which have not been measured), and the association at age four could reflect the effects of iron deficiency at earlier ages. Complete histories of hemoglobin levels (and of the other time- varying factors we observe) would be required to iden- tify "critical periods."
Third, it may be that the treatment that children receive from their parents is af- fected by their cognitive ability. Economic models predict that parents adjust invest- ments in "inputs" to child development in response to the perceived ability of the child (Becker and Tomes 1976). These investments could be "compensatory" - children with slow cognitive development could receive more and better food, or ex- tra parental attention - or "complementary" - more resources could be devoted to the brightest children. In either case, associations between the measures of child health and parenting and test scores could in part be driven by parents' responses to their children's cognitive ability. Again, with only one cross-section of data it is not possible to determine whether this is so.
IV. Results
A. Nonparametric Analyses
We begin with a descriptive analysis of how the standardized TVIP scores vary across children of different ages. These results identify features of the data that will be investigated in a multivariate framework, and highlight the importance of ac- counting for censoring. As shown in the top left-hand panel of Figure 1, the mean age-normed TVIP score declines from close to 95, at age 36 months, to less than 85, between 54 and 60 months, and flattens out thereafter. This decline in the mean
17. Only 336 of the 2,81 1 households represented in the sample have more than one child between the ages of 36 and 71 months, a sample size too small to estimate models with sibling effects. Even fewer house- holds have multiple children within the younger age group (50 households) or older age group (22 house- holds).

62 The Journal of Human Resources
I
Paxson and Schady 63
is accompanied by an increase in dispersion. The standard deviation of the TVIP score, shown in the top right panel of Figure 1 , rises from eight for the youngest chil- dren, to nearly 25 for the oldest children. Given that the sample is fairly homoge- neous - most children are from poor households - it is not surprising that the standard deviation for children at the youngest ages is below 15, the value in the ref- erence population that was used to norm the test. However, the homogeneity of the sample cannot account for the increasing dispersion with age that is observed, which raises some concerns about the external age-standardization of the test score. An- other way to view the increasing dispersion of the test scores is to examine percen- tiles. The bottom left panel of Figure 1 shows the 90th, 50th, 25th, and 10th percentiles of the TVIP scores at each age. The 90th percentile scores are relatively constant with age, and there are slight declines in the median. Scores for children at the 25th and 10th percentiles of the distribution decline sharply with age.
The decline in the mean and the increasing dispersion with age in the standardized TVIP score may both in part be driven by censoring. As shown in the bottom right panel of Figure 1, nearly 25 percent of children at age 36 months have censored scores, which means that (for this age group) nearly a quarter of children were unable to answer a single question correctly. The prevalence of censoring declines from age 36 to age 50 months, and then increases again after 60 months, when the minimum raw score that can be normed rises. Censoring makes it impossible to examine age patterns in test scores among children with very poor language ability. Indeed, the 10th percentile line in the bottom left panel of Figure 1 simply traces out the mini- mum normed score possible for children aged 36 to 50 months and 66 to 7 1 months, since for these age groups the fraction of children with censored scores exceeds 1 0 percent. Because these censored scores contribute to the mean, the true age pattern in verbal ability in the absence of censoring could be quite different from that depicted in the top left panel of Figure 1. The 25th, 50th, and 90th percentiles are unaffected by censoring throughout the age range, and the gap between the 25th and 90th per- centiles also increases with age. However, while censoring is not a concern for com- parisons of the 90th-25th percentile gap in scores, it is not clear whether the apparent increase in the dispersion of test scores with age is driven by a genuine increase in the dispersion of underlying cognitive development or by inappropriate conversion of the raw scores into age-normed scores. The results using the "within sample" stan- dardization, discussed below, provide information on this issue.
As a first step to analyze the relationship between test scores, SES, and age Figure 2 shows medians of the TVIP score at each age after splitting the sample by wealth and parental education. In the top panel, the sample of children is broken down into four wealth quartiles. These panels show little difference in the median TVIP scores across wealth groups at young ages, and large differences at older ages. None of the medians are contaminated by censoring - for every age-wealth group combina- tion, the median exceeds the minimum score. The middle panels present results for four schooling categories of a child's mother, corresponding to complete second- ary school or higher, incomplete secondary, complete primary, and incomplete pri- mary or less, while the lower panels correspond to a similar breakdown of the sample by the years of schooling of a child's father. These panels show an increasing dispersion in scores across children whose parents have different amounts of educa- tion. The pattern is more apparent with mother's education than father's education.

64 The Journal of Human Resources
Figure 2 Median TVIP Scores by Wealth and Parental Education
Censoring affects a handful of cells - marked on the graphs - but cannot account for the general patterns in the data.18
1 8. The medians for the children 36 and 37 months of age with mothers with five years of schooling or less, as well as those for children 36 and 45 months of age and fathers with five years of schooling or less are also censored when the within-sample standardization is used, as the median number of test items answered correctly was zero.

Paxson and Schady 65
Figure 2 suggests that there are socioeconomic gradients between child cognitive development and household SES. Children in households with more wealth, and with parents who have more schooling, have higher average scores on the TVIP than other children. Moreover, the "protective" effect of wealth and parental education appears to increase with the age of the child. In households in the highest wealth quartile, or households where the parents have completed secondary school or more, the TVIP score of older children is higher than the corresponding score for younger children. By contrast, in other households the scores are unchanged or fall with the age of the child. One compelling explanation for these patterns is that the advantages conferred by higher SES are cumulative. However, we discuss possible alternative explanations below, including the fact that the observed age effects could in fact be cohort effects, as well as the possibility of differences in the samples of younger and older children.
B. Socioeconomic status and cognitive development
We next turn to multivariate regressions to analyze the relationship between SES and performance on the TVIP. Table 3 presents the results of regressions of the TVIP score on a number of measures of household SES. We start by showing results from a probit regression of an indicator for whether the child's score was censored. The results, shown in Column 1, indicate that censoring is not random: Poorer children and children with mothers who have fewer years of schooling are more likely to be censored, whereas children whose fathers live at home are less likely to have cen- sored scores. Overall, these results support the idea that regression results that ignore censoring are likely to be biased.
The second through fifth columns in Table 3 show OLS, censored normal, and CLAD estimates. Two variants of OLS are shown: The first restricts the sample to children whose scores are not censored, and the second includes the censored values, with censored scores set equal to ca. Several key points emerge from these results. First, the different estimation methods yield similar qualitative patterns. The test per- formance of boys and girls is indistinguishable; all else equal, children from rural households do somewhat better than children from urban households; and children with wealthier families, more educated and older mothers, and more educated fathers have higher test scores. The number of adults in the household is associated with lower scores, whereas the TVIP is not significantly associated with the father's place of residence. These same patterns hold when we use the "within-sample" standard- ized TVIP scores.
Second, although the signs and significance levels of the coefficients are similar across specifications, the magnitudes differ. For three key measures of SES - wealth, maternal education, and paternal education - the OLS coefficients are generally smaller than the censored normal or CLAD estimates. For example, the coeffi- cient on the wealth index is 36 percent larger in the CLAD than in the full-sample OLS.19
Third, estimates of the associations between measures of SES and the TVIP score are reasonably large. Using the CLAD estimates, which are the least likely to be
19. The results using within-sample standardized test scores show somewhat smaller differences between the OLS and CLAD estimates, most likely because older children were less likely to be censored.

66 The Journal of Human Resources
J ddcodcNdddddd^dddd^ ifr w qj >w >*-• w w ^_^ >*^ ^ | ^ m m 73
I
_- oinON|Ocn'Hoq'H^qio^^'H\q(Nin 2
c & a I
I I 3 ddfnd(NdddddddcidcidHr «
8 I ^ o
s i "S ________ 1 S ^ir)Oina^^qNq(N»o^qt(NO o c ddcnd^ddddddddddd00^ ^ J> g |wwwww,ww| w^ ^ J>
'■GO <u
go g 5 1 ^ CL)
•^^ ff
| | ? C '- ̂OO'"H'"HOOOO O OJ »-h O O O O i/-\ h ^j || ppQOOpOpOOOQpppQ^ S "^j dddcSddddcJddcScJdddcrr w^ -o •2 C |W|w|w|w,w,w,w w^
| -o
^ *S §
1 £ B- ^ 8 .2
1 si. II § S - t3 ac c8
P .S * * .£ W T3 | ^ ^ ^ _e "u "uh ^ .M i2 « 3-o
II njHHi _e
i

Paxson and Schady 67
biased, the coefficients in Table 3 indicate that a one-standard deviation increase in the wealth index is associated with an 8.5 point increase in the TVIP score. A one- standard deviation change in maternal (paternal) education is associated with an in- crease in the score of 3.4 points (1.6 points) using the external norms. Because wealth and parental education are positively correlated, these parameter estimates imply large differences in test scores across children from households with "low" and "high" SES. For example, a child whose family falls at the 90th percentile for wealth, maternal education, and paternal education is predicted to have a score that is 33 points higher than a child at the 10th percentile for each of these variables. Similar results are obtained from estimates based on the within-sample standardization.
An examination of the estimated age coefficients from the different models pro- vides information on the effect of censoring on age patterns in test scores. As dis- cussed above, the sharp declines in the mean test scores from 36 to 57 months could simply reflect that fewer older children in this age range have censored scores; similarly, the "flat" test score after 60 months could be because the minimum normed score rises after 60 months of age, and an increasingly large fraction of chil- dren are censored. Figure 3 graphs out the age effects from the full-sample OLS, cen- sored normal, and CLAD models. Coefficients have been normalized to zero at the youngest age. The results suggest that the patterns that are observed - declining test scores from 36 to 57 months, and slight increases thereafter - are not driven by cen- soring. The censored normal and CLAD estimates are similar, and show a slightly smaller decline with age from 36 to 57 months than the OLS estimates. However, these results indicate that, all else equal, the test scores of 5-year-olds are roughly 10 points lower than those of three-year-olds.
A plausible explanation for this decline is that SES has a cumulative effect on child cognitive development, so that poorer children fall increasingly behind their better-off counterparts.20 To investigate this hypothesis, we split the sample into younger children - those aged 36 to 53 months at the time of the survey - and older children - aged 54 to 71 months, and reestimate the CLAD models in Table 3. The results in Table 4 indicate that the associations between some measures of SES and cognitive development become larger with age. The coefficient on wealth is two-and- a-half times larger for the sample of older children in the CLAD models, and tests of the equality of coefficients (not shown) indicate that this difference is significant. The coefficients on maternal age and education and the rural dummy are also larger for the older children, although these changes are generally not significant. One excep- tion to the general pattern is paternal education, which is significantly associated with the TVIP among younger but not older children.
The finding that economic gradients are larger for older children could be due to age effects or cohort effects. Because the analysis in this paper is based on a single cross-section, older children in the sample were born in earlier years. The decrease in the mean score with child age that is observed could therefore be a result of differ- ences in aggregate conditions experienced by children born at different times. The fact that the association between the TVIP score and wealth is larger for older chil- dren in our sample also could be a result of changing conditions that affected some
20. Similarly, Case, Lubotsky, and Paxson (2002) use data from the United States to show that associations between family income and child health increase as children age.

68 The Journal of Human Resources
1 5 §
1 1
§
I •S

Paxson and Schady 69
Table 4 TVIP scores and household socio-demographics, by age group
Ages 36-53 months Ages 54-71 months
Male 0.98 -0.09 (0.71) (1.47)
Rural 1.58 7.27 (0.82) (1.90)
Wealth index 1.56 3.80 (0.23) (0.31)
Mother's education 0.48 1.21 (0.14) (0.28)
Mother's age 0.03 0.17 (0.08) (0.13)
Father lives at home 1 .00 -1.01 (0.97) (2.59)
Father's education 0.49 0.43 (0.15) (0.28)
# adults in HH -0.60 -1.05 (0.34) (0.66)
AT 1,988 1,165 Trimmed N 1,796 1,118
Note: CLAD estimates with bootstrapped standard errors (100 replications). The numbers in parentheses are standard errors. All regressions include a set of indicators for months of age.
groups more than others - for example, if an economic downturn had a larger impact on households with low socioeconomic status. Changing economic circumstances in Ecuador in the late 1990s and early 2000s give some plausibility to this interpreta- tion. A major banking and financial crisis in 1999, coupled with flooding and land- slides in the coast that resulted from the El Nino weather shock, led to a contraction of per capita GDP in 1999 of 8.5 percent. Shortly thereafter, the Ecuadorean govern- ment adopted the U.S. dollar as its national currency (World Bank 2004). Growth has resumed since then, although it has generally been sluggish - per capita GDP in- creased by 0.7 percent in both 2001 and 2002, by 1.2 percent in 2003, and by 4.5 percent in 2004.
To investigate whether the recession in 1999 is driving our results, we take advan- tage of the fact that the survey was conducted over a one-year period. For children between the ages of 48 and 56 months at the time of the survey, we observe some who were born before the crisis was over and some who were born afterward. We do find some evidence that earlier-born children have lower TVIP scores, possibly due to worse economic conditions. Using the sample of children ages 48 to 56 months old, we estimated CLAD regressions of the TVIP score on a set of age dummies and an indicator for whether the child was born prior to January 2000. Earlier-born

70 The Journal of Human Resources
Figure 4 Median TVIP Scores by Wealth and Parental Education, Children Born after 1999.
children are estimated to have TVIP scores six points lower than later-born children (standard error of 2.3). However, when we restrict our sample to children born after the recession ended, all of whom experienced similar macroeconomic conditions since birth, we still find that the associations between the TVIP score and socioeconomic status become stronger with age. Figure 4 presents medians of the TVIP score by wealth and parental education for children born after 1999. The pat- terns in Figure 4 are very similar to those in Figure 2, which uses the full sample.

Paxson and Schady 71
Although it is not possible to carefully disentangle age and cohort effects with a single cross-section of data, this suggests that the patterns in the data are most likely a result of age effects.
Another possible concern with the estimates in Table 4 is related to possible differ- ences between the samples of older and younger children that result from the sam- pling framework. Recall that, by construction, the vast majority of children in the sample do not have school-aged siblings. Younger children in the sample generally have younger mothers than older children. Plausibly, then, differences in the bivariate associations between SES and cognitive development for younger and older children, such as those presented in Figures 2 through 4, could reflect differences in maternal age. The regressions in Tables 3 and 4 include age of the mother as a control. How- ever, conditional on mother's age, younger children are generally more likely than older children to have older siblings. As a result, the sample of younger children is a more selected group than the sample of older children. Selection may be nonran- dom, so that the young children may be more likely to have parents who want smaller families, perhaps because the mothers have higher unobserved labor earnings or a greater taste for child quality over quantity. If this is the case, the age gradient in TVIP scores could be picking up unobserved SES or some other omitted variable through sample selection.21
In an attempt to address this concern, we compare the observable characteristics of households with younger and older children, with and without controls for mother's age. Specifically, Table 5 presents the results of regressions of six measures of house- hold socioeconomic status on an indicator of whether the child is between 54 and 71 months old. The coefficients shown in the first column are simply differences in the mean of each socioeconomic measure between older and younger children. The sec- ond column shows mean differences adjusting for maternal age. The results indicate that, when no adjustment is made for maternal age, there are significant differences in household wealth between older and younger children; however, the difference in wealth is no longer significant once maternal age is included as a control. Children in the younger sample are less likely to live in rural areas, a result for which we have no ready explanation. However, we find no significant differences in parental education, whether or not the father lives at home, or in the number of adults in the household, regardless of whether adjustments are made for maternal age. The results in Table 5 are not conclusive, as there could still be unobservable differences between the two samples. However, they suggest that sample selection is unlikely to be the main rea- son for the fact that the associations between SES and test scores become larger with child age.
C. Health, parenting, and cognitive development
The next set of results examines how child health and parenting quality are related to test scores. The focus is both on the effect of these variables as well as on the extent to which the associations between cognitive development and SES can be explained by the inclusion of health and parenting measures. It seems plausible that health and parenting are routes through which wealth and parental education influence child- ren's cognitive development. Wealth is correlated with both measures of child health
21. We thank an anonymous referee for pointing this out to us.
72 The Journal of Human Resources
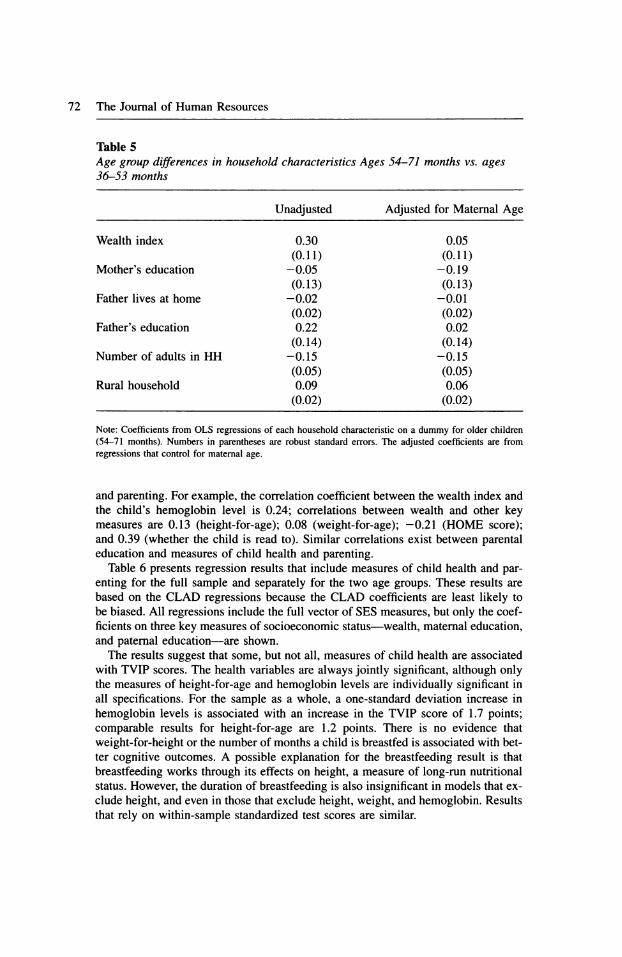
Table 5 Age group differences in household characteristics Ages 54-71 months vs. ages 36-53 months
Unadjusted Adjusted for Maternal Age
Wealth index 0.30 0.05 (0.11) (0.11)
Mother's education - 0.05 -0.19 (0.13) (0.13)
Father lives at home -0.02 -0.01 (0.02) (0.02)
Father's education 0.22 0.02 (0.14) (0.14)
Number of adults in HH -0. 15 -0. 15 (0.05) (0.05)
Rural household 0.09 0.06 (0.02) (0.02)
Note: Coefficients from OLS regressions of each household characteristic on a dummy for older children (54-71 months). Numbers in parentheses are robust standard errors. The adjusted coefficients are from regressions that control for maternal age.
and parenting. For example, the correlation coefficient between the wealth index and the child's hemoglobin level is 0.24; correlations between wealth and other key measures are 0.13 (height-for-age); 0.08 (weight-for-age); -0.21 (HOME score); and 0.39 (whether the child is read to). Similar correlations exist between parental education and measures of child health and parenting.
Table 6 presents regression results that include measures of child health and par- enting for the full sample and separately for the two age groups. These results are based on the CLAD regressions because the CLAD coefficients are least likely to be biased. All regressions include the full vector of SES measures, but only the coef- ficients on three key measures of socioeconomic status - wealth, maternal education, and paternal education - are shown.
The results suggest that some, but not all, measures of child health are associated with TVIP scores. The health variables are always jointly significant, although only the measures of height-for-age and hemoglobin levels are individually significant in all specifications. For the sample as a whole, a one-standard deviation increase in hemoglobin levels is associated with an increase in the TVIP score of 1.7 points; comparable results for height-for-age are 1.2 points. There is no evidence that weight-for-height or the number of months a child is breastfed is associated with bet- ter cognitive outcomes. A possible explanation for the breastfeeding result is that breastfeeding works through its effects on height, a measure of long-run nutritional status. However, the duration of breastfeeding is also insignificant in models that ex- clude height, and even in those that exclude height, weight, and hemoglobin. Results that rely on within-sample standardized test scores are similar.

Paxson and Schady 73
Table 6 TVIP scores, child health and parenting: CLAD estimates
Full 36-53 mo 54-71 mo
Wealth index 2.45 1.48 3.03 (0.19) (0.19) (0.29)
Mother's education 0.57 0.21 0.80 (0.17) (0.15) (0.27)
Father's education 0.27 0.31 0.46 (0.13) (0.12) (0.26)
Height-for-age z-score 0.95 1.00 1.01 (0.37) (0.34) (0.74)
Weight-for-height z-score 0.46 0.35 0.04 (0.38) (0.31) (0.59)
Hemoglobin level 1.21 0.75 1.70 (0.33) (0.26) (0.57)
Months breastfed 0.15 0.15 0.24 (0.16) (0.13) (0.28)
Number of other children -2.11 -0.72 - 1 .96 (0.51) (0.43) (0.82)
HOME score -0.83 -0.52 -0.77 (0.22) (0.17) (0.35)
Indicator: Child is read to 4.18 3.38 5.80 (1.06) (1.05) (1.95)
Tests of joint significance: Health measures 0.000 0.000 0.000 Parenting measures 0.000 0.000 0.000 Observations 3,153 1,988 1,165 Trimmed sample 2,598 1,762 1,105
Note: Numbers in parentheses are bootstrapped standard errors, computed with 100 replications. All regres- sions include maternal age and the number of adults in the household, as well as indicators for the child's sex and age (in months), rural residence, and whether the father lives at home.
The results indicate that parenting quality is associated with child cognitive devel- opment. Children who live in households with fewer siblings have higher test scores, as do children whose parents receive lower (better) HOME scores, and children who are read to. In the full sample, a one-standard deviation in the HOME score increases the TVIP score by 1.9 points; comparable results for the number of other children in the household are 2.8 points. Finally, children who are read to have scores that are 4.2 points higher. Again, the results that use within-sample standardization are similar.
The estimates in Table 6 can also be used to assess the extent to which the meas- ures of child health and parenting "account for" the associations between test scores and SES. Inclusion of the measures of child health and parenting reduces the coef- ficient on wealth by relatively little - only 13 percent. Larger changes are observed in the coefficients on parental education. The coefficient on maternal education drops

74 The Journal of Human Resources
by 40 percent when health and parenting measures are included, and that for paternal education drop 29 percent. It is also possible to run regressions that include measures of SES and only the child health or the parenting measures. The results from these (unreported) regressions suggest that the association between parenting and parental education is particularly important: For example, the coefficient on maternal educa- tion falls by 21 percent when the parenting measures are included, while the coeffi- cient on paternal education falls by 41 percent. Comparable results from regressions that include only the child health measures imply reductions of 21 percent and 16 percent, respectively. These comparisons suggest that parenting behavior may be an important pathway from parental education to cognitive development. However, even controlling for child health and parenting there are still large associations between measures of SES and cognitive development.22
D. Comparisons between Ecuador and the United States
The results discussed above indicate that there is a robust association between SES and child cognitive development in Ecuador. The gradient between SES and test scores appears to become stronger with child age, a result that is particularly clear for the measure of household wealth. Inclusion of a variety of controls for child health and parenting do little to reduce the association between child cognitive development and wealth. To the extent that wealth has a causal effect on children's cognitive development, its effects must be working through aspects of the child's en- vironment that we do not measure. This stands in contrast with results for the US, where a large fraction of the association between child development and income, in- cluding the relationship between income and child performance on the PPVT, the English test on which the TVIP is based, can be accounted for by differences in the home environment. For example, Berger and colleagues (2005) find that the as- sociation between family income and the PPVT scores of three-year-old children vanishes with the inclusion of detailed measures of parenting, the home environment, and the mother's score on the PPVT.
To extend the comparison between the results for Ecuador and the US, we draw on data from the National Longitudinal Survey of Youth (NLSY), a panel of 12,686 individuals that were aged 14 to 22 in 1979. In 1986, the NLSY began collecting data on the children of the 6,283 women in the original sample, including a range of in- formation on cognitive development and health. By design, the NLSY oversampled the poor, which should be kept in mind in interpreting the means of these variables. For consistency with the main results on Ecuador, we examine patterns in the PPVT in the NSLY, using children aged 36 to 71 months. The PPVT has been administered to NLSY children every two years since 1986, but we restrict the analysis to the four survey waves during 1992-1998 because the samples from other years may be less representative.23 Further, we consider only observations where both sections of the survey (mother and child) were conducted in English, leaving us with a sample of 2,255 children.
22. We experimented including interactions between the health and parenting variables, but none were found to be statistically significant. 23. PPVT scores from survey waves before and after 1992-1998 suffered from at least one of the following problems: censored values were coded such that left-censoring was indistinguishable from right-censoring; the target test population was aged 4+, rather than 3+; and children tested in the early waves had unusually young mothers, making their scores potentially less representative.
Paxson and Schady 75
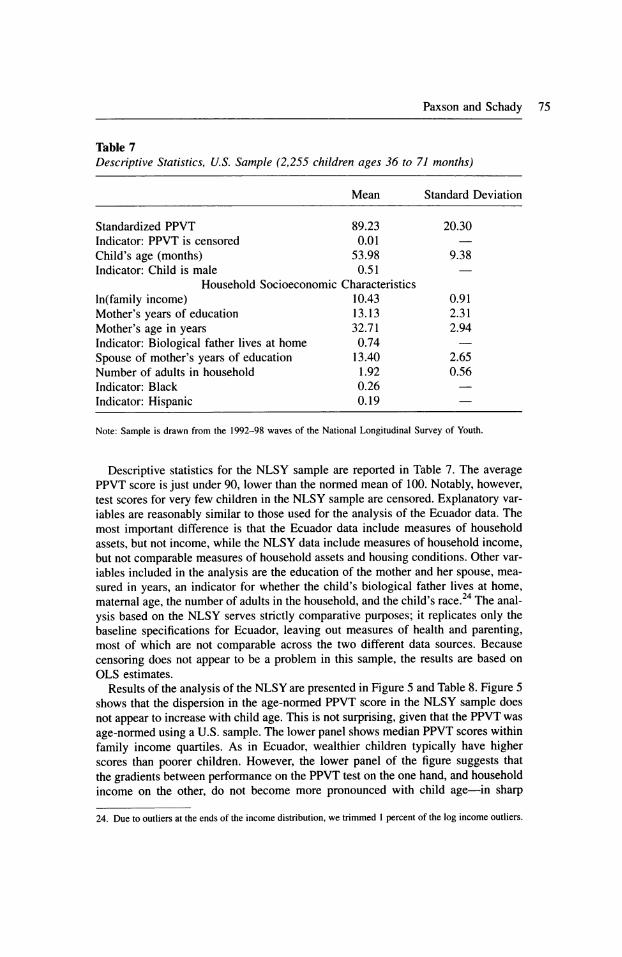
Table 7 Descriptive Statistics, U.S. Sample (2,255 children ages 36 to 71 months)
Mean Standard Deviation
Standardized PPVT 89.23 20.30 Indicator: PPVT is censored 0.01 - Child's age (months) 53.98 9.38 Indicator: Child is male 0.51 -
Household Socioeconomic Characteristics ln(family income) 10.43 0.91 Mother's years of education 13.13 2.31 Mother's age in years 32.71 2.94 Indicator: Biological father lives at home 0.74 -
Spouse of mother's years of education 13.40 2.65 Number of adults in household 1 .92 0.56 Indicator: Black 0.26 - Indicator: Hispanic 0.19 -
Note: Sample is drawn from the 1992-98 waves of the National Longitudinal Survey of Youth.
Descriptive statistics for the NLSY sample are reported in Table 7. The average PPVT score is just under 90, lower than the normed mean of 100. Notably, however, test scores for very few children in the NLSY sample are censored. Explanatory var- iables are reasonably similar to those used for the analysis of the Ecuador data. The most important difference is that the Ecuador data include measures of household assets, but not income, while the NLSY data include measures of household income, but not comparable measures of household assets and housing conditions. Other var- iables included in the analysis are the education of the mother and her spouse, mea- sured in years, an indicator for whether the child's biological father lives at home, maternal age, the number of adults in the household, and the child's race.24 The anal- ysis based on the NLSY serves strictly comparative purposes; it replicates only the baseline specifications for Ecuador, leaving out measures of health and parenting, most of which are not comparable across the two different data sources. Because censoring does not appear to be a problem in this sample, the results are based on OLS estimates.
Results of the analysis of the NLSY are presented in Figure 5 and Table 8. Figure 5 shows that the dispersion in the age-normed PPVT score in the NLSY sample does not appear to increase with child age. This is not surprising, given that the PPVT was age-normed using a U.S. sample. The lower panel shows median PPVT scores within family income quartiles. As in Ecuador, wealthier children typically have higher scores than poorer children. However, the lower panel of the figure suggests that the gradients between performance on the PPVT test on the one hand, and household income on the other, do not become more pronounced with child age - in sharp
24. Due to outliers at the ends of the income distribution, we trimmed 1 percent of the log income outliers.

76 The Journal of Human Resources
Figure 5 PPVT Percentiles and Median Scores by Income Percentile, United States (NLSY)
contrast with the results for Ecuador. Graphs that use maternal and paternal educa- tion (not shown) are similar to that for income. These patterns are confirmed in Table 8. There are significant associations between performance on the PPVT and family income, maternal education, and the education of the spouse. In none of these cases, however, is there evidence that these associations are significantly stronger for older children.
These results are consistent with other evidence from the US. For example, one study that used data from the NLSY and another data source found that differences in test scores between poor and nonpoor children changed little from ages 3 to 8 (Smith, Brooks-Gunn and Klebanov 1997). However, some studies of children who span a wider age range do find that income gradients in cognitive and achievement

Paxson and Schady 77
Table 8 PPVT scores and socioeconomic status in the United States
Aged 36-53 Aged 54-71 Full Sample Months Months
Child is male -1.099 -3.054 0.575 (0.722) (0.991) (1.018)
ln(family income) 1.463 1.524 1.449 (0.500) (0.718) (0.672)
Mother's years of education 1.564 1.308 1.763 (0.200) (0.273) (0.274)
Mother's age in years -0.205 -0.137 -0.260 (0.134) (0.218) (0.169)
Father lives at home 1 .076 - 1 .957 3. 1 88 (1.859) (3.313) (2.094)
Spouse's years of education 1.153 1.015 1.298 (0.181) (0.251) (0.249)
Number of adults -1.714 -1.812 -1.656 (0.802) (1.121) (1.070)
Black -16.013 -16.361 -15.832 (0.966) (1.302) (1.367)
Hispanic -11.671 -13.234 -10.496 (1.051) (1.527) (1.397)
Observations 2,255 1,077 1,178
Note: OLS estimates using NLSY data, with 1 percent of ln(family income) outliers trimmed. Numbers in
parentheses are standard errors clustered at the child level. All regressions include a set of indicators for months of age.
test scores increase with age. For example, Lubotsky (2001) uses data on children aged 3 to 12 from the first Child Development Supplement of the Panel Study of Income Dynamics, and finds that income gradients are larger for older children.25 Together, these results suggest that the increases in economic gradients in cognitive outcomes we observe in Ecuador occur at later ages in the US.
V. Conclusion
This paper presents evidence of strong associations between socio- economic status and the TVIP scores of preschool children in Ecuador. These gra- dients are larger for older children, especially for household wealth. No such patterns are found in performance of a sample of U.S. children on the PPVT, a com- parable test. Our results also suggest that both child health - in particular, iron
25. The literature in the United States has also documented increasing gaps in test scores with age between black and white children. See, for example, Cameiro, Heckman, and Masterov (2005) and Fryer and Levitt
(2004).
78 The Journal of Human Resources
deficiency and child height - and the quality of parenting are associated with cogni- tive development. Parenting quality, a topic that has received little attention in the research in developing countries, accounts for a substantial share of the association between parental education and cognitive development.
Our findings are based on a single cross-section of observational data, and inter- pretation of the associations we report is therefore subject to some uncertainty. To the extent that the relations are causal, they suggest that a three-pronged approach may be useful for improving cognitive development among young children in devel- oping countries. First, programs that directly raise household SES may have high returns in terms of child development. Second, improving children's health should be given high priority, both for its own sake and because of its association with cog- nitive outcomes.26 Third, programs and policies that increase the amount of cognitive stimulation children receive and improve the quality of their home environments may also be valuable. Only a small number of randomized control trials have examined interventions in developing countries that aim at improving child health, parenting, and early stimulation through home-based or center-based interventions (McKay et al. 1978; Waber et al. 1981; Grantham-McGregor et al. 1991 and 1997; Powell et al. 2004; see also Behrman et al. 2004 for an observational, nonexperimental study from Bolivia). Several of these interventions have yielded promising results. In our sam- ple, only a minority of children were read to, even though the fraction of parents who are illiterate was very small. Controlling for other characteristics, these children had significantly higher performance on the TVIP. These findings suggest there may be large returns to programs that improve parenting quality. More generally, our re- search underscores the need to understand how both child health and the home en- vironment interact with socioeconomic status in determining cognitive development.
26. For evidence on the relationship between protein supplementation in childhood and cognitive outcomes in adulthood see Brown and Pollitt (1996) and Behrman et al. (2005); on iron supplementation, see the re- view in Grantham-McGregor and Ani (2001); on helminth infection, see Dickson, Awasthi, and Williamson (2000).

Paxson and Schady 79
. . co co co co co co co co r** co co co co co co co co co o J3 .
in >n m m in >n <n in x in >n inm»n»n *n v~) *r>
bbj£-£ co"co^co*^co^ co^co^co^co^rico^^ co'co^co*^co^ co^co*^0^
w U u J2 '■£**- 1
•7c7?!> C On ̂ On O vOONTf'-^OO'^ON f^ r*» •- ' r^ Tf O 00 C £* cd cr i-nfNjin q oq in h« oq \o vq -h^^^o ~ co so "C
4? vd o o o 6 K >n d t^ H d ^o^«n ^ n d •" ,< oo »n cn II*-1 2
•3 c o
^ CM CM CM <N CM CM CM CM CM CM CM Tt (N r^ VO CM <<t 00 §
w) o ^ ^ ^ ^ ^ ^ ^ ^ ^t ̂ ^ ^ ^ ^ ^ ^ ^ ^ "3 G CO CO CO CO CO CO CO CO CO CO CO CO CO CO CO CO CO CO £3 '55 8 § w •- f " I ^2 c: rfcNcoo n m m ^ ^o M oo oo co ^ ^t «n«nvo "S Z <& ^S *1 ~1 "^ cJ00.l/^t^:00.v£?v<P ^'~H. ^^ *^ ^i ^ °
M v^Jooo d h »n d h (N d - * o ^ «n '-ncNio % *Z oo m cm | T^ S
I _o r-vovo^o sovovovomvov© oooocmtj- vor^o «u =
w g _o
\qh r*; r*; r^ r^ r^ r-; rf r-; r^ ^ so rf r^ r^ vo^ r-; ^ .2 oc co^co^co^co^ co^co^co^co^co^co^co*^ co'co'co^co^ co'co^co^ Pco
3 £ g % g* "S £ j? c tj-(NM -h cosdcn-hsocmoo oo oo (N ̂ m«nm •-" S 3 » vdcioo d h >n d ^ (N d - ! p ^ in -^cno -2<2 O ^jooin cm I T -* 2<u * 8-S 04 .go
"S cm mmimn oo^rJ^Mmm ONr-csrt »nt^oo c: £ «, S cm c - r^ r^ i - ^o t^ r- h »o t^ r^ oooocntt hooo a^ «, g V3 O ^
c ^ r^ r^
^ i ^
^o ^
t^ ^ ^
r- ^ h »o
^ ^ t^
^ r^ oooocntt
^ ^ ^ ^ ^ hooo
^ en "3 a^
s Q *O
V3 co'co^coco^ co'co^co^co^co'co'co' coco'co'co' co^co' R,"^
2 =l Is I < I 1 * .., 3, c Tt n m ^ covocM'-hvocsoo oooocmco in»n»n rS'-s ^ .., X e« CNj^H^Hi^ qooio^oovq vq ^_^hvo ^cssp ^^ « «^ vdooo dr^iodKrid ^Q^»n ^rio E^ ^ ^oo«n cm i T^ g«
i |1
3 1 1! i *«» tj i «9 c i
o i -fi i1 a3S *«» tj «9 c o - -fi a3S
§ 2 ^ I fill - « e S -*" 2
il iSiliilli! Ill !! Ill if II llsliiiilllliilliilsl ||

80 The Journal of Human Resources
Appendix 2
Construction of HOME scale
The HOME scale is based on responses to a series of questions about how responsive and punitive parents are to children. It is coded by interviewers at the close of the assessment. The questions were answered only if at least one child was present and awake during the interview:
Responsivity: 1 . Did the mother or father spontaneously say kind words or phrases to the chil-
dren at least twice during the interview?
2. At least once, did the mother or father respond verbally to a child's vocalization?
3. At least once, did the mother or father tell the child the name of an object? 4. At least twice, did the mother or father spontaneously praise one of the
children?
5. Did the mother or father convey positive feelings toward the children when they speak to or about them?
6. Did the mother or father caress or kiss one of the children at least once?
Punitiveness: 1 . Did the mother or father yell at any of the children?
2. Was the mother or father annoyed with or hostile toward any of the children?
3. During the interview, did the mother or father hit any of the children?
4. During the interview, did the mother or father scold or criticize any of the children?
5. Did the mother or father forbid any of the children from doing something more than three times during the interview?
Each question received an answer of "yes" or "no." The HOME scale is equal to the number of answers of "no" on the responsivity items, plus the number of answers of "yes" on the punitiveness items. The alpha for the scale is 0.78. Models that included the two subscales for responsivity and punitiveness separately yielded results that are similar to those using the combined score.
References
Aughinbaugh, A., and M. Gittleman. 2003. "Does Money Matter: A Comparison of the Effect of Income on Child Development in the United States and Great Britain." Journal of Human Resources 38(2):416-40.
Baum, C. L. 2003. "Does Early Maternal Employment Harm Child Development? An Anal- ysis of the Potential Benefits of Leave Taking." Journal of Labor Economics 21(2):409-48.

Paxson and Schady 81
Baydar, N., and J. Brooks-Gunn. 1991. "Effects of Maternal Employment and Child-Care Arrangements on Preschoolers' Cognitive and Behavioral Outcomes: Evidence from the Children of the National Longitudinal Survey." Development Psychology 27(6):932-45.
Becker, G. S., and N. Tomes. 1976. "Child Endowments and the Quantity and Quality of Children." Journal of Political Economy 84(2): 143-62.
Behrman, J., and A. Deolalikar. 1988. "Health and Nutrition." In Handbook of Development Economics , Vol. 1, ed. H. Chenery and T.N. Srinivasan, 631-711. Amsterdam: North Holland Press.
Behrman, J., Y. Cheng, and P. Todd. 2004. "Evaluating Preschool Programs when Length of Exposure to the Program Varies: A Nonparametric Approach." Review of Economics and Statistics 86(l):108-32.
Behrman, J., J. Hoddinott, J. A. Maluccio, E. Soler-Hampejsek, E. L. Behrman, R. Martorell, A. Quisumbing, M. Ramirez, A. D. Stein. 2005. "What Determines Adult Cognitive Skills? Impacts of Pre-School, School- Years and Post-School Experiences in Guatemala." University of Pennsylvania. Unpublished.
Berger, L. M, C. Paxson, and J. Waldfogel. 2005. "Income and Child Development." Princeton University. Unpublished.
Black, M. M. 2003. "Micronutrient Deficiencies and Cognitive Functioning." Journal of Nutrition 133(11 Suppl. 2):3927S-3931S.
Blake, J. 1989. Family Size and Achievement. Berkeley and Los Angeles: University of California Press.
Blau, F. D., and A. J. Grossberg. 1992. "Maternal Labor Supply and Children's Cognitive Development." Review of Economics and Statistics 74(3):474-81.
Blau, D. M. 1999. "The Effect of Income on Child Development." Review of Economics and Statistics 81(2):261-76.
Bradley, R. H. 1993. "Children's Home Environments, Health, Behavior, and Intervention Efforts: A Review Using the HOME Inventory as a Marker Measure." Genetic, Social, and General Psychology Monographs 119:437-90.
Bradley, R. H., R. F. Corwyn, H. P. McAdoo, and C. G. Coll. 2001. "The Home Environments of Children in the United States Part I: Variations by Age, Ethnicity, and Poverty Status." Child Development 72(6): 1844-67.
Brown, J. L and E. Pollitt. 1996. Malnutrition, Poverty and Intellectual Development." Scientific American 274(2):38-43.
Burgard, S. 2002. "Does Race Matter? Children s Height in Brazil and South Africa." Demography 39(4):763-90.
Caldwell, B. M., and R. H. Bradley, 1984. Administration Manual (Revised Edition): Home Observation for Measurement of the Home Environment. Little Rock: University of Arkansas.
Carneiro, P., J. Heckman, and D. Masterov. 2005. "Labor Market Discrimination and Racial Differences in Pre-market Factors." Journal of Law and Economics 48(1): 1-39.
Case, A., and C. Paxson. 2006. "Stature and Status: Height, Ability, and Labor Market Out- comes." National Bureau of Economic Research. Working Paper No. 12466.
Case, A., D. Lubotsky, and C. Paxson. 2002. "Economic Status and Health in Childhood: The Origins of the Gradient." American Economic Review 92(5): 1308-34.
Case, A., C. Paxson, and J. Ableidinger. 2004. "Orphans in Africa: Parental Death, Poverty, and School Enrollment." Demography 41(3):483-508.
Center for Disease Control. 1989. "Criteria for Anemia for Children and Child-Bearing- Aged Women." MMWR Morbidity and Mortality Weekly Report 38:400-404.
Chay, K. Y. 2001. "Semiparametric Censored Regression Models." Journal of Economic Perspectives 15(4):29-42.
Connolly, S., J. Micklewright, and S. Nickell. 1992. "The Occupational Success of Young Men who Left School at Sixteen." Oxford Economic Papers 44(3):460-79.

82 The Journal of Human Resources
Cunha, E, J. Heckman, L. Lochner, D. Masterov. 2005. "Interpreting the Evidence on Life Cycle Skill Formation." NBER Working Paper 11331, Cambridge, Mass.
Currie, J., and D. Thomas. 1999. "Early Test Scores, Socioeconomic Status and Future Outcomes." NBER Working Paper 6943, Cambridge, Mass.
Desai, S., P. L. Chase-Lansdale, and R. T. Michael. 1989. "Mother or Market? Effects of Maternal Employment on the Intellectual Ability of 4- Year-Old Children." Demography 26(4):545-61.
Dickson, R., S. Awasthi, P. Williamson, et al. 2000. "Effects of Treatment for Intestinal Helminth Infection on Growth and Cognitive Performance in Children: Systematic Review of Randomised Trials." British Medical Journal 320:1697-701.
Evans, D., and E. Miguel. 2004. "Orphans and Schooling in Africa: A Longitudinal Analysis." Harvard University and University of California, Berkeley. Unpublished.
Feinstein, L. 2003. "Inequality in the Early Cognitive Development of British Children in the 1970 Cohort." Economica 70(277):73-97.
Fernald, Lia C, Lynnette M. Neufeld, Lauren R. Barton, Lourdes Schnaas, Juan Rivera, and Paul Gertler. 2006. "Parallel Deficits in Linear Growth and Mental Development in Low-Income Mexican Infants in the Second Year of Life." Public Health Nutrition 9(2): 178-86.
Filmer, D., and L. Pritchett. 2001. "Estimating Wealth Effects without Expenditure Data - or Tears: An Application to Educational Enrollments in States of India." Demography 38(1):1 15-132.
Fryer, R.G., and S. D. Levitt. 2004. "Understanding the Black- White Test Score Gap in the First Twp Years of School." Review of Economics and Statistics 86(2):447-464.
Gertler, P., and L. C. Fernald. 2004. "The Medium Term Impact of Oportunidades on Child Development in Rural Areas." University of California, Berkeley. Unpublished.
Ghuman, S., J. R. Behrman, J. B. Borja, S. Gultiano, and E. M. King. 2005. "Family Background, Service Providers, and Early Childhood Development in the Philippines." Economic Development and Cultural Change 54(1): 129-64.
Glewwe, P. 2002. "Schools and Skills in Developing Countries: Education Policies and Socioeconomic Outcomes." Journal of Economic Literature 40(2):436-82.
Grantham-McGregor, S. M., C. A. Powell, S. P. Walker, and J. H. Himes. 1991. "Nutritional Supplementation, Psychosocial Stimulation, and Mental Development of Stunted Children: The Jamaican Study." Lancet 338:1-5.
Grantham-McGregor, S. M., S. P. Walker, S. M. Chang and C. A. Powell. 1997. "Effects of Early Childhood Supplementation with and Without Stimulation on Later Development in Stunted Jamaican Children." American Journal of Clinical Nutrition 66:247-53.
Grantham-McGregor, S. M., and C. Ani. 2001. "A Review of Studies on the Effect of Iron Deficiency on Cognitive Development in Children." Journal of Nutrition 131:649S-668S.
Guo, G., and K. M. Harris. 2000. "The Mechanisms Mediating the Effects of Poverty on Children's Intellectual Development." Demography 37(4):431^17.
Halpern, R., F. Barros, B. Horta, and C. Victora. 1996. "Desenvolvimento neuropsicomotor aos 12 meses de idade em uma coorte de base populacional no Sul do Brasil: diferenciais conforme peso ao nascer e renda familiar." Cad. Saude Pub. 12(Supl. 1):73- 78.
Leon, M. 2003. "Etnicidad y Exclusion en el Ecuador: Una Mirada a Partir del Censo de Poblacion de 2001." Sistema Integrado de Indicadores Sociales del Ecuador, Quito, Ecuador. Unpublished.
Lozoff, B., E. Jimenez, J. Hagen, et al. 2000. "Poorer Behavioral and Development Outcome More Than 10 Years after Treatment for Iron Deficiency in Infancy." Pediatrics 105(4): 1-11.
Lubotsky, Darren. 2001. "Family Resources, Behavior, and Children's Cognitive Development." University of Illinois at Urbana-Champaign. Unpublished.

Paxson and Schady 83
McCulloch, A., and H. E. Joshi. 2002. "Child Development and Family Resources: Evidence from the Second Generation of the 1958 British Birth Cohort." Journal of Population Economics 15(2):283-304.
McKay, H, L. Sinisterra, A. McKay, H. Gomez, and P. Lioreda. 1978. "Improving cognitive ability in chronically deprived children." Science 200:270-78.
Mckenzie, D. J. 2005. "Measuring Inequality with Asset Indicators." Journal of Population Economics 18(2):229-60.
Miguel, E., and M. Kremer. 2004. "Worms: Identifying Impacts on Education and Health in the Presence of Treatment Externalities." Econometrica 72(1): 159-217.
Mohan, P 2005. "Inequities in Coverage of Preventive Child Health Interventions: The Rural Drinking Water Supply Program and the Universal Immunization Program in Rajasthan, India." American Journal of Public Health 95(2):241^W.
Munoz, F., C. Quilodran, P. Velasquez, C. Niedmann, A Baeza, G. Silva and M Osorio. 1989. "Acquirement of the Spanish Vocabulary among Rural and Urban Students of the 9th Region." Revista Chilena de Pediatna 60(6):354-58.
Parcel, T. L., and E. Menaghan. 1994. "Early Parental Work, Family Social Capital and Early Childhood Outcomes." American Journal of Sociology 99(4):972-1009.
Petrill, S. A. 2003. "The Development of Intelligence: Behavioral Genetics Approaches." In Models of Intelligence: International Perspectives, ed. J. Lautry et al. Washington D.C.: American Psychological Association.
Petrill, S. A., and K. Deater-Deckard. 2004, "Task Orientation, Parental Warmth, and SES Account for a Significant Proportion of the Shared Environmetal Variance in General Cognitive Ability in Early Childhood: Evidence from a Twin Study." Developmental Science 7(1 ):25-32.
Plomin, R. 1994. Genetics and Experience: The Interplay Between Nature and Nurture. Thousand Oaks, Calif.: Sage Publications.
Pollitt, E., W. E. Watkins, and M. A. Husaini. 1997. "Three-Month Nutritional Supplementation in Indonesian Infants and Toddlers Benefits Memory Function 8 Years Later." American Journal of Clinical Nutrition 66:1357-63.
Powell, C, S. P. Walker, J. H. Himes, P. D. Fletcher, and S. Grantham-McGregor. 1995. "Relationships Between Physical Growth, Mental Development and Nutritional Supplementation in Stunted Children: The Jamaican Study." Acta Paedatrica 84(l):22-29.
Powell, C, H. Baker-Henningham, S. Walker, and S. Grantham-McGregor. 2004. "Feasibility of Integrating Early Stimulation into Primary Care for Undernourished Jamaican Children: Cluster Randomised Controlled Trial." British Medical Journal 329(7457):89.
Powell, J. 1984. "Least Absolute Deviations Estimation for the Censored Regression Model." Journal of Econometrics 25(3):303-25.
. 1986. "Symmetrically Trimmed Least Squares Estimation for Tobit Models." Econometrica 54(6): 1435-60.
Robertson, D., and J. Symons. 2003. "Do Peer Groups Matter? Peer Group versus Schooling Effects on Academic Attainment." Economica 70(277):31-53.
Raso, G., J. Utzinger, K. D. Silue et al. 2005. "Disparities in Parasitic Infections, Perceived 111 Health and Access to Health Care Among Poorer and Less Poor Schoolchildren of Rural Cote d'lvoire." Tropical Medicine and International Health 10(l):42-67.
Rosenzweig, M., and K. I. Wolpin. 1994. "Are there Increasing Returns to the Intergenerational Production of Human Capital? Maternal Schooling and Child Intellectual Achievement." Journal of Human Resources 29(2):670-93.
Ruhm, C. J. 2004. "Parental Employment and Child Cognitive Development." Journal of Human Resources 39(1): 155-92.

84 The Journal of Human Resources
Sackey, M, M. M. Weigel, and R. X. Armijos. 2003. "Predictors and Nutritional Conse- quences of Intestinal Parasitic Infections in Rural Ecuadorean Children." Journal of Tropical Pediatrics 49:17-23.
Sahn, D., and D. Stifel. 2003. "Exploring Alternative Measures of Welfare in the Absence of Expenditure Data." Review of Income and Wealth 49(4):463-89.
Schady, N. 2006. "Early Childhood Development in Latin America and the Caribbean." Economia (6)2.
Smith, J. R., J. Brooks-Gunn and P. K. Klebanov. 1997. Consequences of Living in Poverty for Young Children's Cognitive and Verbal Ability and Early School Achievement. In Conse- quences of Growing up Poor, ed. J. Duncan and J. Brooks-Gunn, 1 32-89. Russell Sage Foundation, New York.
Stoltzfus, R. J., J. D. Kvalsvig, H. M. Chwaya, et al. 2001. "Effects of Iron Supplementation and Anthelmintic Treatment on Motor and Language Development of Preschool Children in Zanzibar: Double Blind, Placebo Controlled Study." British Medical Journal 323:1-8.
Strauss, J., and D. Thomas. 1998. "Health, Nutrition, and Economic Development." Journal of Economic Literature 36(2):436-82.
Taylor, B., E. Dealing, and K. McCartney. 2004. "Incomes and Outcomes in Early Childhood." Journal of Human Resources 39(4): 980- 1007.
Todd, P. E., and K. I. Wolpin. 2003. "On the Specification and Estimation of the Production Function for Cognitive Achievement." The Economic Journal 113(485):F3-F33.
Umbel, V. M., B. Z. Pearson, M. C. Fernandez, and D. K. Oiler. 1992. "Measuring Bilingual Children's Receptive Vocabularies." Child Development 63(4): 1012-20.
Vitora, C, F. Barros, and J. Vaughan. 1989. Epidemiologia da Desigualdade, Sao Paulo: Hucitec.
Vos, R., J. Cuesta, M. Leon, R. Lucio, and J. Rosero. 2004. "Health." In Ecuador: Creating Fiscal Space for Poverty Reduction. World Bank: Washington, D.C.
Waber, D. P., L. Vuori-Christiansen, N. Ortiz, J. R. Clement, N. E. Christiansen, J. O. Mora, R. B. Reed, and M.G. Herrera. 1981. "Nutritional Supplementation, Maternal Education and Cognitive Development of Infants at Risk of Malnutrition." American Journal of Clinical Nutrition 34:807-13.
Wagstaff, A., and N. Watanabe. 2003. "What Difference does the Choice of SES Make in Health Inequality Measurement?" Health Economics 12(10): 885-90.
Waldfogel, J., W. Han, and J. Brooks-Gunn. 2002. "The Effects of Early Maternal Employment on Child Cognitive Development." Demography 30(2): 369-92.
Walker, S. P., S. M. Grantham-McGregor, C. A. Powell, S. M. Chang. 2000. "Effects of Growth Restriction in Early Childhood on Growth, IQ, and Cognition at Age 1 1 to 1 2 Years and the Benefits of Nutritional Supplementation and Psychosocial Stimulation." The Journal of Pediatrics 137(1):36-41.
World Bank. 2004. Ecuador: Poverty Assessment. Washington, D.C.


![6/24/2019 BOARD OF REGENTS OF THE UNIVERSITY OF …€¦ · University of Wisconsin-Fox Valley, and the University of Wisconsin-Oshkosh [Resolution I.3.g.] ... over the last five](https://img.pdfslide.us/doc/110x75/5fa6bc9384c3b764794b19b8/6242019-board-of-regents-of-the-university-of-university-of-wisconsin-fox-valley.jpg)