Embed Size (px)
Citation preview
THE BLACK SERVICE STATION F R A N C H I S E E
William L. Trombetta
Considerable attention has been focused on differences and simi- larities between Blacks and whites in our society. A large number of these comparative studies has come from the fields of sociology and psycholo- gy. Much less attention has been devoted, in the economic and business literature, to questions concerning the performance between Blacks and whites in the arena of economic enterprise. This study is one of a very few that has had the good fortune to have access to key economic data reflecting economic performance between Blacks and whites. Specifical- ly, this paper reports the findings of a study which compared a number of indicia of economic performance between two groups (one black and one white) of service station franchisees. The following questions guided the research: (1) How do black and white gasoline retailers compare with respect to selected operating and performance measures? (2) Do the factors that are associated with black dealer economic performance also apply to white dealer economic performance? and (3) What relationship is there, if any, between the amount of initial cash investment and subsequent economic performance between black and white dealers?
SETTING THE STAGE
The author decided to perform his study in the area of franchising in general and gasoline retailing in particular for a number of reasons. Equity requirements to start up such a business are relatively low. Some degree of training is provided to franchisees. Operating systems are more standardized than not among the major chains. Product identification and promotional efforts are pooled resulting in benefits to some extent from scalar promotional economies. The franchisee has the advantage of ac- cess to a relatively stable market in the form of credit card customers.
BLACK SERVICE STATIONS 365
Some degree of ongoing management and marketing counseling is supplied by the parent oil company? Last, but certainly not least, the author discovered a data source that was willing to allow access to its client experience, but only for the years prior to 1972.
Significance can be attributed to such a study for a number of reasons. Very little evaluation of minority enterprise has actually been done. More important, meaningful quantitative data has been virtually nonexistent in this area because of the high degree of confidential restrictions. There is a substantial lack of information concerning minority-owned business both inside and outside of the inner city. 2 Researchers of franchise systems such as Ozanne and HunP and McZier and Ralph 4 have stressed the need for additional and more sophisticated research in the study of minority enterprise. Booms and Ward 5 believe that programs aimed toward estab- lishing new minority-owned business probably will be limited to small, retail business. They envision limited financial resources for minority business development leading to low loan ceilings for any given venture, thereby effectively excluding development of business with large capital requirements. Census data reinforce this premise. The trend in assisting minority enterprise has been in establishing retailing, distribution, fran- chising, and service industries. In 1971, 72 percent of the SBA minority loans were for these types of firms. Retailing is where the greatest con- centration of black business is located. Retailing produces the largest business receipts, $1.9 billion, representing 0.6 percent of the total retail- ing industry.~ If it is likely that minority enterprise programs will concen- trate on establishing small, mainly retail, business in low-income areas, it becomes important to study the experiences of such activity.
P R O C E D U R E AND M E T H O D O L O G Y
The source of the data was a national managerial consulting service firm specializing in gasoline retailing. This proved to be a valuable asset because the author was able to use a common data base and data forms in gathering the raw material. The time period of the data base was restricted due to the sensitive nature of the data. The data source would not allow an investigation of its current client experience; access to the client files was restricted to the years prior to 1972. Therefore, the data base selected for the study represented the time period January 1, 1970 through December 31, 1970. The time period restriction may have enhanced the analysis to the extent that 1970 census data came on stream in complete stages around 1973 and, consequently, could be used more appropriately. Also,
366 The Review of Black Political Economy
using 1970 as a time frame for analyzing gasoline retailing avoided the confusion of the alleged gasoline energy crunch which might have mud- died the waters in attempting to determine the real experience of gasoline retailers unencumbered by what might be characterized as being an ab- normal period of activity in the petroleum industry.
The author was given access to background and operating data on service station dealers in the Cleveland, Philadelphia, and Baltimore greater metropolitan areas for the dealers who were in operation during the designated time period. The study population of gasoline service stations represents dealers affiliated with all the major oil companies.
A sample of 48 black and 48 white service station dealers was drawn from all qualified accounts in business during the appropriate time period. The size of the sample was restricted by the small number of black dealers affiliated with the managerial consulting service in the three cities. Only single proprietorships were made available for the study. Dealers in- stalled after January l, 1970 were not included. Thus, to qualify for inclusion, the dealer had to have been in business for at least one year. In this way, a crude attempt was made to control for the matching of experi- ence and tenure in the business. The study was concerned only with operations existing during the specified time period. Therefore, bank- ruptcies, dealers that had gone out of business, and company cancella- tions were not included.
A four-page data schedule was constructed to collect the required information. The first page was designed to collect information pertaining to the dealer's source of revenue, basic operating data, and background data. The last three pages were designed to collect information of a financial nature--balance sheet and income statement data. Information available through the data source's files included the date that a station's operations began, the dealer's date of birth, the name and address of the dealer location, the amount of money invested by the dealer in the busi- ness (for Cleveland dealers only), and revenue, cost, and profit breakdown by product line.
A major operational problem in the study was matching the black dealers with the white dealers. This led to a number of limitations in the study which shall be noted at the end of this section. The selection of the matching variables depended in part on their inclusion in similar studies dealing with service station performance evaluation 7 and discussion with experts in the gasoline retailing industry. While not including all the matching variables that one would have liked (trading off fewer matching variables to get a workable sample size out of the already limited black dealer population) the two groups of dealers were matched as closely as
BLACK SERVICE STATIONS 367
possible on the following variables: (1) sales volume (average monthly gallonage), (2) city, (3) marital status of dealer, (4) petroleum company, (5) product mix by gallonage composition, (6) years in operation at present location, (7) rented versus owned land, (8) give stamps? (9) average daily hours of operation, and (10)open Sunday?
Gallonage was perhaps the most important variable to control because cost of goods sold, gross margin, and net profits will differ according to various levels of gallonage pumped. Product mix (the relative octane composition of the gasoline) might account for differences in economic performance to the extent that one station may pump more or a greater percentage of high-grade or premium gasoline than another station. Past studies indicate that such personal history items as marital status and years in operation should be controlled. 8 The 24-hour operation and the station open on Sundays differ from the station operating something short of a 24-hour day. After discussions with a number of industry experts, it became necessary to control whether the dealer rented or owned the property and whether or not he gave stamps.
The author initially started out with more control variables such as traffic patterns, artery access, and number of stations competing at the site. However, as the control variables increased the matched pairs de- creased. Therefore, a trade-off was made between controlling all the variables that might account for any differences between the groups and a meaningful sample size.
To determine any statistical significance between black and white dealers on the various dimensions of economic performance, t-tests, chi- square, and simple correlation analysis were employed.
Limitations of the Study
Certain inputs which have an important bearing on the economic performance of service stations were unavailable to the author. Site loca- tion with respect to vehicular traffic patterns is an important variable. Sites are evaluated in terms of vehicular traffic density, average speed of vehicular movement, and the ease with which vehicles can exit and reenter the traffic stream in order to patronize a given station.
No attempt was made to interview the subjects under study. Because of the confidential relationship between the primary data source and its clients, no hint that they were being studied could be disclosed to the subjects. The author was specifically requested not to visit the sites of the outlets under investigation. Since the author was unable to physically identify any of the stations included in the study, it was not possible to
368 The Review of Black Political Economy
rank them in terms of their general appearance, spaciousness of apron (a measure of the ease with which entry and exit can be accomplished), number of pumps and attendants, and availability of supplementary park- ing space.
The service stations selected for this study would appear to be repre- sentative of the population of service stations in the study area. The 96 service stations appearing in the study represent a cross-section of the major oil firms operating within the geographical boundaries of the study. They may not, however, be representative of the population of service stations as a whole and one should be cautious in attempting to generalize from the results of this study.
The above limitations notwithstanding, the topic is provocative enough and the implications would appear to be of sufficient interest to warrant going ahead with an analysis of what was made available to the author. Also, given the dearth of research based on hard quantifiable data on the topic of minority business performance vis-fi-vis white business performance, the present study supplies a rarely seen type of data base that can be subjected to some of the less rigorous statistical techniques such as chi-square and correlation analysis.
COMPARATIVE ANALYSIS OF OPERATING AND PERFORMANCE MEASURES
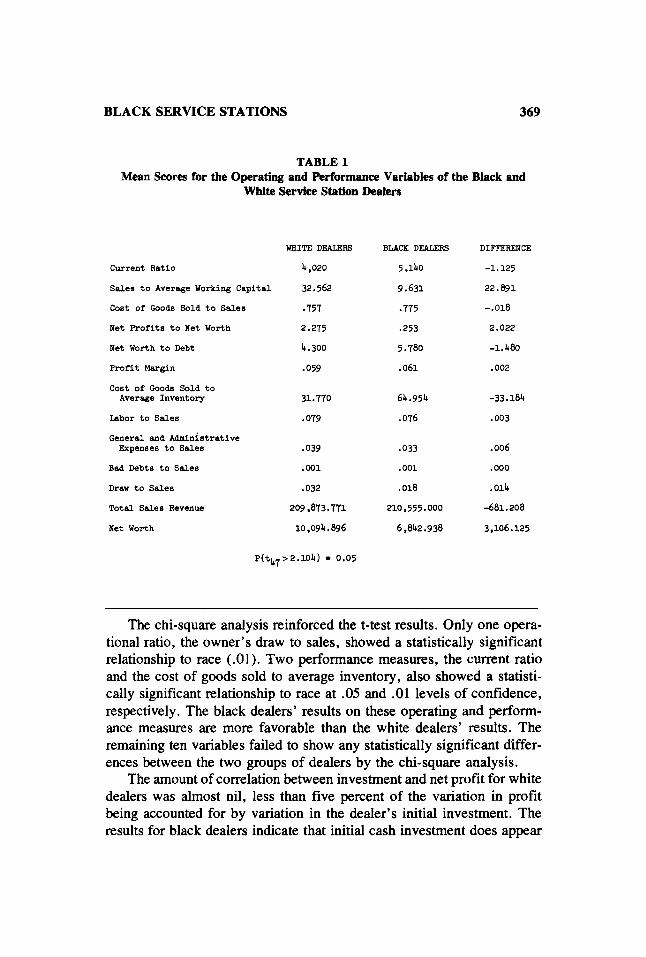
The operating and performance figures for both groups of dealers were tabulated and computed in order to test the overall null hypothesis that there is no significant difference between the mean values of selected operating and performance measures of black and white dealers. The mean scores for the thirteen performance variables employed in this study for both groups of dealers are shown in Table 1.
The t-test was applied to a comparison of matched samples using the standard error of a difference for matched groups. Of the 13 variables subjected to the t-test, none of the t-values were statistically significant at the .05 level of significance. Therefore, the null hypothesis could not be rejected.
A simple "eyebal l ing" of the differences between the two groups illustrates very little variation between them with the exception of four variables. As a measure of reassurance a chi square analysis was per- formed on each performance measure to test for any significance between the performance measures and race to complement the results of the t-test.
BLACK SERVICE STATIONS 369
TABLE 1 Mean Scores for the Operating and Performance Variables of the Black and
White Service Station Dealers
WHITE DEALERS BLACK DEALERS DIFFERENCE
Current Ratio 4,020 5,140 -1.125
Sales to Average Working Capital 32.562 9.631 22.891
Cost of Goods Sold to Sales .757 .775 -.018
Net Profits to Net Worth 2.275 .253 2.022
Net Worth to Debt ~.300 5.780 -i.~80
Profit Margin .059 .061 .002
Cost of Goods Sold to Average Inventory 31.770 6h.95~ -33.18h
Labor to S a l e s .079 .076 .003
General and Administrative Expenses to Sales .039 .033 .006
Bad Debts to Sales .001 .0Ol .000
Draw to Sales .032 .018 .014
Total Sales Revenue 209,873.771 210,555. GO0 -681.208
Net Worth i0,09~. 896 6,8~2.938 3,106.125
P(%7>2.10~1 - 0.05
The chi-square analysis reinforced the t-test results. Only one opera- tional ratio, the owner's draw to sales, showed a statistically significant relationship to race (.01). Two performance measures, the current ratio and the cost of goods sold to average inventory, also showed a statisti- cally significant relationship to race at .05 and .01 levels of confidence, respectively. The black dealers' results on these operating and perform- ance measures are more favorable than the white dealers' results. The remaining ten variables failed to show any statistically significant differ- ences between the two groups of dealers by the chi-square analysis.
The amount of correlation between investment and net profit for white dealers was almost nil, less than five percent of the variation in profit being accounted for by variation in the dealer's initial investment. The results for black dealers indicate that initial cash investment does appear
370 The Review of Black Political Economy
to be somewhat related to the level of net profits, but only 39.7 percent of the variation in net profit was associated with the variation in initial investment. The sample size for this hypothesis on initial cash investment in the business is so small that one should be cautious in attempting to draw any conclusions concerning the effect of initial investment upon the net profit for either group.
The interesting point of the analysis is that the black dealer group, operating in a somewhat less than desirable economic milieu, have done as well economically as their white counterparts. The correlation matrices suggest that black dealers capitalize on pushing gasoline revenue over nongasoline revenue. Nongasoline revenue is comprised of relatively high margin items such as tires, batteries, and accessories. Since these nongasoline revenue items contribute significantly to a service station's gross profits, one might expect black dealers to try to achieve a more balanced product mix. However, this difference with respect to non- gasoline revenue may be the result of environmental factors. If black dealers operate for the most part in black populated areas, one might logically assume that most of their patronage is also Black. These black consumers with relatively low incomes may buy these higher profit mar- gin items at a discount store at lower prices than a service station. This basic difference between an emphasis on gasoline revenue versus non- gasoline revenue implies that black dealers may be running a less compli- cated operation in a managerial sense than white dealers, yet achieving comparable economic results.
CONCLUSIONS
Many of the following comments are meant to generate hypotheses for future research on the subject investigated here; they should not be taken as based on facts generated from some broader study of the problems facing minority entrepreneurs.
1. The major purpose of this study was to compare black and white service station dealers on a selected number of operating performance measures. The primary finding of the study is that black dealers did as well as white dealers on 13 measures of economic activity. Although the differences are not significant, the averages of 6 of these 13 meas- ures are higher for black dealers than for whites, including the profit margin (see Table 1).
2. Black dealers, either by choice or situation, tend to focus on gasoline sales while white dealers are able to achieve a more balanced product mix. The white dealers' operations appear to reflect a more sophisti-
BLACK SERVICE STATIONS 371
cated use of the marketing mix and managerial decis ion-making ca- pacity than the black dealers ' operations.
3. Overall, the data seem to indicate that Blacks can perform as well as whites in terms of selected operating and performance measures. A number o f reasons may account for this:
a. Location, particularly for black dealers operating in black areas, ap- pears to be significantly related to relatively favorable economic per- formance. One factor possibly accounting for the black dealers' positive showing in heavily black-populated areas may be the prestigious value attached to this form of entrepreneurship by Blacks. Being in business for oneself may be very important for Blacks; the chance to be a service station dealer may be considered an essential vehicle for participating in the economic mainstream of society. In contrast, whites, with more opportunities to strive for more prestigious managerial and entrepreneu- rial positions, may not place the same high value upon running a service station. Hence, the average white who finds himself running a gas station may be a cut below the average Black who values the opportu- nity to be in business for himself, albeit at a relatively low level, more highly than his white counterpart)
b. Social and economic discrimination may lead to more frustrations and conflicts for black dealers attempting to operate in white areas. For example, discriminatory attitudes by whites toward their black employer may make it more difficult for the black dealer than the white dealer, in general, to run a station. Thus, variations in the social desir- ability of running a service station and possible discriminatory attitudes between employer and employee may partially account for the ability of blacks to do well in areas with large percentages of black population.
c. The dealers in this study affiliated themselves with a national manage- rial and accounting service. Hence, the service provided may contribute significantly to the performance of black dealers in helping them face accounting and operational problems. Also, by choosing this service, these black dealers may be above average in motivation.
d. There may be some positive contributions stemming from the al!eged advantages of operating within a franchise system, such as a proven, accepted product, uniformity and consistency of operations, accounting support, and managerial support in the form of "trouble-shooting" assistance.
The development of minority entrepreneurship is but one o f a number o f approaches to the solution o f one aspect o f an overall urban problem. For the nation as a whole, less than ten percent o f the labor force are entrepreneurs. 1~ Therefore, most members of minori ty groups will not advance themselves economical ly through owning a business but by ac- quiring better jobs with higher wages. The avenue o f entrepreneurship is
372 The Review of Black Political Economy
a l imited one, but the results o f this s tudy indicate that it is impor tan t to cont inue to explore it wi th respec t to Blacks , and the vehic le o f f ranchis -
ing, g iven the s o c i o e c o n o m i c objec t ive o f enab l ing m o r e Blacks to gain a
greater stake in private enterprise .
NOTES
1. For an overview of the black experience in franchising see J. Carroll Swart and Robert B. Carter, "Negroes in Franchising," Journal o f Retailing, 48 (Fall 1972).
2. Bernard H. Booms and James E. Ward, Jr., "The Cons of Black Capitalism," Business Horizons (October 1969), p. 20.
3. Urban B. Ozanne and Shelby D. Hunt, The Economic Effects of Franchising, Madison, Wisconsin: The Graduate School of Business, The University of Wisconsin, 1971.
4. Arthur McZier and Roger Ralph, "Minority Franchising: Its Development, Pros- pects, and Problems," a paper submitted for the Sixth Annual International Management Conference on Franchising, April 3, 1970, Boston College, Chestnut Hill, Massachusetts.
5. Booms, and Ward, loc. cit., p. 21. 6. Small Business Washington Presentation, Whither Small Business Assistance,
Washington, D.C. (1974) p. 13. 7. See Ronald J. Dornoff, "An Analysis of the Differences in the Operational and
the Socio-Economic and Background Factors As They Relate to th.e Success of Service Station Dealers," The Southern Journal of Business (April 1969) pp. 298-308; Lloyd R. Saltzman, Survey of Service Stations in Tulsa: The Recruitment and Selection o f Service Station Dealers, Tulsa Oklahoma: College of Business Administration, University of Tulsa, 1964; Robert S. Soar, "Personal History Data As a Predictor in Service Station Management," Journal of Applied Psychology (December 1956) pp. 383-385.
8. Ibid. 9. See "America's Rising Black Middle Class," Time (June 17, 1974).
10. Booms and Ward, loc cit., p. 26.