Embed Size (px)
Citation preview
The Bitcoin Market Potential Index
Garrick Hileman
London School of Economics, [email protected]
Abstract: The Bitcoin Market Potential Index conceptualizes and ranks the potential utility of bitcoin across 178 countries to show which coun-tries have the greatest potential to see bitcoin adoption. The index utilizes a data set with 40 variables related to bitcoin’s current core functions: store of value, medium of exchange, and technology platform. The varia-bles are grouped into the index’s seven equally weighted sub-indices: technology penetration, international remittances, inflation, size of infor-mal economy, financial repression, historical financial crises, and bitcoin penetration. Standardized and re-scaled country level data both indicate that Argentina and Sub-Saharan Africa are the country and region, re-spectively, where bitcoin has the greatest potential for adoption. It is ar-gued that while bitcoin regulation can play an important, and perhaps even decisive, role in bitcoin adoption it should be excluded as an index variable for now due to insufficient data and uncertainty over its ultimate impact.
1 Introduction
With over $400 million of venture capital invested in bitcoin startups to date it would be helpful for entrepreneurs and investors who are planning where to locate or expand operations to better understand which markets may prove most fertile for bitcoin.1 At the same time policymakers are seeking to gain a better understanding of the likeli-hood that the use of bitcoin will gather momentum in their respective jurisdictions. The Bitcoin Market Potential Index (BMPI) is a new composite indicator that ranks bitcoin’s potential utility (usefulness) across 178 countries, is the first attempt at providing a rigorous answer to the question of where bitcoin has both the most and least potential for adoption. The BMPI can be useful for anyone who seeks a better understanding of the factors that may drive further bitcoin adoption, as well as where bitcoin adoption is more likely to take place in the months and years to come.
In this paper the term adoption is used synonymously with utilization of bitcoin and block chain technology for a variety of monetary and non-monetary functions. At present bitcoin adoption can be measured through a number of metrics, such as num-ber of wallets, number of bitcoin accepting businesses, number of transactions, ex-change volume, and other metrics. The term market potential in this paper refers to countries where bitcoin may have the greatest potential utility (usefulness).
1 CoinDesk’s database of bitcoin venture capital http://www.coindesk.com/bitcoin-venture-
capital/
Measuring bitcoin’s potential utility
Situated at the rapidly evolving intersection of technology, policy and economics, any study of bitcoin’s potential usefulness and prospects for adoption must be interdisci-plinary (Figure 1). Figure 1: Interdisciplinary Framework for Understanding Bitcoin’s Utility
In contemplating any measurement of bitcoin’s potential for adoption one of the first questions that arises is precisely what kind of adoption should be measured? For ex-ample, should emphasis be placed on where bitcoin has the most potential to be used as an alternative store of value? Or should bitcoin’s utility as a substitute medium of exchange take priority?2 Which of these two is more likely to influence bitcoin’s adoption prospects? Or does bitcoin face limited prospects as an alternative currency and emphasis should instead be placed on the block chain’s other, non-currency func-tionality? Answers to such questions influences the choice of index variables, data sources, and weightings. The BMPI aims to measure bitcoin’s total potential utility and therefore includes vari-ables that relate to bitcoin’s function as both a store of value and medium of ex-change, as well as the block chain’s potential to serve as a technology platform for non-monetary uses (e.g., notary timestamp). However, because at present bitcoin is primarily utilized as an alternative means to store and transfer value the index features more variables that focus on bitcoin’s currency and payment features.
2 Currencies that become widely used as a medium of exchange will often for reasons of con-
venience become the unit of account, which is the third function of money. At present goods and services priced in bitcoin units (e.g., 0.486 mBTC) tend to see the number of mBTC fluctuate in lock-step with changes in bitcoin’s exchange rate against national currencies like the U.S. dollar. Were bitcoin serving as an actual unit of account we would not expect to see such regular fluctuations in the number of mBTC required to complete a purchase. In other words, bitcoin is not at present serving as a widely used unit of account. Further, it is unlike-ly to become one until either its relative volatility decreases and or it becomes more widely used as a medium of exchange.
2 Index methodology and data
An effort was made to include as many significant variables related to bitcoin’s poten-tial utility so as to provide a nuanced view of the myriad of forces that influence why bitcoin might prove more useful in one location over another. A further effort was made to include in the BMPI data from a wide variety of reliable sources, including governments, multinational agencies, private companies and academic research. The most recent data available as of third quarter of 2014 were collected.3 In total nine principal sources of data were used to construct the BMPI (Table 1). The relationships between most of the BMPI variables should be self-evident for those generally familiar with bitcoin. For example, bitcoin is fundamentally a tech-nology, and the level of technology adoption in a country as reflected in measures such as internet use and mobile device penetration will have an important influence on bitcoin adoption. Further, bitcoin’s prospects for adoption are enhanced by net-work effects associated with greater exposure to and awareness of bitcoin. Countries with more venture capital backed bitcoin startups, bitcoin client software downloads and nodes, and relative bitcoin Google searches rank higher in the BMPI. International remittances are considered by some to be one of the most compelling near-term use cases for bitcoin because of the high fees and poor exchange rates of-fered through existing providers.4 Countries with relatively large remittance markets and higher average remittance fees rank higher in the BMPI. A use case for bitcoin that has already received considerable attention are informal markets (black markets). Due to the anonymity, efficiencies and other conveniences afforded by crypto curren-cies illegal transactions were one of the first economic activities where bitcoin gained use as an alternative currency.5 A country with a relatively large informal market presents more opportunity for bitcoin use and therefore ranks higher in the BMPI. Bitcoin can also be used to circumvent capital controls, restrictions on ownership of gold and foreign banknotes, or other forms of financial repression. Notably, some countries like Iceland have deemed it illegal to use bitcoin as a means to bypass capi-tal controls.6 However, it is unclear what effect if any these restrictions have had giv-
3 In some instances the sources from Table 1 were supplemented with other data where appro-
priate, such as to reflect recent events. For example, Reinhart and Rogoff’s 2010 financial crisis data were updated to include the July 2014 sovereign default by Argentina, as ruled by the International Swaps and Dealers Association. Due to space constraints in this paper a full list of all source supplementations and adjustments is available as a separate Appendix on the author’s website: http://www.garrickhileman.com/p/research.html
4 (CIRASINO 2013) Several bitcoin startups that have been launched to specifically focus on the international remittance market in just Kenya (i.e., BitPesa, Kapochi). For a more pessi-mistic view on bitcoin’s usefulness as a remittance alternative see (Böhme et al. 2014, , p. 11)
5 (Christin 2012) 6 In a written response to Morgunbladid, an Icelandic media outlet, the Icelandic Central Bank
stated the Foreign Exchange Act, which provides for general restrictions on foreign ex-change and capital movements, that "It does not seem that the provisions of the Act that ex-empt goods and services from such restrictions shall not apply to transactions with Bitcoin”
en that the decentralized and semi-anonymous nature of bitcoin allows users to con-tinue to hold, transact and transfer bitcoins into and out of countries such as Iceland. Bitcoin therefore remains a viable means to bypass financial restrictions than can more readily be enforced through traditional banking channels, and countries with a relatively higher degree of financial repression will also rank higher in the BMPI. Also, the memory of recent financial crises, particularly hyperinflation or a currency crisis, has historically had an influence on those seeking an alternative currencies and store of value.7 The higher the frequency and size of financial crises for a particular country, then the higher that country will rank in the BMPI. The BMPI is comprised of 40 variables deemed important to bitcoin’s potential for adoption, and these 40 variables are grouped into seven equally-weighted sub-indices to calculate BMPI’s rankings (Table 1). Index variable weighting Some of the 40 BMPI variables will have a greater influence over bitcoin adoption than others and these variables therefore hold additional weight in the index. The different variable weights are detailed in Table 1 as follows: two numbers in paren-theses follow each sub index (e.g., (2,4)). The first number inside the parentheses indicates the number of variables for each respective sub index whose score is not further comprised of any sub variables. This first-tier of stand-alone variables carry greater weight in the index than the sub variables. The second number in the paren-theses indicates the number sub variables in each sub index that factor into the scores for their corresponding first-tier variables. While the Inflation sub index (1,0) is based on a single firs-tier variable (consumer price inflation) most of the sub-indices in Table 1 contain multiple variables. For example, the Financial Crises sub-index (3,3) has three stand-alone variable (Hyperin-flation, Currency crisis, and Inflation crisis) and three sub variables deemed to be less relevant to bitcoin adoption (External default, Domestic default, and Banking crisis). The three sub variables (External default, Domestic default, and Banking crisis) com-prise 33% each of the score for corresponding first-tier variable, ‘Other crisis epi-sodes’.
(translated from original Icelandic to English) http://www.mbl.is/vidskipti/frettir/2013/12/19/hoftin_stodva_vidskipti_med_bitcoin/
7 (Hileman 2014)
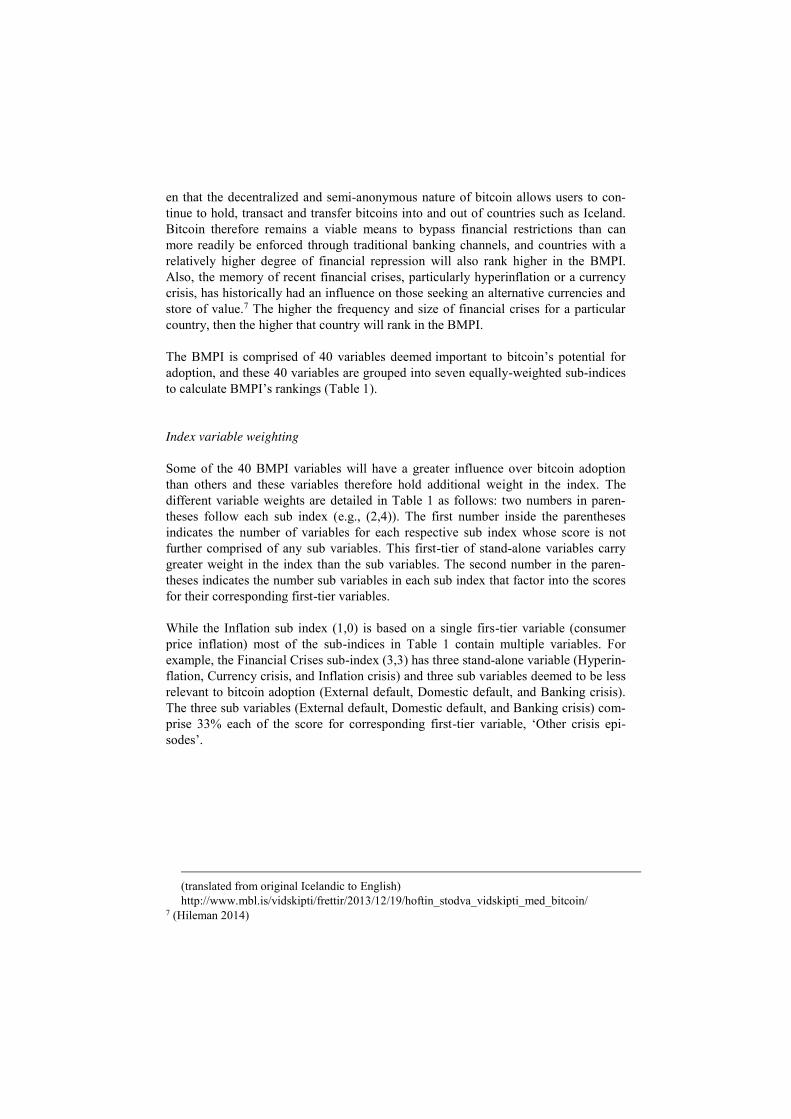
Table 1: BMPI Index Variables and Data Sources
Sub-index Variable Sub Variable Principal Sources Inflation (1,0) Inflation, consumer prices (annual %) World Bank
Black market (1,0) Informal economy as % of total economy Elgin and Oztunali (2012) Remittances (1,2) Average remittance fee, receiving country World Bank
Personal remittances Personal remittances, received (current US$)* World Bank
Personal remittances, received (as % of GDP) World Bank Technology Penetration (3,0)
Internet users per 100 people World Bank
Mobile cellular subscriptions per 100 people World Bank
Fixed broadband Internet per 100 people World Bank
Financial Crises (3,3) Hyperinflation (No. of years since 1980) Reinhart & Rogoff (2010)
Currency crises (No. of years since 1980) Reinhart & Rogoff (2010)
Inflation crises (No. of years since 1980) Reinhart & Rogoff (2010)
Other crisis episodes External default (No. of episodes since 1980) Reinhart & Rogoff (2010)
Domestic default (No. of episodes since 1980) Reinhart & Rogoff (2010)
Banking crisis (No. of years since 1980) Reinhart & Rogoff (2010)
Financial repression (12,7)
Controls on the use of domestic currency IMF
Control on the use of foreign exchange among residents IMF
Controls on trade in gold (coins No. and/or bullion) IMF
Resident Accounts in domestic currency convertible into foreign currency
IMF
Controls on exports and imports of banknotes IMF
Exports and Export Proceeds - Surrender requirements IMF
Sub-index Variable Sub Variable Principal Sources Capital Transactions - Controls on capital transactions IMF
Capital Transactions - Repatriation requirements IMF
Capital Transactions - Surrender requirements IMF
Controls on real estate transactions - Purchase abroad by residents IMF
Controls on personal capital No. transactions IMF
Transfer of assets abroad by emigrants IMF
Transfer of assets into the country by immigrants IMF
Financial sector repression (provisions specific to the financial sector)
Borrowing abroad IMF
Maintenance of accounts abroad IMF
Lending locally in foreign exchange IMF
Purchase of locally issued securities denominated in foreign exchange IMF
Insurance companies - Limits (max.) on investment portfolio held abroad IMF
Pension funds - Limits (max.) on investment portfolio held abroad IMF
Investment firms and collective investment funds - Limits (max.) on in-vestment portfolio held abroad
IMF
Bitcoin penetration (2,4) Global Bitcoin nodes a) Total nodes Bitnodes.io
b) Nodes per capita Bitnodes.io /World Bank
Bitcoin software client downloads a) Total client downloads Sourceforge.net
b) Client downloads per capita Sourceforge.net /World Bank
Google 'bitcoin' search ranking Google Trends
Bitcoin VC investment ($s per country) CoinDesk
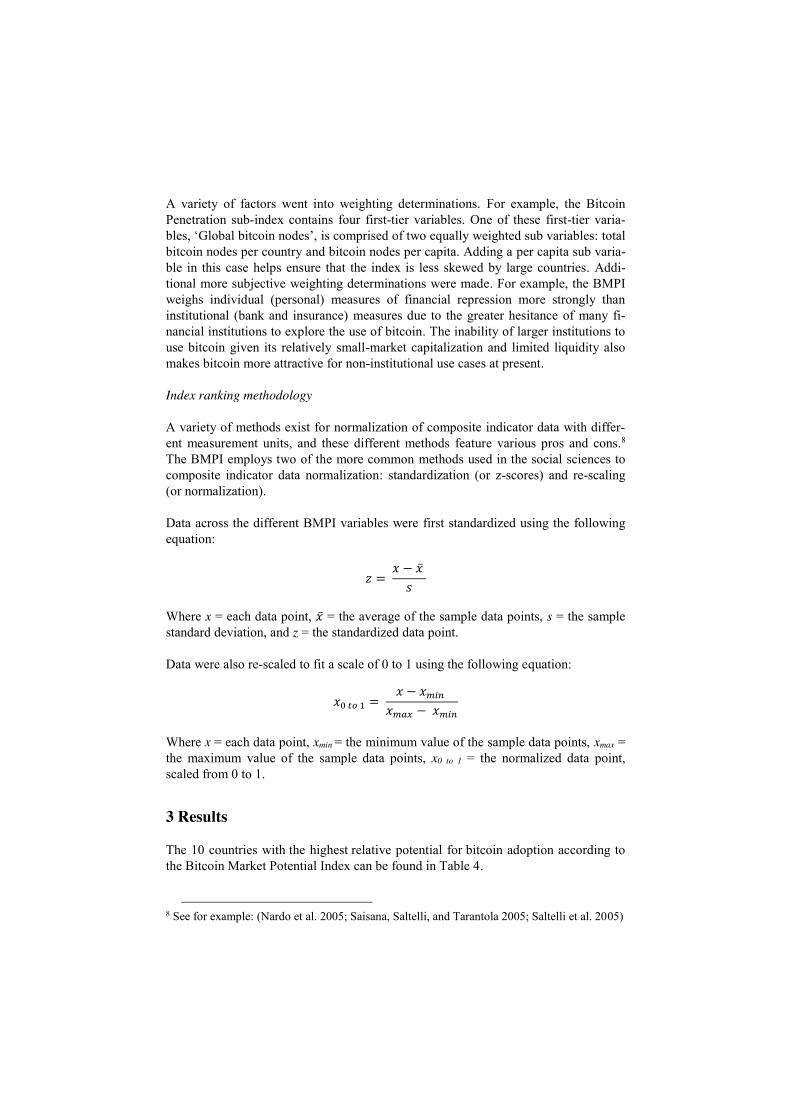
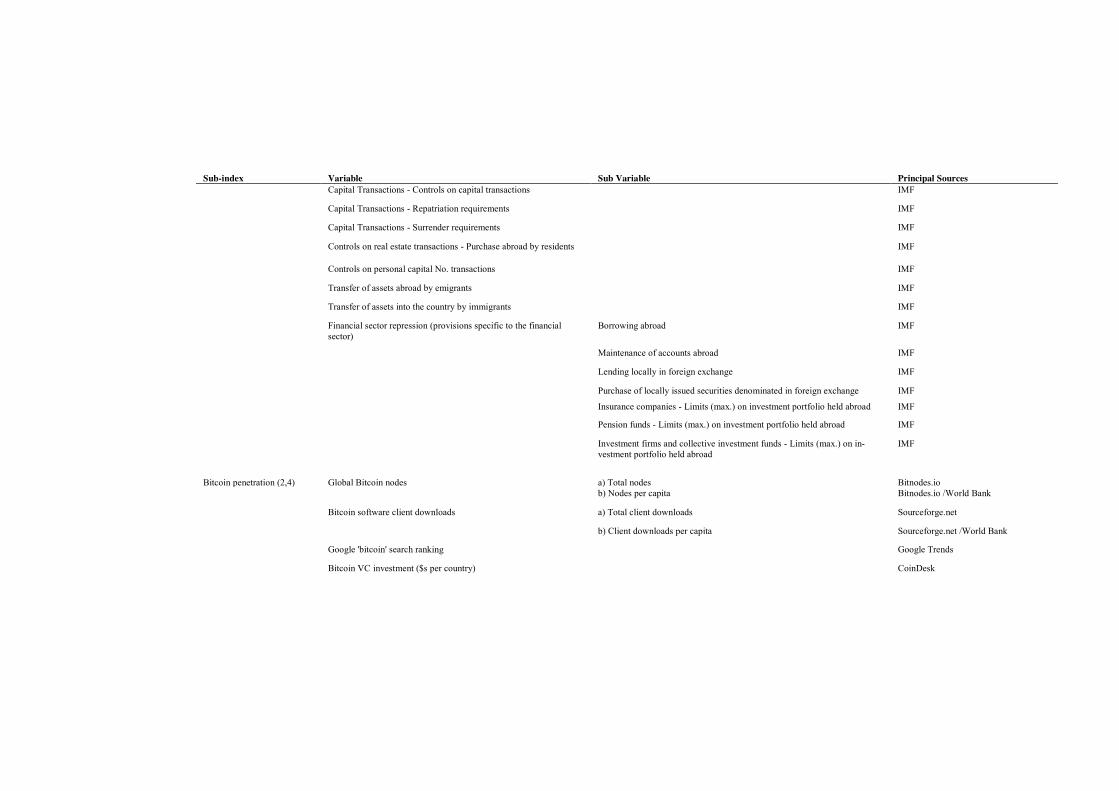
A variety of factors went into weighting determinations. For example, the Bitcoin Penetration sub-index contains four first-tier variables. One of these first-tier varia-bles, ‘Global bitcoin nodes’, is comprised of two equally weighted sub variables: total bitcoin nodes per country and bitcoin nodes per capita. Adding a per capita sub varia-ble in this case helps ensure that the index is less skewed by large countries. Addi-tional more subjective weighting determinations were made. For example, the BMPI weighs individual (personal) measures of financial repression more strongly than institutional (bank and insurance) measures due to the greater hesitance of many fi-nancial institutions to explore the use of bitcoin. The inability of larger institutions to use bitcoin given its relatively small-market capitalization and limited liquidity also makes bitcoin more attractive for non-institutional use cases at present. Index ranking methodology A variety of methods exist for normalization of composite indicator data with differ-ent measurement units, and these different methods feature various pros and cons.8 The BMPI employs two of the more common methods used in the social sciences to composite indicator data normalization: standardization (or z-scores) and re-scaling (or normalization). Data across the different BMPI variables were first standardized using the following equation:
𝑧 = 𝑥 − �̅�
𝑠
Where x = each data point, �̅� = the average of the sample data points, s = the sample standard deviation, and z = the standardized data point. Data were also re-scaled to fit a scale of 0 to 1 using the following equation:
𝑥0 𝑡𝑜 1 = 𝑥 − 𝑥𝑚𝑖𝑛
𝑥𝑚𝑎𝑥 − 𝑥𝑚𝑖𝑛
Where x = each data point, xmin = the minimum value of the sample data points, xmax = the maximum value of the sample data points, x0 to 1 = the normalized data point, scaled from 0 to 1.
3 Results
The 10 countries with the highest relative potential for bitcoin adoption according to the Bitcoin Market Potential Index can be found in Table 4.
8 See for example: (Nardo et al. 2005; Saisana, Saltelli, and Tarantola 2005; Saltelli et al. 2005)
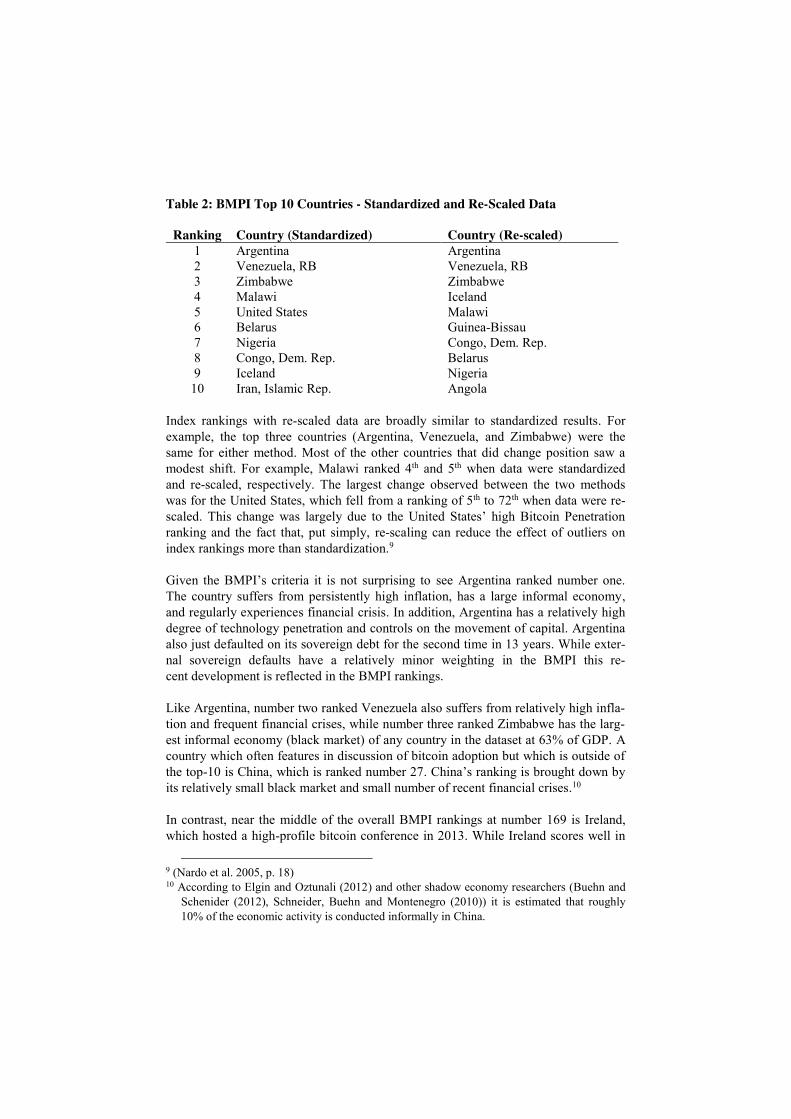
Table 2: BMPI Top 10 Countries - Standardized and Re-Scaled Data
Ranking Country (Standardized) Country (Re-scaled) 1 Argentina Argentina 2 Venezuela, RB Venezuela, RB 3 Zimbabwe Zimbabwe 4 Malawi Iceland 5 United States Malawi 6 Belarus Guinea-Bissau 7 Nigeria Congo, Dem. Rep. 8 Congo, Dem. Rep. Belarus 9 Iceland Nigeria
10 Iran, Islamic Rep. Angola Index rankings with re-scaled data are broadly similar to standardized results. For example, the top three countries (Argentina, Venezuela, and Zimbabwe) were the same for either method. Most of the other countries that did change position saw a modest shift. For example, Malawi ranked 4th and 5th when data were standardized and re-scaled, respectively. The largest change observed between the two methods was for the United States, which fell from a ranking of 5th to 72th when data were re-scaled. This change was largely due to the United States’ high Bitcoin Penetration ranking and the fact that, put simply, re-scaling can reduce the effect of outliers on index rankings more than standardization.9 Given the BMPI’s criteria it is not surprising to see Argentina ranked number one. The country suffers from persistently high inflation, has a large informal economy, and regularly experiences financial crisis. In addition, Argentina has a relatively high degree of technology penetration and controls on the movement of capital. Argentina also just defaulted on its sovereign debt for the second time in 13 years. While exter-nal sovereign defaults have a relatively minor weighting in the BMPI this re-cent development is reflected in the BMPI rankings. Like Argentina, number two ranked Venezuela also suffers from relatively high infla-tion and frequent financial crises, while number three ranked Zimbabwe has the larg-est informal economy (black market) of any country in the dataset at 63% of GDP. A country which often features in discussion of bitcoin adoption but which is outside of the top-10 is China, which is ranked number 27. China’s ranking is brought down by its relatively small black market and small number of recent financial crises.10 In contrast, near the middle of the overall BMPI rankings at number 169 is Ireland, which hosted a high-profile bitcoin conference in 2013. While Ireland scores well in
9 (Nardo et al. 2005, p. 18) 10 According to Elgin and Oztunali (2012) and other shadow economy researchers (Buehn and
Schenider (2012), Schneider, Buehn and Montenegro (2010)) it is estimated that roughly 10% of the economic activity is conducted informally in China.
some categories, such as technology and bitcoin penetration, the country has wrestled with deflationary pressures in recent years and also has a relatively limited set of re-strictions on the flow of capital. Dublin is a global tech hub, however, and the fact that the BMPI does not include a separate tech hub variable brings down Ireland’s ranking. Sub-Saharan Africa is the most fertile region for bitcoin adoption, followed by Latin America and the Post-Soviet/Communist countries (Figure 2). Figure 2: BMPI Regional Concentration - Standardized Data BMPI Regional Distribution - Top 10 BMPI Regional Distribution - Top 30
An interactive online BMPI ‘heat map’ is depicted below (Figure 3). A full list of the BMPI rankings is in Appendix A. Figure 3: BMPI Online Interactive Heat Map11
11 Interactive map is located at www.bitcoiniq.info
Asia, 0%Europe,
10%Middle East & North Africa,
10%
Latin America,
20%
U.S. & Canada,
10%
Sub-Saharan Africa,
40%
Post-Soviet/Communist, 10%
Asia, 7%
Europe, 3% Middle
East & North Africa, 13%
Latin America, 17%
U.S. & Canada
, 3%
Sub-Saharan Africa,
40%
Post-Soviet/Com
munist, 17%
4 Conclusion and research agenda
While the BMPI provides a useful conceptual reference for better understanding the factors that may influence bitcoin adoption it is important to acknowledge some of the index’s current limitations and how those limitations can be addressed in future re-search. Specifically, due to limited data availability a number of variables that will impact bitcoin adoption are not currently included in the index. In the interest of al-lowing for maximum global coverage a number of relevant variables that simply did not have sufficient country data were excluded.12 With bitcoin it could also have been useful (and more precise) to examine which cities or regions rather than countries may see the fastest bitcoin adoption. However, much of the relevant data is only available at country level and, as a result, the BMPI analysis is a country-level index. Just as the choice of variables included in the BMPI must be defended some justifica-tion should be provided for why some variables were omitted from the BMPI. For example, one area that was excluded from the BMPI but which could have a signifi-cant influence on bitcoin adoption is bitcoin regulation. There are three primary rea-sons why bitcoin regulation was excluded from the BMPI for now: first, bitcoin regu-lation is a recent development and still evolving; second, it is unclear what bitcoin regulation actually signals; third, the efficacy of bitcoin regulation is uncertain. For example, more aggressive bitcoin regulation in countries such as Ecuador and Bolivia may ultimately serve as a significant barrier to bitcoin’s prospects in those countries. However, aggressive bitcoin regulation could also provide a signal from regulators about bitcoin’s positive adoption prospects in that country. This latter phenomena is perhaps the case for China, where bitcoin exchange trading volumes have continued to remain strong in spite of stricter bitcoin regulations. In sum, it is too early to tell how to score bitcoin regulation and this category has therefore not been included in the overall BMPI rankings. The data set is structured in such a way that it can also be used to construct alternative versions of the index around different assumptions or use cases. For example, one may believe that bitcoin does not have as much immediate potential in the interna-tional remittances market as compared to its use as a store of value, or that another crypto currency such as Darkcoin will supplant bitcoin as the preferred crypto curren-
12 For example, smartphone penetration data is unfortunately only available for 48 countries
(Our Mobile Planet http://think.withgoogle.com/mobileplanet/en/). If this variable were to be included in the index then the BMPI would then need exclude countries which do not have smartphone penetration data. This would result in a less global BMPI as the index would lose nearly 130 countries. In the specific case of smartphone penetration data, while not a perfect proxy other variables that are included in the index, such as broadband and mobile phone penetration, do also serve as an approximate proxy for smartphones. Another data point which could potentially be helpful for understanding bitcoin adoption is how quickly social norms spread across different countries. After all, using bitcoin requires at least some change in existing behavior. However, the relevant study on smoking adoption and cessation only covered 25 countries (Lang et al 2014).
cy in the black market.13 Such scenarios can be incorporated into alternative calcula-tions of the BMPI by removing the corresponding variables and or adjusting weights. Finally, measuring actual bitcoin adoption against the BMPI forecast presents a num-ber of challenges, including the lack of individual country data for many adoption metrics. Obtaining country level adoption data would help test the BMPI’s accuracy.
References and index data sources
Bitnodes.io. Number of bitcoin nodes, July 2014
Böhme, Rainer, Nicolas Christin, Benjamin G Edelman, and Tyler Moore. 2014. Bitcoin. Journal of Economic Perspectives, Forthcoming:15-015.
Christin, Nicolas. 2012. Traveling the Silk Road: A measurement analysis of a large anonymous online marketplace. arXiv preprint arXiv:1207.7139.
CIRASINO, MASSIMO 2013. How can we cut the high costs of remittances to Africa? In The World Bank: The World Bank.
Hileman, G. 2014. A History of Alternative Currencies.
Nardo, Michela, Michaela Saisana, Andrea Saltelli, Stefano Tarantola, Anders Hoffman, and Enrico Giovannini. 2005. Handbook on constructing composite indicators: methodology and user guide. OECD publishing.
Saisana, Michaela, Andrea Saltelli, and Stefano Tarantola. 2005. Uncertainty and sensitivity analysis techniques as tools for the quality assessment of composite indicators. Journal of the Royal Statistical Society: Series A (Statistics in Society) 168 (2):307-323.
Saltelli, Andrea, Michela Nardo, Michaela Saisana, and Stefano Tarantola. 2005. Composite indicators: the controversy and the way forward. Statistics, Knowledge and Policy Key Indicators to Inform Decision Making: Key Indicators to Inform Decision Making:359.
Sourceforge.net, Bitcoin client downloads, July 2014 World Bank country database, 2012-2013
13 For more on Darkcoin see http://www.wired.com/2014/05/darkcoin-is-booming/
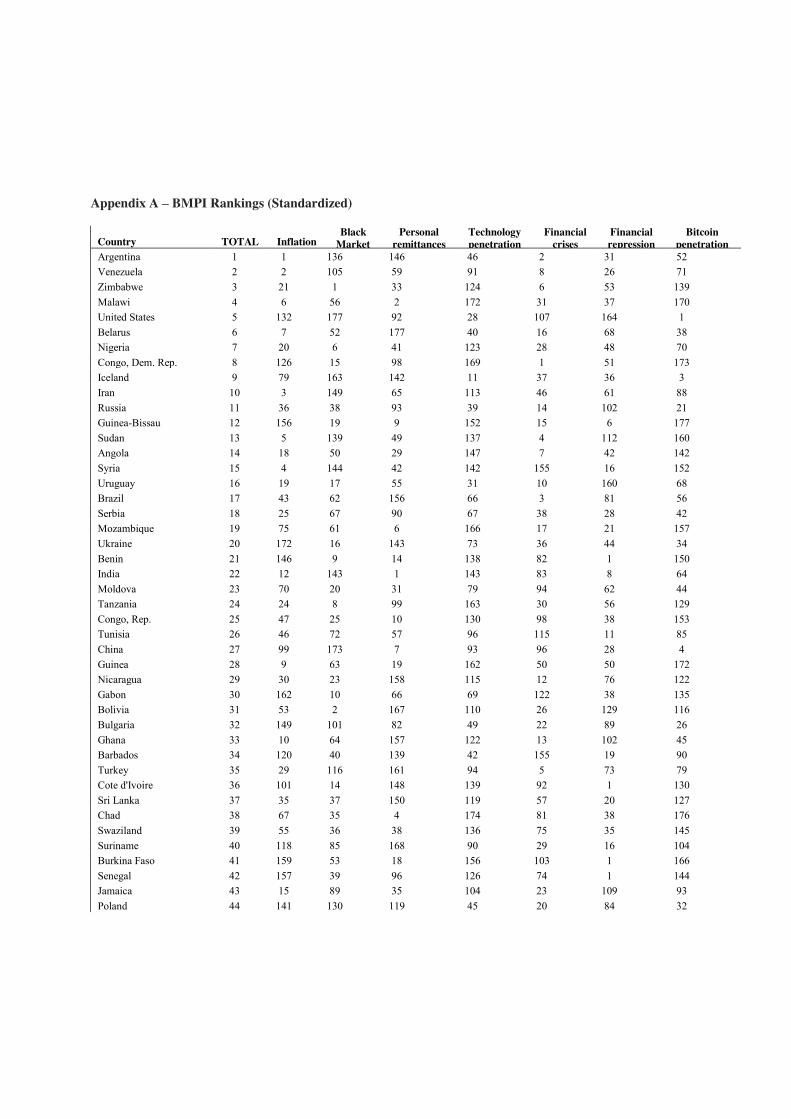
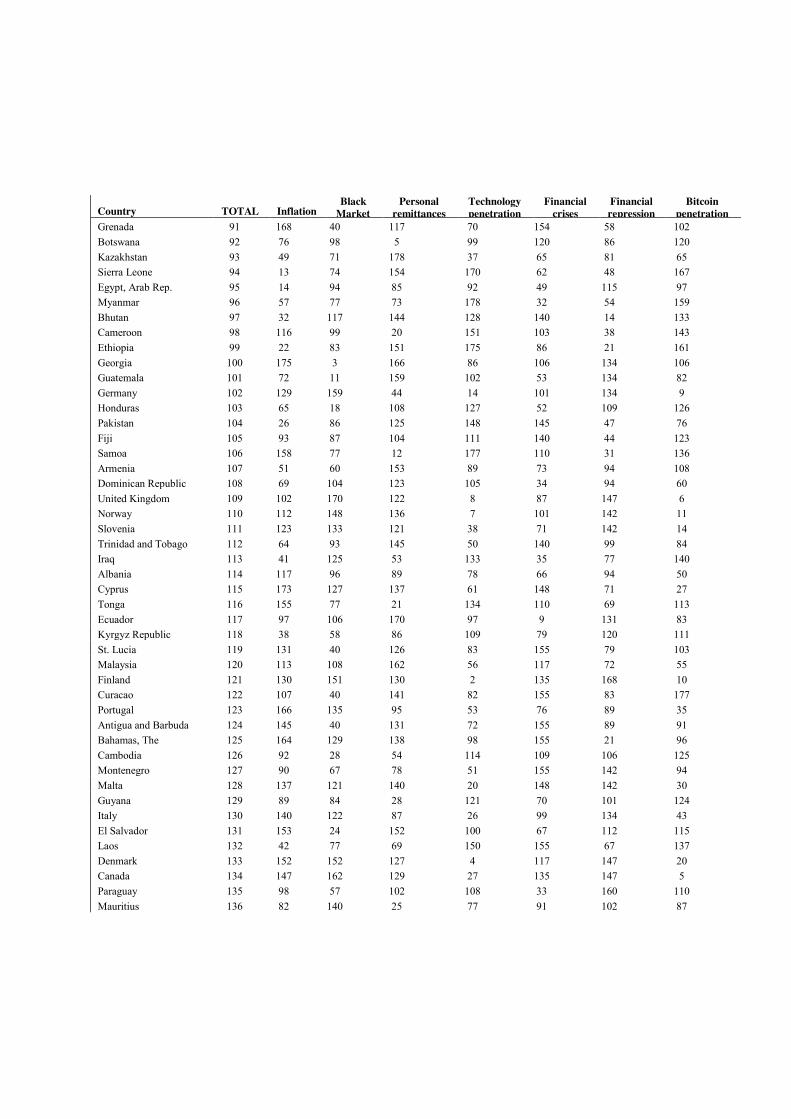
Appendix A – BMPI Rankings (Standardized)
Country TOTAL Inflation Black
Market Personal
remittances Technology penetration
Financial crises
Financial repression
Bitcoin penetration
Argentina 1 1 136 146 46 2 31 52 Venezuela 2 2 105 59 91 8 26 71 Zimbabwe 3 21 1 33 124 6 53 139 Malawi 4 6 56 2 172 31 37 170 United States 5 132 177 92 28 107 164 1 Belarus 6 7 52 177 40 16 68 38 Nigeria 7 20 6 41 123 28 48 70 Congo, Dem. Rep. 8 126 15 98 169 1 51 173 Iceland 9 79 163 142 11 37 36 3 Iran 10 3 149 65 113 46 61 88 Russia 11 36 38 93 39 14 102 21 Guinea-Bissau 12 156 19 9 152 15 6 177 Sudan 13 5 139 49 137 4 112 160 Angola 14 18 50 29 147 7 42 142 Syria 15 4 144 42 142 155 16 152 Uruguay 16 19 17 55 31 10 160 68 Brazil 17 43 62 156 66 3 81 56 Serbia 18 25 67 90 67 38 28 42 Mozambique 19 75 61 6 166 17 21 157 Ukraine 20 172 16 143 73 36 44 34 Benin 21 146 9 14 138 82 1 150 India 22 12 143 1 143 83 8 64 Moldova 23 70 20 31 79 94 62 44 Tanzania 24 24 8 99 163 30 56 129 Congo, Rep. 25 47 25 10 130 98 38 153 Tunisia 26 46 72 57 96 115 11 85 China 27 99 173 7 93 96 28 4 Guinea 28 9 63 19 162 50 50 172 Nicaragua 29 30 23 158 115 12 76 122 Gabon 30 162 10 66 69 122 38 135 Bolivia 31 53 2 167 110 26 129 116 Bulgaria 32 149 101 82 49 22 89 26 Ghana 33 10 64 157 122 13 102 45 Barbados 34 120 40 139 42 155 19 90 Turkey 35 29 116 161 94 5 73 79 Cote d'Ivoire 36 101 14 148 139 92 1 130 Sri Lanka 37 35 37 150 119 57 20 127 Chad 38 67 35 4 174 81 38 176 Swaziland 39 55 36 38 136 75 35 145 Suriname 40 118 85 168 90 29 16 104 Burkina Faso 41 159 53 18 156 103 1 166 Senegal 42 157 39 96 126 74 1 144 Jamaica 43 15 89 35 104 23 109 93 Poland 44 141 130 119 45 20 84 32
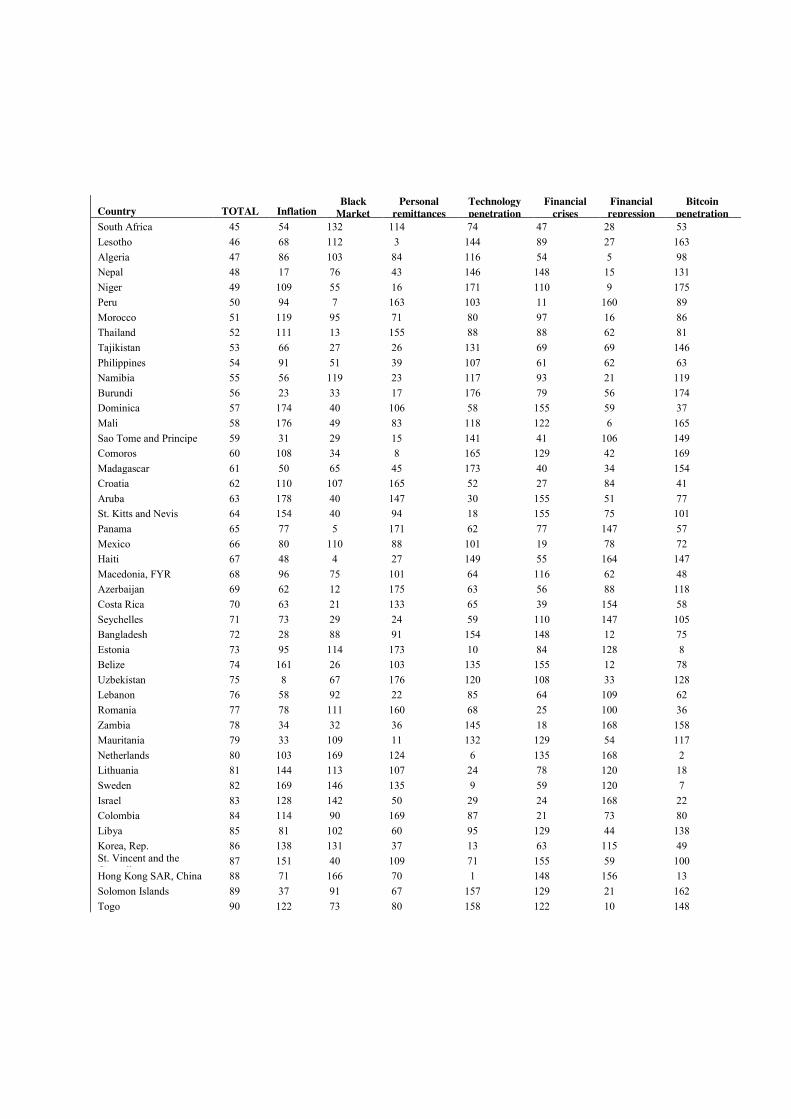
Country TOTAL Inflation Black
Market Personal
remittances Technology penetration
Financial crises
Financial repression
Bitcoin penetration
South Africa 45 54 132 114 74 47 28 53 Lesotho 46 68 112 3 144 89 27 163 Algeria 47 86 103 84 116 54 5 98 Nepal 48 17 76 43 146 148 15 131 Niger 49 109 55 16 171 110 9 175 Peru 50 94 7 163 103 11 160 89 Morocco 51 119 95 71 80 97 16 86 Thailand 52 111 13 155 88 88 62 81 Tajikistan 53 66 27 26 131 69 69 146 Philippines 54 91 51 39 107 61 62 63 Namibia 55 56 119 23 117 93 21 119 Burundi 56 23 33 17 176 79 56 174 Dominica 57 174 40 106 58 155 59 37 Mali 58 176 49 83 118 122 6 165 Sao Tome and Principe 59 31 29 15 141 41 106 149 Comoros 60 108 34 8 165 129 42 169 Madagascar 61 50 65 45 173 40 34 154 Croatia 62 110 107 165 52 27 84 41 Aruba 63 178 40 147 30 155 51 77 St. Kitts and Nevis 64 154 40 94 18 155 75 101 Panama 65 77 5 171 62 77 147 57 Mexico 66 80 110 88 101 19 78 72 Haiti 67 48 4 27 149 55 164 147 Macedonia, FYR 68 96 75 101 64 116 62 48 Azerbaijan 69 62 12 175 63 56 88 118 Costa Rica 70 63 21 133 65 39 154 58 Seychelles 71 73 29 24 59 110 147 105 Bangladesh 72 28 88 91 154 148 12 75 Estonia 73 95 114 173 10 84 128 8 Belize 74 161 26 103 135 155 12 78 Uzbekistan 75 8 67 176 120 108 33 128 Lebanon 76 58 92 22 85 64 109 62 Romania 77 78 111 160 68 25 100 36 Zambia 78 34 32 36 145 18 168 158 Mauritania 79 33 109 11 132 129 54 117 Netherlands 80 103 169 124 6 135 168 2 Lithuania 81 144 113 107 24 78 120 18 Sweden 82 169 146 135 9 59 120 7 Israel 83 128 142 50 29 24 168 22 Colombia 84 114 90 169 87 21 73 80 Libya 85 81 102 60 95 129 44 138 Korea, Rep. 86 138 131 37 13 63 115 49 St. Vincent and the Grenadines
87 151 40 109 71 155 59 100 Hong Kong SAR, China 88 71 166 70 1 148 156 13 Solomon Islands 89 37 91 67 157 129 21 162 Togo 90 122 73 80 158 122 10 148
Country TOTAL Inflation Black
Market Personal
remittances Technology penetration
Financial crises
Financial repression
Bitcoin penetration
Grenada 91 168 40 117 70 154 58 102 Botswana 92 76 98 5 99 120 86 120 Kazakhstan 93 49 71 178 37 65 81 65 Sierra Leone 94 13 74 154 170 62 48 167 Egypt, Arab Rep. 95 14 94 85 92 49 115 97 Myanmar 96 57 77 73 178 32 54 159 Bhutan 97 32 117 144 128 140 14 133 Cameroon 98 116 99 20 151 103 38 143 Ethiopia 99 22 83 151 175 86 21 161 Georgia 100 175 3 166 86 106 134 106 Guatemala 101 72 11 159 102 53 134 82 Germany 102 129 159 44 14 101 134 9 Honduras 103 65 18 108 127 52 109 126 Pakistan 104 26 86 125 148 145 47 76 Fiji 105 93 87 104 111 140 44 123 Samoa 106 158 77 12 177 110 31 136 Armenia 107 51 60 153 89 73 94 108 Dominican Republic 108 69 104 123 105 34 94 60 United Kingdom 109 102 170 122 8 87 147 6 Norway 110 112 148 136 7 101 142 11 Slovenia 111 123 133 121 38 71 142 14 Trinidad and Tobago 112 64 93 145 50 140 99 84 Iraq 113 41 125 53 133 35 77 140 Albania 114 117 96 89 78 66 94 50 Cyprus 115 173 127 137 61 148 71 27 Tonga 116 155 77 21 134 110 69 113 Ecuador 117 97 106 170 97 9 131 83 Kyrgyz Republic 118 38 58 86 109 79 120 111 St. Lucia 119 131 40 126 83 155 79 103 Malaysia 120 113 108 162 56 117 72 55 Finland 121 130 151 130 2 135 168 10 Curacao 122 107 40 141 82 155 83 177 Portugal 123 166 135 95 53 76 89 35 Antigua and Barbuda 124 145 40 131 72 155 89 91 Bahamas, The 125 164 129 138 98 155 21 96 Cambodia 126 92 28 54 114 109 106 125 Montenegro 127 90 67 78 51 155 142 94 Malta 128 137 121 140 20 148 142 30 Guyana 129 89 84 28 121 70 101 124 Italy 130 140 122 87 26 99 134 43 El Salvador 131 153 24 152 100 67 112 115 Laos 132 42 77 69 150 155 67 137 Denmark 133 152 152 127 4 117 147 20 Canada 134 147 162 129 27 135 147 5 Paraguay 135 98 57 102 108 33 160 110 Mauritius 136 82 140 25 77 91 102 87
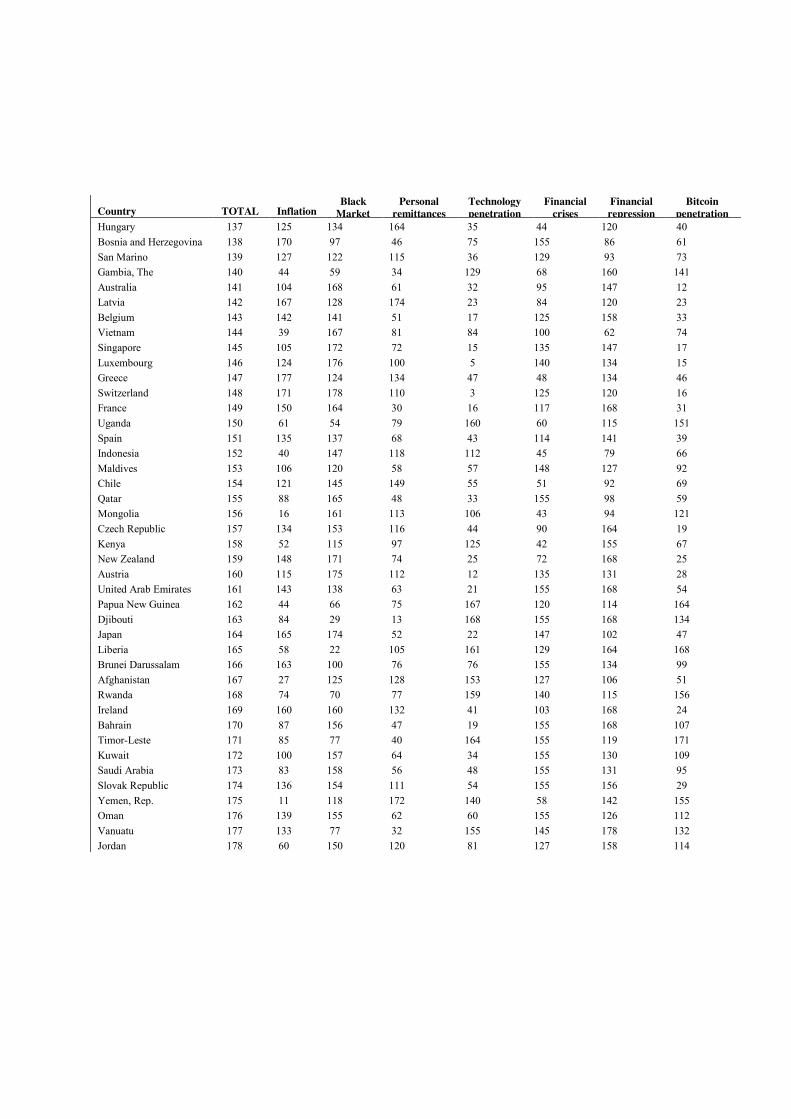
Country TOTAL Inflation Black
Market Personal
remittances Technology penetration
Financial crises
Financial repression
Bitcoin penetration
Hungary 137 125 134 164 35 44 120 40 Bosnia and Herzegovina 138 170 97 46 75 155 86 61 San Marino 139 127 122 115 36 129 93 73 Gambia, The 140 44 59 34 129 68 160 141 Australia 141 104 168 61 32 95 147 12 Latvia 142 167 128 174 23 84 120 23 Belgium 143 142 141 51 17 125 158 33 Vietnam 144 39 167 81 84 100 62 74 Singapore 145 105 172 72 15 135 147 17 Luxembourg 146 124 176 100 5 140 134 15 Greece 147 177 124 134 47 48 134 46 Switzerland 148 171 178 110 3 125 120 16 France 149 150 164 30 16 117 168 31 Uganda 150 61 54 79 160 60 115 151 Spain 151 135 137 68 43 114 141 39 Indonesia 152 40 147 118 112 45 79 66 Maldives 153 106 120 58 57 148 127 92 Chile 154 121 145 149 55 51 92 69 Qatar 155 88 165 48 33 155 98 59 Mongolia 156 16 161 113 106 43 94 121 Czech Republic 157 134 153 116 44 90 164 19 Kenya 158 52 115 97 125 42 155 67 New Zealand 159 148 171 74 25 72 168 25 Austria 160 115 175 112 12 135 131 28 United Arab Emirates 161 143 138 63 21 155 168 54 Papua New Guinea 162 44 66 75 167 120 114 164 Djibouti 163 84 29 13 168 155 168 134 Japan 164 165 174 52 22 147 102 47 Liberia 165 58 22 105 161 129 164 168 Brunei Darussalam 166 163 100 76 76 155 134 99 Afghanistan 167 27 125 128 153 127 106 51 Rwanda 168 74 70 77 159 140 115 156 Ireland 169 160 160 132 41 103 168 24 Bahrain 170 87 156 47 19 155 168 107 Timor-Leste 171 85 77 40 164 155 119 171 Kuwait 172 100 157 64 34 155 130 109 Saudi Arabia 173 83 158 56 48 155 131 95 Slovak Republic 174 136 154 111 54 155 156 29 Yemen, Rep. 175 11 118 172 140 58 142 155 Oman 176 139 155 62 60 155 126 112 Vanuatu 177 133 77 32 155 145 178 132 Jordan 178 60 150 120 81 127 158 114


![Bitcoin: An Innovative Alternative Digital Currencybitcoinaffiliatelist.com/wp-content/uploads/bitcoin-by-reubengrin... · WINTER 2012] BITCOIN: ALTERNATIVE DIGITAL CURRENCY 161 Bitcoin](https://img.pdfslide.us/doc/110x75/5c65aca109d3f2916e8d2298/bitcoin-an-innovative-alternative-digital-currency-winter-2012-bitcoin-alternative.jpg)