Embed Size (px)
Citation preview
THE BIOCHEMISTRY OF MAGNESIUM DEFICIENCY*
II. THE MINIMUM MAGNESIUM REQUIREMENT FOR GROWTH, GESTATION, AND LACTATION, AND THE EFFECT OF
THE DIETARY CALCIUM LEVEL THEREON
BY ELMA V. TUFTS? AND DAVID M. GREENBERG
(From the Division of Biochemistry, Univers,ity oj California Medical School, Berkeley)
(Received for publication, August 11, 1937)
Information concerning the minimum intake which will main- tain the well being of the animal is an important item in the evalu- ation of the nutritional significance of a dietary component. As will be brought out below, a fixed value cannot be given for the minimum requirement of a given element. The amount required will be found to vary with varying conditions of the life history of the animal, and also in relation to the intake of other com- ponents of the diet.
To obtain an estimate of the minimum magnesium requirement for the rat, we have attempted to determine the lowest magnesium level in the diet at which animals grow and reproduce normally and are maintained in a state of good health otherwise. In con- nection with this work it was found that the dietary calcium level has a very important effect in altering the minimum magnesium requirement.
Certain data were already available which gave a clue to the amount of magnesium necessary to meet the needs of the rat dur-
* This work has been aided by grants from the Christine Breon Fund for Medical Research and the Division of Natural Sciences of the Rockefeller Foundation. Valuable assistance has been rendered by the Works Progress Administration.
t This communication is constructed from a thesis submitted to the Graduate Division of the University of California by Elma V. Tufts in partial fulfilment of the requirements for the degree of Doctor of Philosophy.
715
by guest on October 11, 2017
http://ww
w.jbc.org/
Dow
nloaded from
716 Magnesium Deficiency. II
ing growth. Osborne and Mendel (1) found that rats on a dietary level of 12 mg. of Mg per 100 gm. of food grew normally and showed no other ill effects for a period of nearly a year. Subse- quently they dropped off about 20 per cent in weight. Medes (2) obtained good growth and observed no external ill effects on a diet containing 6 mg. of Mg per 100 gm. of food. Chemically, however, she did find a reduction in the percentage of magnesium and some increase in the calcium percentage of the whole rat car- cass. It is of interest to note that the calcium contents of the above diets were fairly low. The Osborne and Mendel diet con- tained about 0.2 per cent calcium, and in the work of Medes it varied between 0.2 and 0.4 per cent. No data have appeared hitherto which would give a clue as to the amount of magnesium in the diet required to meet the’needs of the animal during the period of gestation and lactation.
Diets and Experimental Procedures
The general composition of the diets employed in this work, as well as the analytical methods employed, are the same as those given in Paper I of this series (3). The basal ration consisted of casein, sucrose, and fat supplemented with the fat-soluble and the water-soluble vitamins. For sources of the water-soluble vita- mins, a 3 per cent level of Galen B was used to supply vitamin B, and a 2 per cent Lilly’s liver extract’ to supply the vitamin G complex. The magnesium, calcium, and phosphorus composition of the diets is recorded in Table I. In all cases control experi- ments were run with diets which differed from the deficient series only by the addition of magnesium sulfate to give a content of 50 mg. of Mg per 100 gm. of food.
Results
With Diets of Moderate Calcium Content-The work of Medes indicated that a diet containing 6 mg. of Mg per 100 gm. of food was approaching the minimum requirement of this element. With this as a guide, the dietary level of 5 mg. of Mg per 100 gm. of food was chosen for use in the main part of the present study.
1 We are indebted to Vitab Products, Inc., of Berkeley and to Eli Lilly and Company for their generosity in supplying us with vitamin B and liver extracts, respectively.
by guest on October 11, 2017
http://ww
w.jbc.org/
Dow
nloaded from
E. V. Tufts and D. M. Greenberg 717
It has been pointed out in another place (4) that the symptoms of magnesium deficiency vary more and more in their time of on- set and their time relationship to each other as the magnesium in the diet is increased. At a level of 2 mg. of Mg per 100 gm. of food the deficiency appears as a fairly fixed syndrome of vaso- dilatation, followed by hyperexcitability and malnutrition. At the 5 mg. of magnesium level the symptoms of vasodilatation and hyperexcitability may develop, but the picture is extremely variable. Vasodilatation may develop to an extreme degree and is recurrent. Only about one-fourth of the animals became hyper- excitable during the first 2 or 3 weeks of the experiment, and this symptom soon disappeared. Other manifestations of hyperex- citability did not appear until after more than 70 days on the diet.
TABLE I
Mineral Composition of Experimental Diets
Diet No. Magnesium per 100 gm. food Calcium Phosphorus
“8. per cent per cent 5-L-Ca 5.0 0.39 0.45 5-M-Ca 5.0 0.87 0.80 5-H-Ca 5.0 1.16 0.75
13-H-Ca 13.0 1.66 1.00
In diets labeled L and M, calcium was supplied as CaHP04; in diets H, as Cas(P01)2.
Rats which had no previous record of convulsions frequently became hyperexcitable when subjected to the added strain of preg- nancy and lactation.
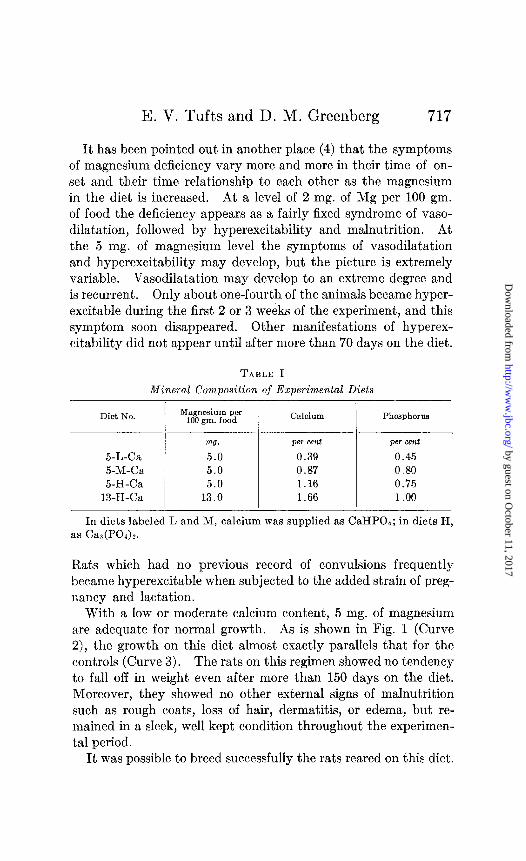
With a low or moderate calcium content, 5 mg. of magnesium are adequate for normal growth. As is shown in Fig. 1 (Curve 2), the growth on this diet almost exactly parallels that for the controls (Curve 3). The rats on this regimen showed no tendency to fall off in weight even after more than 150 days on the diet. Moreover, they showed no other external signs of malnutrition such as rough coats, loss of hair, dermatitis, or edema, but re- mained in a sleek, well kept condition throughout the experimen- tal period.
It was possible to breed successfully the rats reared on this diet.
by guest on October 11, 2017
http://ww
w.jbc.org/
Dow
nloaded from
718 Magnesium Deficiency. II
The animals were bred at an age of 80 to 120 days and gave birth to normal young with an average weight of 5 gm. In a great many cases the mothers refused to nurse the young and either let them starve or devoured them. We succeeded, however, in rearing a number of litters of four young rats each to a month or more of age. Thus when the calcium content is not over about 0.9 per cent, the level of 5 mg. of Mg per 100 gm. of food appears to be on the border line of the dietary requirement. At this magnesium content, symptoms of deficiency appear only at times of great stress in the metabolic processes; namely, during the most active period of growth, and during pregnancy and lactation.
(j-)200- 2 / /’ /
40 40 DAYS -i TIME
FIG. 1. Effect of low and high calcium diets on growth in magnesium deficiency. The curves are drawn from the data of groups of six animals each. Curve 1, Diet 5-H-Ca; Curve ‘2, Diet 5-L-Ca; Curve 3, control diet. The control curve is represented by the broken line.
The young from the mothers on this diet are normal in weight and in magnesium content at birth, but develop a deficiency of body magnesium during lactation. The per cent magnesium did not increase in their bodies as it does in young rats suckled by mothers on a diet higher in magnesium. The deficiency in body magnesium is accompanied by the usual symptoms of vasodilata- tion and hyperexcitability. On the other hand, the growth curves and external appearance of the young are normal over the lacta- tion period. The kidneys of these young rats sacrificed at wean- ing showed no evidence of renal damage.
Since the hyperirritability and deficiency of body magnesium develop during the nursing period, we may conclude that the mother’s milk was deficient in magnesium.
by guest on October 11, 2017
http://ww
w.jbc.org/
Dow
nloaded from
E. V. Tufts and D. M. Greenberg 719
It is interesting to note at this point that the young whose mothers were on the control diet containing 50 mg. of Mg per 100 gm. of food were somewhat lower in total magnesium content than were the stock animals of the same age. Evidently even the control diet is not optimum in magnesium content for lacta- tion.
The magnesium contents of the bodies of deficient, control, and stock young are summarized in Table II.
E$ect of Raising Calcium Content of Diet-By increasing the calcium content from 0.87 to 1.16 and 1.66 per cent in the diet we have been able to show the remarkable influence of the calcium intake on magnesium deficiency.
TABLE II
Comparison of Body Magnesium Content of Young Rats from Litters of Mothers on Experimental Diets and Those on Stock Diet
Age No. of animah
-~
wks.
0 9 3 6 5 2 6 2
Whole body mag- neiuml deficient
arnmals No. of animala
Range Meall __~
mo. mg. per cent Per
cent
14.4-24.4 19.8 18.8-23.3 20.0 3
17.4 4 18.8
Whole body mag- nesium, controls No. of
snimalt
Range Mean ____
w-7. mg. per cent P@”
cent
12 24.6-26.0 25.5 8 26.2-35.4 29.9 5
4
Whole body mag- nesium, stock
animals
Range Mean
mg. mg. per cent Per cent 21.0-22.9 21.7 33.5-44.5 36.9 36.7-44.2 39.2 37.4-40.7 39.3
A diet high in calcium shortens the life span and increases the incidence and severity of the convulsive attacks of magnesium- deficient animals. It also diminishes the time before the onset and increases the intensity of vasodilatation. With a 1.16 per cent calcium content, the 5 mg. of magnesium diet is no longer on the border line of sufficiency. Thus the performance of the experimental animals on the Diet 5-H-Ca is comparable in every respect to that of animals fed a diet containing 1.5 to 2.0 mg. of Mg per 100 gm. of food. The poor growth performance obtained on this diet is shown in Fig. 1 (Curve 1).
The minimal magnesium requirement for normal growth on diets with a calcium content of 1.66 per cent is approached only
by guest on October 11, 2017
http://ww
w.jbc.org/
Dow
nloaded from
720 Magnesium Deficiency. II
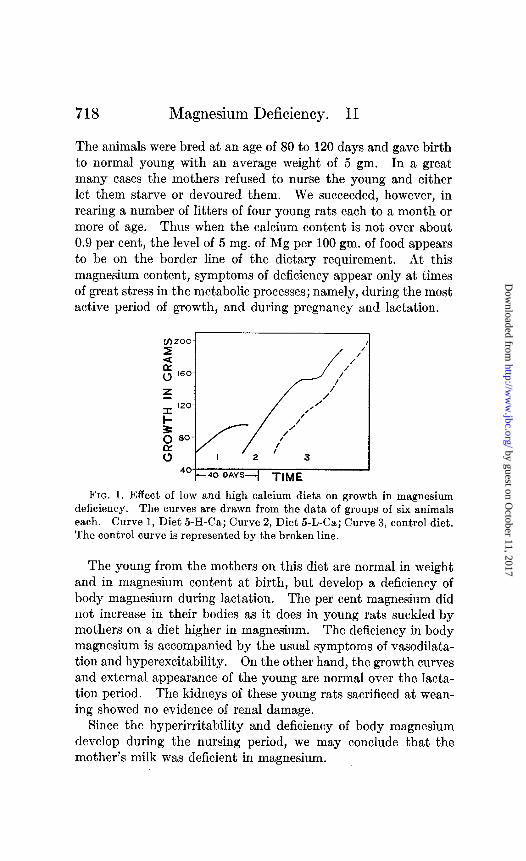
when the magnesium level is raised to 13 mg. per 100 gm. of food. On Diet 13-H-Ca, the growth of the male rats kept close pace with the growth of the controls. The growth curve of the females, however, while fairly good, was still significantly below that of the control animals. The average growth curve of the females on this diet is plotted in Fig. 2.
While the rats on the 13 mg. of magnesium diet remained sleek and in a well kept condition as far as their coats were concerned, other symptoms of magnesium deficiency showed up in some of the animals. Out of six females, convulsive seizures could be in- duced in two, and three of them developed an edema toward the end of the experimental period.
Aside from any visible signs of hyperirritability and malnutri- tion, an examination of the chemical composition of the blood,
FIG. 2. Growth curves of female rats on Diet 13-H-& Control (broken line) data from five rats; deficient (full line) data from six rats.
tissues, and whole body makes it evident that some degree of magnesium deficiency develops in the animal with every one of the high calcium diets listed in Table I, and even with the border line diet of 5 mg. of magnesium, containing 0.87 per cent calcium. The analytical data which support this conclusion are summarized in Tables III and IV. The magnesium content of both the blood plasma and the red corpuscles is greatly reduced on these diets. It may be seen from Table III that the plasma magnesium is lowered to about a third or less of the control level, and the red corpuscle magnesium to about half the control level.
Examination of the whole body contents, the results of which are reported in Table IV, shows that a considerable reduction has taken place in the magnesium and an increase in the per cent of calcium in the carcass. Except on Diet 13-H-Ca, the extent of the calcium increase is less than was found in rats reared on diets
by guest on October 11, 2017
http://ww
w.jbc.org/
Dow
nloaded from

E. V. Tufts and D. M. Greenberg 721
more deficient in magnesium. The loss of body magnesium, how- ever, is very marked, particularly on Diet 5-H-Ca. The lowest values of body magnesium found in the condition of magnesium
TABLE III
Blood Magnesium (in Mg. Per Cent)
Plrtsma Mg Red corpuscle Mg
Diet No. Days Deficient animals
5-M-h 77 1.48 5-M-Ca 133 1.38 5-M-Ca 153 1.42 5-M-Ca 156 1.69 5-H-Ca 27 0.90 5-H-Ca 37 2.13 5-H-Ca 81 1.10
13-H-Ca 127 1.65 13-H-Ca 139 1.15 13-H-Ca 210 1.20
6.25 6.60
6.20 7.40
3.75 3.10 3.30 3.65
3.75 3.80
2.10 3.05
3.30 2.65 5.35 3.75
4.65 2.50 5.35
TABLE IV
Magnesium and Calcium Content of Whole Rats
mLl.
50 50
5.0 5.0 5.0 5.0 5.0 5.0
13.0 13.0 13.0
xr cent
0.91 1.79 1.12 1.12 1.13 1.24 1.09 1.22 2.00 2.36 2.30
-
I
1
?Yy No. of minds
Body Mg I
I
days
140-18C 260
91 133 155 200
23 81
121 139 260
“%Y
34.7 36.6 25.3 26.7 23.7 19.7 21.7 17.6 24.3 22.2 21.7
Diet No.
Control ‘I
5-M-Ca 5-M-Ca 5-L-Ca 5-L-Ca 5-H-Ca 5-H-Ca
13-H-Ca 13-H-Ca 13-H-Ca
Range - ,er cent
0.87 1.66 0.87 0.87 0.39 0.39 1.16 1.16 1.66 1.66 1.66
mg. per cent
33.2-36.2 33.4-39.9 21.3-28.9 21.9-34.3 18.0-25.4
15.5-23.6 13.0-20.6
21.8-22.5
2 2 4 4 3 1 3 4 1 2 2
deficiency developed on this diet. After 81 days on the diet, the average body magnesium content was 17.6 mg. per cent, with a low of 13.9 per cent.
by guest on October 11, 2017
http://ww
w.jbc.org/
Dow
nloaded from

722 Magnesium Deficiency. II
The magnesium content of such important viscera as heart, kidney, and muscle is not materially affected by these diets. However, no large reduction in tissue magnesium has been found even with the severest degree of magnesium deficiency (3). As was found in the case of the diets lower in magnesium, there is an increase in the calcium content of muscle, heart, and kidney even on the diets that border on the point of meeting the minimal mag- nesium requirement of the animals. The increase in the calcium content of the heart and muscle, on the average, is somewhere between 50 and 100 per cent. The increment of calcium in the kidney is very much higher. This, of course, is associated with the development of renal lesions such as have been described in another communication (5). After the animals had been between 210 and 260 days on Diet 13-H-Ca, the calcium in the kidney reached the enormous average value of 235 mg. per cent of fresh kidney, with a high of 340 mg. per cent. It is interesting to note that, while the kidneys of the control animals on this diet also manifested signs of kidney degeneration, although of a much milder degree, they showed no evidence of an increasing calcium content.
The reproductive performance on the high calcium diets was extremely poor. This was true of both the control and deficient animals. On Diet 5-H-Ca, few of the animals survived long enough, and those that did were in too poor a condition to breed. In the group on Diet 13-H-Ca, positive evidence of pregnancy, such as the erythrocyte sign, was elicited in almost 100 per cent of the control and deficient females. However, in all cases the litters were either resorbed, or, if born, were eaten by the mothers immediately after birth.
Effect of Vitamin G Complex-Investigation of the vitamin G complex as a possible factor in the picture of magnesium defi- ciency was undertaken because it was observed that both the control and deficient animals showed signs of malnutrition when the water-soluble vitamin supplement was given in the form of an alcoholic extract of yeast, prepared according to the directions of Kruse, Orent, and McCollum (6) from yeast powder purchased from the Northwestern Yeast Company.
It has been pointed out elsewhere (4) that a high intake of vita- min G apparently lengthens the time elapsing before symptoms of hyperexcitability appear, and lessens the severity of the symp-
by guest on October 11, 2017
http://ww
w.jbc.org/
Dow
nloaded from
E. V. Tufts and D. M. Greenberg 723
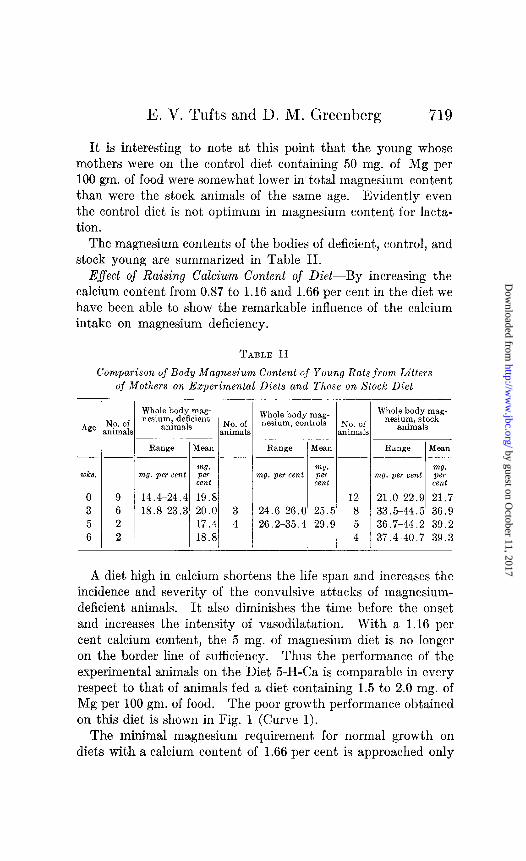
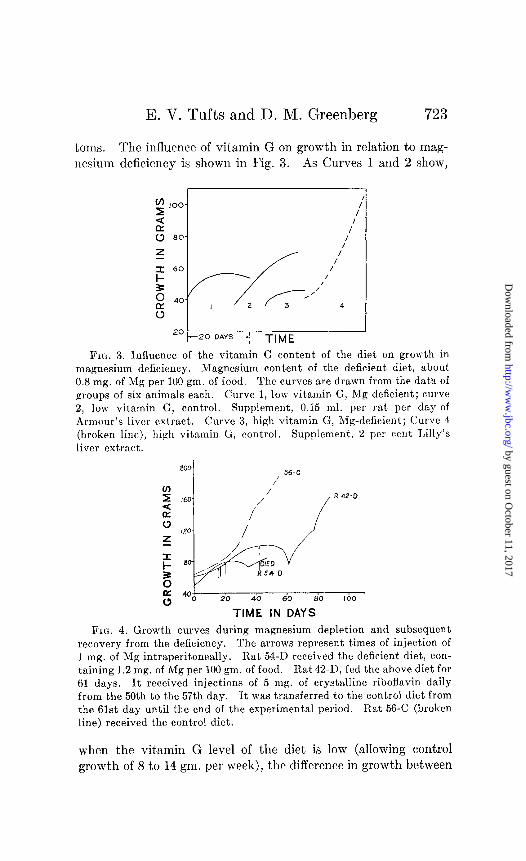
toms. The influence of vitamin G on growth in relation to mag- ncsium deficiency is shown in Fig. 3. As Curves 1 and 2 show,
m zi
IOO- / I
d /I (3 80. I z - I 60.
zo- kz” DAYS+ TIME
FIG. 3. Influence of the vitamin G content of the diet on growth in magnesium deficiency. Magnesium content of the deficient diet, about 0.8 mg. of Mg per 100 gm. of food. The curves are drawn from the data of groups of six animals each. Curve 1, low vitamin G, Mg-deficient; curve 2, low vitamin G, control. Supplement, 0.15 ml. per rat per day of Armour’s liver extract. Curve 3, high vitamin G, Mg-deficient; Curve 4 . (broken line), high vitamin G, control. Supplement., 2 per rent I,illy’s liver extract.
56-C
20 40 do 80 100
TIME IN DAYS FIG. 4. Growth curves during magnesium depletion and subsequent
recovery from the deficiency. The arrows represent times of injection of 1 mg. of Mg intraperitoneally. Rat 54-D received the deficient diet, con- taining 1.2 mg. of Mg per 100 gm. of food. Rat 42-D, fed the above diet for 61 days. It received injections of 5 mg. of crystalline riboflavin daily from the 50th to the 57th day. It was transferred to the control diet from the 6lst day until the end of the experimental period. Rat 56-C (broken line) received the control diet.
when the vitamin G level of the diet is low (allowing control growth of 8 to 14 gm. per week), the diffcrcncc in growth between
by guest on October 11, 2017
http://ww
w.jbc.org/
Dow
nloaded from

724 Magnesium Deficiency. II
control and deficient animals is obscured. When the vitamin G content is ample, the differences become marked (Curves 3 and 4).
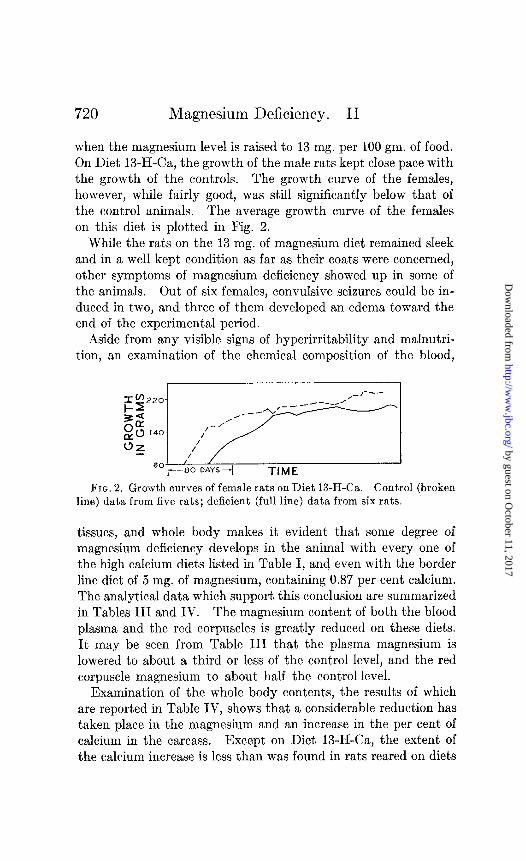
With a diet containing 1.5 mg. of Mg per 100 gm. of food or less, the symptoms of malnutrition cannot be prevented by high intake of extracts of the vitamin G and B complex, nor can they be al- leviated by the injection of extra amounts of flavin. This is aptly shown by the case of Rat 42-D whose experimental course is illustrated in Figs. 4 and 5. As is shown in Fig. 4, administration of large amounts of vitamin G did not change its downward course
FIG. 5. A, photograph of a rat (No. 42-D) after 54 days on a magnesium- deficient diet (1.2 mg. of Mg per 100 gm. of food). B, the same rat at 91 days, after being transferred to the control diet on the 61st day.
in the least. Addition of magnesium to the diet of this animal affected an increase in growth and disappearance of all external signs of malnutrition. Thus the vitamin G complex seems to have no direct relationship to the state of malnutrition developed as a consequence of magnesium deprivation.
DISCUSSION
The present work indicates that under otherwise optimum con- ditions, a magnesium intake in the diet of approximately 4 mg.
by guest on October 11, 2017
http://ww
w.jbc.org/
Dow
nloaded from
E. V. Tufts and D. M. Greenberg 725
per kilo of body weight per day approaches the minimal mag- nesium requirement of the rat.
In man Wang, Kaucher, and Wing (7) found that there was almost no net retention of magnesium in adolescent girls on a magnesium intake varying between 6.0 and 10.2 mg. per kilo of body weight. The results of these experiments have been sum- marized by the authors as follows: On twenty-two girls of an aver- age age of 13 years, on an average intake of 8 mg. of Mg per kilo of body weight, the average total retention per 24 hours was 17 mg. of magnesium, or 0.4 mg. per kilo of body weight.
A magnesium balance was obtained by Tibbetts and Aub (8) with hospital patients on an intake of about 4 mg. per kilo of body weight per day, and magnesium storage in active subjects when the intake was about 6 mg. per kilo of body weight per day.
The relation of the calcium content of the body to the dietary calcium level is of interest in connection with the present work. Sherman and coworkers (9) have shown that there is an increase in the percentage of body calcium with increasing amounts of calcium in the diet. Whitcher, Booher, and Sherman (10) found that when the allowance of dietary calcium reaches a liberal level, there is a considerable range over which a calcium increase has no appreciable effect on the amount of calcium which is accumulated. This range is between 0.5 and 0.8 per cent calcium.
The percentage of calcium in the carcasses of our control ani- mals compares well with that found by the above authors at the same levels of dietary calcium. In our diet containing 1.66 per cent calcium, which is far above the amount used by Sherman and coworkers, the body calcium is increased to exceedingly high values. In the controls it attained the high value of 1.79 per cent. In the animals on Diet 13-H-Ca it reached the enormous figure of 2.30 per cent after 210 to 260 days on the diet. It is of interest to note that the animals on low magnesium diets show an accumulation of calcium in heart, muscle, and, particularly, of course, in the kidneys, while the control animals on the 1.66 per cent calcium diet show no accumulation in these viscera.
SUMMARY
1. With diets of liberal normal calcium content, and an op- timum content of the vitamin G and B complex, the magnesium
by guest on October 11, 2017
http://ww
w.jbc.org/
Dow
nloaded from

726 Magnesium Deficiency. II
level of 5 mg. per 100 gm. of food was found to be the border line amount necessary for good growth.
2. Females on this diet gave birth to young of normal weight and normal magnesium content. These young rats while suck- ling, however, developed all the symptoms of deficiency at the age of 2 or 3 weeks. Furthermore, the per cent magnesium did not increase in their bodies as it does in young rats suckled by mothers on a normal diet. Since the syndrome developed during the nursing period, we may conclude that the mother’s milk was deficient in magnesium.
3. A high content of calcium in the diet increases the severity of magnesium deficiency and raises the amount necessary to meet the minimal magnesium requirements.
4. The minimal magnesium requirement is raised to some extent by diminishing the vitamin G intake to less than 6 Chase- Sherman units per day. However, the vitamin G complex bears no direct relation to the state of malnutrition which develops as a consequence of magnesium deficiency.
BIBLIOGRAPHY
1. Osborne, T. B., and Mendel, L. B., .I. Biol. &em., 34, 131 (1918). 2. Medes, G., J. Biol. Chem., 68, 295 (1926). 3. Tufts, E. V., and Greenberg, D. M., J. Biol. Chem., 122,693 (1937-38). 4. Greenberg, D. M., and Tufts, E. V., Am. J. Physiol., in press. 5. Greenberg, D. M., Lucia, IS. P., and Tufts, E. V., Am. J. Physiol., in
press. 6. Kruse, H. D., Orent, E. R., and McCollum, E. V., J. Biol. Chem., 96,
519 (1932). 7. Wang, C. C., Kaucher, M., and Wing, M., Am. J. Dis. Child., 62, 41
(1936). 8. Tibbetts, D. M., and Aub, J. C., J. CZin. Inv., 16,491 (1937). 9. Sherman, H. C., and MacLeod, F. L., J. BioZ. Chem., 64, 429 (1925).
Sherman, H. C., and Booher, L. E., J. Biol. Chem., 93, 93 (1931). 10. Whitcher, L. B., Booher, L. E., and Sherman, H. C., I. BioZ. Chem., 116,
679 (1936).
by guest on October 11, 2017
http://ww
w.jbc.org/
Dow
nloaded from
Elma V. Tufts and David M. GreenbergTHEREON
THE DIETARY CALCIUM LEVEL LACTATION, AND THE EFFECT OF
GROWTH, GESTATION, AND MAGNESIUM REQUIREMENT FOR
DEFICIENCY: II. THE MINIMUM THE BIOCHEMISTRY OF MAGNESIUM
1938, 122:715-726.J. Biol. Chem.
http://www.jbc.org/content/122/3/715.citation
Access the most updated version of this article at
Alerts:
When a correction for this article is posted•
When this article is cited•
alerts to choose from all of JBC's e-mailClick here
tml#ref-list-1
http://www.jbc.org/content/122/3/715.citation.full.haccessed free atThis article cites 0 references, 0 of which can be
by guest on October 11, 2017
http://ww
w.jbc.org/
Dow
nloaded from


![Magnesium Deficiency Triggers SGR–Mediated Chlorophyll ... · Chlorophyll Degradation for Magnesium Remobilization1[OPEN] Yu Yang Peng,a,2 Li Li Liao,a,2 Sheng Liu,a Miao Miao Nie,a](https://img.pdfslide.us/doc/110x75/5f19c43e34b6f840253d46fd/magnesium-deficiency-triggers-sgramediated-chlorophyll-chlorophyll-degradation.jpg)