Embed Size (px)
Citation preview
Biochemistry 1994, 33, 4953-4965 4953
The Binding Sites of Quinones in Photosynthetic Bacterial Reaction Centers Investigated by Light-Induced FTIR Difference Spectroscopy: Assignment of the QA Vibrations in Rhodobacter sphaeroides Using l 8 0 - or 13C-Labeled Ubiquinone
and Vitamin KI Jacques Breton,. Jean-Ren6 Burie, Catherine Berthomieu, G6rard Berger, and Eliane Nabedryk
SBEIDBCM, CEN Saclay, 91 191 Gif-sur- Yvette Cedex, France
Received July 15, 1993; Revised Manuscript Received February 14, 1994"
ABSTRACT: Light-induced FTIR difference spectra of the photoreduction of the primary quinone acceptor QA have been obtained for Rhodobacter sphaeroides RCs reconstituted with a series of isotopically labeled quinones in order to separate the contributions of the quinone from those of the protein. The isotopic shifts observed in the QA-/QA spectra of RCs reconstituted with ubiquinones (Q1, Q.5) or vitamin K1 180-labeled on their carbonyl oxygens and with fully 13C-labeled QS lead to a clear identification of the quinone bands from both the neutral and anion forms. Double-difference spectra from pairs of QA-/QA spectra obtained from 1SO/160 Q.5, 180/160 Q1, 13C/12C Qs, 13C180/12C160 Qs, and 1SO/160 vitamin K1 allow the C-0 modes of QA in uivo to be identified unambiguously for the first time. For all the investigated unlabeled quinones, two carbonyl bands are demasked, a t 1660 and 1628 cm-l for neutral ubiquinones and a t 1651 and 1640 cm-l for vitamin K1, while C=C bands are found at 1608 and 1588 cm-l for vitamin K1 and a t 1601 cm-l for ubiquinones. Compared with the spectra of the isolated quinones, the generally smaller width observed for the C=O and C=C bands in viuo suggests precise interactions between the quinone and the contours of the protein a t a single, well-defined QA site. The different frequency downshifts of the two C=O bands upon binding to the QA site underscore the inequivalence of the two carbonyls in providing asymmetrical bonding interactions with the protein. The comparison of the isotopic shifts observed for the various quinone C=O and C=C bands in uitro and in uiuo demonstrates that the admixture of C=O and C=C characters in these modes is strongly affected by the binding of QA to its anchoring site. In particular, the bands at 1628 and 1601 cm-l of Q.5 in uiuo exhibit highly mixed C=O and C=C characters. In contrast, the methoxy groups of the ubiquinones do not appear to suffer large strain upon binding. The closeness of the QA-/QA spectra for Q1 and 4.5 indicates that a possible role of the chain in providing the proper positioning of the quinone ring in the site for both the oxidized and reduced states of QA cannot extend significantly beyond the first isoprene unit. The comparison of the frequency of the anion bands of vitamin K1 in uitro and in vivo indicates strong bonding of the carbonyls of QA- to the protein. The absence of a splitting of the CSSO mode in uiuo is indicative of symmetrical bonding of the two carbonyls after photoreduction. The near identity of the protein signals in the QA-/QA spectra for vitamin K1 and for 4.5 in the QA site of Rb. sphaeroides shows that the protein-quinone interactions arevery similar for these two quinones. Furthermore, comparison of the QA-/QA spectra of Rb. sphaeroides RCs reconstituted with vitamin K1 and of Rhodopseudomonas viridis containing the native menaquinone-9 demonstrates that the protein contours a t the QA site of the two species offer similar interactions to these two closely related naphthoquinones. Accompanying the photoreduction of QA, specific microconformational changes of amino acid side chains and/or of the polypeptide backbone are detected. These localized structural changes probably occur in the close vicinity of QA, although electrostatic effects a t more distant sites should also be considered.
Thecrystal structureof the photosynthetic bacterial reaction center (RC') suggests that the localization and conformation of the cofactors involved in electron transport are optimized by the protein environment to provide efficient and quasi- irreversible charge separation. For example, the differences in the nature and packing of the amino acid residues lining the binding pockets of the primary (QA) and secondary (QB) quinones, which are both ubiquinone-10 (Qlo; Figure la) in
Abstract published in Advance ACS Abstracts. April 1 , 1994. Abbreviations: RC, reaction center; P, primary electron donor; QI\
and QB, primary and secondary quinone acceptor; Rb., Rhodobacter; Rp., Rhodopseudomonas; FTIR, Fourier transform infrared; Qn, 2,3- dimethoxy-S-methyl-6-(prenyl),- 1 ,4-benzoquinone; vitamin K1,2-methyl- 3-phytyl-l,4-naphthoquinone; MK9: 2-methyl-3-nonaprenyl- 1,4-naph- thoquinone; TMPD, N,N,N',N'-tetramethyl-p-phenylenediamine; DAD, 2,3,5,6-tetramethyl-p-phenylenediamine.
0006-2960/94/0433-4953$04.50/0
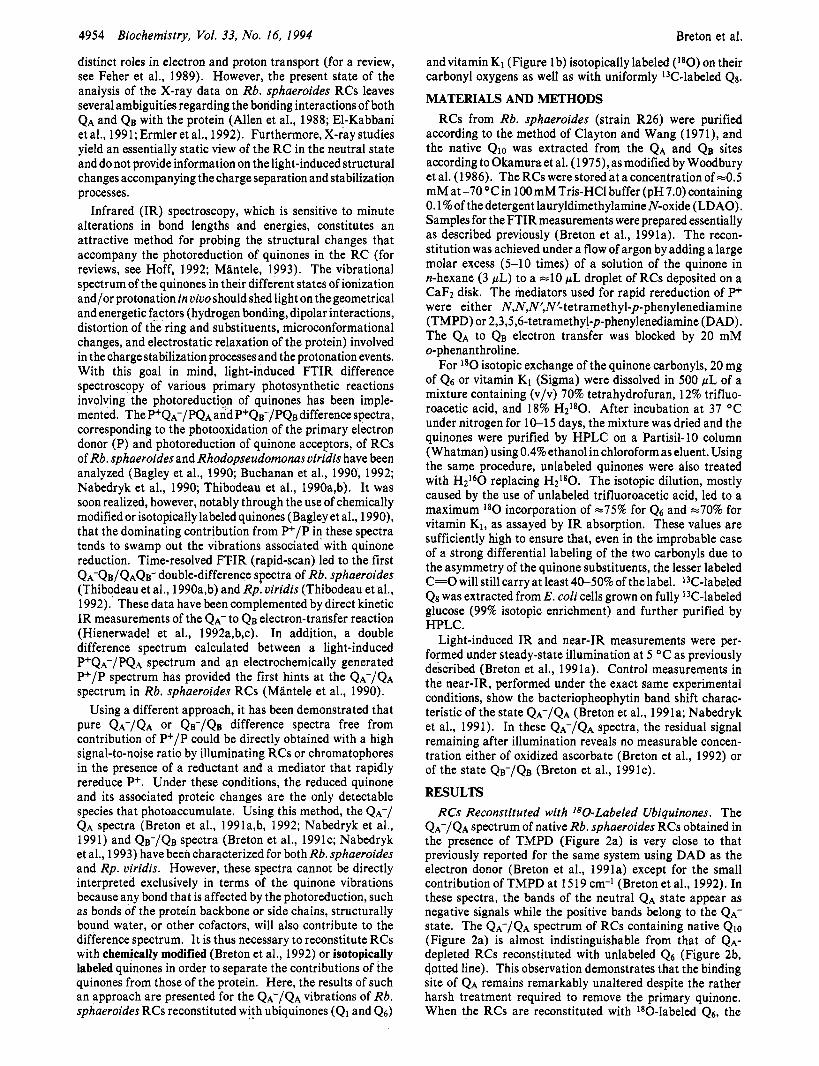
M e o b c H z - c H = 7- c H 2 k H &$2 - CH= ?-CH& H Me0 Me CH3 CH3
0, Om a ) C)
&li2 -CH = F: - CHz{ CH2- CH2 - YH -CH,$ H
CH3 CH3 Om
b )
FIGURE 1: (a) Ubiquinone Qn (Qn): 2,3-dimethoxy-S-methy1-6- (isoprenyl),-l,4-benzoquinone. (b) Vitamin K,: 2-methyl-3-phytyl- 1,4-naphthoquinone. (c) Menaquinone K9 (MK9): 2-methyl-3- nonaisoprenyl- 1,4-naphthoquinone. Rhodobacter sphaeroides, might explain the differences in the redox properties of the two quinones as well as their very
0 1994 American Chemical Society
4954 Biochemistry, Vol. 33, No. 16, 1994
distinct roles in electron and proton transport (for a review, see Feher et al., 1989). However, the present state of the analysis of the X-ray data on Rb. sphaeroides RCs leaves several ambiguities regarding the bonding interactions of both QA and QB with the protein (Allen et al., 1988; El-Kabbani et al., 1991; Ermler et al., 1992). Furthermore, X-ray studies yield an essentially static view of the RC in the neutral state and do not provide information on the light-induced structural changes accompanying the charge separation and stabilization processes.
Infrared (IR) spectroscopy, which is sensitive to minute alterations in bond lengths and energies, constitutes an attractive method for probing the structural changes that accompany the photoreduction of quinones in the RC (for reviews, see Hoff, 1992; MBntele, 1993). The vibrational spectrum of the quinones in their different states of ionization and/or protonation in vivo should shed light on the geometrical and energetic factors (hydrogen bonding, dipolar interactions, distortion of the ring and substituents, microconformational changes, and electrostatic relaxation of the protein) involved in the charge stabilization processes and the protonation events. With this goal in mind, light-induced FTIR difference spectroscopy of various primary photosynthetic reactions involving the photoreduction of quinones has been imple- mented. The P+QA-/PQA and P+QB-/p9B difference spectra, corresponding to the photooxidation of the primary electron donor (P) and photoreduction of quinone acceptors, of RCs of Rb. sphaeroides and Rhodopseudomonas viridis have been analyzed (Bagley et al., 1990; Buchanan et al., 1990, 1992; Nabedryk et al., 1990; Thibodeau et al., 1990a,b). It was soon realized, however, notably through the use of chemically modified or isotopically labeled quinones (Bagley et al., 1990), that the dominating contribution from P+/P in these spectra tends to swamp out the vibrations associated with quinone reduction. Time-resolved FTIR (rapid-scan) led to the first QA-QB/QAQB- double-difference spectra of Rb. sphaeroides (Thibodeau et al., 1990a,b) and Rp. viridis (Thibodeau et al., 1992). These data have been complemented by direct kinetic IR measurements of the QA- to QB electron-transfer reaction (Hienerwadel et al., 1992a,b,c). In addition, a double difference spectrum calculated between a light-induced P+QA-/PQA spectrum and an electrochemically generated P+/P spectrum has provided the first hints at the QA-/QA spectrum in Rb. sphaeroides RCs (MBntele et al., 1990).
Using a different approach, it has been demonstrated that pure QA-/QA or QB-/QB difference spectra free from contribution of P+/P could be directly obtained with a high signal-to-noise ratio by illuminating RCs or chromatophores in the presence of a reductant and a mediator that rapidly rereduce P+. Under these conditions, the reduced quinone and its associated proteic changes are the only detectable species that photoaccumulate. Using this method, the QA-1 QA spectra (Breton et al., 1991a,b, 1992; Nabedryk et al., 1991) and QB-/QB spectra (Breton et al., 1991c; Nabedryk et al., 1993) have been characterized for both Rb. sphaeroides and Rp. viridis. However, these spectra cannot be directly interpreted exclusively in terms of the quinone vibrations because any bond that is affected by the photoreduction, such as bonds of the protein backbone or side chains, structurally bound water, or other cofactors, will also contribute to the difference spectrum. It is thus necessary to reconstitute RCs with chemically modified (Breton et al., 1992) or isotopically labeled quinones in order to separate the contributions of the quinones from those of the protein. Here, the results of such an approach are presented for the QA-/QA vibrations of Rb. sphaeroides RCs reconstituted with ubiquinones (Q1 and 46)
Breton et al.
andvitamin K1 (Figure 1 b) isotopically labeled (l8O) on their carbonyl oxygens as well as with uniformly 13C-labeled Qg.
MATERIALS AND METHODS RCs from Rb. sphaeroides (strain R26) were purified
according to the method of Clayton and Wang (1971), and the native Qlo was extracted from the QA and Qe sites according to Okamura et al. (1 975), as modified by Woodbury et al. (1986). The RCs were stored at a concentration of -0.5 mM at -70 OC in 100 mM Tris-HC1 buffer (pH 7.0) containing 0.1 %of the detergent lauryldimethylamine N-oxide (LDAO). Samples for the FTIR measurements were prepared essentially as described previously (Breton et al., 1991a). The recon- stitution was achieved under a flow of argon by adding a large molar excess (5-10 times) of a solution of the quinone in n-hexane (3 pL) to a e l 0 pL droplet of RCs deposited on a CaF2 disk. The mediators used for rapid rereduction of P+ were either N,N,N',N'-tetramethyl-p-phenylenediamine (TMPD) or 2,3,5,6-tetramethyl-p-phenylenediamine (DAD), The QA to QB electron transfer was blocked by 20 mM o-phenanthroline.
For l80 isotopic exchange of the quinone carbonyls, 20 mg of Q6 or vitamin KI (Sigma) were dissolved in 500 pL of a mixture containing (v/v) 70% tetrahydrofuran, 12% trifluo- roacetic acid, and 18% H2180. After incubation at 37 OC under nitrogen for 10-1 5 days, the mixture was dried and the quinones were purified by HPLC on a Partisil-10 column (Whatman) using 0.4% ethanol in chloroform as eluent. Using the same procedure, unlabeled quinones were also treated with H P 0 replacing H2lg0. The isotopic dilution, mostly caused by the use of unlabeled trifluoroacetic acid, led to a maximum l 8 0 incorporation of =75% for Q6 and ~ 7 0 % for vitamin K1, as assayed by IR absorption. These values are sufficiently high to ensure that, even in the improbable case of a strong differential labeling of the two carbonyls due to the asymmetry of the quinone substituents, the lesser labeled C=O will still carry at least 40-50% of the label. I3C-labeled QS was extracted from E . coli cells grown on fully 13C-labeled glucose (99% isotopic enrichment) and further purified by HPLC.
Light-induced IR and near-IR measurements were per- formed under steady-state illumination at 5 "C as previously described (Breton et al., 1991a). Control measurements in the near-IR, performed under the exact same experimental conditions, show the bacteriopheophytin band shift charac- teristic of the state QA-/QA (Breton et al., 1991a; Nabedryk et al., 1991). In these QA-/QA spectra, the residual signal remaining after illumination reveals no measurable concen- tration either of oxidized ascorbate (Breton et al., 1992) or of the state QB-/QB (Breton et al., 1991~).
RESULTS RCs Reconstituted with '80-Labeled Ubiquinones. The
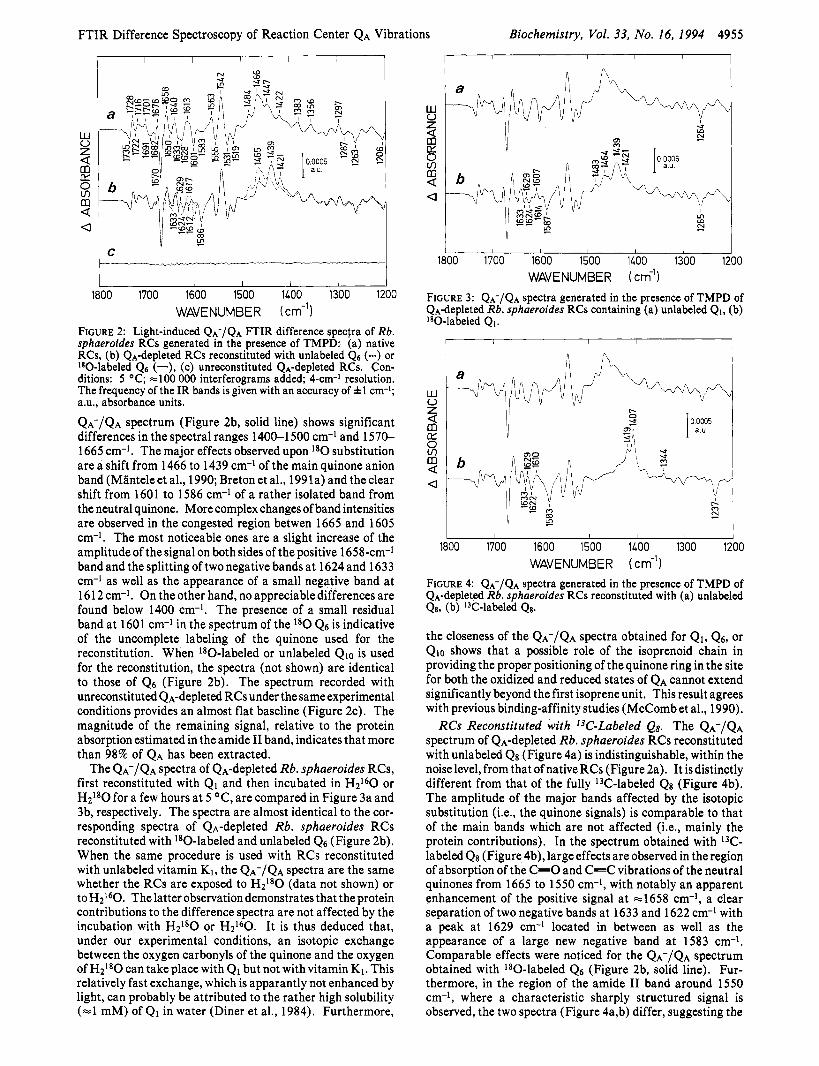
QA-/QA spectrum of native Rb. sphaeroides RCs obtained in the presence of TMPD (Figure 2a) is very close to that previously reported for the same system using DAD as the electron donor (Breton et al., 1991a) except for the small contribution of TMPD at 1519 cm-l (Breton et al., 1992). In these spectra, the bands of the neutral QA state appear as negative signals while the positive bands belong to the QA- state. The spectrum of RCs containing native Qlo (Figure 2a) is almost indistinguishable from that of QA- depleted RCs reconstituted with unlabeled Q6 (Figure 2b, clotted line). This observation demonstrates that the binding site of QA remains remarkably unaltered despite the rather harsh treatment required to remove the primary quinone, When the RCs are reconstituted with lg0-labeled Q6, the
FTIR Difference Spectroscopy of Reaction Center QA Vibrations Biochemistry, Vol. 33, No. 16, 1994 4955
I 1 I I 1
C I
1800 1700 1600 1500 1400 1300 1200 WAVENUMBER (cm-'1
FIGURE 2: Light-induced QA-/QA FTIR difference spectra of Rb. sphaeroides RCs generated in the presence of TMPD: (a) native RCs, (b) QA-depleted RCs reconstituted with unlabeled QS (-) or 180-labeled Qa (-), (c) unreconstituted QA-depleted RCs. Con- ditions: 5 OC; -100 000 interferograms added; 4-cm-' resolution. The frequency of the IR bands is given with an accuracy of &1 cm-1; a.u., absorbance units. QA-/QA spectrum (Figure 2b, solid line) shows significant differences in the spectral ranges 1400-1 500 cm-l and 1570- 1665 cm-l. The major effects observed upon l80 substitution are a shift from 1466 to 1439 cm-' of the main quinone anion band (Mlnteleet al., 1990; Bretonet al., 1991a) and theclear shift from 1601 to 1586 cm-l of a rather isolated band from the neutral quinone. More complex changes of band intensities are observed in the congested region betwen 1665 and 1605 cm-l. The most noticeable ones are a slight increase of the amplitude of the signal on both sides of the positive 1658-cm-l band and the splitting of two negative bands at 1624 and 1633 cm-l as well as the appearance of a small negative band at 1612 cm-l. On the other hand, no appreciable differences are found below 1400 cm-l. The presence of a small residual band at 1601 cm-1 in the spectrum of the l 8 0 Q6 is indicative of the uncomplete labeling of the quinone used for the reconstitution. When 'go-labeled or unlabeled Qlo is used for the reconstitution, the spectra (not shown) are identical to those of 4 6 (Figure 2b). The spectrum recorded with unreconstituted QA-depleted RCs under the same experimental conditions provides an almost flat baseline (Figure 2c). The magnitude of the remaining signal, relative to the protein absorption estimated in the amide I1 band, indicates that more than 98% of QA has been extracted.
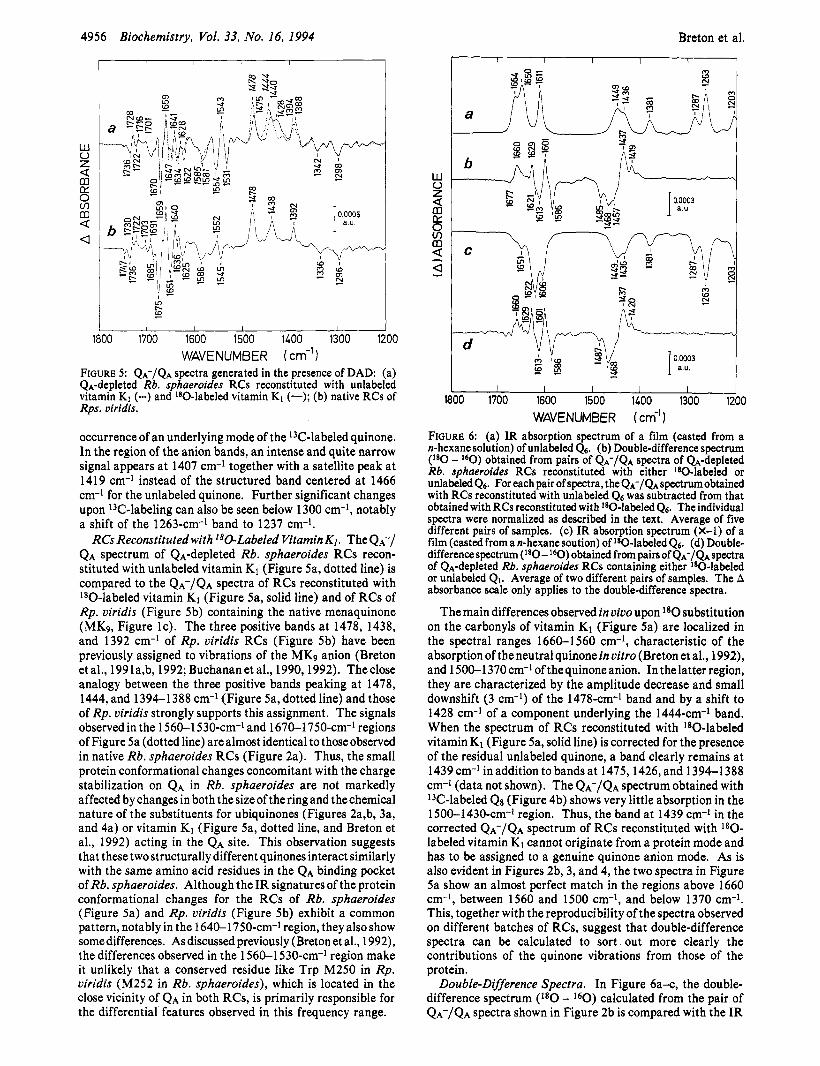
The QA-/QA spectra of &-depleted Rb. sphaeroides RCs, first reconstituted with Q1 and then incubated in H2160 or H2180 for a few hours at 5 OC, are compared in Figure 3a and 3b, respectively. The spectra are almost identical to the cor- responding spectra of QA-depleted Rb. sphaeroides RCs reconstituted with lS0-labeled and unlabeled 4 6 (Figure 2b). When the same procedure is used with RCs reconstituted with unlabeled vitamin K1, the QA-/QA spectra are the same whether the RCs are exposed to H2180 (data not shown) or toH2160. Thelatter observationdemonstrates that the protein contributions to the difference spectra are not affected by the incubation with H2Ig0 or H P 0 . It is thus deduced that, under our experimental conditions, an isotopic exchange between the oxygen carbonyls of the quinone and the oxygen of H2180 can take place with Q1 but not with vitamin K1. This relatively fast exchange, which is apparantly not enhanced by light, can probably be attributed to the rather high solubility (=l mM) of Q1 in water (Diner et al., 1984). Furthermore,
I I I I I
I I I 1 I I I 1800 1700 1600 1500 1400 1300 1200
WAVENUMBER ( cm-'1 FIGURE 3: QA-/QA spectra generated in the presence of TMPD of QA-depleted Rb. sphaeroides RCs containing (a) unlabeled QI, (b) I80-labeled QI.
I I
I I I I I I 1 1800 1700 1600 1500 1400 1300 1200
WAVENUMBER ( cm-'1 FIGURE 4: QA-/QA spectra generated in the presence of TMPD of QA-depleted Rb. sphaeroides RCs reconstituted with (a) unlabeled Q8, (b) ITC-labeled Q8.
the closeness of the QA-/QA spectra obtained for Q1, Q6, or Qlo shows that a possible role of the isoprenoid chain in providing the proper positioning of the quinone ring in the site for both the oxidized and reduced states of QA cannot extend significantly beyond the first isoprene unit. This result agrees with previous binding-affinity studies (McComb et al., 1990).
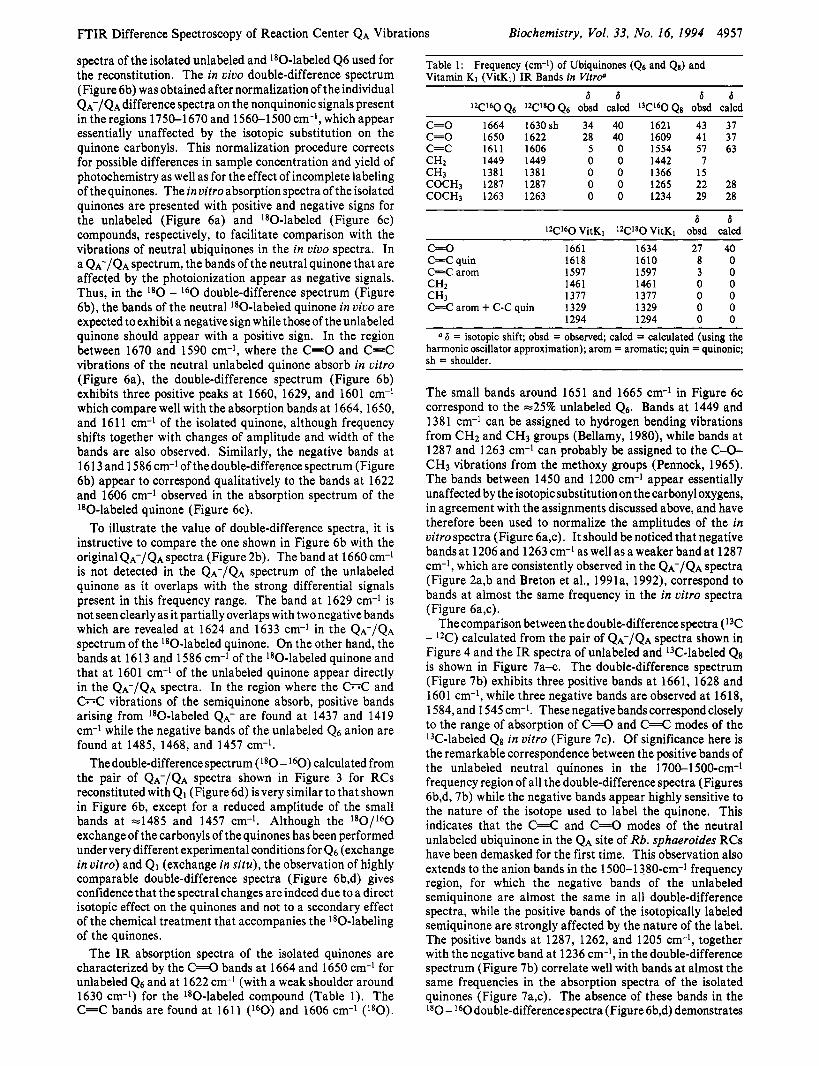
RCs Reconstituted with l3C-Labeled Qs. The QA-/QA spectrum of QA-depleted Rb. sphaeroides RCs reconstituted with unlabeled QS (Figure 4a) is indistinguishable, within the noise level, from that of native RCs (Figure 2a). It is distinctly different from that of the fully 13C-labeled Qg (Figure 4b). The amplitude of the major bands affected by the isotopic substitution (i.e., the quinone signals) is comparable to that of the main bands which are not affected (i.e., mainly the protein contributions). In the spectrum obtained with 13C- labeled Qg (Figure 4b), large effects are observed in the region of absorption of the C=O and C=C vibrations of the neutral quinones from 1665 to 1550 cm-l, with notably an apparent enhancement of the positive signal at -1658 cm-I, a clear separation of two negative bands at 1633 and 1622 cm-l with a peak at 1629 cm-l located in between as well as the appearance of a large new negative band at 1583 cm-l. Comparable effects were noticed for the QA-/QA spectrum obtained with lgO-labeled Q6 (Figure 2b, solid line). Fur- thermore, in the region of the amide I1 band around 1550 cm-1, where a characteristic sharply structured signal is observed, the two spectra (Figure 4a,b) differ, suggesting the
4956 Biochemistry, Vol. 33, No. 16, 1994 Breton et al.
I I I I I I
m
1800 1700 1600 1500 1400 1300 1200
FIGURE 5: QA-/QA spectra generated in the presence of DAD: (a) QA-depleted Rb. sphaeroides RCs reconstituted with unlabeled vitamin K1 (-) and l80-labeled vitamin K1 (-); (b) native RCs of Rps. viridis.
WAVENUMBER (cm-')
occurrence of an underlying mode of the 13C-labeled quinone. In the region of the anion bands, an intense and quite narrow signal appears at 1407 cm-l together with a satellite peak at 1419 cm-1 instead of the structured band centered at 1466 cm-' for the unlabeled quinone. Further significant changes upon Wlabel ing can also be seen below 1300 cm-I, notably a shift of the 1263-cm-l band to 1237 cm-l.
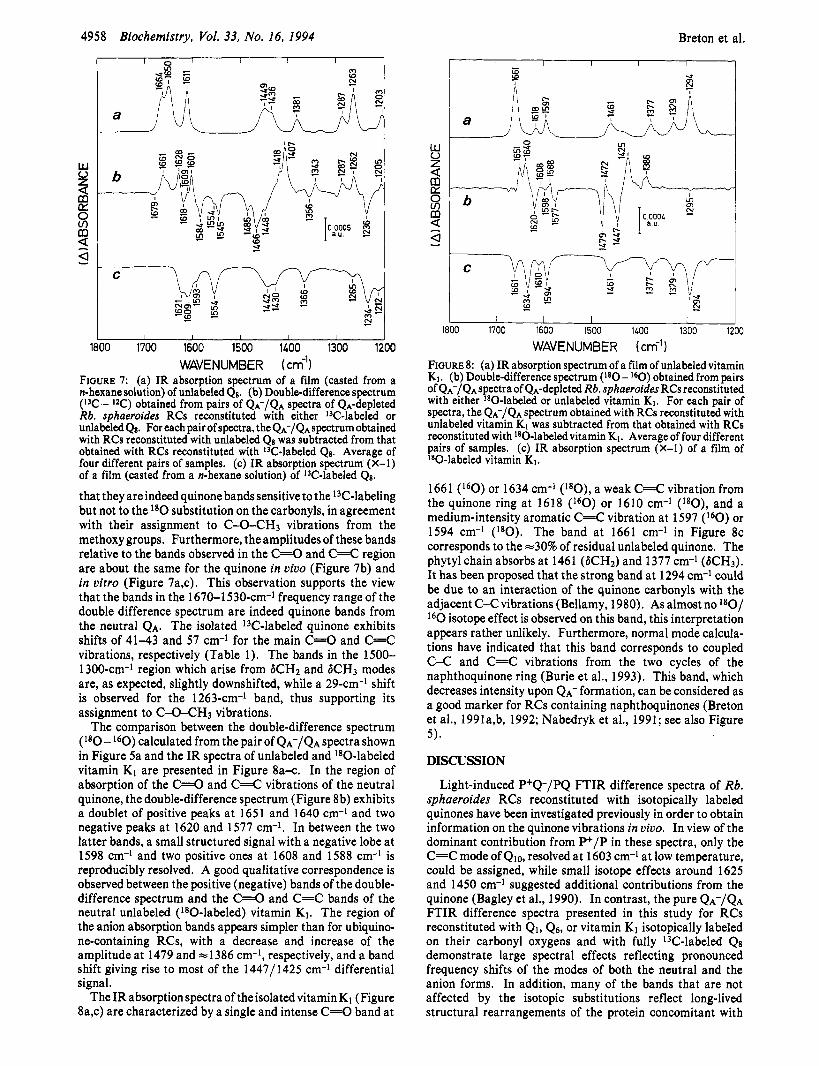
RCs Reconstituted with 180-Labeled Vitamin K1. The QA-/ QA spectrum of QA-depleted Rb. sphaeroides RCs recon- stituted with unlabeled vitamin K1 (Figure 5a, dotted line) is compared to the Q A - / Q A spectra of RCs reconstituted with '80-labeled vitamin K1 (Figure 5a, solid line) and of RCs of Rp. viridis (Figure 5b) containing the native menaquinone (MK9, Figure IC). The three positive bands a t 1478, 1438, and 1392 cm-l of Rp. viridis RCs (Figure 5b) have been previously assigned to vibrations of the MKg anion (Breton et al., 1991a,b, 1992; Buchananet al., 1990,1992). Theclose analogy between the three positive bands peaking at 1478, 1444, and 1394-1388 cm-l (Figure 5a,dotted line) and those of Rp. viridis strongly supports this assignment. The signals observedin the 1560-1530-cm-l and 1670-1750-cm-l regions of Figure 5a (dotted line) are almost identical to those observed in native Rb. sphaeroides RCs (Figure 2a). Thus, the small protein conformational changes concomitant with the charge stabilization on QA in Rb. sphaeroides are not markedly affected by changes in both thesizeofthering and thechemical nature of the substituents for ubiquinones (Figures 2a,b, 3a, and 4a) or vitamin K1 (Figure 5a, dotted line, and Breton et al., 1992) acting in the QA site. This observation suggests that these two structurally different quinones interact similarly with the same amino acid residues in the QA binding pocket of Rb. sphaeroides. Although the IR signatures of the protein conformational changes for the RCs of Rb. sphaeroides (Figure sa) and Rp. viridis (Figure 5b) exhibit a common pattern, notably in the 1640-1750-cm-' region, they also show somedifferences. As discussed previously (Breton et al., 1992), the differences observed in the 1560-1 530-cm-1 region make it unlikely that a conserved residue like Trp M250 in Rp. viridis (M252 in Rb. sphaeroides), which is located in the close vicinity of QA in both RCs, is primarily responsible for the differential features observed in this frequency range.
I I I I I I I
1 I I I I I 1800 1700 1600 1500 1400 1300 1200
WAVENUMBER ( cm-'1 FIGURE 6: (a) IR absorption spectrum of a film (casted from a n-hexane solution) of unlabeled Q6. (b) Double-difference spectrum (180 - I 6 0 ) obtained from pairs of QI;/QA spectra of (&depleted Rb. sphaeroides RCs reconstituted with either '80-labeled or unlabeled Q6. For each pair of spectra, the QA--/QA spectrum obtained with RCs reconstituted with unlabeled Q 6 was subtracted from that obtained with RCs reconstituted with 160-labeled Q6. The individual spectra were normalized as described in the text. Average of five different pairs of samples. (c) IR absorption spectrum (X-1) of a film (casted from a n-hexane soution) of 180-labeled 4 6 . (d) Double- difference spectrum ( l 8 0 - l 6 0 ) obtained from pairs of QA-/QA spectra of (&-depleted Rb. sphaeroides RCs containing either 180-labeled or unlabeled Q1. Average of two different pairs of samples. The A absorbance scale only applies to the double-difference spectra.
The main differences observed in vivo upon l 8 0 substitution on the carbonyls of vitamin K1 (Figure 5a) are localized in the spectral ranges 1660-1560 cm-l, characteristic of the absorption of the neutral quinone in vitro (Breton et al., 1992), and 1500-1 370 cm-* of the quinone anion. In the latter region, they are characterized by the amplitude decrease and small downshift (3 cm-l) of the 1478-cm-' band and by a shift to 1428 cm-' of a component underlying the 1444-cm-1 band. When the spectrum of RCs reconstituted with '*O-labeled vitamin K1 (Figure 5a, solid line) is corrected for the presence of the residual unlabeled quinone, a band clearly remains at 1439 cm-1 in addition to bands at 1475,1426, and 1394-1388 cm-' (data not shown). The Q A - / Q A spectrum obtained with '3C-labeled Q8 (Figure 4b) shows very little absorption in the 1500-1430-~m-~ region. Thus, the band at 1439 cm-l in the corrected Q A - / Q A spectrum of RCs reconstituted with l 8 0 - labeled vitamin K1 cannot originate from a protein mode and has to be assigned to a genuine quinone anion mode. As is also evident in Figures 2b, 3, and 4, the two spectra in Figure Sa show an almost perfect match in the regions above 1660 cm-l, between 1560 and 1500 cm-l, and below 1370 cm-l. This, together with the reproducibility of the spectra observed on different batches of RCs, suggest that double-difference spectra can be calculated to sort out more clearly the contributions of the quinone vibrations from those of the protein.
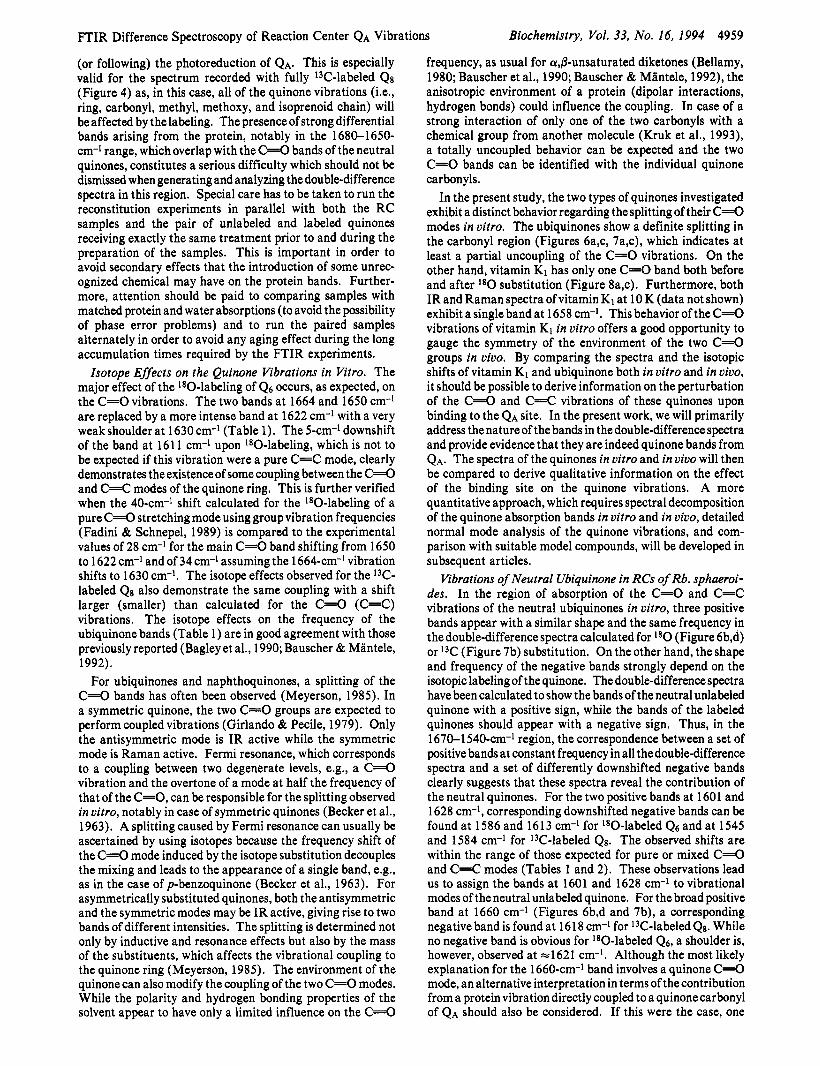
Double-Difference Spectra. In Figure 6a-q the double- difference spectrum (le0 - 160) calculated from the pair of Q A - / Q A spectra shown in Figure 2b is compared with the IR
FTIR Difference Spectroscopy of Reaction Center QA Vibrations Biochemistry, Vol. 33, No. 16, 1994 4957
spectra of the isolated unlabeled and 180-labeled 4 6 used for the reconstitution. The in vivo double-difference spectrum (Figure 6b) was obtained after normalization of the individual QA-/QA difference spectra on the nonquinonic signals present in the regions 1750-1670 and 1560-1500 cm-l, which appear essentially unaffected by the isotopic substitution on the quinone carbonyls. This normalization procedure corrects for possible differences in sample concentration and yield of photochemistry as well as for the effect of incomplete labeling of the quinones. The in vitro absorption spectra of the isolated quinones are presented with positive and negative signs for the unlabeled (Figure 6a) and '80-labeled (Figure 6c) compounds, respectively, to facilitate comparison with the vibrations of neutral ubiquinones in the in vivo spectra. In a QA-/QA spectrum, the bands of the neutral quinone that are affected by the photoionization appear as negative signals. Thus, in the l 8 0 - l 6 0 double-difference spectrum (Figure 6b), the bands of the neutral 180-labeled quinone in vivo are expected to exhibit a negative sign while those of the unlabeled quinone should appear with a positive sign. In the region between 1670 and 1590 cm-l, where the C=O and C=C vibrations of the neutral unlabeled quinone absorb in vitro (Figure 6a), the double-difference spectrum (Figure 6b) exhibits three positive peaks at 1660, 1629, and 1601 cm-l which compare well with the absorption bands at 1664,1650, and 1611 cm-l of the isolated quinone, although frequency shifts together with changes of amplitude and width of the bands are also observed. Similarly, the negative bands at 161 3 and 1586 cm-l of the double-difference spectrum (Figure 6b) appear to correspond qualitatively to the bands at 1622 and 1606 cm-l observed in the absorption spectrum of the 180-labeled quinone (Figure 6c).
To illustrate the value of double-difference spectra, it is instructive to compare the one shown in Figure 6b with the original QA-/QA spectra (Figure 2b). The band at 1660 cm-l is not detected in the QA-/QA spectrum of the unlabeled quinone as it overlaps with the strong differential signals present in this frequency range. The band at 1629 cm-l is not seen clearly as it partially overlaps with two negative bands which are revealed at 1624 and 1633 cm-' in the QA-/QA spectrum of the 180-labeled quinone. On the other hand, the bands at 1613 and 1586 cm-l of the 180-labeled quinone and that at 1601 cm-I of the unlabeled quinone appear directly in the QA-/QA spectra. In the region where the @C and C h C vibrations of the semiquinone absorb, positive bands arising from 180-labeled QA- are found at 1437 and 1419 cm-l while the negative bands of the unlabeled 4 6 anion are found at 1485, 1468, and 1457 cm-l.
Thedouble-differencespectrum ( l 8 0 - l60) calculated from the pair of QA-/QA spectra shown in Figure 3 for RCs reconstituted with Q1 (Figure 6d) isvery similar to that shown in Figure 6b, except for a reduced amplitude of the small bands at e1485 and 1457 cm-l. Although the l80/l6O exchange of the carbonyls of the quinones has been performed under very different experimental conditions for Q6 (exchange in vitro) and Q1 (exchange in situ), the observation of highly comparable double-difference spectra (Figure 6b,d) gives confidence that the spectral changes are indeed due to a direct isotopic effect on the quinones and not to a secondary effect of the chemical treatment that accompanies the 180-labeling of the quinones.
The 1R absorption spectra of the isolated quinones are characterized by the C-0 bands at 1664 and 1650 cm-l for unlabeled 4 6 and at 1622 cm-l (with a weak shoulder around 1630 cm-l) for the 180-labeled compound (Table 1). The C=C bands are found at 1611 ( l60) and 1606 cm-l (l80).
Table 1: Frequency (cm-l) of Ubiquinones (Qs and Qs) and Vitamin Kl (VitK1) IR Bands in VitraD
6 6 6 6
C=O 1664 1630sh 34 40 1621 43 37 C=O 1650 1622 28 40 1609 41 37 C=C 1611 1606 5 0 1554 57 63 CH2 1449 1449 0 0 1442 7 CH3 1381 1381 0 0 1366 15 COCH3 1287 1287 0 0 1265 22 28 COCH3 1263 1263 0 0 1234 29 28
l2Cl60 Q6 12Cla0 Q6 obsd calcd l3Ci6O QS obsd calcd
6 6 l2C160 VitKl 12C180 VitKl obsd calcd
C = O 1661 1634 27 40 C=C quin 1618 1610 8 0 C=C arom 1597 1597 3 0 CHI 1461 1461 0 0 CH3 1377 1377 0 0 C=C arom + C-C quin 1329 1329 0 0
1294 1294 0 0
6 = isotopic shift; obsd = observed; calcd = calculated (using the harmonic oscillator approximation); arom = aromatic; quin = quinonic; sh = shoulder.
The small bands around 1651 and 1665 cm-l in Figure 6c correspond to the =25% unlabeled Q6. Bands at 1449 and 1381 cm-' can be assigned to hydrogen bending vibrations from CH2 and CH3 groups (Bellamy, 1980), while bands at 1287 and 1263 cm-l can probably be assigned to the C-0- CH3 vibrations from the methoxy groups (Pennock, 1965). The bands between 1450 and 1200 cm-l appear essentially unaffected by the isotopic substitution on the carbonyl oxygens, in agreement with the assignments discussed above, and have therefore been used to normalize the amplitudes of the in vitro spectra (Figure 6a,c). It should be noticed that negative bands at 1206 and 1263 cm-1 as well as a weaker band at 1287 cm-l, which are consistently observed in the QA-/QA spectra (Figure 2a,b and Breton et al., 1991a, 1992), correspond to bands at almost the same frequency in the in vitro spectra (Figure 6a,c).
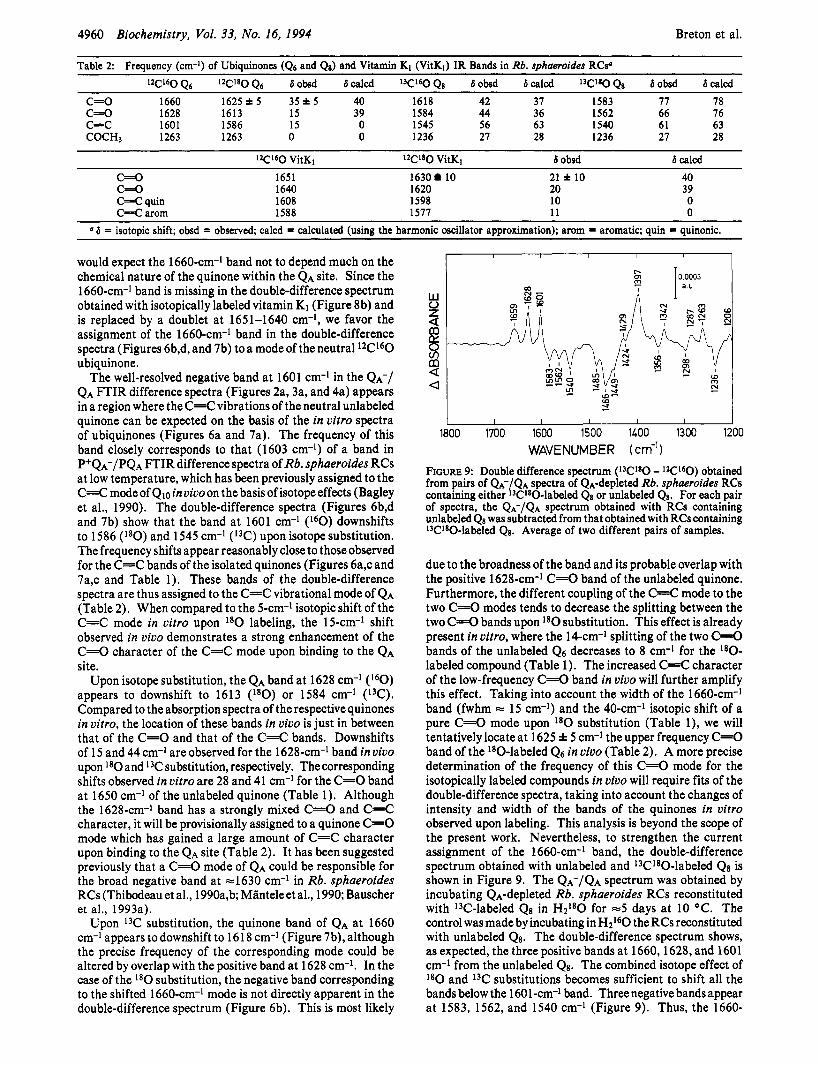
The comparison between the double-difference spectra (13C - 12C) calculated from the pair of QA-/QA spectra shown in Figure 4 and the IR spectra of unlabeled and 13C-labeled Q8 is shown in Figure 7a-c. The double-difference spectrum (Figure 7b) exhibits three positive bands at 1661, 1628 and 1601 cm-l, while three negative bands are observed at 1618, 1584, and 1545 cm-I. These negative bands correspond closely to the range of absorption of C=O and C=C modes of the 13C-labeled Q8 in vitro (Figure 7c). Of significance here is the remarkable correspondence between the positive bands of the unlabeled neutral quinones in the 1700-1500-~m-~ frequency region of all the double-difference spectra (Figures 6b,d, 7b) while the negative bands appear highly sensitive to the nature of the isotope used to label the quinone. This indicates that the C=C and C=O modes of the neutral unlabeled ubiquinone in the QA site of Rb. sphaeroides RCs have been demasked for the first time. This observation also extends to the anion bands in the 1500-1380-~m-~ frequency region, for which the negative bands of the unlabeled semiquinone are almost the same in all double-difference spectra, while the positive bands of the isotopically labeled semiquinone are strongly affected by the nature of the label. The positive bands at 1287, 1262, and 1205 cm-l, together with the negative band at 1236 cm-l, in thedouble-difference spectrum (Figure 7b) correlate well with bands at almost the same frequencies in the absorption spectra of the isolated quinones (Figure 7a,c). The absence of these bands in the l 8 0 - l 6 0 double-difference spectra (Figure 6b,d) demonstrates
4958 Biochemistry, Vol. 33, No. 16, 1994 Breton et al.
m W
a
I I I I I I I 1800 1700 1600 1500 1400 1300 1200
FIGURE 7: (a) IR absorption spectrum of a film (casted from a n-hexane solution) of unlabeled Qs. (b) Double-difference spectrum (I3C - I2C) obtained from pairs of QA-/QA spectra of QA-depleted Rb. sphaeroides RCs reconstituted with either 13C-labeled or unlabeled Qs. For each pair of spectra, the QA-/QA spectrum obtained with RCs reconstituted with unlabeled Qs was subtracted from that obtained with RCs reconstituted with 13C~labeled Qs. Average of four different pairs of samples. (c) IR absorption spectrum (X-1) of a film (casted from a n-hexane solution) of 13C-labeled Qs.
that they areindeed quinone bands sensitive to the 13C-labeling but not to the l 8 0 substitution on the carbonyls, in agreement with their assignment to C-O-CH3 vibrations from the methoxy groups. Furthermore, the amplitudes of these bands relative to the bands observed in the C=O and C=C region are about the same for the quinone in vivo (Figure 7b) and in vitro (Figure 7a,c). This observation supports the view that the bands in the 1670-1530-~m-~ frequency range of the double difference spectrum are indeed quinone bands from the neutral QA. The isolated I3C-labeled quinone exhibits shifts of 41-43 and 57 cm-l for the main C=O and C=C vibrations, respectively (Table 1). The bands in the 1500- 1300-cm-l region which arise from SCH2 and 6CH3 modes are, as expected, slightly downshifted, while a 29-cm-l shift is observed for the 1263-cm-l band, thus supporting its assignment to C-O-CH3 vibrations.
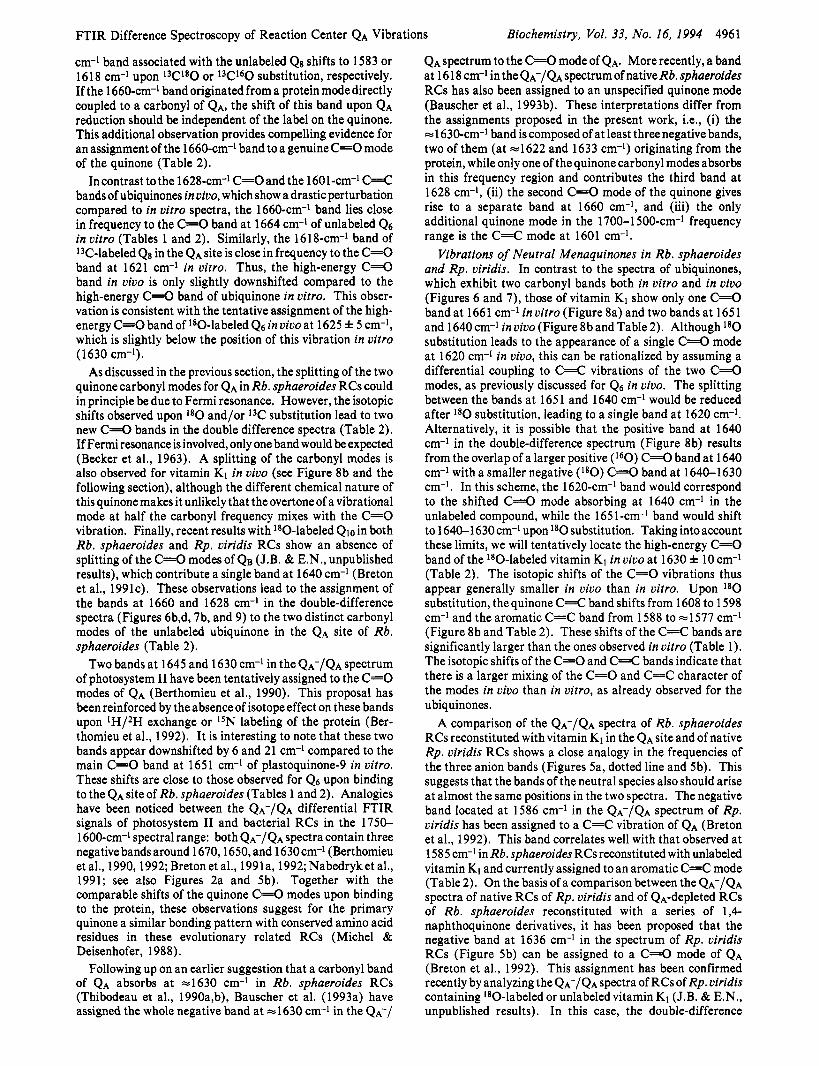
The comparison between the double-difference spectrum (lag- l60) calculated from the pair of QA-/QA spectra shown in Figure Sa and the IR spectra of unlabeled and 180-labeled vitamin K1 are presented in Figure 8a-c. In the region of absorption of the C=O and C=C vibrations of the neutral quinone, the double-difference spectrum (Figure 8b) exhibits a doublet of positive peaks at 1651 and 1640 cm-l and two negative peaks at 1620 and 1577 cm-l. In between the two latter bands, a small structured signal with a negative lobe at 1598 cm-l and two positive ones at 1608 and 1588 cm-l is reproducibly resolved. A good qualitative correspondence is observed between the positive (negative) bands of the double- difference spectrum and the C=O and C=C bands of the neutral unlabeled (180-labeled) vitamin K1. The region of the anion absorption bands appears simpler than for ubiquino- ne-containing RCs, with a decrease and increase of the amplitude at 1479 and -1386 cm-l, respectively, and a band shift giving rise to most of the 1447/1425 cm-I differential signal.
The IR absorption spectra of the isolated vitamin K1 (Figure 8a,c) are characterized by a single and intense C=O band at
WAVENUMBER ( cm-9
I I 1 I 1 I 1800 1700 1600 1500 1400 1300 1200
WAVENUMBER (cm-’1 FIGURE 8: (a) IR absorption spectrum of a film of unlabeled vitamin KI. (b) Double-difference spectrum (laO - l6O) obtained from pairs of QA-/QA spectra of QA-depleted Rb. sphaeroides RCs reconstituted with either 180-labeled or unlabeled vitamin KI. For each pair of spectra, the QA-/QA spectrum obtained with RCs reconstituted with unlabeled vitamin KI was subtracted from that obtained with RCs reconstituted with 180-labeledvitamin K1. Average of four different pairs of samples. (c) IR absorption spectrum (X-1) of a film of I80-labeled vitamin K1.
1661 (l60) or 1634 cm-l (l80), a weak C-C vibration from the quinone ring a t 1618 (l60) or 1610 cm-l (l80), and a medium-intensity aromatic C=C vibration at 1597 (l60) or 1594 cm-l (l80). The band at 1661 cm-l in Figure 8c corresponds to the =30% of residual unlabeled quinone. The phytyl chain absorbs at 1461 (6CH2) and 1377 cm-l (6CHs). I t has been proposed that the strong band at 1294 cm-l could be due to an interaction of the quinone carbonyls with the adjacent C-C vibrations (Bellamy, 1980). As almost no l8O/ l 6 0 isotope effect is observed on this band, this interpretation appears rather unlikely. Furthermore, normal mode calcula- tions have indicated that this band corresponds to coupled C-C and C=C vibrations from the two cycles of the naphthoquinone ring (Burie et al., 1993). This band, which decreases intensity upon QA- formation, can be considered as a good marker for RCs containing naphthoquinones (Breton et al., 1991a,b, 1992; Nabedryk et al., 1991; see also Figure 5 ) *
DISCUSSION
Light-induced P+Q-/PQ FTIR difference spectra of Rb. sphaeroides RCs reconstituted with isotopically labeled quinones have been investigated previously in order to obtain information on the quinone vibrations in vivo. In view of the dominant contribution from P+/P in these spectra, only the C=C mode of QIO, resolved at 1603 cm-l at low temperature, could be assigned, while small isotope effects around 1625 and 1450 cm-l suggested additional contributions from the quinone (Bagley et al., 1990). In contrast, the pure QA-/QA FTIR difference spectra presented in this study for RCs reconstituted with Q1, 46, or vitamin K1 isotopically labeled on their carbonyl oxygens and with fully 13C-labeled Qg demonstrate large spectral effects reflecting pronounced frequency shifts of the modes of both the neutral and the anion forms. In addition, many of the bands that are not affected by the isotopic substitutions reflect long-lived structural rearrangements of the protein concomitant with
FTIR Difference Spectroscopy of Reaction Center QA Vibrations Biochemistry, Vol. 33, No. 16, I994 4959
(or following) the photoreduction of QA. This is especially valid for the spectrum recorded with fully 13C-labeled Qg (Figure 4) as, in this case, all of the quinone vibrations (Le., ring, carbonyl, methyl, methoxy, and isoprenoid chain) will be affected by the labeling. The presence of strong differential bands arising from the protein, notably in the 1680-1650- cm-l range, which overlap with the C=O bands of the neutral quinones, constitutes a serious difficulty which should not be dismissed when generating and analyzing the double-difference spectra in this region. Special care has to be taken to run the reconstitution experiments in parallel with both the RC samples and the pair of unlabeled and labeled quinones receiving exactly the same treatment prior to and during the preparation of the samples. This is important in order to avoid secondary effects that the introduction of some unrec- ognized chemical may have on the protein bands. Further- more, attention should be paid to comparing samples with matched protein and water absorptions (to avoid the possibility of phase error problems) and to run the paired samples alternately in order to avoid any aging effect during the long accumulation times required by the FTIR experiments.
Isotope Effects on the Quinone Vibrations in Vitro. The major effect of the 180-labeling Of Q6 occurs, as expected, on the C=O vibrations. The two bands at 1664 and 1650 cm-l are replaced by a more intense band at 1622 cm-l with a very weakshoulder at 1630 cm-l (Table 1). The 5-cm-l downshift of the band at 161 1 cm-l upon IgO-labeling, which is not to be expected if this vibration were a pure C=C mode, clearly demonstrates the existence of some coupling between the C 4 and C=C modes of the quinone ring. This is further verified when the 40-cm-l shift calculated for the 180-labeling of a pure C-0 stretching mode using group vibration frequencies (Fadini & Schnepel, 1989) is compared to the experimental values of 28 cm-l for the main C=O band shifting from 1650 to 1622 cm-l and of 34 cm-l assuming the 1664-cm-l vibration shifts to 1630 cm-l. The isotope effects observed for the 13C- labeled Qg also demonstrate the same coupling with a shift larger (smaller) than calculated for the C=O (C=C) vibrations. The isotope effects on the frequency of the ubiquinone bands (Table 1) are in good agreement with those previously reported (Bagley et al., 1990; Bauscher & Mantele, 1992).
For ubiquinones and naphthoquinones, a splitting of the C=O bands has often been observed (Meyerson, 1985). In a symmetric quinone, the two C E O groups are expected to perform coupled vibrations (Girlando & Pecile, 1979). Only the antisymmetric mode is IR active while the symmetric mode is Raman active. Fermi resonance, which corresponds to a coupling between two degenerate levels, e.g., a C=O vibration and the overtone of a mode at half the frequency of that of the C=O, can be responsible for the splitting observed in vitro, notably in case of symmetric quinones (Becker et al., 1963). A splitting caused by Fermi resonance can usually be ascertained by using isotopes because the frequency shift of the C=O mode induced by the isotope substitution decouples the mixing and leads to the appearance of a single band, e.g., as in the case of p-benzoquinone (Becker et al., 1963). For asymmetrically substituted quinones, both the antisymmetric and the symmetric modes may be IR active, giving rise to two bands of different intensities. The splitting is determined not only by inductive and resonance effects but also by the mass of the substituents, which affects the vibrational coupling to the quinone ring (Meyerson, 1985). The environment of the quinone can also modify the coupling of the two C-0 modes. While the polarity and hydrogen bonding properties of the solvent appear to have only a limited influence on the C=O
frequency, as usual for a,&unsaturated diketones (Bellamy, 1980; Bauscher et al., 1990; Bauscher & Mantele, 1992), the anisotropic environment of a protein (dipolar interactions, hydrogen bonds) could influence the coupling. In case of a strong interaction of only one of the two carbonyls with a chemical group from another molecule (Kruk et al., 1993), a totally uncoupled behavior can be expected and the two C=O bands can be identified with the individual quinone carbonyls.
In the present study, the two types of quinones investigated exhibit a distinct behavior regarding the splitting of their C 4 modes in vitro. The ubiquinones show a definite splitting in the carbonyl region (Figures 6a,c, 7a,c), which indicates at least a partial uncoupling of the C=O vibrations. On the other hand, vitamin K1 has only one C=O band both before and after lSO substitution (Figure 8a,c). Furthermore, both IR and Raman spectra of vitamin K1 at 10 K (data not shown) exhibit a single band at 1658 cm-'. This behavior of the C=O vibrations of vitamin K1 in vitro offers a good opportunity to gauge the symmetry of the environment of the two C=O groups in vivo. By comparing the spectra and the isotopic shifts of vitamin K1 and ubiquinone both in vitro and in vivo, it should be possible to derive information on the perturbation of the C=O and C=C vibrations of these quinones upon binding to the QA site. In the present work, we will primarily address the nature of the bands in the double-difference spectra and provide evidence that they are indeed quinone bands from QA. The spectra of the quinones in vitro and in vivo will then be compared to derive qualitative information on the effect of the binding site on the quinone vibrations. A more quantitative approach, which requires spectral decomposition of the quinone absorption bands in vitro and in vivo, detailed normal mode analysis of the quinone vibrations, and com- parison with suitable model compounds, will be developed in subsequent articles.
Vibrations of Neutral Ubiquinone in RCs of Rb. sphaeroi- des. In the region of absorption of the C=O and C=C vibrations of the neutral ubiquinones in vitro, three positive bands appear with a similar shape and the same frequency in the double-difference spectra calculated for l 8 0 (Figure 6b,d) or l3C (Figure 7b) substitution. On the other hand, the shape and frequency of the negative bands strongly depend on the isotopic labeling of the quinone. The double-difference spectra have been calculated to show the bands of the neutral unlabeled quinone with a positive sign, while the bands of the labeled quinones should appear with a negative sign. Thus, in the 1670-1540-~m-~ region, the correspondence between a set of positive bands a t constant frequency in all the double-difference spectra and a set of differently downshifted negative bands clearly suggests that these spectra reveal the contribution of the neutral quinones. For the two positive bands at 1601 and 1628 cm-l, corresponding downshifted negative bands can be found at 1586 and 161 3 cm-l for 180-labeled 46 and at 1545 and 1584 cm-l for 13C-labeled Qs. The observed shifts are within the range of those expected for pure or mixed C=O and C=C modes (Tables 1 and 2). These observations lead us to assign the bands at 1601 and 1628 cm-l to vibrational modes of the neutral unlabeled quinone. For the broad positive band at 1660 cm-l (Figures 6b,d and 7b), a corresponding negative band is found at 1618 cm-l for 13C-labeled Qg. While no negative band is obvious for 180-labeled Q6, a shoulder is, however, observed at -1621 cm-l. Although the most likely explanation for the 1660-cm-l band involves a quinone C=O mode, an alternative interpretation in terms of the contribution from a protein vibration directly coupled to a quinone carbonyl of QA should also be considered. If this were the case, one
4960 Biochemistry, Vol. 33, No. 16, 1994 Breton et al.
Table 2 Frequency (cm-l) of Ubiquinones (Q6 and Q8) and Vitamin K1 (VitK1) IR Bands in Rb. sphueroides RCsa
C - 0 1660 1625i5 35*5 40 1618 42 37 1583 77 78 c=o 1628 1613 15 39 1584 44 36 1562 66 76 c=c 1601 1586 15 0 1545 56 63 1540 61 63 COCH3 1263 1263 0 0 1236 27 28 1236 27 28
I2C16O VitKl 1 2 c 1 8 0 VitKl 6 obsd 6 calcd C=O 1651 1630 10 21 * 10 40 C=O 1640 1620 20 39
C=C arom 1588 1577 1 1 0 a 6 = isotopic shift; obsd = observed, calcd = calculated (using the harmonic oscillator approximation); arom = aromatic; quin = quinonic.
C=C quin 1608 1598 10 0
would expect the 1660-cm-I band not to depend much on the chemical nature of the quinone within the QA site. Since the 1660-cm-l band is missing in the double-difference spectrum obtained with isotopically labeled vitamin K1 (Figure 8b) and is replaced by a doublet at 1651-1640 cm-I, we favor the assignment of the 1660-cm-l band in the double-difference spectra (Figures 6b,d, and 7b) toa mode of the neutral l2Cl60 ubiquinone.
The well-resolved negative band a t 1601 cm-I in the QA-/ QA FTIR difference spectra (Figures 2a, 3a, and 4a) appears in a region where the C=C vibrations of the neutral unlabeled quinone can be expected on the basis of the in vitro spectra of ubiquinones (Figures 6a and 7a). The frequency of this band closely corresponds to that (1603 cm-l) of a band in P+QA-/PQA FTIR difference spectra of Rb. sphaeroides RCs at low temperature, which has been previously assigned to the C=C mode of Qlo in vivo on the basis of isotope effects (Bagley et al., 1990). The double-difference spectra (Figures 6b,d and 7b) show that the band at 1601 cm-l ( l60) downshifts to 1586 (180) and 1545 cm-I ('3C) upon isotope substitution. The frequency shifts appear reasonably close to those observed for the C=C bands of the isolated quinones (Figures 6a,c and 7a,c and Table 1). These bands of the double-difference spectra are thus assigned to the C-C vibrational mode of QA (Table 2). When compared to the 5-cm-l isotopic shift of the C=C mode in vitro upon l g 0 labeling, the 15-cm-I shift observed in vivo demonstrates a strong enhancement of the C=O character of the C=C mode upon binding to the QA site.
Upon isotope substitution, the QA band at 1628 cm-1 (l60) appears to downshift to 1613 ( lg0) or 1584 cm-l (13C). Compared to the absorption spectra of the respective quinones in vitro, the location of these bands in vivo is just in between that of the C=O and that of the C=C bands. Downshifts of 15 and 44 cm-1 are observed for the 1628-cm-l band in vivo upon 1 8 0 and 13C substitution, respectively. Thecorresponding shifts observed in vitro are 28 and 41 cm-l for the C=O band at 1650 cm-1 of the unlabeled quinone (Table 1). Although the 1628-cm-l band has a strongly mixed C=O and C=C character, it will be provisionally assigned to a quinone C=O mode which has gained a large amount of C=C character upon binding to the QA site (Table 2). It has been suggested previously that a C=O mode of QA could be responsible for the broad negative band at -1630 cm-l in Rb. sphaeroides RCs (Thibodeauet al., 1990a,b; Manteleet al., 1990; Bauscher et al., 1993a).
Upon 13C substitution, the quinone band of QA at 1660 cm-l appears to downshift to 16 18 cm-l (Figure 7b), although the precise frequency of the corresponding mode could be altered by overlap with the positive band at 1628 cm-l. In the case of the lgO substitution, the negative band corresponding to the shifted 1660-cm-l mode is not directly apparent in the double-difference spectrum (Figure 6b). This is most likely
I p1 m c2
0.0003
W m
W m N
1800 1700 1600 1500 1400 1300 1200 WAVENUMBER (cm-')
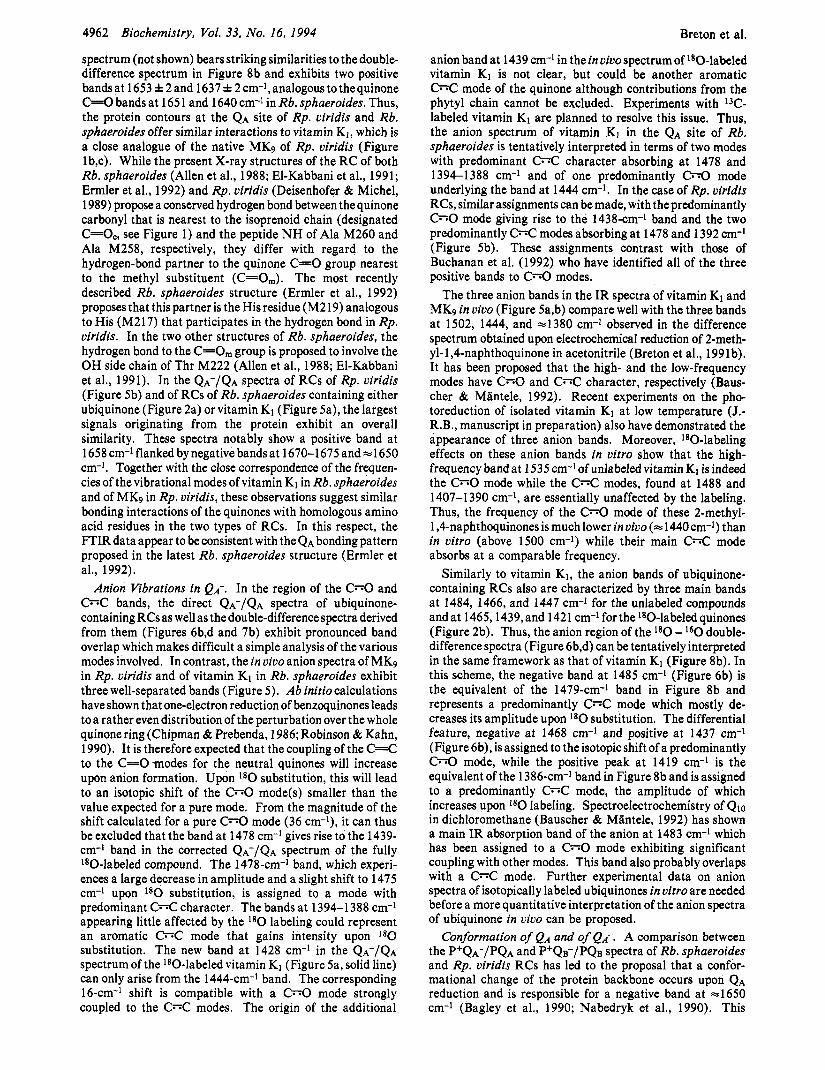
FIGURE 9: Double difference spectrum (13C180 - WL60) obtained from pairs of QA-/QA spectra of QA-depleted Rb. sphaeroides RCs containing either I3PO-labeled Q8 or unlabeled Qs. For each pair of spectra, the QA-/QA spectrum obtained with RCs containing unlabeled Q8 was subtracted from that obtained with RCs containing Wl8O-labeled Q8. Average of two different pairs of samples.
due to the broadness of the band and its probable overlap with the positive 1628-cm-l C=O band of the unlabeled quinone. Furthermore, the different coupling of the C-C mode to the two C=O modes tends to decrease the splitting between the two C - 0 bands upon l 8 0 substitution. This effect is already present in vitro, where the 14-cm-' splitting of the two C=O bands of the unlabeled Q6 decreases to 8 cm-l for the lSO- labeled compound (Table 1). The increased C-C character of the low-frequency C=O band in vivo will further amplify this effect. Taking into account the width of the 1660-cm-l band (fwhm = 15 cm-l) and the 40-cm-l isotopic shift of a pure C=O mode upon lgO substitution (Table l ) , we will tentatively locate at 1625 f 5 cm-l the upper frequency C=O band of the 180-labeled Q6 in vivo (Table 2). A more precise determination of the frequency of this C=O mode for the isotopically labeled compounds in vivo will require fits of the double-difference spectra, taking into account the changes of intensity and width of the bands of the quinones in vitro observed upon labeling. This analysis is beyond the scope of the present work. Nevertheless, to strengthen the current assignment of the 1660-cm-l band, the double-difference spectrum obtained with unlabeled and 13C180-labeled Qg is shown in Figure 9. The QA-/QA spectrum was obtained by incubating QA-depleted Rb. sphaeroides RCs reconstituted with W-labeled Qg in H2l80 for -5 days at 10 O C . The control was made by incubating in H2160 theRCs reconstituted with unlabeled Qs. The double-difference spectrum shows, as expected, the three positive bands at 1660,1628, and 1601 cm-l from the unlabeled Qg. The combined isotope effect of l 8 0 and 13C substitutions becomes sufficient to shift all the bands below the 1601-cm-l band. Three negative bands appear a t 1583, 1562, and 1540 cm-l (Figure 9). Thus, the 1660-
FTIR Difference Spectroscopy of Reaction Center QA Vibrations Biochemistry, Vol. 33, No. 16, 1994 4961
cm-1 band associated with the unlabeled QS shifts to 1583 or 1618 cm-l upon 13C180 or 13C160 substitution, respectively. If the 1660-cm-l band originated from a protein mode directly coupled to a carbonyl of QA, the shift of this band upon QA reduction should be independent of the label on the quinone. This additional observation provides compelling evidence for an assignment of the 1660-cm-l band to a genuine C=O mode of the quinone (Table 2).
Incontrast tothe 1628-cm-I C=Oand the 1601-cm-l C=C bands of ubiquinones in vivo, which show a drastic perturbation compared to in vitro spectra, the 1660-cm-l band lies close in frequency to the C=O band at 1664 cm-l of unlabeled Q6 in uitro (Tables 1 and 2). Similarly, the 1618-cm-l band of 13C-labeled Qg in the QA site is close in frequency to the C=O band at 1621 cm-l in vitro. Thus, the high-energy C=O band in vivo is only slightly downshifted compared to the high-energy C=O band of ubiquinone in vitro. This obser- vation is consistent with the tentative assignment of the high- energy C=O band of 180-labeled Q6 in vivo at 1625 * 5 cm-', which is slightly below the position of this vibration in vitro (1630 cm-l).
As discussed in the previous section, the splitting of the two quinone carbonyl modes for QA in Rb. sphaeroides RCs could in principle be due to Fermi resonance, However, the isotopic shifts observed upon l8O and/or 13C substitution lead to two new C=O bands in the double difference spectra (Table 2). If Fermi resonance is involved, only one band would be expected (Becker et al., 1963). A splitting of the carbonyl modes is also observed for vitamin K1 in vivo (see Figure 8b and the following section), although the different chemical nature of this quinone makes it unlikely that theovertone of a vibrational mode at half the carbonyl frequency mixes with the C=O vibration. Finally, recent results with lg0-labeled Qlo in both Rb. sphaeroides and Rp. viridis RCs show an absence of splitting of the C=O modes of QB (J.B. & E.N., unpublished results), which contribute a single band at 1640 cm-l (Breton et al., 1991~). These observations lead to the assignment of the bands at 1660 and 1628 cm-l in the double-difference spectra (Figures 6b,d, 7b, and 9) to the two distinct carbonyl modes of the unlabeled ubiquinone in the QA site of Rb. sphaeroides (Table 2).
Two bands at 1645 and 1630 cm-' in the QA-/QA spectrum of photosystem I1 have been tentatively assigned to the C=O modes of QA (Berthomieu et al., 1990). This proposal has been reinforced by the absence of isotope effect on these bands upon 'HI2H exchange or lSN labeling of the protein (Ber- thomieu et al., 1992). It is interesting to note that these two bands appear downshifted by 6 and 21 cm-l compared to the main C=O band at 1651 cm-l of plastoquinone-9 in vitro. These shifts are close to those observed for 4 6 upon binding to the QA site of Rb. sphaeroides (Tables 1 and 2). Analogies have been noticed between the QA-/QA differential FTIR signals of photosystem I1 and bacterial RCs in the 1750- 1600-cm-l spectral range: both QA-/QA spectra contain three negative bands around 1670,1650, and 163Ocm-l (Berthomieu et al., 1990, 1992; Bretonet al., 1991a, 1992;Nabedryket al., 1991; see also Figures 2a and 5b). Together with the comparable shifts of the quinone C=O modes upon binding to the protein, these observations suggest for the primary quinone a similar bonding pattern with conserved amino acid residues in these evolutionary related RCs (Michel & Deisenhofer, 1988).
Following up on an earlier suggestion that a carbonyl band of QA absorbs at ~ 1 6 3 0 cm-l in Rb. sphaeroides RCs (Thibodeau et al., 1990a,b), Bauscher et al. (1993a) have assigned the whole negative band at ~ 1 6 3 0 cm-l in the QA-/
QAspectrum to the C=O mode of QA. More recently, a band at 16 18 cm-l in the QA-/QA spectrum of native Rb. sphaeroides RCs has also been assigned to an unspecified quinone mode (Bauscher et al., 1993b). These interpretations differ from the assignments proposed in the present work, Le., (i) the ~1630-cm-l band is composed of at least three negative bands, two of them (at ~ 1 6 2 2 and 1633 cm-l) originating from the protein, while only one of the quinone carbonyl modes absorbs in this frequency region and contributes the third band at 1628 cm-*, (ii) the second C=O mode of the quinone gives rise to a separate band at 1660 cm-l, and (iii) the only additional quinone mode in the 1700-1 500-cm-l frequency range is the C=C mode at 1601 cm-l.
Vibrations of Neutral Menaquinones in Rb. sphaeroides and Rp. uiridis. In contrast to the spectra of ubiquinones, which exhibit two carbonyl bands both in vitro and in vivo (Figures 6 and 7), those of vitamin K1 show only one C=O bandat 1661 cm-l inuitro (Figure 8a) and two bands at 1651 and 1640 cm-l in vivo (Figure 8b and Table 2). Although l80 substitution leads to the appearance of a single C=O mode at 1620 cm-l in uiuo, this can be rationalized by assuming a differential coupling to C=C vibrations of the two C=O modes, as previously discussed for 4 6 in vivo. The splitting between the bands at 165 1 and 1640 cm-l would be reduced after l80 substitution, leading to a single band at 1620 cm-I. Alternatively, it is possible that the positive band at 1640 cm-l in the double-difference spectrum (Figure 8b) results from the overlap of a larger positive ( l60) C=O band at 1640 cm-l with a smaller negative ( l80) C=O band at 1640-1630 cm-'. In this scheme, the 1620-cm-l band would correspond to the shifted C=O mode absorbing at 1640 cm-l in the unlabeled compound, while the 165 1 -cm-' band would shift to 1640-1 630 cm-l upon l 8 0 substitution. Taking into account these limits, we will tentatively locate the high-energy C=O band of the 180-labeled vitamin K1 in vivo at 1630 f 10 cm-l (Table 2). The isotopic shifts of the C=O vibrations thus appear generally smaller in vivo than in uitro. Upon l 8 0 substitution, the quinone C=C band shifts from 1608 to 1598 cm-l and the aromatic C=C band from 1588 to ~ 1 5 7 7 cm-l (Figure 8b and Table 2). These shifts of the C=C bands are significantly larger than the ones observed in uitro (Table 1). The isotopic shifts of the C=O and C=C bands indicate that there is a larger mixing of the C=O and C=C character of the modes in uiuo than in uitro, as already observed for the ubiquinones.
A comparison of the QA-/QA spectra of Rb. sphaeroides RCs reconstituted with vitamin K1 in the QA site and of native Rp. uiridis RCs shows a close analogy in the frequencies of the three anion bands (Figures 5a, dotted line and 5b). This suggests that the bands of the neutral species also should arise at almost the same positions in the two spectra. The negative band located at 1586 cm-1 in the QA-/QA spectrum of Rp. viridis has been assigned to a C=C vibration of QA (Breton et al., 1992). This band correlates well with that observed at 1585 cm-l in Rb. sphaeroides RCs reconstituted with unlabeled vitamin K1 and currently assigned to an aromatic C=C mode (Table 2). On the basis of a comparison between the QA-/QA spectra of native RCs of Rp. viridis and of QA-depleted RCs of Rb. sphaeroides reconstituted with a series of 1,4- naphthoquinone derivatives, it has been proposed that the negative band at 1636 cm-l in the spectrum of Rp. viridis RCs (Figure 5b) can be assigned to a C=O mode of QA (Breton et al., 1992). This assignment has been confirmed recently by analyzing the QA-/QA spectra of RCs of Rp. viridis containing lS0-labeled or unlabeled vitamin K1 (J.B. & E.N., unpublished results). In this case, the double-difference
4962 Biochemistry, Vol. 33, No. 16, 1994
spectrum (not shown) bears striking similarities to the double- difference spectrum in Figure 8b and exhibits two positive bands at 1653 f 2 and 1637 f 2 cm-l, analogous to the quinone C=O bands at 165 1 and 1640 cm-l in Rb. sphaeroides. Thus, the protein contours at the QA site of Rp. viridis and Rb. sphaeroides offer similar interactions to vitamin K1, which is a close analogue of the native MKg of Rp. viridis (Figure lb,c). While the present X-ray structures of the RC of both Rb. sphaeroides (Allen et al., 1988; El-Kabbani et al., 1991; Ermler et al., 1992) and Rp. viridis (Deisenhofer & Michel, 1989) propose a conserved hydrogen bond between the quinone carbonyl that is nearest to the isoprenoid chain (designated C=Oc, see Figure 1) and the peptide N H of Ala M260 and Ala M258, respectively, they differ with regard to the hydrogen-bond partner to the quinone C-0 group nearest to the methyl substituent (C=O,). The most recently described Rb. sphaeroides structure (Ermler et al., 1992) proposes that this partner is the His residue (M2 19) analogous to His (M217) that participates in the hydrogen bond in Rp. viridis. In the two other structures of Rb. sphaeroides, the hydrogen bond to the C=Om group is proposed to involve the OH side chain of Thr M222 (Allen et al., 1988; El-Kabbani et al., 1991). In the QA-/QA spectra of RCs of Rp. viridis (Figure Sb) and of RCs of Rb. sphaeroides containing either ubiquinone (Figure 2a) or vitamin K1 (Figure 5a), the largest signals originating from the protein exhibit an overall similarity. These spectra notably show a positive band at 1658 cm-l flanked by negative bandsat 1670-1675 and-1650 cm-l. Together with the close correspondence of the frequen- cies of thevibrational modes of vitamin K1 in Rb. sphaeroides and of MKg in Rp. uiridis, these observations suggest similar bonding interactions of the quinones with homologous amino acid residues in the two types of RCs. In this respect, the FTIR data appear to be consistent with the QA bonding pattern proposed in the latest Rb. sphaeroides structure (Ermler et al., 1992).
Anion Vibrations in QA-. In the region of the C=O and C=C bands, the direct QA-/QA spectra of ubiquinone- containing RCs as well as the double-difference spectra derived from them (Figures 6b,d and 7b) exhibit pronounced band overlap which makes difficult a simple analysis of the various modes involved. In contrast, the in vivo anion spectra of MKg in Rp. uiridis and of vitamin K1 in Rb. sphaeroides exhibit three well-separated bands (Figure 5 ) . Ab initio calculations have shown that one-electron reduction of benzoquinones leads to a rather even distribution of the perturbation over the whole quinone ring (Chipman & Prebenda, 1986; Robinson & Kahn, 1990). It is therefore expected that the coupling of the C=C to the C=O modes for the neutral quinones will increase upon anion formation. Upon l 8 0 substitution, this will lead to an isotopic shift of the C=O mode@) smaller than the value expected for a pure mode. From the magnitude of the shift calculated for a pure C=O mode (36 cm-l), it can thus be excluded that the band at 1478 cm-l gives rise to the 1439- cm-1 band in the corrected QA-/QA spectrum of the fully 180-labeled compound. The 1478-cm-l band, which experi- ences a large decrease in amplitude and a slight shift to 1475 cm-l upon l 8 0 substitution, is assigned to a mode with predominant C=C character. The bands at 1394-1 388 cm-l appearing little affected by the l 8 0 labeling could represent an aromatic Cr;C mode that gains intensity upon 180 substitution. The new band at 1428 cm-' in the QA-/QA spectrum of the 180-labeled vitamin K1 (Figure 5a, solid line) can only arise from the 1444-cm-l band. The corresponding 16-cm-l shift is compatible with a C=O mode strongly coupled to the C=C modes. The origin of the additional
Breton et al.
anion band at 1439 cm-l in the in vivo spectrum of 180-labeled vitamin K1 is not clear, but could be another aromatic C=C mode of the quinone although contributions from the phytyl chain cannot be excluded. Experiments with l3C- labeled vitamin KI are planned to resolve this issue. Thus, the anion spectrum of vitamin K1 in the QA site of Rb. sphaeroides is tentatively interpreted in terms of two modes with predominant c;?c character absorbing at 1478 and 1394-1388 cm-l and of one predominantly C;sO mode underlying the band at 1444 cm-l. In the case of Rp. viridis RCs, similar assignments can be made, with the predominantly C=O mode giving rise to the 1438-cm-l band and the two predominantly CSSC modes absorbing at 1478 and 1392 cm-1 (Figure 5b). These assignments contrast with those of Buchanan et al. (1992) who have identified all of the three positive bands to cs;O modes.
The three anion bands in the IR spectra of vitamin K1 and MKg in vivo (Figure 5a,b) compare well with the three bands at 1502, 1444, and ~ 1 3 8 0 cm-l observed in the difference spectrum obtained upon electrochemical reduction of 2-meth- yl-1,4-naphthoquinone in acetonitrile (Breton et al., 1991b). It has been proposed that the high- and the low-frequency modes have C;sO and C=C character, respectively (Baus- cher & Mantele, 1992). Recent experiments on the pho- toreduction of isolated vitamin K1 at low temperature (J.- R.B., manuscript in preparation) also have demonstrated the appearance of three anion bands. Moreover, 180-labeling effects on these anion bands in vitro show that the high- frequency band at 1535 cm-] of unlabeled vitamin K1 is indeed the C=O mode while the C=C modes, found at 1488 and 1407-1 390 cm-l, are essentially unaffected by the labeling. Thus, the frequency of the C=O mode of these 2-methyl- 1 ,Cnaphthoquinones is much lower in vivo (= 1440 cm-l) than in vitro (above 1500 cm-l) while their main c;?c mode absorbs at a comparable frequency.
Similarly to vitamin K1, the anion bands of ubiquinone- containing RCs also are characterized by three main bands at 1484, 1466, and 1447 cm-1 for the unlabeled compounds andat 1465,1439,and 1421 cm-l forthe 180-labeledquinones (Figure 2b). Thus, the anion region of the l80 - l60 double- difference spectra (Figure 6b,d) can be tentatively interpreted in the same framework as that of vitamin K1 (Figure 8b). In this scheme, the negative band at 1485 cm-I (Figure 6b) is the equivalent of the 1479-cm-l band in Figure 8b and represents a predominantly C=C mode which mostly de- creases its amplitude upon l 8 0 substitution. The differential feature, negative at 1468 cm-' and positive at 1437 cm-1 (Figure 6b), is assigned to the isotopic shift of a predominantly -0 mode, while the positive peak at 1419 cm-l is the equivalent of the 1386-cm-l band in Figure 8b and is assigned to a predominantly C=C mode, the amplitude of which increases upon l80 labeling. Spectroelectrochemistry of Qlo in dichloromethane (Bauscher & Mantele, 1992) has shown a main IR absorption band of the anion at 1483 cm-l which has been assigned to a C;;O mode exhibiting significant coupling with other modes. This band also probably overlaps with a CFC mode. Further experimental data on anion spectra of isotopically labeled ubiquinones in vitro are needed before a more quantitative interpretation of the anion spectra of ubiquinone in vivo can be proposed.
Conformation of QA and of QA-. A comparison between the P+QA-/PQA and P+QB-/PQe spectra of Rb. sphaeroides and Rp. viridis RCs has led to the proposal that a confor- mational change of the protein backbone occurs upon QA reduction and is responsible for a negative band at -1650 cm-1 (Bagley et al., 1990; Nabedryk et al., 1990). This
FTIR Difference Spectroscopy of Reaction Center QA Vibrations Biochemistry, Vol. 33, No. 16, 1994 4963
hypothesis is consistent with the pure QA-/QA and Qe-/Qe spectra (Breton et al., 1991a,c). Possiblecandidates for some of the nonquinonic signals in the QA-/QA spectra have been presented (Thibodeau et al., 1990a,b; Mantele et al., 1990; Bretonetal., 1991a,b, 1992; Bauscher et al., 1993a). However, pending further work on mutants and on RCs isotopically labeled either on specific amino acid residues or on the other cofactors that could be affected by the photoreduction of QA, the assignments of protein bands to specific residues based on considerations of distances or of possible interactions between QA and its binding site is not deemed justified at this time. Nevertheless, the present study allows for the first time the protein modes involved in a QA-/QA spectrum to be discrimi- nated unambiguously from those of the quinone. This observation notably applies to the bands of large amplitude, negative at 1670 cm-l and positive at 1658 cm-l, as well as to the set of structured bands in the amide I1 region around 1550 cm-l. In this respect it is interesting that the amplitude of the protein bands in the QA-/QA spectra is comparable to that of the neutral or anion quinone bands. The extinction coefficients estimated for C=O and C=C vibrations of ubiquinones (Bauscher et al., 1990) and those typical of peptide C=O modes (Venyaminov & Kalnin, 1990) are all in the range 300-800 M-l cm-l. It can thus be estimated that the perturbation of the protein vibrations induced by reduction of QA is roughly equivalent to the perturbation of the quinone vibrations themselves. While this perturbation is highly localized on a small number of bonds at the level of the quinone, it is probably distributed over a larger number of bonds of the protein (Nonella & Schulten, 1991; Gunner & Honig, 1992).
The difficulties previously encountered in assigning the carbonyl vibrations of the neutral quinones in vivo (Bagley et al., 1990; Bauscher et al., 1990; Buchanan et al., 1990; Mantele et al., 1990; Nabedryk et al., 1990; Thibodeau et al., 1990a,b) have led to the proposal that these vibrations might escape detection due to a broadening effect induced by a large distribution of hydrogen bonds or by a specific conformation of the quinone (Bauscher et al., 1990; 1993a). In contrast, the isotope effects reported here demonstrate that the C=O and C=C modes lead to well-defined bands. This appears in the comparison of the in vivo double-difference spectra with the absorption of the isolated quinones (Figures 6-8) which shows that the bandwidths of the C=C and C=O modes are generally smaller in vivo than in vitro. Thus, the present FTIR data suggest specific interactions between the quinone and the protein at a single well-defined QA site. However, a different view has emerged recently from magic angle spinning NMR experiments on Rb. sphaeroides RCs reconstituted with Qlo labeled with 13C at specific positions on the carbon atoms of the ring (van Liemt et al., 1993). From these NMR studies, it has been concluded that QIO in the QA site is subject to considerable heterogeneity. At least part of the discrepancy between the conclusions derived from the two types of experiments must originate from the fact that the line width and chemical shift of the signals measured in NMR are more sensitive than the IR bands to minute alterations of the density of partial charges on individual atoms (Fischer et al., 1992). In addition, the width of the 1660-cm-l IR mode of 4 6 in vivo, which is Comparable to that of the 1664-cm-l mode observed in vitro, may be taken to indicate some static or dynamic heterogeneity around one C=O group.
Concerning the C=O modes of the neutral QA in vivo, the present results on both ubiquinones and vitamin K1 underscore the inequivalence of the interactions of the two carbonyls with the protein. Furthermore, the comparison of the isotopic shifts observed for the various quinone bands in vitro and in vivo
demonstrates that the admixture of C=O and C-C char- acters in these modes is strongly affected by the binding of QA to its anchoring site. Several mechanisms can be considered. Firstly, it is possible that hydrogen bonds themselves modify the coupling between the quinone C-0 and C=C vibrational modes. Because the frequency of the carbonyl modes of ubiquinones and menaquinones in solution are little affected by protic solvents (Bauscher et al., 1990; Bauscher & Mantele, 1992), it seems unlikely that hydrogen bonding per se is the primary cause of the increased coupling of the vibrational modes of the quinones in vivo. Secondly, the direction of the hydrogen bonds themselves might not be coplanar with the quinone ring, thus pulling the C-0 bonds slightly out of the plane of conjugation. Inspection of the X-ray structuresat theQAsiteindeedshows that thedirections of the proposed hydrogen bonds are at an angle with respect to the plane of the quinone ring. Thirdly, the whole electrostatic properties of the quinone-protein complex should be taken into account as localized point charges can polarize some of the bonds, thus altering the coupling of the vibrational modes. Finally, a change in the geometry of the substituents could occur upon binding. Methoxy-substituted quinones are notorious for the dependence of their electron affinity on the dihedral angle defining the position of the O-CH3 bond relative to the aromatic ring plane (Prince et al., 1988; Robinson & Kahn, 1990). In the case of ubiquinones, the two methoxy groups will mold to the steric contours of the QA binding domain, thus altering the atomic partial charge distribution of the system. It should be noted, however, that the frequency of the methoxy groups appears essentially unaffected by the binding, their main absorption band appearing at 1263 cm-l both in vitro and in vivo and downshifting by -28 cm-' upon 13C substitution, as expected from the calculated isotopic shift (Table 1). This suggests that there is no significant distortion of these groups upon binding, although normal-mode calcula- tions are definitely needed to quantitate the dependence of thevibrational frequency on the magnitude of the perturbation. The observations that (i) the frequency of one of the C=O vibrations of QA is strongly downshifted compared to the frequency of both C=O modes in vitro, (ii) the coupling between the C=O and C=C modes is significantly modified compared to the coupling in vitro, while (iii) the methoxy groups do not appear to suffer considerable strain upon binding most probably reflect a protein binding site tuned to its specific function. In this respect, the FTIR data appear consistent with the view of a binding site that induces a geometrical distortion of the neutral quinone toward the transition state to the anion.
The binding free energy of the neutral quinones to the protein at the QA site has been extensively investigated by recon- stituting (&-depleted RCs of Rb. sphaeroides with series of quinones and related compounds (Gunner et al., 1985, 1986; Woodbury et al., 1986; Gunner, 1991; Warncke & Dutton, 1993). Comparison of the binding free energies of 9,lO- anthraquinone and of 9-anthrone, a related compound with only one carbonyl, shows that the loss of a quinone oxygen atom does not significantly influence the strength of the interaction with the site (Gunner et al., 1985). A recent study on Rb. sphaeroides RCs has compared the binding freeenergies to the QA site of 1,Cnaphthoquinone and 1 ,Cdimethylnaph- thalene (Warncke & Dutton, 1993). It was concluded that replacement of both carbonyl oxygens with methyl groups leads to a loss in binding strength of -3.6 kcal.mol-l, while a loss of -2.6 kcal.mol-l was estimated upon replacement of only one of the carbonyl oxygens, leaving the possibility of a weak hydrogen bond to the second carbonyl group of about
4964 Biochemistry, Vol. 33, No. 16, 1994 Breton et al.
similarity of the l 8 0 - l60 difference spectra for vitamin K1 and Q6 in the QA site of Rb. sphaeroides RCs in the anion spectral range (Figures 6b and 8b) suggests that these bonding characteristics are not specific to a particular quinone. The present FTIR results thus are in agreement with ENDOR results on the QA- state of Rb. sphaeroides RCs, which have been interpreted in terms of two strong hydrogen bonds to the quinone carbonyls (Feher et al., 1985).
In conclusion, the picture that emerges from this FTIR study is that QA reduction causes a large change in the bonding interactions between the quinone carbonyls and the protein. In the neutral state of QA, the two bonds are decidedly asymmetrical, with thestronger one probably being responsible for an increased coupling between the C=O and C=C vibrational modes. Upon charge separation and stabilization, a new configuration of the quinone is achieved, in which the two carbonyls are engaged in strong and rather symmetrical bonds. Accompanying the photoreduction of QA, specific microconformational changes of amino acid side chains and/ or of the polypeptide backbone occur, probably in the close vicinity of QA, although electrostatic effects at more distant sites should also be considered. This qualitative study of the geometrical changes occurring at the QA site during pho- toreduction sets the stage for future investigations, of a more quantitative nature, using both normal mode calculations and quinones isotopically labeled at specific positions on the atoms of the ring or of the substituents.
ACKNOWLEDGMENT
-1 kcal-mol-l. The frequency shifts of C=O stretching vibrations have long been related to the energies of hydrogen bonds (Badger & Bauer, 1937). More specifically, Zador- ozhnyi & Ishchenko (1965) have measured this relation for a series of derivatives containing a naphthalene ring and have reported a slope of -4 X molmkcal-l for A U C ~ ~ U C ~ versus the strength of the hydrogen bond in solution. In principle, this relation between the energy of a hydrogen bond and the frequency shift is only valid for isolated vibrations and should not be applied to quinones exhibiting strongly coupled C=O vibrations. In the case of the ubiquinones, where the two C-0 modes are separated by 14 cm-l in vitro, the degree of coupling of these modes is not presently known. It is thus instructive to calculate the hydrogen bond energies under the crude assumption that the quinone modes are mostly uncoupled in vivo and obey the relation described above. A hydrogen bond energyof -3.2 kcal-mol-l is found for the C=O mode at 1628 cm-l of ubiquinones in the QA site of Rb. sphaeroides, assuming it is downshifted with respect to the frequency of the main carbonyl band at 1650 cm-l in vitro. The strong coupling of this C=O mode to C=C vibrations upon binding to the protein will tend to decrease the effect of the hydrogen bond on the downshift of the C=O frequency. Thus, the energy of the hydrogen bond is probably somewhat higher than estimated. Values of -3.2 and -1.5 kcal.mo1-l are obtained for the binding energies of the two C-0 modes of vitamin K1 by comparison with a C=O mode absorbing at 1661 cm-l in vitro. In view of the crudeness of the approximations made here for the hydrogen bond calculations, these values are surprisingly close to those determined from the binding constant studies.
Although the C=Oc and C=O,carbonyls of QA are clearly individualized in the current X-ray structures of Rb. sphaeroi- des RCs (Allen et al., 1988; El-Kabbani et al., 1991), these structures do not allow the unequivocal assignment of which carbonyl oxygen atom is involved in the stronger interaction with the protein binding site. This also is the case for the Rp. uiridisRC structure (Deisenhofer & Michel, 1989), for which distances of 3.05 and 3.13 A are reported between the QA carbonyl oxygens and the peptide N H of Ala M258 and the imidazole N H of His M217, respectively. In contrast to the C=Oc quinone carbonyl, which is also hydrogen bonded to the peptide N H of Ala M260 in all Rb. sphaeroides structures, the hydrogen bond to the C=Om carbonyl cannot be unambiguously localized. This seems to indicate some fuzziness around the latter carbonyl. Thus, it can bespeculated that the backbone N H group of Ala (M258 in Rp. viridis, M260 in Rb. sphaeroides) provides the strong hydrogen bond to the C=O, quinone carbonyl responsible for the strongly downshifted C=O mode observed at 1628 cm-’ in the present study. A confirmation of this tentative assignment, which is of significance for subsequent investigations of the interaction of QA with its binding domain, will have to await higher resolution X-ray structures as well as further FTIR studies on QA-/QA spectra of RCs reconstituted with ubiquinones selectively labeled on position 1 or 4 of the ring, which have been synthesized and are presently investigated (C. Boullais, C. Mioskowski, & J. B., work in progress).
Although the anion vibrations in the QA-/QA spectra are not as well understood as thevibrations of the neutral quinones, especially for ubiquinone-containing RCs, the locations of the anion bands of vitamin K1 in vitro and in vivo demonstrate a considerable shift of the cr?O mode of QA- upon binding to the protein. In addition, the absence of a clear splitting of this C;-;O mode in viuo is indicative of symmetrical bonding of the two carbonyls after photoreduction. The overall
The authors are grateful to Sandra Andrianambinintsoa and Dominique Dejonghe for preparing the quinone-depleted RCs, to Pierre Sebban for his advice in this task, to Danielle Thibodeau for the l80 labeling of Q6, to Jacques Klto for the purification of quinones, to Pierre-Noel Lirsac and Nicolas Gilles for the 13C cultures of E. coli, and to F. Hoffmann-La Roche S. A. and Michael Bauscher for a gift of Q,. We especially wish to acknowledge George Feher for the initial thrust given to this project at the Cadarache I Meeting, Claude Boullais and Charles Mioskowski for stimulating discussions on quinone synthesis and chemistry, Paul Tavan and Marco Nonella for their sustained interest in the problem and their help with normal mode analysis of quinone vibrations, Marylin Gunner for enlightening discussions on electrostatic properties of the RC, and Bill Parson for a critical reading of the manuscript,
REFERENCES
Allen, J. P., Feher, G., Yeates, T. O., Komiya, H., & Rees, D. C. (1988) Proc. Natl. Acad. Sci. U.S.A. 85, 8487-8491.
Badger, R. M., & Bauer, S. H. (1937) J . Chem. Phys. 5,839- 851.
Bagley, K., Abresch, E., Okamura, M. Y., Feher, G., Bauscher, M., Mantele, W., Nabedryk, E., & Breton, J. (1 990) in Current Research in Photosynthesis (Baltscheffsky, M., Ed.) pp 77- 80, Kluwer, Dordrecht.
Bauscher, M., & Mlntele, W. (1992)J. Phys. Chem. 96,11101- 11 108.
Bauscher, M., Nabedryk, E., Bagley, K., Breton, J., & Mantele,
Bauscher, M., Leonhard, M., Moss, D. A., & Mantele, W. (1993a) Biochim. Biophys. Acta 1183, 59-71.
Bauscher, M., Mantele, W., & Dutton, P. L. (1993b) in Fifth International Conference on the Spectroscopy of Biological Molecules (Theophanides, T., Anastassopoulou, J., & Foto- poulos, N., Eds.) pp 319-320, Kluwer, Dordrecht.
Becker, E. D., Ziffer, H., & Charney, E. (1963) Spectrosc. Acta
W. (1990) FEBS Lett. 261, 191-195.
FTIR Difference Spectroscopy of Reaction Center QA Vibrations Biochemistry, Vol. 33, No. 16, 1994 4965
19, 1871-1876. Bellamy, L. J. (1980) in The Infrared Spectra of Complex
Molecules, Methuen, London. Berthomieu, C., Nabedryk, E., Mlntele, W., & Breton, J. (1990)
FEBS Lett. 269, 363-367. Berthomieu, C., Nabedryk, E., Breton, J., & Boussac, A. (1992)
In Research in Photosynthesis (Murata, N., Ed.) Vol. 11, pp 53-56, Kluwer Academic Publishers, The Netherlands.
Breton, J., Thibodeau, D. L., Berthomieu, C., Mantele, W., Verm€glio, A., & Nabedryk, E. (1 99 la) FEBS Lett. 278,257- 260.
Breton, J., Bauscher, M., Berthomieu, C., Thibodeau, D. L., Andrianambinintsoa, S., Dejonghe, D., Mlntele, W., & Nabedryk, E. ( 199 1 b) in Spectroscopy of Biological Molecules (Hester, R. E., & Girling, R. B., Eds.) pp 43-46, The Royal Society of Chemistry, Cambridge.
Breton, J., Berthomieu, C., Thibodeau, D. L., & Nabedryk, E. ( 1 9 9 1 ~ ) FEBS Lett. 288, 109-113.
Breton, J., Burie, J.-R., Berthomieu, C., Thibodeau, D. L., Andrianambinintsoa, S., Dejonghe, D., Berger, G., & Na- bedryk, E. (1992) in The Photosynthetic Bacterial Reaction Center ZZ Structure, Spectroscopy, and Dynamics (Breton, J., & Vermtglio, A., Eds.) pp 155-162, Plenum Press, New York.
Buchanan, S., Michel, H., & Gerwert, K. (1990) in Reaction Centers of Photosynthetic Bacteria (Michel-Beyerle, M.-E., Ed.) pp 75-85, Springer, Berlin.
Buchanan, S., Michel, H., & Gerwert, K. (1992) Biochemistry 31, 1314-1322.
Burie, J.-R., Nonella, M., Nabedryk, E., Tavan, P., & Breton, J. (1993) in Fifth International Conferenceon thespectroscopy of Biological Molecules (Theophanides, T., Anastassopoulou, J., & Fotopoulos, N., Eds.) pp 27-28, Kluwer, Dordrecht.
Chipman, D. M., & Prebenda, M. F. (1986) J. Phys. Chem. 90,
Clayton, R. K., & Wang, R. T. (1971) Methods Enzymol. 23,
Deisenhofer, J., & Michel, H. (1989) EMBO J . 8, 2149-2169. Diner, B. A,, Schenck, C. C., & Vitry, C. de (1984) Biochim.
Biophys. Acta 766, 9-20. El-Kabbani, O., Chang, C.-H., Tiede, D., Norris, J., & Schiffer,
M. (1991) Biochemistry 30, 5361-5369. Ermler, U., Fritzsch, G., Buchanan, S., & Michel, H. (1992) in
Research in Photosynthesis (Murata, N., Ed.) Vol. I, pp 341- 347, Kluwer Academic Publishers, The Netherlands.
Fadini, A., & Schnepel, F.-M. (1989) in Vibrational Spectros- copy: Methods and Applications, John Wiley & Sons, New York.
Feher, G., Isaacson, R. A., Okamura, M. Y., & Lubitz, W. (1985) in Antennas and Reaction Centers of Photosynthetic Bacteria (Michel-Beyerle, M.-E., Ed.) pp 174-189, Springer, Berlin.
Feher, G., Allen, J. P., Okamura, M. Y., & Rees, D. C. (1989) Nature 339, 1 1 1-1 16.
Fischer, M. R., de Groot, H. J. M., Raap, J., Winkel, C., Hoff, A. J., & Lugtenburg, J. (1992) Biochemistry 31,11038-1 1049.
Girlando, A., & Pecile, C. (1979) J . Mol. Spectr. 77, 374-384. Gunner, M. R. (1991) Curr. Top. Bioenerg. 16, 319-367. Gunner, M. R., & Honig, B. (1992) in The Photosynthetic
Bacterial Reaction Center ZZ Structure, Spectroscopy, and Dynamics (Breton, J., & Verm€glio, A., Eds.) pp 403-410, Plenum Press, New York.
Gunner, M. R., Braun, B. S., Bruce, J. M., & Dutton, P. L. (1985) in Antennas and Reaction Centers of Photosynthetic Bacteria (Michel-Beyerle, M.-E., Ed.) pp 298-305, Springer, Berlin.
Gunner, M. R., Robertson, D. E., & Dutton, P. L. (1986) J . Phys. Chem. 90, 3783-3795.
5557-5560.
696-703.
Hienerwadel,R.,Thibodeau, D., Lenz, F.,Nabedryk, E., Breton, J., Kreutz, W., & Mantele, W. (1992a) Biochemistry 31,5799- 5808.
Hienerwadel, R., Nabedryk, E., Paddock, M. L., Rongey, S., Okamura, M. Y., Mantele, W., & Breton, J. (1992b) in Research in Photosynthesis (Murata, N., Ed.) Vol. I, pp 437- 440, Kluwer Academic Publishers, The Netherlands.
Hienerwadel, R., Nabedryk, E., Breton, J., Kreutz, W., & Mlntele, W. (1992~) in The Photosynthetic Bacterial Reaction Center IZ Structure, Spectroscopy, and Dynamics (Breton, J., & Vermkglio, A., Eds.) pp 155-162, Plenum Press, New York.
Hoff, A. J. (1992) Isr. J . Chem. 32, 405-412. Kruk, J., Strzalka, K., & Leblanc, R. M. (1993) Biophys. Chem.
Mantele, W. (1993) in The Photosynthetic Reaction Center (Deisenhofer, J., & Norris, J., Eds.) Vol. 11, pp 239-283, Academic Press, New York.
Mantele, W., Leonhard, M., Bauscher, M., Nabedryk, E., Breton, J., & Moss, D. A. (1990) in Reaction Centersof Photosynthetic Bacteria (Michel-Beyerle, M.-E., Ed.) pp 3 1-44, Springer, Berlin.
McComb, J. C., Stein, R. R., & Wraight, C. A. (1990) Biochim. Biophys. Acta 1015, 156-171.
Meyerson, M. L. (1985) Spectrochim. Acta 41A, 1263-1267. Michel, H., & Deisenhofer, J. (1988) Biochemistry 27, 1-7. Nabedryk, E., Bagley, K. A., Thibodeau, D. L., Bauscher, M.,
Mantele, W., & Breton, J. (1990) FEBS Lett. 266, 59-62. Nabedryk, E., Berthomieu, C., Verm6glio,A., & Breton, J. (1991)
FEBS Lett. 293, 53-58. Nabedryk, E., Breton, J., Hienerwadel, R., Mlntele, W., Paddock,
M. L., Rongey, S. H., Feher, G., & Okamura, M. Y. (1993) Biophys. J. 64, A214.
Nonella, M., & Schulten, K. (1991) J . Phys. Chem. 95, 2059- 2067.
Okamura, M. Y., Isaacson, R. A., & Feher, G. (1975) Proc. Natl. Acad. Sci. U.S.A. 72, 3491-3495.
Pennock, J. F. (1965) in Biochemistry of Quinones (Morton, R. A., Ed.) pp 67-87, Academic Press, New York.
Prince, R. C., Halbert, T. R., & Upton, T. H. (1 988) in Advances in Membrane Biochemistry and Bioenergetics (Kim, C. H., Tedeschi, H., Diwan, J. J., & Salerno, J. C., Eds.) pp 469-478, Plenum Press, New York.
Robinson, H. H., & Kahn, S. D. J. (1990) J . Am. Chem. SOC.
Thibodeau, D. L., Breton, J., Hienerwadel, R., Lenz, F., Mlntele, W., & Nabedryk, E. (1990a) in Reaction Centers of Photo- synthetic Bacteria (Michel-Beyerle, M.-E., Ed.) pp 87-98, Springer, Berlin.
Thibodeau, D. L., Nabedryk, E., Hienerwadel, R., Lenz, F., Mantele, W., & Breton, J. (1990b) Biochim. Biophys. Acta
Thibodeau, D. L., Nabedryk, E., Hienerwadel, R., Lenz, F., Mantele, W., & Breton, J. (1992) in Time-resolved Vibrational Spectroscopy V (Takahashi, H., Ed.) pp 79-82, Springer, Berlin.
van Liemt, W. B. S., Boender, G. J., Gast, P., Hoff, A. J., Lugtenburg, J., & de Groot, H. J. M. (1993) Photochem. Photobiol. 57, 32s.
Venyaminov, S. Yu, & Kalnin, N. N. (1990) Biopolymers 30,
Warncke, K., & Dutton, P. L. (1993) Proc. Natl. Acad. Sci. U.S.A. 90, 2920-2924.
Woodbury, N. W. T., Parson, W. W., Gunner, M. R., Prince, R. C., & Dutton, P. L. (1986) Biochim. Biophys. Acta851,6-22.
Zadorozhnyi, B. A., & Ishchenko, I. K. (1965) Opt. Spectrosc. (Engl. Transl.) 19, 306-308.
45, 235-244.
I 12, 4728-473 1 .
1020, 253-259.
1259-1271.