Embed Size (px)
Citation preview
EPOC 2014 Conference
1
The BIM Utopia: Centralizing Collaboration and Communication through Technologies
Zoubeir Azouz1, Constantine J. Katsanis2*,Daniel Forgues2,
Gulnaz Aksenova1, Erik Poirier1,Sylvie Doré2 ABSTRACT The aim of this paper is to challenge the BIM (Building Information Modeling) utopia. In fact, it boldly argues that the implementation of BIM related technologies without questioning the underlying Architecture Engineering Construction industry (AEC) business model will not decrease, but rather, increase the number of lines of communication and their ensuing complexity. This exploratory research is the first stage of a longitudinal study that analyzes the integration of a client organization using BIM technologies (since 2003) in order to streamline its production and management of information for project delivery. The study’s methodological approach is based on the adoption of Social Network Analysis (SNA) as a way for mapping the interactions amongst the various departments in a large public organization responsible for the construction of large utilities infrastructure. While the BIM platform used in this organization appears to offer a communication platform for some users, it seems to have created barriers to information for others within the same organization. The BIM has not demonstrated that is a panacea tailored to all the AEC industry stakeholders. As hierarchical levels and functions vary, so does the need and expertise for the tools available through BIM. The spectrum of the complexity of the tools it offers may cater to some functions found in the organization, but may be a hindrance for those involved in higher level managerial functions. Traditional communication methods remain predominant for multi-disciplinary collaborators in spite of the fact that the BIM platform aspires to be the prominent core communication platform. KEYWORDS: AEC industry, BIM platform, SNA, Network organization, Management. 1. INTRODUCTION The nature and structure of the Architecture, Engineering and Construction (AEC) industry network organization gives rise to communication problems amongst the team members of the participating organizations or departments. Key amongst these issues is the poorly managed information flow (considered to be one of the major causes of the industry’s lack of productivity), poor process predictability, and poor end product quality. The modeling communications in the
1 Doctoral Student, École de technologie supérieure, Université du Québec, Montréal, Canada 2 Professor, École de technologie supérieure, Université du Québec, Montréal, Canada *Corresponding Author: [email protected]
EPOC 2014 Conference
2
AEC industry using traditional methods of communication (conversations, meetings, telephone, email and video conference) results in a high number of communication links arising from the information interdependency amongst the firms and disciplines engaged in the project. The result is a tangled web of links of heavy complexity, which is much too difficult to manage in an effective and efficient manner. The current literature presents BIM (Building Information Modeling) related technologies and processes as the ideal solution for poor information management processes within the construction project network. There appears to be a tendency to depict BIM based models and related technologies that all too easily eliminate this information conundrum by: 1) centralizing and managing neatly the huge and complex information flow; 2) eliminating repetition, and 3) avoiding redundancies without loss or alteration of project information by the collaborating members when using and sharing a BIM platform. Is BIM truly the panacea it is purported to be? Do these models actually represent an attainable reality, or is BIM merely a utopia? This exploratory research contributes to a better understanding of the issues relating to information flow management when using centralized platforms. It will enable us to demonstrate the degree of usefulness and practicality of BIM as a central node of information sharing and exchange. The mapping of relationships will assess the reliance placed by team members on information from an identifiable source of their choice vs. one generic medium information provided by the platform. The strengths and weaknesses of BIM will be considered in the context of this study and recommendations will be proposed for the transformation of the extant AEC business model. This will better address the integration of BIM in a fashion that provides enhanced solutions to issues of collaboration and exchange of information. 2. LITERATURE REVIEW Information processing within the AEC industry: from BIM euphoria to BIM utopia The AEC industry organized around specialized practices, is characterized by its notorious complexity and fragmented culture and slow to adopt change and remains quite conservative (Kiviniemi and Fischer, 2009). Multiple stakeholders are involved at different stages of a project, and deliver multiple pieces of information across the project network. These temporary project networks are seen as continuously changing and evolving, and the properties of these networks and the relations between actors are continuously transformed (Linderoth, 2010). This results in multiple issues around collaboration, which has been identified as one of the main factors for the low productivity and ineffectiveness of the construction industry (Kerosuo, Mäki, Codinhoto, Koskela and Miettinen, 2012). Consequently, there are problems in finding effective means for communication and coordination of activities to support collaboration in the AEC industry that are seen as essential for project realization (Hensel, Menges and Weinstock, 2006; Kocaturk, 2013). The problem lies in the cycle of data distribution, which is repetitive; it consists of multiple cycles of creation, storing, manipulation and revision. Indeed, information is usually
EPOC 2014 Conference
3
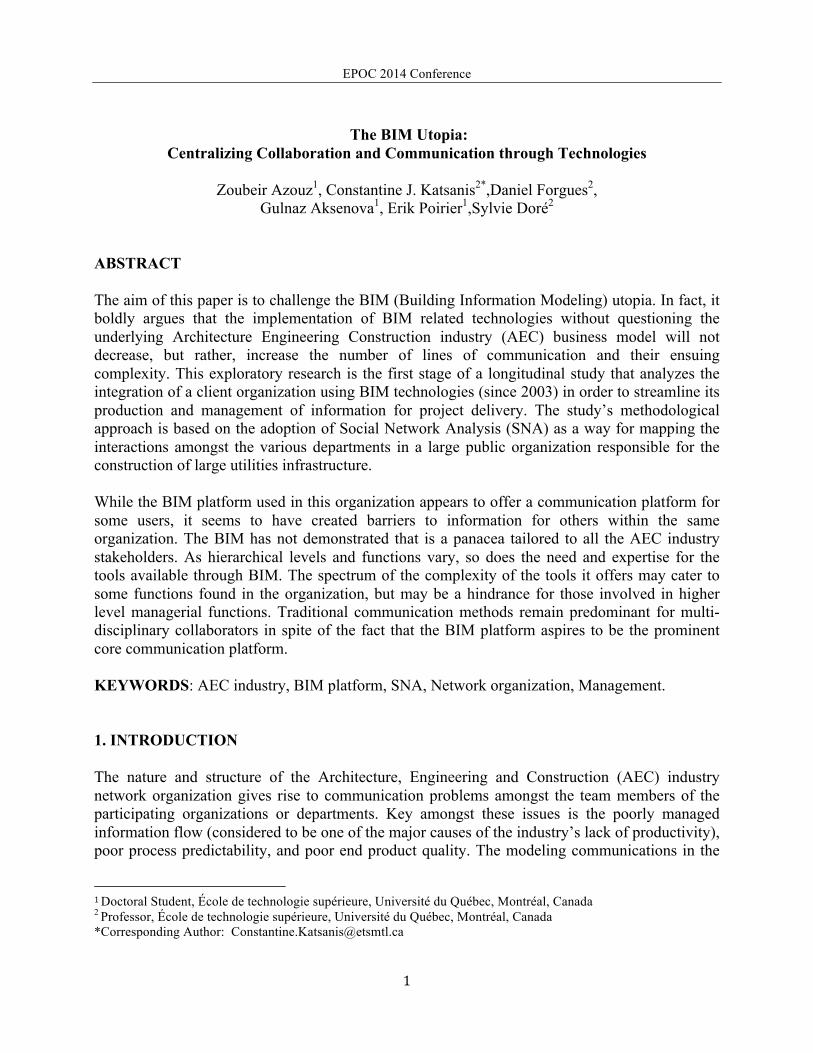
poorly coordinated, fragmented and distributed throughout a project network. In fact, inaccessibility of information within a temporary project network is one the limitation of traditional information management (Fischer and Kunz, 2004). As a result, attempts at defining, formalizing and integrating construction information have been at the forefront of research efforts in the field of information technologies in the AEC industry for the past three decades (e.g. Björk, 1992). Building Information Modeling (BIM) is seen by many as the culmination of these efforts (Crotty, 2011). Among its many publicized benefits, BIM is seen to reduce the loss of information assets across a facility’s lifecycle, is the result of traditional paper-based information exchanges (Eastman et al., 2011). In other words, BIM allows users to be more efficient in their information exchanges through its centralization. The development of BIM has been intended to eliminate chaotic information flow by proposing the model shown in Figure 1 (Dubler et al., 2010). In light of this, the management of information is becoming a central theme related to the emergence of BIM (Froese, 2006). Therefore, issues surrounding how information is captured, exchanged visualized and retrieved are at the core of many research endeavors (Nepal et al., 2012; Redmond et al., 2012; Singh, Gu and Wang, 2011; Wu and Hsieh, 2012).
Figure 1. Centralizing Information (adapted from Turk (2001). The shift toward formal integration of information through BIM requires a substantial redefinition of practice and the elimination of entrenched ideals in order to be effectively and efficiently achieved (Forgues and Iordanova, 2010). The issues that arise when transitioning to an integrated setting are deeply embedded in the AEC industry’s fragmented approach to project management (Forgues and Koskela, 2009). For instance, the social and organizational implications of the temporary project network (which is collaborating, sharing, collating and integrating information to grasp the project) are not addressed by the transition to BIM. BIM does not take into account how the team organizes itself as well as the individual cognitive factors related to each team member (Emmitt, 2010). There is a growing need to understand individual
EPOC 2014 Conference
4
needs and how individuals communicate across temporary project organizations (Emmitt and Gorse, 2009). Therefore, when investigating information exchanges through BIM, many issues arise, namely develop a common language to foster understanding to facilitate exchange (Mutis and Issa, 2012). This is a fundamental issue in how different actors construe meaning and develop understanding (Miranda and Saunders, 2003) that goes beyond BIM. For instance, a large part of the coordination and planning on a project occurred primarily in the engineers' heads and was not supported by IT, as their decisions are based primarily on human and personal interpretations of information. (Fischer and Kunz, 2004) Different tasks require different types of information and different skills to interpret and act upon. Therefore, specific types of information are not useful for everyone. In this respect, the notion of disciplinary views has been developed, in which specific views filter information available depending on the person attempting to retrieve the information (Sacks et al., 2010; Froese, 2010). As of yet, however, no single super schema to structure all project related data and information has been developed that would allow the seamless integration of all this information (Redmond et al., 2012). Technological interoperability issues are abundant that seriously hinder this integration (Laakso and Kiviniemi, 2012). Indeed, the issue of technological interoperability is seen as one of the most important challenges that hinder the full implementation of BIM (Bernstein, 2012). Whether due to a lack of standards (e.g. Eastman et al., 2011) or the proprietary nature of CAD software (Nour, 2009), low technological interoperability may translate to wasteful activities, as well as hinder value creation due to the loss of data and incompatibility (Gallaher et al., 2004). The tools used are not always appropriate for the task as diverse digital and traditional media are used in the AEC industry to visualize ideas, capture knowledge and make decisions. Each tool has the distinct potential to perform specific tasks that happen at different stages of a project. For example, architects use various media to support creative thinking during early stages of design. Certain technologies are also used for energy simulation and analysis, which supports the decision-making process. Building Information Models are shared across different design media and applications for different purposes (Kiviniemi and Fischer, 2009), and the BIM approach to practice appears incompatible with design thinking (Deamer and Bernstein, 2011) and does not capture informal communication well. In fact, it does not support the full extent of communication flows within the project network (Emmitt, 2010). Current BIM technologies are appropriate for storing, displaying and exchanging explicit knowledge; however, they do not support design choices such as the logic behind the building form or the building’s orientation on the site. Further, BIM has limited capabilities to support the tacit knowledge of how a building is built (Dossick and Neff, 2011). Dossick and Neff (2011) argued that BIM fosters formal and passive communication and leaves little room for interpretation of digital information; whereas messy talk (tacit knowledge exchange) brings innovative connections together to support
EPOC 2014 Conference
5
collaborative problem-solving. Messy talk (Suwa, Gero and Purcell, 2000) is believed to make inter-organizational communication more effective. Therefore, the sole reliance on BIM technologies limits the capabilities supporting informal communication and dialogue that are required to discover solutions and knowledge during decision-making activities. However, BIM is seen as a tool to support and deepen collaborative activities (Miettinen and Paavola, 2014). Some studies suggest that the traditional ways of collaboration between disciplines prevailing in the use of BIM and are in contradiction with ways demanded by BIM. This contradiction limits the benefits of BIM (Kerosuo, Reijo, and Tarja, 2012). For example, Kocaturk (2013) states that implementation of BIM ''does not guarantee the achievement of a fully integrated design and project delivery, if the teams still follow a traditional workflow''. Kerosuo et al., (2013) argues that while BIM is anticipated to support collaboration across organizational boundaries and to decrease the need for other forms of interaction, it requires more intensive collaborative activities among actors and a re-delegation of new roles and responsibilities; requires a reorganization of activities. However, professionals have a tendency to implement novel technologies according to their traditional workflow (Miettinen, Kerosuo, Korpela, Mäki and Paavola, 2012). Lastly, BIM is conceptualized as an unbounded innovation, i.e., an innovation, which must be properly implemented across organizational boundaries to be fully effective (Harty, 2005). As the number of tools that support communication and information exchanges increases, so do users and managers need to develop their skills for the collective use of these tools (Otter, 2005). These issues point towards a disconnect between the notion of BIM as a panacea aimed at solving the construction industry’s woes and the actual state of BIM as a complex and incomplete process. This is far from its stated goal of offering a single venue for the generation, development, capture, exchange, distribution, communication, visualization and management of facility information. The application of SNA in engineering project organizations has been gaining followers in the research community (Chinowsky and Taylor, 2012 and Chinowsky et al., 2010). Network organization theorists have identified how network attributes, and how the location of an individual in a network may affect the individual’s ability to leverage his knowledge, power and influence in his relations with others (Noria and Eccles, 1992). Furthermore, emphasis is placed on the relationship amongst individuals as a key factor in network success. With that in mind the study attempts to gain insight in the relationships that prevail in the organization under consideration. This research aims to explore some of the issues by studying the use of BIM in practice.
EPOC 2014 Conference
6
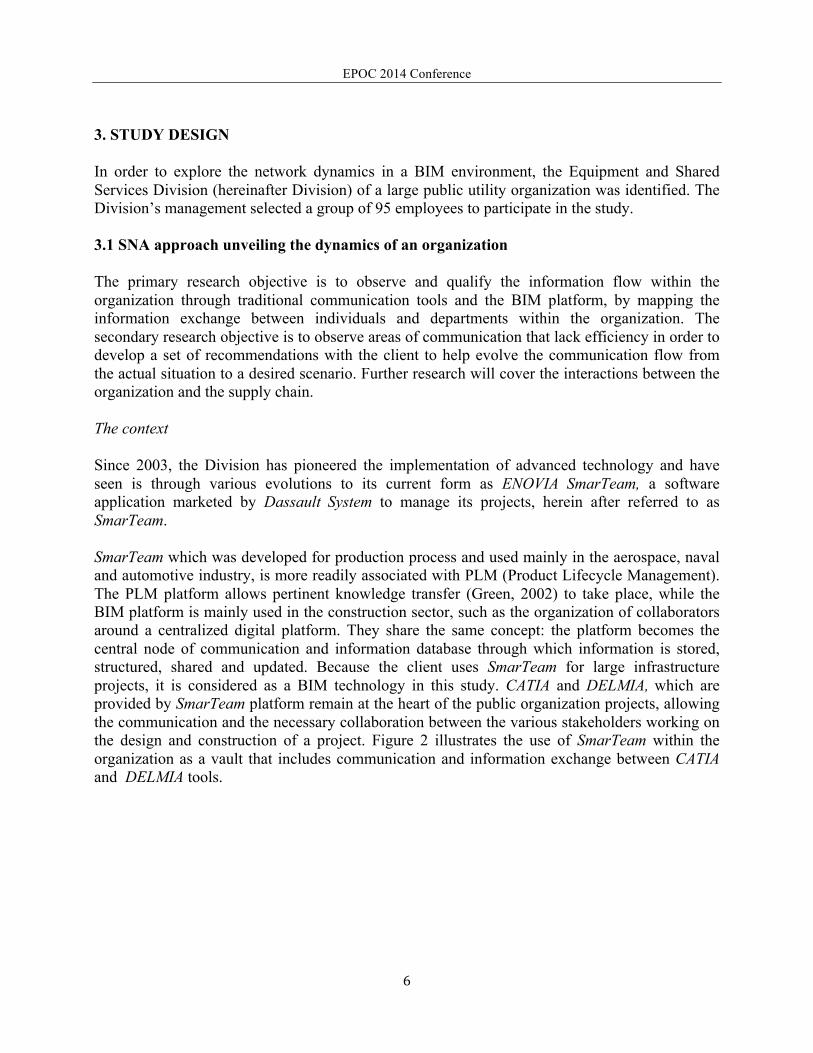
3. STUDY DESIGN In order to explore the network dynamics in a BIM environment, the Equipment and Shared Services Division (hereinafter Division) of a large public utility organization was identified. The Division’s management selected a group of 95 employees to participate in the study. 3.1 SNA approach unveiling the dynamics of an organization The primary research objective is to observe and qualify the information flow within the organization through traditional communication tools and the BIM platform, by mapping the information exchange between individuals and departments within the organization. The secondary research objective is to observe areas of communication that lack efficiency in order to develop a set of recommendations with the client to help evolve the communication flow from the actual situation to a desired scenario. Further research will cover the interactions between the organization and the supply chain. The context Since 2003, the Division has pioneered the implementation of advanced technology and have seen is through various evolutions to its current form as ENOVIA SmarTeam, a software application marketed by Dassault System to manage its projects, herein after referred to as SmarTeam. SmarTeam which was developed for production process and used mainly in the aerospace, naval and automotive industry, is more readily associated with PLM (Product Lifecycle Management). The PLM platform allows pertinent knowledge transfer (Green, 2002) to take place, while the BIM platform is mainly used in the construction sector, such as the organization of collaborators around a centralized digital platform. They share the same concept: the platform becomes the central node of communication and information database through which information is stored, structured, shared and updated. Because the client uses SmarTeam for large infrastructure projects, it is considered as a BIM technology in this study. CATIA and DELMIA, which are provided by SmarTeam platform remain at the heart of the public organization projects, allowing the communication and the necessary collaboration between the various stakeholders working on the design and construction of a project. Figure 2 illustrates the use of SmarTeam within the organization as a vault that includes communication and information exchange between CATIA and DELMIA tools.
EPOC 2014 Conference
7
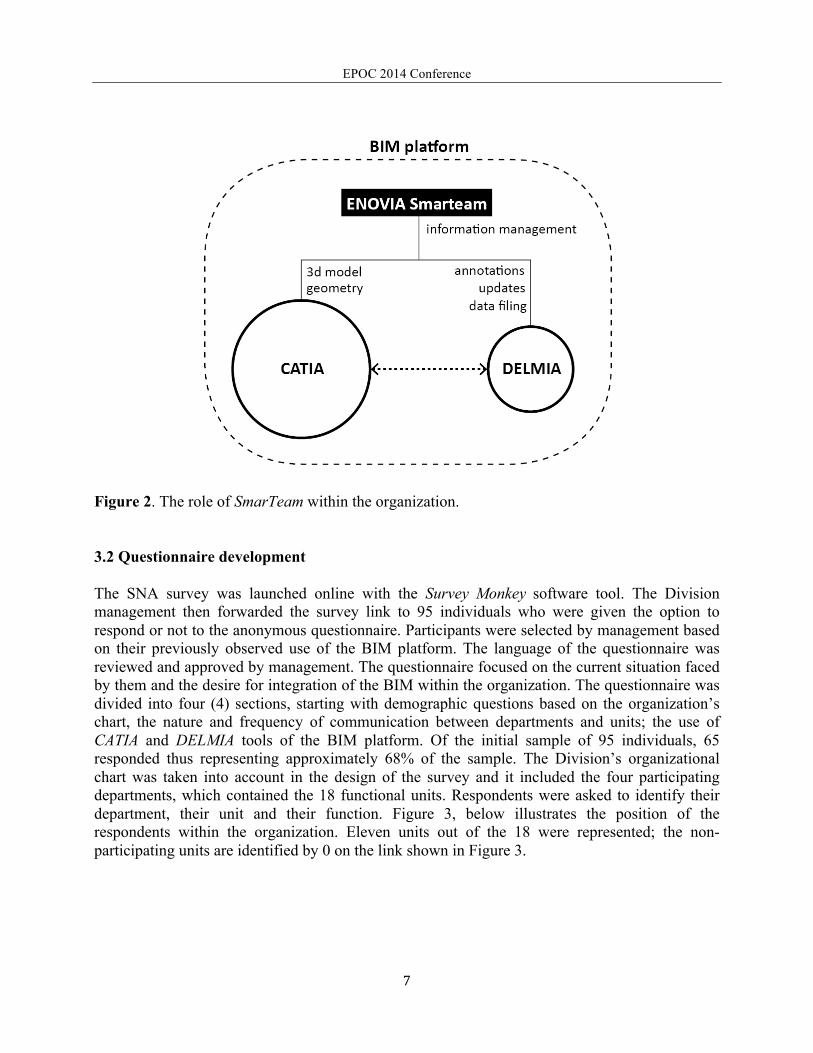
Figure 2. The role of SmarTeam within the organization. 3.2 Questionnaire development The SNA survey was launched online with the Survey Monkey software tool. The Division management then forwarded the survey link to 95 individuals who were given the option to respond or not to the anonymous questionnaire. Participants were selected by management based on their previously observed use of the BIM platform. The language of the questionnaire was reviewed and approved by management. The questionnaire focused on the current situation faced by them and the desire for integration of the BIM within the organization. The questionnaire was divided into four (4) sections, starting with demographic questions based on the organization’s chart, the nature and frequency of communication between departments and units; the use of CATIA and DELMIA tools of the BIM platform. Of the initial sample of 95 individuals, 65 responded thus representing approximately 68% of the sample. The Division’s organizational chart was taken into account in the design of the survey and it included the four participating departments, which contained the 18 functional units. Respondents were asked to identify their department, their unit and their function. Figure 3, below illustrates the position of the respondents within the organization. Eleven units out of the 18 were represented; the non-participating units are identified by 0 on the link shown in Figure 3.
EPOC 2014 Conference
8
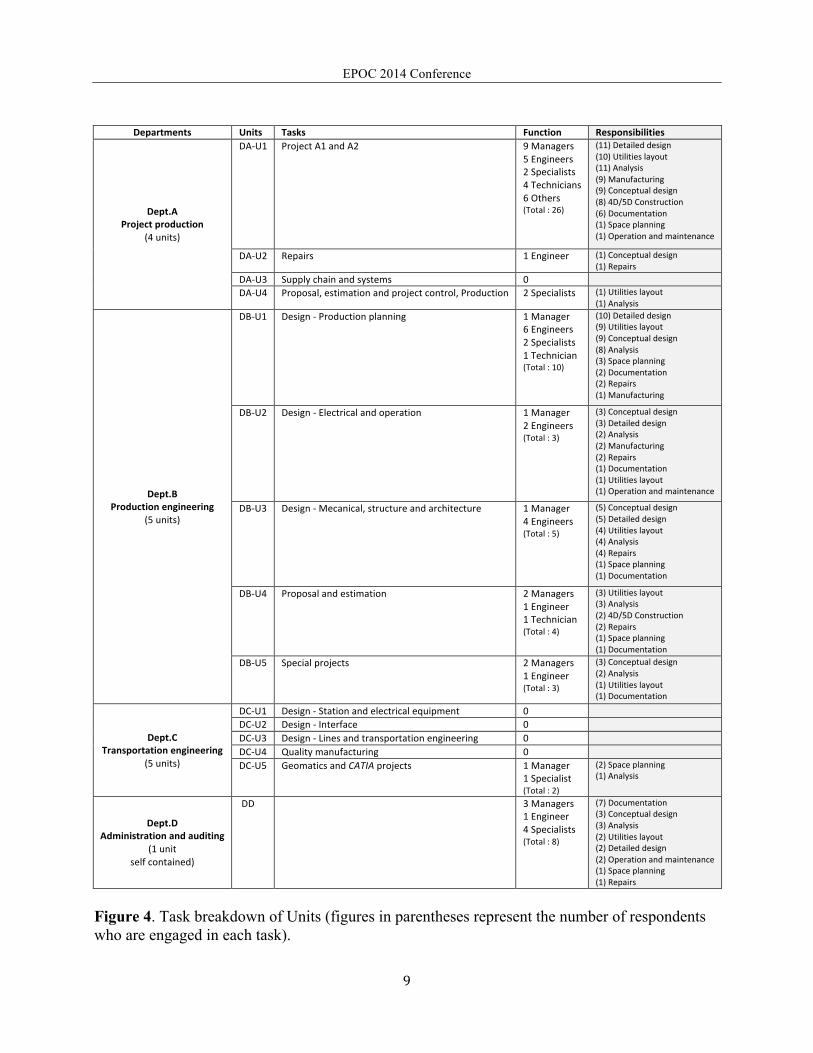
Figure 3. Sample composition based on the Division’s organizational chart (numbers within the figure represent the number of respondents for their respective units). Of the 65 respondents, 32% are Engineers, 31% are Managers, 18% are Specialists, 9% are Technicians and 9 % responded 'other', which includes designers and assistants. None of the participants has identified himself as an architect, so this survey is not representative of this segment of the organization. Figure 4, shows the different responsibilities of each unit; with the number of respondents indicated next to each activity. The 65 respondents’ work time allocation for various tasks were as follows: mainly analysis (52%); definition of the concept (50%); utilities layout (48%); detailed design (47%); 16% of respondents were responsible for Construction 4D and 5D; 14% for spatial planning, and 6% for operation and maintenance.
EPOC 2014 Conference
9
Departments Units Tasks Function Responsibilities
Dept.A Project production
(4 units)
DA-‐U1 Project A1 and A2 9 Managers 5 Engineers 2 Specialists 4 Technicians 6 Others (Total : 26)
(11) Detailed design (10) Utilities layout (11) Analysis (9) Manufacturing (9) Conceptual design (8) 4D/5D Construction (6) Documentation (1) Space planning (1) Operation and maintenance
DA-‐U2 Repairs 1 Engineer (1) Conceptual design (1) Repairs
DA-‐U3 Supply chain and systems 0
DA-‐U4 Proposal, estimation and project control, Production 2 Specialists (1) Utilities layout (1) Analysis
Dept.B Production engineering
(5 units)
DB-‐U1 Design -‐ Production planning 1 Manager 6 Engineers 2 Specialists 1 Technician (Total : 10)
(10) Detailed design (9) Utilities layout (9) Conceptual design (8) Analysis (3) Space planning (2) Documentation (2) Repairs (1) Manufacturing
DB-‐U2 Design -‐ Electrical and operation 1 Manager 2 Engineers (Total : 3)
(3) Conceptual design (3) Detailed design (2) Analysis (2) Manufacturing (2) Repairs (1) Documentation (1) Utilities layout (1) Operation and maintenance
DB-‐U3 Design -‐ Mecanical, structure and architecture 1 Manager 4 Engineers (Total : 5)
(5) Conceptual design (5) Detailed design (4) Utilities layout (4) Analysis (4) Repairs (1) Space planning (1) Documentation
DB-‐U4 Proposal and estimation 2 Managers 1 Engineer 1 Technician (Total : 4)
(3) Utilities layout (3) Analysis (2) 4D/5D Construction (2) Repairs (1) Space planning (1) Documentation
DB-‐U5 Special projects 2 Managers 1 Engineer (Total : 3)
(3) Conceptual design (2) Analysis (1) Utilities layout (1) Documentation
Dept.C Transportation engineering
(5 units)
DC-‐U1 Design -‐ Station and electrical equipment 0
DC-‐U2 Design -‐ Interface 0
DC-‐U3 Design -‐ Lines and transportation engineering 0
DC-‐U4 Quality manufacturing 0
DC-‐U5 Geomatics and CATIA projects 1 Manager 1 Specialist (Total : 2)
(2) Space planning (1) Analysis
Dept.D Administration and auditing
(1 unit self contained)
DD 3 Managers 1 Engineer 4 Specialists (Total : 8)
(7) Documentation (3) Conceptual design (3) Analysis (2) Utilities layout (2) Detailed design (2) Operation and maintenance (1) Space planning (1) Repairs
Figure 4. Task breakdown of Units (figures in parentheses represent the number of respondents who are engaged in each task).
EPOC 2014 Conference
10
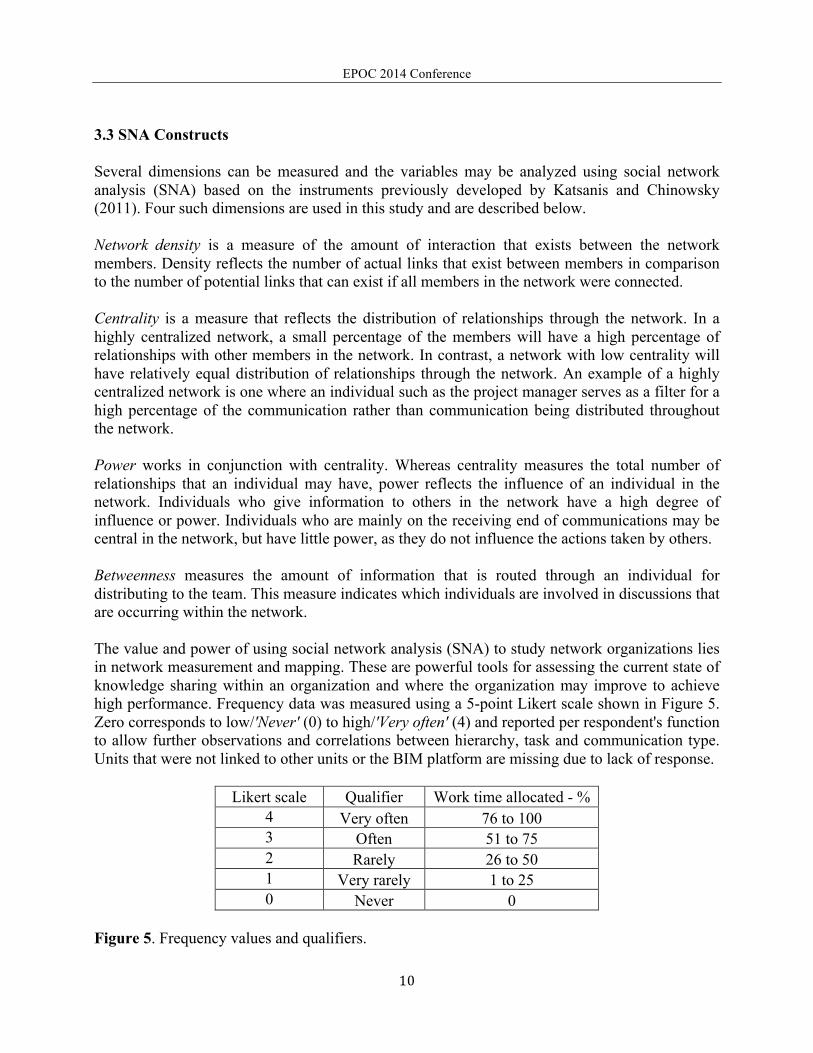
3.3 SNA Constructs Several dimensions can be measured and the variables may be analyzed using social network analysis (SNA) based on the instruments previously developed by Katsanis and Chinowsky (2011). Four such dimensions are used in this study and are described below. Network density is a measure of the amount of interaction that exists between the network members. Density reflects the number of actual links that exist between members in comparison to the number of potential links that can exist if all members in the network were connected. Centrality is a measure that reflects the distribution of relationships through the network. In a highly centralized network, a small percentage of the members will have a high percentage of relationships with other members in the network. In contrast, a network with low centrality will have relatively equal distribution of relationships through the network. An example of a highly centralized network is one where an individual such as the project manager serves as a filter for a high percentage of the communication rather than communication being distributed throughout the network. Power works in conjunction with centrality. Whereas centrality measures the total number of relationships that an individual may have, power reflects the influence of an individual in the network. Individuals who give information to others in the network have a high degree of influence or power. Individuals who are mainly on the receiving end of communications may be central in the network, but have little power, as they do not influence the actions taken by others. Betweenness measures the amount of information that is routed through an individual for distributing to the team. This measure indicates which individuals are involved in discussions that are occurring within the network. The value and power of using social network analysis (SNA) to study network organizations lies in network measurement and mapping. These are powerful tools for assessing the current state of knowledge sharing within an organization and where the organization may improve to achieve high performance. Frequency data was measured using a 5-point Likert scale shown in Figure 5. Zero corresponds to low/'Never' (0) to high/'Very often' (4) and reported per respondent's function to allow further observations and correlations between hierarchy, task and communication type. Units that were not linked to other units or the BIM platform are missing due to lack of response.
Likert scale Qualifier Work time allocated - %
4 Very often 76 to 100 3 Often 51 to 75 2 Rarely 26 to 50 1 Very rarely 1 to 25 0 Never 0
Figure 5. Frequency values and qualifiers.
EPOC 2014 Conference
11
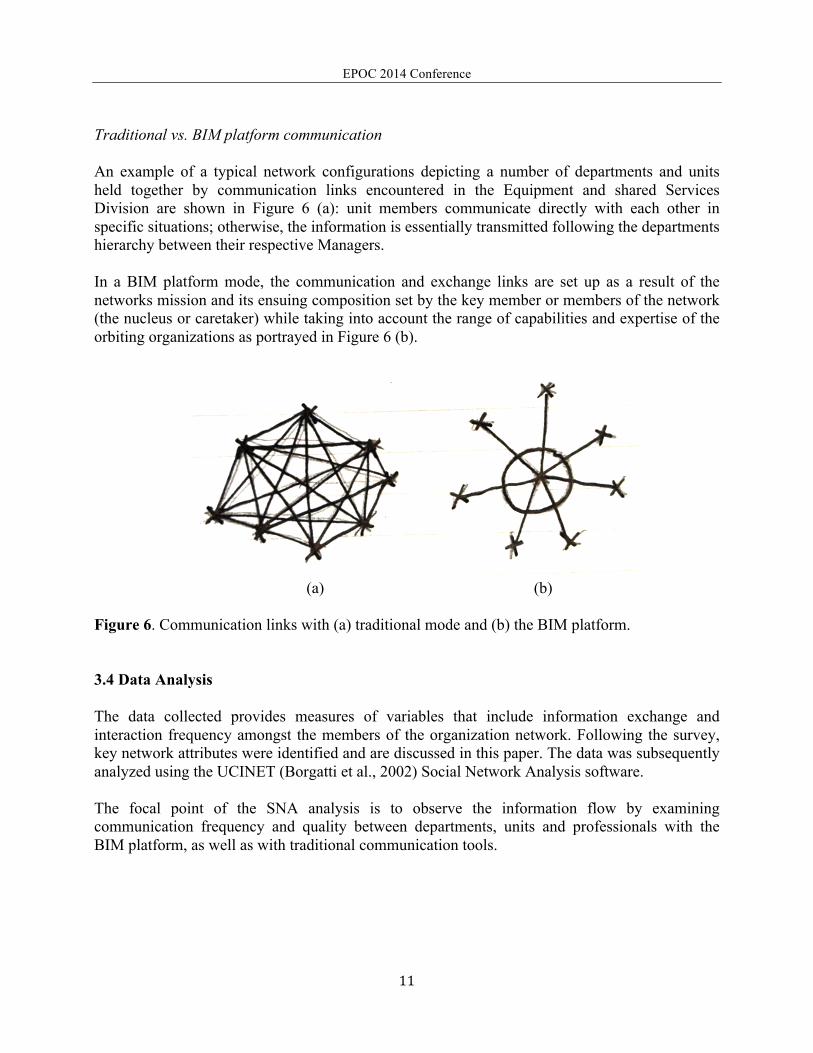
Traditional vs. BIM platform communication An example of a typical network configurations depicting a number of departments and units held together by communication links encountered in the Equipment and shared Services Division are shown in Figure 6 (a): unit members communicate directly with each other in specific situations; otherwise, the information is essentially transmitted following the departments hierarchy between their respective Managers. In a BIM platform mode, the communication and exchange links are set up as a result of the networks mission and its ensuing composition set by the key member or members of the network (the nucleus or caretaker) while taking into account the range of capabilities and expertise of the orbiting organizations as portrayed in Figure 6 (b).
(a) (b) Figure 6. Communication links with (a) traditional mode and (b) the BIM platform. 3.4 Data Analysis The data collected provides measures of variables that include information exchange and interaction frequency amongst the members of the organization network. Following the survey, key network attributes were identified and are discussed in this paper. The data was subsequently analyzed using the UCINET (Borgatti et al., 2002) Social Network Analysis software. The focal point of the SNA analysis is to observe the information flow by examining communication frequency and quality between departments, units and professionals with the BIM platform, as well as with traditional communication tools.
EPOC 2014 Conference
12
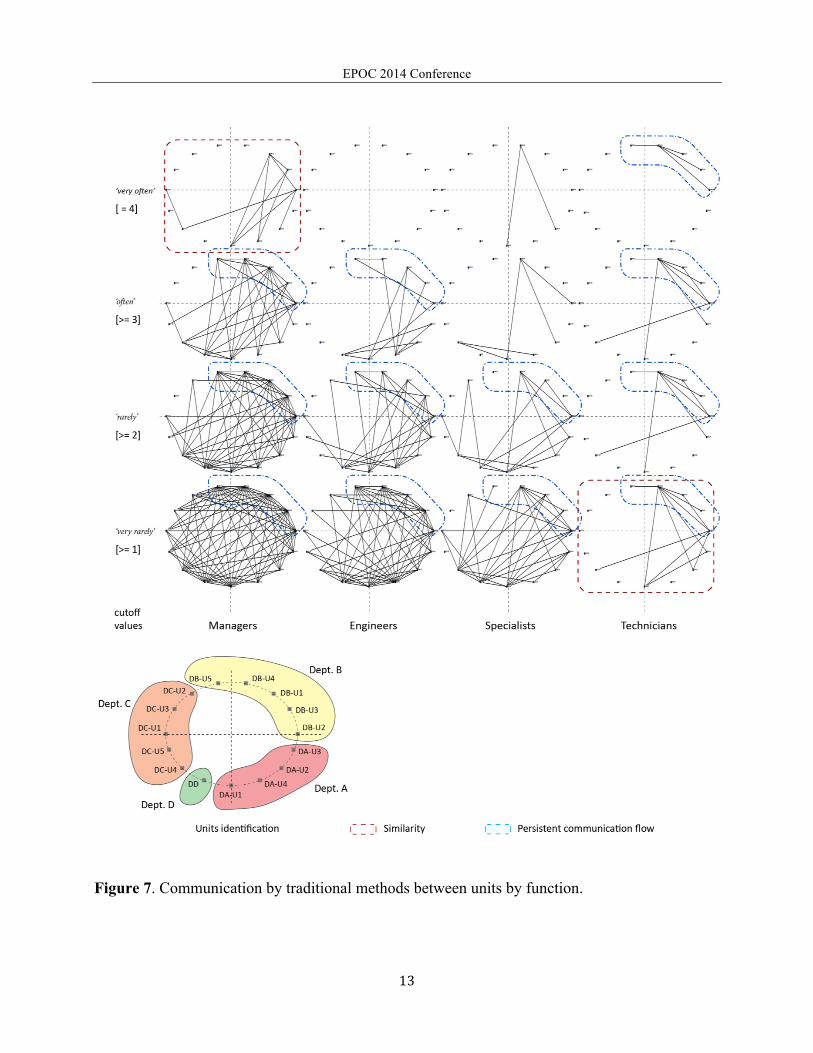
4. NETWORKS INTERACTIONS: FINDINGS The organization’s communication structure was mapped in terms of its frequency of interaction between traditional communication tools and the BIM platform. First, traditional communications data gathered from the survey are analyzed, reported and illustrated by unit and respondent's function. Then, interactions through the BIM platform in terms of frequency are mapped in the same manner. Lastly, the findings suggest the type of communication currently used within the organization. 4.1 Traditional communication frequency between functional units The links connect nodes by frequency of each unit to its counterpart. Figure 7 illustrates the communication density of each respondent's function within the organization. The communication density described in Figure 8 is ranked based on communication frequency (from most frequent to less frequent). The density in the Managers’ network was 54% for very rarely, and communication continues to very often level albeit at weak density of 5%. When examining the network of engineers, a generally weaker density is observed and the communication level only reaches the often level with a density of approximately 10%. For the Specialists, there is a further decrease in density with 26% at the very rarely level, and movement to the progressive decline to 11% at the rarely level with the communication declining for negligible numbers for often and very often. The network graphs for Technicians show very weak densities that range from 7% to 2%.
EPOC 2014 Conference
13
Figure 7. Communication by traditional methods between units by function.
EPOC 2014 Conference
14
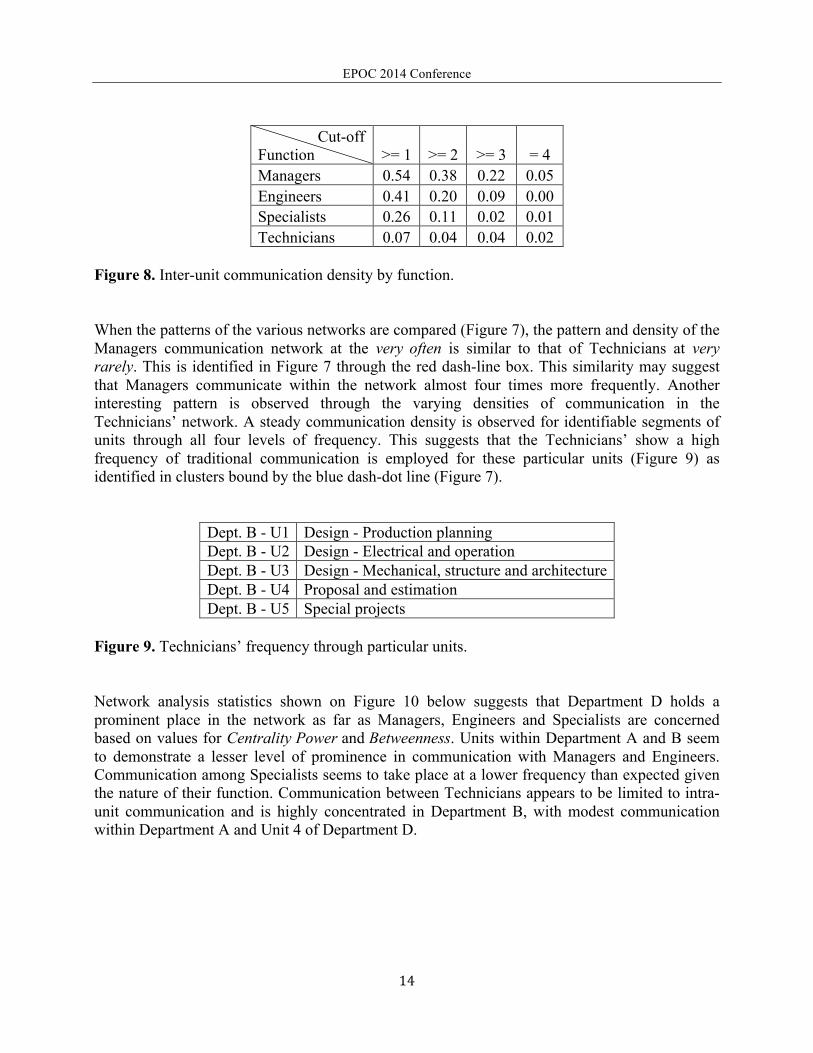
Cut-off Function >= 1 >= 2 >= 3 = 4 Managers 0.54 0.38 0.22 0.05 Engineers 0.41 0.20 0.09 0.00 Specialists 0.26 0.11 0.02 0.01 Technicians 0.07 0.04 0.04 0.02
Figure 8. Inter-unit communication density by function. When the patterns of the various networks are compared (Figure 7), the pattern and density of the Managers communication network at the very often is similar to that of Technicians at very rarely. This is identified in Figure 7 through the red dash-line box. This similarity may suggest that Managers communicate within the network almost four times more frequently. Another interesting pattern is observed through the varying densities of communication in the Technicians’ network. A steady communication density is observed for identifiable segments of units through all four levels of frequency. This suggests that the Technicians’ show a high frequency of traditional communication is employed for these particular units (Figure 9) as identified in clusters bound by the blue dash-dot line (Figure 7).
Dept. B - U1 Design - Production planning Dept. B - U2 Design - Electrical and operation Dept. B - U3 Design - Mechanical, structure and architecture Dept. B - U4 Proposal and estimation Dept. B - U5 Special projects
Figure 9. Technicians’ frequency through particular units.
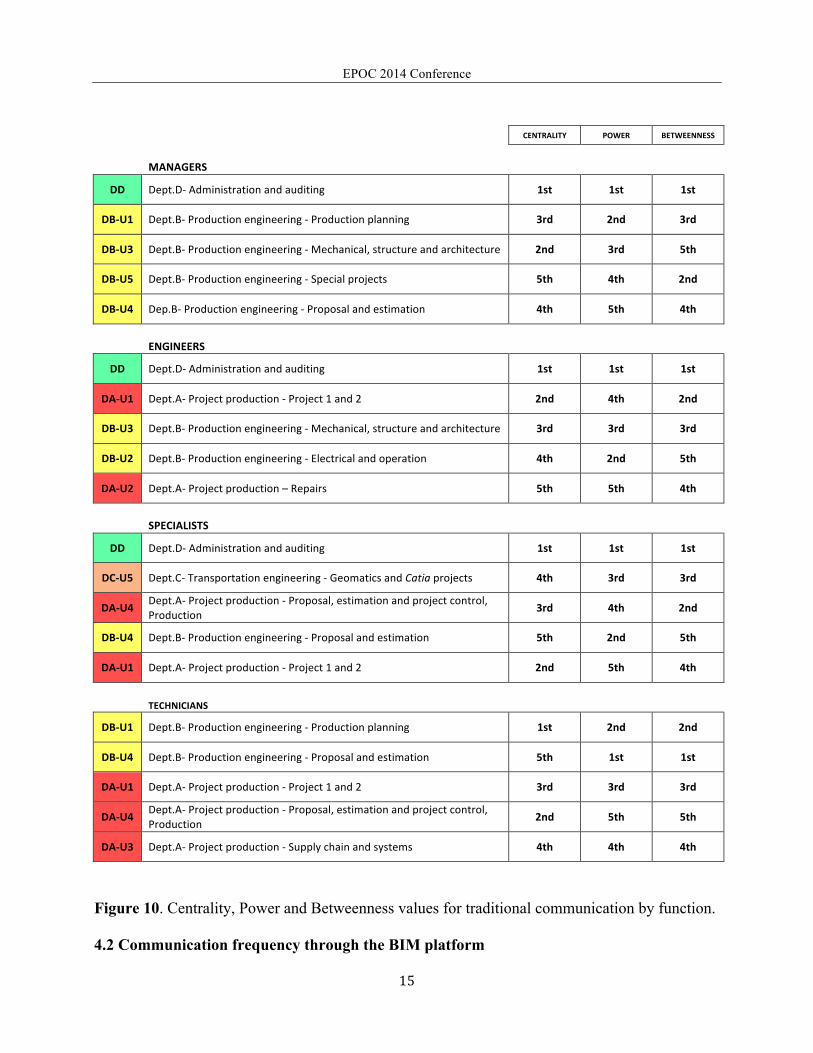
Network analysis statistics shown on Figure 10 below suggests that Department D holds a prominent place in the network as far as Managers, Engineers and Specialists are concerned based on values for Centrality Power and Betweenness. Units within Department A and B seem to demonstrate a lesser level of prominence in communication with Managers and Engineers. Communication among Specialists seems to take place at a lower frequency than expected given the nature of their function. Communication between Technicians appears to be limited to intra-unit communication and is highly concentrated in Department B, with modest communication within Department A and Unit 4 of Department D.
EPOC 2014 Conference
15
CENTRALITY POWER BETWEENNESS
MANAGERS
DD Dept.D-‐ Administration and auditing 1st 1st 1st
DB-‐U1 Dept.B-‐ Production engineering -‐ Production planning 3rd 2nd 3rd
DB-‐U3 Dept.B-‐ Production engineering -‐ Mechanical, structure and architecture 2nd 3rd 5th
DB-‐U5 Dept.B-‐ Production engineering -‐ Special projects 5th 4th 2nd
DB-‐U4 Dep.B-‐ Production engineering -‐ Proposal and estimation 4th 5th 4th
ENGINEERS
DD Dept.D-‐ Administration and auditing 1st 1st 1st
DA-‐U1 Dept.A-‐ Project production -‐ Project 1 and 2 2nd 4th 2nd
DB-‐U3 Dept.B-‐ Production engineering -‐ Mechanical, structure and architecture 3rd 3rd 3rd
DB-‐U2 Dept.B-‐ Production engineering -‐ Electrical and operation 4th 2nd 5th
DA-‐U2 Dept.A-‐ Project production – Repairs 5th 5th 4th
SPECIALISTS
DD Dept.D-‐ Administration and auditing 1st 1st 1st
DC-‐U5 Dept.C-‐ Transportation engineering -‐ Geomatics and Catia projects 4th 3rd 3rd
DA-‐U4 Dept.A-‐ Project production -‐ Proposal, estimation and project control, Production 3rd 4th 2nd
DB-‐U4 Dept.B-‐ Production engineering -‐ Proposal and estimation 5th 2nd 5th
DA-‐U1 Dept.A-‐ Project production -‐ Project 1 and 2 2nd 5th 4th
TECHNICIANS
DB-‐U1 Dept.B-‐ Production engineering -‐ Production planning 1st 2nd 2nd
DB-‐U4 Dept.B-‐ Production engineering -‐ Proposal and estimation 5th 1st 1st
DA-‐U1 Dept.A-‐ Project production -‐ Project 1 and 2 3rd 3rd 3rd
DA-‐U4 Dept.A-‐ Project production -‐ Proposal, estimation and project control, Production 2nd 5th 5th
DA-‐U3 Dept.A-‐ Project production -‐ Supply chain and systems 4th 4th 4th
Figure 10. Centrality, Power and Betweenness values for traditional communication by function.
4.2 Communication frequency through the BIM platform
EPOC 2014 Conference
16
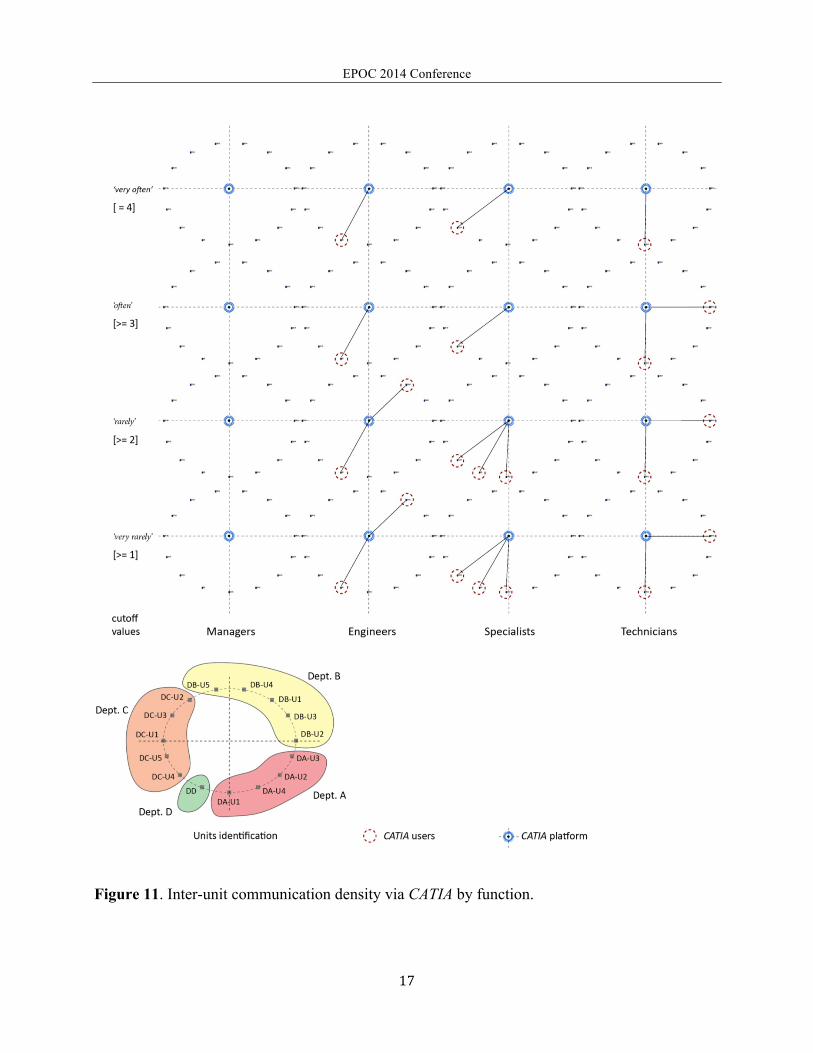
CATIA use frequency by units and function Data obtained regarding inter-unit communications through CATIA, based on the scale of frequency descriptions mentioned earlier are shown on Figure 11. The data reveal that even though employees in all the Units are required to use CATIA to process data and communicate, only 38% of the participants stated that they use CATIA. An aggregate frequency of CATIA use within the Division with a mean value of 2.87. The remaining 62% of the respondents answered never in the questionnaire! The configuration of the ensuing network diagrams shown in Figure 11 indicate that meaningful statistical analysis regarding density, centrality, power and betweenness was not possible. To further analyze of communication flow through CATIA, Figure 11 shows the communication frequency with the platform in the same manner as in Figure 7. A relationship exists for Units using CATIA very often, as these Units do not use traditional communication tools very often as do other Units, and does not depend on the individual's function within the organization. The relationship exists in very often use of CATIA. As the frequency of use of CATIA decreases, communication using traditional tools reappears. The use of the platform, becomes the sole communication tool when used at a scale of 4; when the use of the platform is below 4, the communication pattern remains traditional.
BIM Platform frequency use and performance evaluation The findings suggest that a rather small percentage of professionals use the BIM platform. Only 38% of the participants indicated using CATIA in their activities, but all respondents indicated that their departments and respective units require the use of CATIA to process and communicate data. Of the 38% who use CATIA, the average frequency use is often a mean value of 2.87, leaving 62% of respondents never using CATIA to accomplish a task, retrieve information or communicate with their colleagues. The respondents evaluated the performance of CATIA for their unit and the tool’s fit with their unit’s needs. The answers were favorable in terms of utilization and the average performance of CATIA was evaluated between good and very good. It is also to be noted that respondents who use CATIA believe the tool is better for their personal use, as well as for their unit’s needs. It appears that CATIA is a tool that is received by its users as effective and meeting department’s needs. Employees recognize the tool’s usefulness for their unit even when they don't actively use it for their assigned tasks. The match between the department’s needs and CATIA’s functionality explains the tool’s widespread use within the organization, as opposed to DELMIA, that appears to be rarely used, as none of the respondents used DELMIA in their activity. This rendered our analysis of DELMIA inconclusive.
EPOC 2014 Conference
17
Figure 11. Inter-unit communication density via CATIA by function.
EPOC 2014 Conference
18
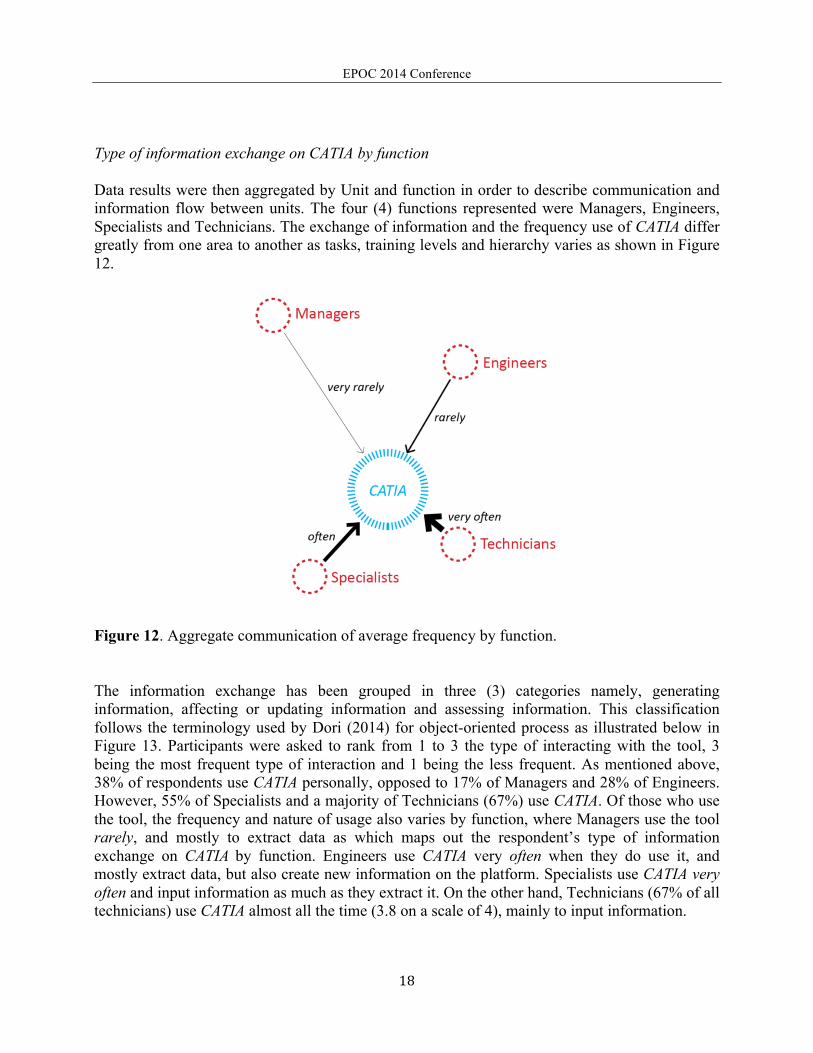
Type of information exchange on CATIA by function Data results were then aggregated by Unit and function in order to describe communication and information flow between units. The four (4) functions represented were Managers, Engineers, Specialists and Technicians. The exchange of information and the frequency use of CATIA differ greatly from one area to another as tasks, training levels and hierarchy varies as shown in Figure 12.
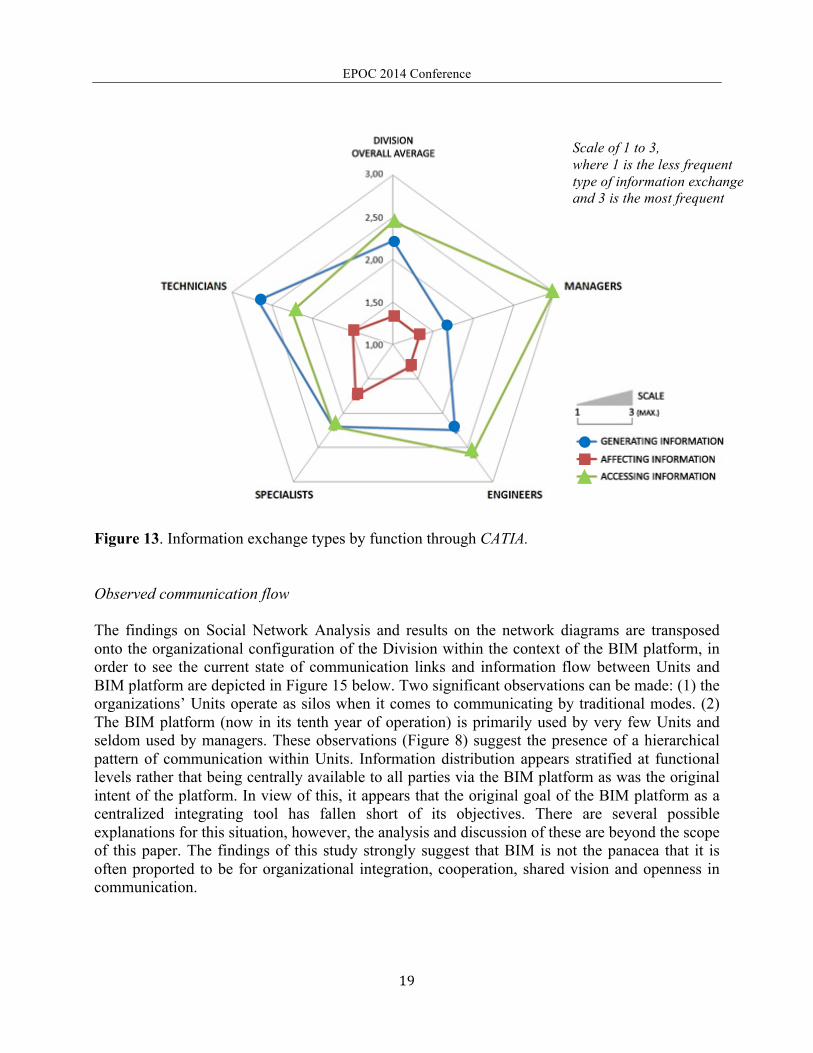
Figure 12. Aggregate communication of average frequency by function. The information exchange has been grouped in three (3) categories namely, generating information, affecting or updating information and assessing information. This classification follows the terminology used by Dori (2014) for object-oriented process as illustrated below in Figure 13. Participants were asked to rank from 1 to 3 the type of interacting with the tool, 3 being the most frequent type of interaction and 1 being the less frequent. As mentioned above, 38% of respondents use CATIA personally, opposed to 17% of Managers and 28% of Engineers. However, 55% of Specialists and a majority of Technicians (67%) use CATIA. Of those who use the tool, the frequency and nature of usage also varies by function, where Managers use the tool rarely, and mostly to extract data as which maps out the respondent’s type of information exchange on CATIA by function. Engineers use CATIA very often when they do use it, and mostly extract data, but also create new information on the platform. Specialists use CATIA very often and input information as much as they extract it. On the other hand, Technicians (67% of all technicians) use CATIA almost all the time (3.8 on a scale of 4), mainly to input information.
EPOC 2014 Conference
19
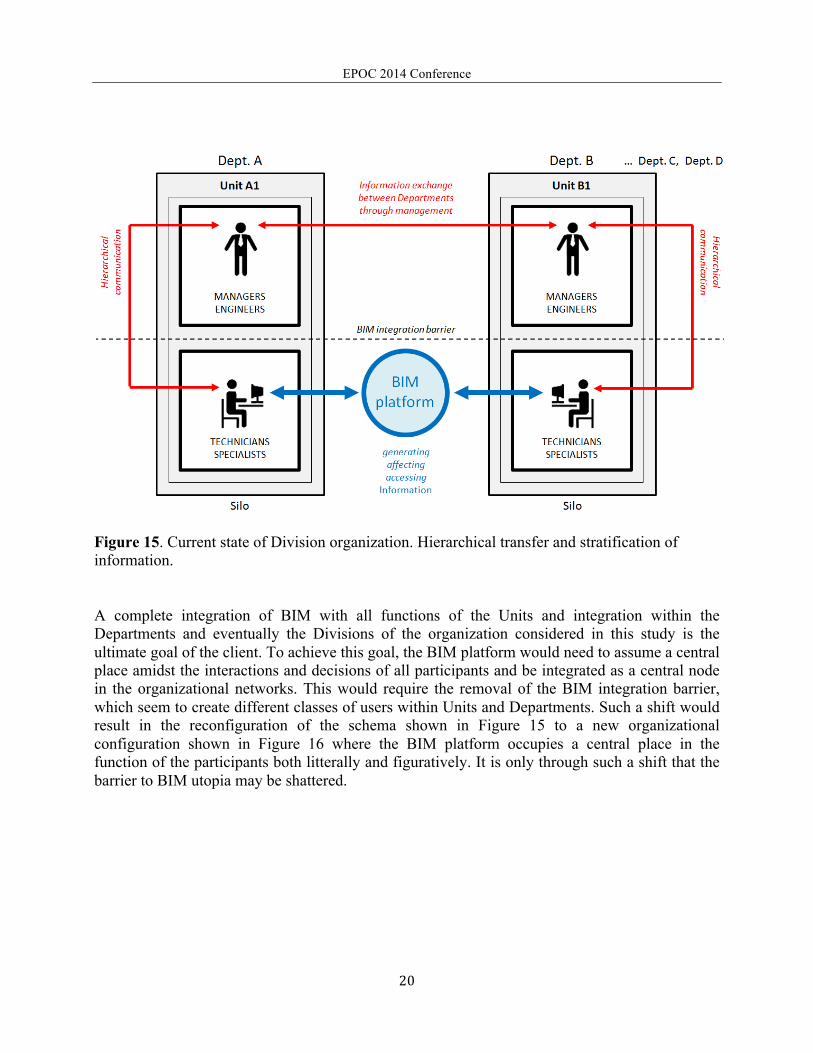
Figure 13. Information exchange types by function through CATIA. Observed communication flow The findings on Social Network Analysis and results on the network diagrams are transposed onto the organizational configuration of the Division within the context of the BIM platform, in order to see the current state of communication links and information flow between Units and BIM platform are depicted in Figure 15 below. Two significant observations can be made: (1) the organizations’ Units operate as silos when it comes to communicating by traditional modes. (2) The BIM platform (now in its tenth year of operation) is primarily used by very few Units and seldom used by managers. These observations (Figure 8) suggest the presence of a hierarchical pattern of communication within Units. Information distribution appears stratified at functional levels rather that being centrally available to all parties via the BIM platform as was the original intent of the platform. In view of this, it appears that the original goal of the BIM platform as a centralized integrating tool has fallen short of its objectives. There are several possible explanations for this situation, however, the analysis and discussion of these are beyond the scope of this paper. The findings of this study strongly suggest that BIM is not the panacea that it is often proported to be for organizational integration, cooperation, shared vision and openness in communication.
Scale of 1 to 3, where 1 is the less frequent type of information exchange and 3 is the most frequent
EPOC 2014 Conference
20
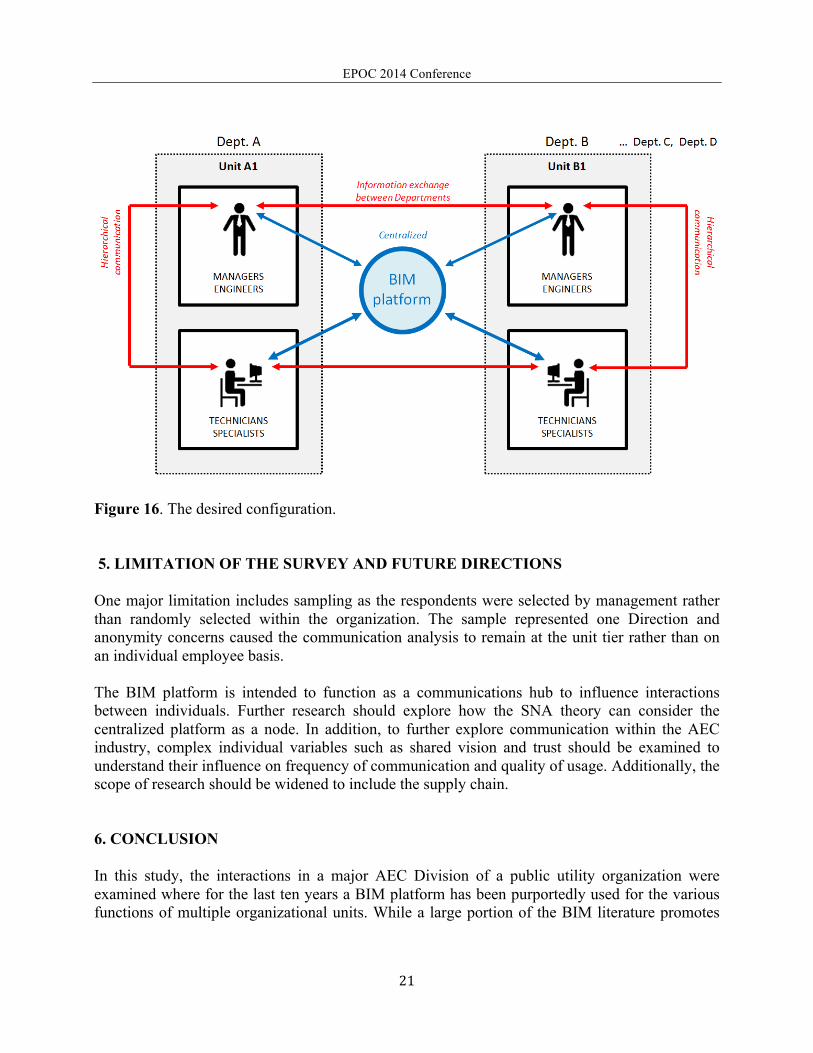
Figure 15. Current state of Division organization. Hierarchical transfer and stratification of information. A complete integration of BIM with all functions of the Units and integration within the Departments and eventually the Divisions of the organization considered in this study is the ultimate goal of the client. To achieve this goal, the BIM platform would need to assume a central place amidst the interactions and decisions of all participants and be integrated as a central node in the organizational networks. This would require the removal of the BIM integration barrier, which seem to create different classes of users within Units and Departments. Such a shift would result in the reconfiguration of the schema shown in Figure 15 to a new organizational configuration shown in Figure 16 where the BIM platform occupies a central place in the function of the participants both litterally and figuratively. It is only through such a shift that the barrier to BIM utopia may be shattered.
EPOC 2014 Conference
21
Figure 16. The desired configuration. 5. LIMITATION OF THE SURVEY AND FUTURE DIRECTIONS One major limitation includes sampling as the respondents were selected by management rather than randomly selected within the organization. The sample represented one Direction and anonymity concerns caused the communication analysis to remain at the unit tier rather than on an individual employee basis. The BIM platform is intended to function as a communications hub to influence interactions between individuals. Further research should explore how the SNA theory can consider the centralized platform as a node. In addition, to further explore communication within the AEC industry, complex individual variables such as shared vision and trust should be examined to understand their influence on frequency of communication and quality of usage. Additionally, the scope of research should be widened to include the supply chain. 6. CONCLUSION In this study, the interactions in a major AEC Division of a public utility organization were examined where for the last ten years a BIM platform has been purportedly used for the various functions of multiple organizational units. While a large portion of the BIM literature promotes
EPOC 2014 Conference
22
the virtues of this technology, the findings of the present study suggest that in the case of this organization, BIM has not delivered the promised results. There is a disparity of use amongst the functional categories of users, and the extent and frequency of BIM platform use appears to create two classes of employees. The data analysis suggests even that in the organization studied, there are those few using the platform and then there are those in the majority (62%) who are opting for traditional modes of communication and data exchange and perhaps relying on the few BIM users to access the information they need. Based on the findings for this study, the case can be made that the use of the BIM platform for the last ten years has not, in this case, been on track to even come close to the promised BIM utopia. REFERENCES Bernstein, H. M., Ed.(2012) Building Information Modeling Trends SmartMarket Report. NY: Mcgraw-Hill Construction. Blackler, F., Crump, N. and Mcdonald, S.(1999) Managing Experts and Competing through
Innovation: An ActivityTheoretical Analysis. Bailrigg, UK: Lancaster University. Blackler, F., Crump, N. and Mcdonald, S. (2000) Organizing Processes in Complex Activity
Networks. Bailrigg, UK: Lancaster University. Björk, B.-C. (1992)A unified approach for modeling construction information.Building and Environment. 27(2),pp. 173-194. Borgatti, S. P., Everett, M. G., and Freeman, L. C. (2002)UCINET for Windows: Software for social network analysis.Harvard, MA: Analytic Technologies. Chinowsky, P., Taylor, J., Networks in engineering : an emerging approach to project
organization studies, The Engineering Project Organization Journal (March-June 2012) 2, 15-26
Chinowsky, P. S., Diekmann, J., and O’Brien, J. (2010)Project Organizations as Social Networks.Boulder, CO: University of Colorado, Journal of Construction Engineering and
Management, ASCE, 136(4). Crotty, R. (2011) The Impact of Building Information Modeling: Transforming Construction. London: SponPress. Dori, D. (2014), The Maturation of Model-Based Systems Engineering: OPM as the ISO Conceptual Modeling Language Standard, MIT SDM Systems Thinking Webinar Series, http://sdm.mit.edu/news/news_articles/webinar_060214/opm-iso-language.html Accessed : June 2nd, 2014. Dossick, C. S. and Neff, G.(2010)Organizational divisions in bim-enabled commercial
construction. Journal of Construction Engineering and Management, 136(4), pp. 459-467. Dossick, C. S. and Neff,G. (2011) Messy talk and clean technology: communication, problem-
solving and collaboration using Building Information Modelling. Engineering Project Organization Journal, 1,pp. 83-93.
EPOC 2014 Conference
23
Dubler, C. R., Messner, J. I. andAnumba, C. J. (2010) Using Lean Theory to Identify Waste Associated with Information Exchanges on a Building Project. Proceedings Construction Research Congress/ASCE.
Deamer, P. and Bernstein, G. (2011)BIM in Academia. New Haven, CT: Yale School of Architecture.
Eastman, C. (2011)A Guide to Building Information Modeling for Owners, Managers, Designers, Engineers, and Contractors.NY: Wiley. Eastman, C. M., Teicholz, P., Sacks, R. and Liston, K. (2011) BIM handbook : a guide to
building information modeling for owners, managers, designers, engineers and contractors.Hoboken, NJ: Wiley.
Forgues, D. andIordanova, I.(2010)An IDP-BIM Framework for Reshaping Professional Design Practices.Construction Research Congress 2010.American Society of Civil Engineers.
Froese, T. (2006) Emerging information and communication technologies and the discipline of project information management.Intelligent Computing in Engineering and Architecture. Springer.
Froese, T. (2010) The impact of emerging information technology on project management for construction. Automation in Construction, 19,pp. 531-538.
Green, S. (2000–2002) Knowledge Transfer Between Aerospace and Construction. Engineering and Physical Science Research Council (EPSRC) Innovative Manufacturing Initiative (IMI) - Learning Across Business Sectors. Fountainbridge, Edinburgh: DTZ.
Harty, C.F. (2005) Innovation in construction: a sociology of technology approach. Building Research and Information, 33,pp. 512-522.
Harty, C.F. (2008) Implementing innovation in construction: contexts, relative boundedness and actor network theory. Construction Management and Economics, 26(10), pp. 1029-1041.
Harty, C.F. (2010) Implementing innovation: designers, users and actor-networks.Technology Analysis and Strategic Management, 22(3).
Katsanis, C. and Chinowsky, P. (2011) Network analysis of a Simulated Network Organization. Estes Park, Colorado:Engineering Project Organizations Conference.
Kiviniemi, A. and Fischer, M. (2009) Potential Obstacles to Use BIM in Architectural Design. In: Shen, G., Brandon, P. and Baldwin, A. (eds.) Collaborative Construction Information Management. London: SponPress.
Kocaturk, T. (2013) Emerging Socio-Technical Networks of Innovation in Architectural Practice. International Journal of Architectural Computing vol 11 issue 1 pp 21-36
Laakso, M. andKiviniemi, A. (2012) The IFC standard - A review of history, development, and standardization. Electronic Journal of Information Technology in Construction (ITcon), 17, pp. 134 – 161.
Miranda, S.M. and Saunders, C.S. (2003) The social construction of meaning: An alternative perspective on information sharing. Information systems research, 14,pp. 87-106.
Mutis, I. andIssa, R.R.A. (2012) Framework for semantic reconciliation of construction project information. Journal of Information Technology in Construction (ITcon), 17, pp. 1-24.
EPOC 2014 Conference
24
Nepal, M.P., Staub-French, S., Pottinger, R. and Webster, A. (2012) Querying a building information model for construction-specific spatial information. Advanced Engineering Informatics, 26,pp. 904-923.
Paavola, S.andMiettinen, R. (2012) Beyond a technological utopia: incremental development and multifunctionality of building information modeling (BIM). Helsinki, Finland: A
paper at the EGOS, 7, pp. 2.-7. Redmond, A., Hore, A., Alshawi, M. and West, R. (2012) Exploring how information exchanges
can be enhanced through Cloud BIM.Automation in Construction, 24,pp. 175-183. Sacks, R., Kaner, I., Eastman, C. M. andJeong, Y.-S. (2010) The Rosewood experiment —
Building information modeling and interoperability for architectural precast facades.Automation in Construction, 19,pp. 419-432.
Singh, V., Gu, N. and Wang, X. (2011) A theoretical framework of a BIM-based multi-disciplinary collaboration platform.Automation in Construction, 20,pp. 134-144.
Taylor, J., and Bernstein, P. (2009) Paradigm Trajectories of Building Information Modeling Practice in Project Networks. ASCE Journal of Management in Engineering, 25(2), pp. 69-76.
Taylor, J. (2007). The Antecedents of Successful 3D CAD Implementation in Design and Construction Networks.ASCE Journal of Construction Engineering and Management, 133(12), pp. 993-1002. (Winner of Best Journal Paper Award for 2007) Taylor, J., and Levitt, R. (2007)Innovation Alignment and Project Network Dynamics: An Integrative Model for Change.Project Management Journal, 38(3), pp. 22-35. Turk, Ž. (2001) Phenomenologial foundations of conceptual product modelling in architecture,
engineering and construction.Artificial Intelligence in Engineering, 15,pp. 83-92. Wu, I. C. and Hsieh, S.-H. (2012) A framework for facilitating multi-dimensional information integration, management and visualization in engineering projects. Automation in Construction, 23, pp. 71-86.


![De-Centralizing Operations with APM [FutureStack16]](https://img.pdfslide.us/doc/110x75/5870d97f1a28ab64768b74ed/de-centralizing-operations-with-apm-futurestack16.jpg)