Embed Size (px)
Citation preview
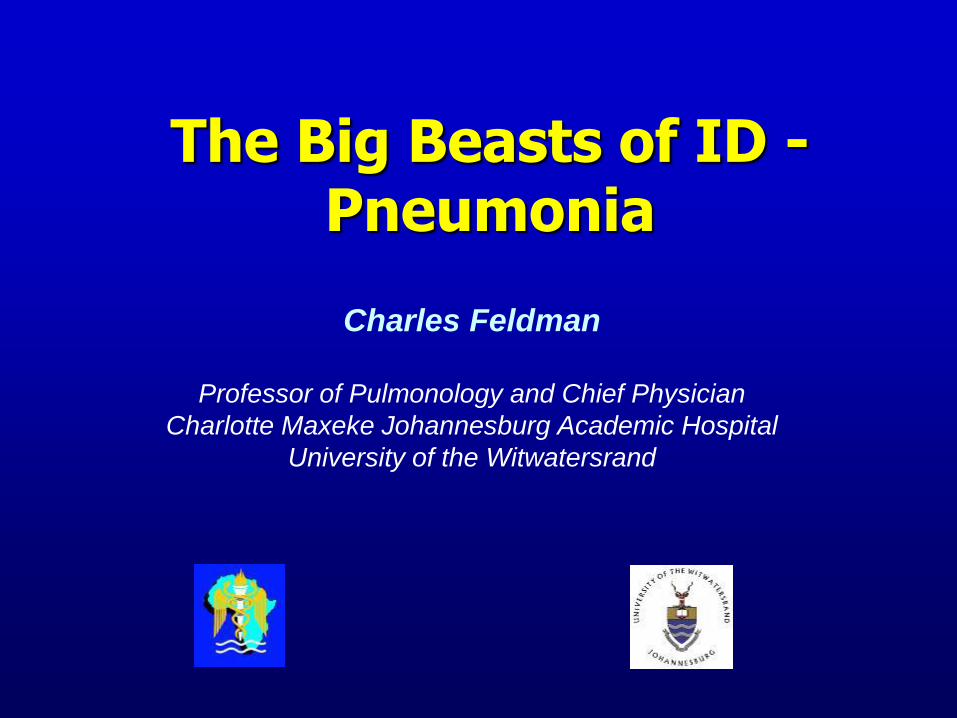
The Big Beasts of ID - Pneumonia
Charles Feldman
Professor of Pulmonology and Chief Physician
Charlotte Maxeke Johannesburg Academic Hospital
University of the Witwatersrand
0 0.5 1.0 1.5 2.0 2.5 3.0 3.5 4.0 4.5
No. of deaths (millions)
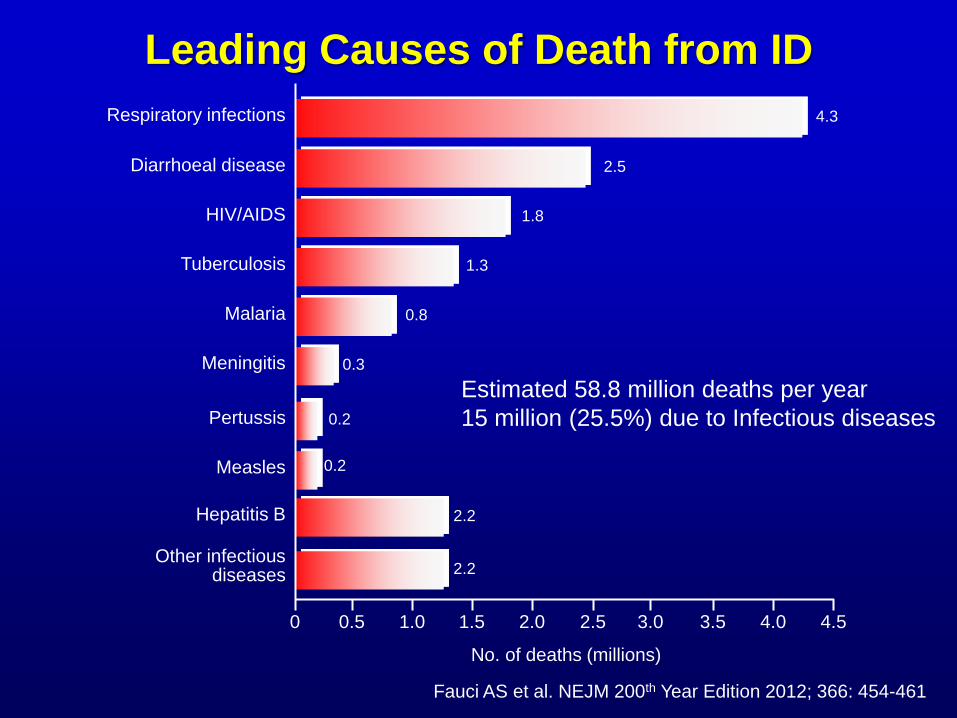
2.2 Other infectious
diseases
2.2 Hepatitis B
0.2 Measles
0.2 Pertussis
0.3 Meningitis
0.8 Malaria
1.3 Tuberculosis
1.8 HIV/AIDS
2.5 Diarrhoeal disease
4.3 Respiratory infections
Fauci AS et al. NEJM 200th Year Edition 2012; 366: 454-461
Leading Causes of Death from ID
Estimated 58.8 million deaths per year
15 million (25.5%) due to Infectious diseases
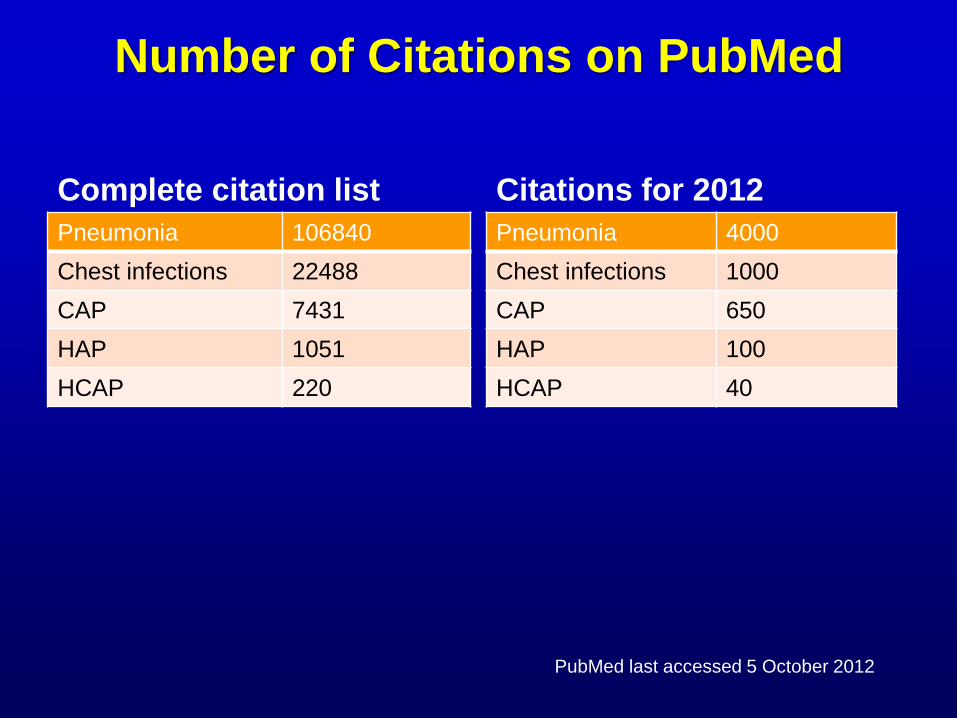
Number of Citations on PubMed
Complete citation list
Pneumonia 106840
Chest infections 22488
CAP 7431
HAP 1051
HCAP 220
Citations for 2012
Pneumonia 4000
Chest infections 1000
CAP 650
HAP 100
HCAP 40
PubMed last accessed 5 October 2012
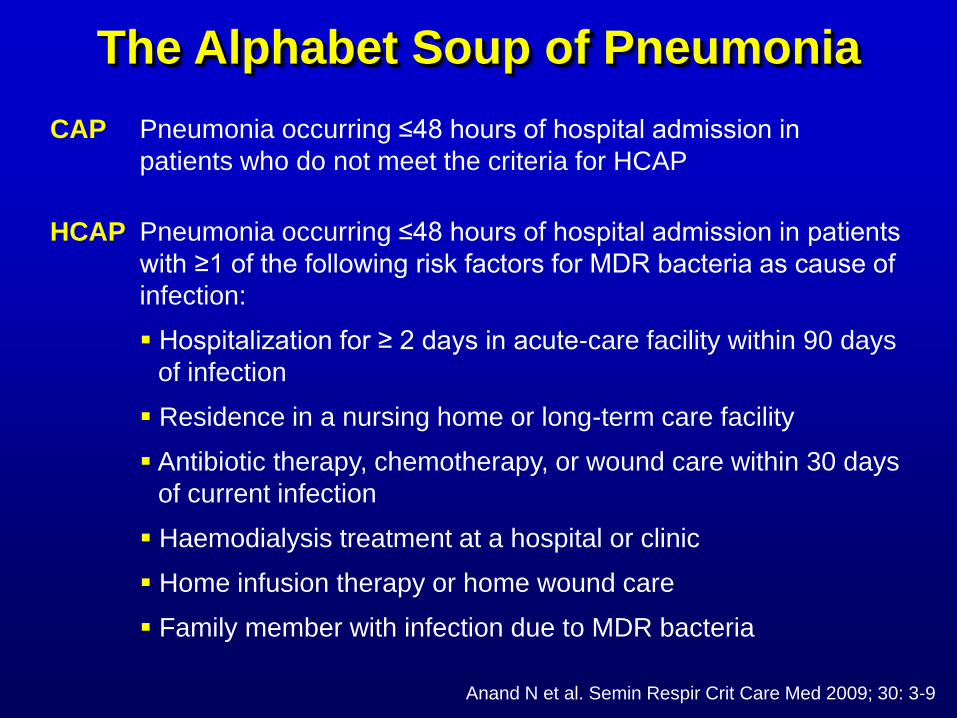
The Alphabet Soup of Pneumonia
Pneumonia occurring ≤48 hours of hospital admission in
patients who do not meet the criteria for HCAP
CAP
Pneumonia occurring ≤48 hours of hospital admission in patients
with ≥1 of the following risk factors for MDR bacteria as cause of
infection:
Hospitalization for ≥ 2 days in acute-care facility within 90 days
of infection
Residence in a nursing home or long-term care facility
Antibiotic therapy, chemotherapy, or wound care within 30 days
of current infection
Haemodialysis treatment at a hospital or clinic
Home infusion therapy or home wound care
Family member with infection due to MDR bacteria
HCAP
Anand N et al. Semin Respir Crit Care Med 2009; 30: 3-9
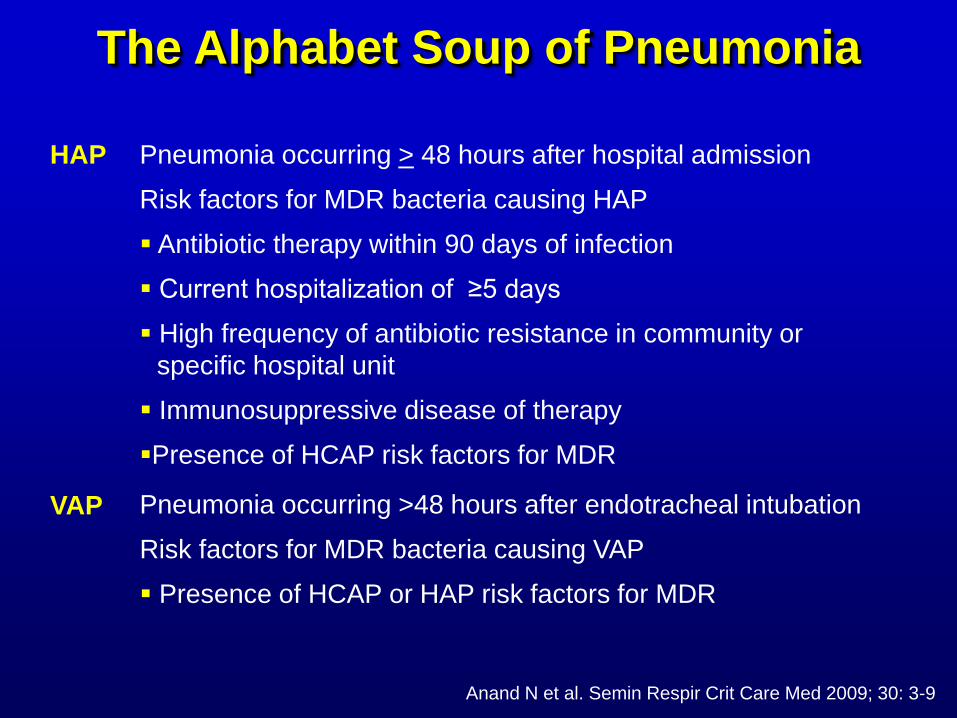
Pneumonia occurring >48 hours after endotracheal intubation
Risk factors for MDR bacteria causing VAP
Presence of HCAP or HAP risk factors for MDR
VAP
Pneumonia occurring > 48 hours after hospital admission
Risk factors for MDR bacteria causing HAP
Antibiotic therapy within 90 days of infection
Current hospitalization of ≥5 days
High frequency of antibiotic resistance in community or
specific hospital unit
Immunosuppressive disease of therapy
Presence of HCAP risk factors for MDR
HAP
Anand N et al. Semin Respir Crit Care Med 2009; 30: 3-9
The Alphabet Soup of Pneumonia
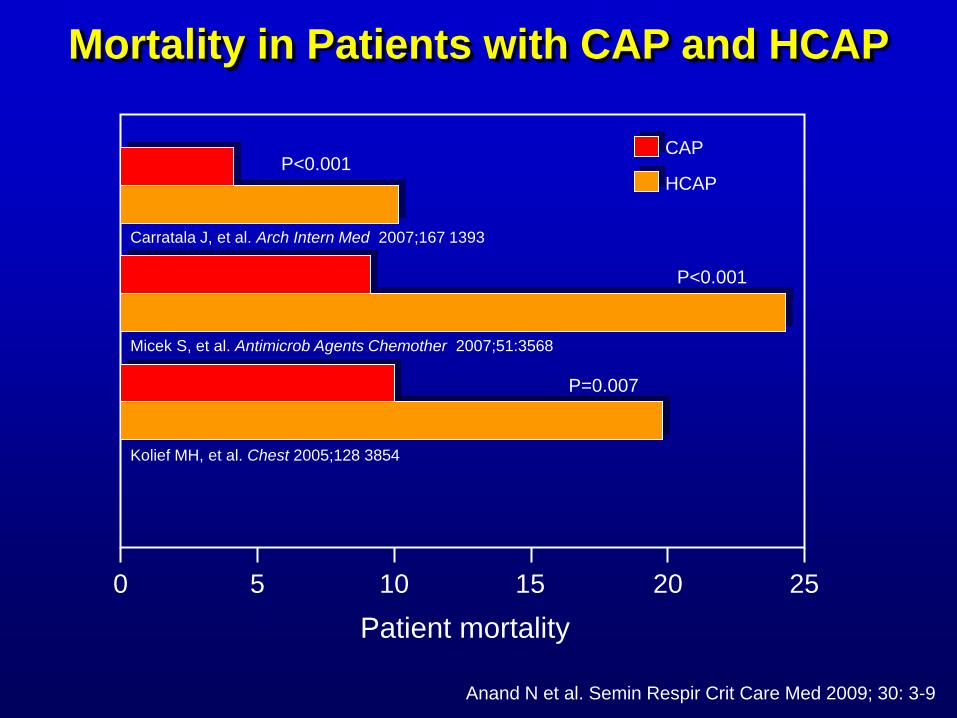
0 5 10 15 20 25
Patient mortality
Kolief MH, et al. Chest 2005;128 3854
Micek S, et al. Antimicrob Agents Chemother 2007;51:3568
Carratala J, et al. Arch Intern Med 2007;167 1393
P=0.007
P<0.001
P<0.001 CAP
HCAP
Mortality in Patients with CAP and HCAP
Anand N et al. Semin Respir Crit Care Med 2009; 30: 3-9
0
20
40
60
80
Pa
ien
ts w
ith
PD
R p
ath
og
en
s (
%)
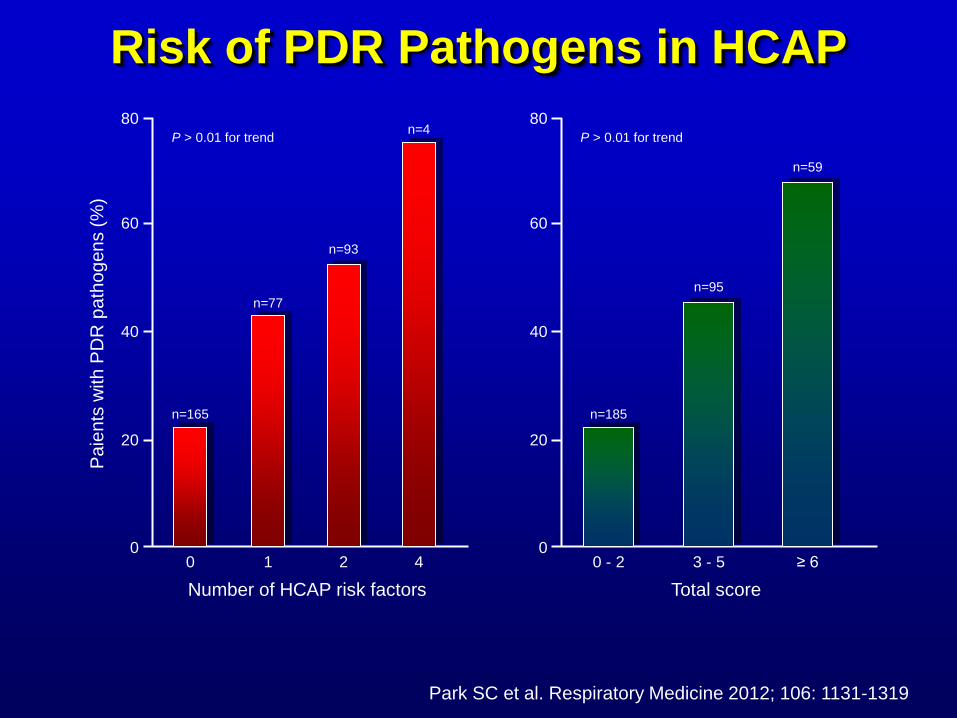
0
n=165
1
n=77
2
n=93
4
n=4
Number of HCAP risk factors
P > 0.01 for trend
0
20
40
60
80
0 - 2
n=185
Total score
P > 0.01 for trend
3 - 5
n=95
≥ 6
n=59
Risk of PDR Pathogens in HCAP
Park SC et al. Respiratory Medicine 2012; 106: 1131-1319
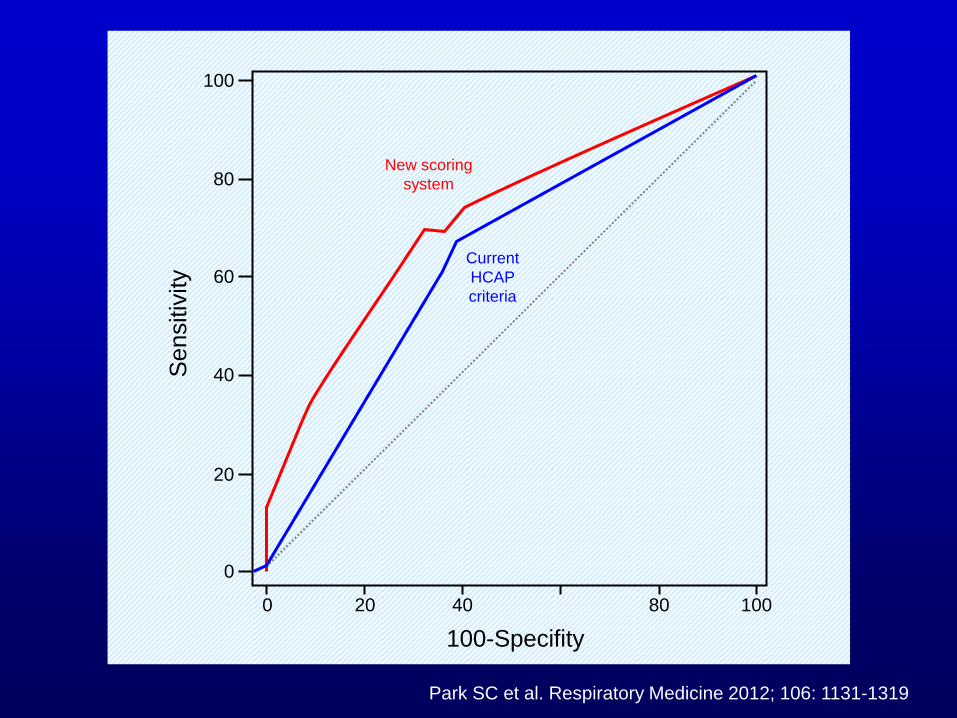
100
80
60
40
20
0
0 20 40
100-Specifity
80 100
Sensitiv
ity
New scoring
system
Current
HCAP
criteria
Park SC et al. Respiratory Medicine 2012; 106: 1131-1319
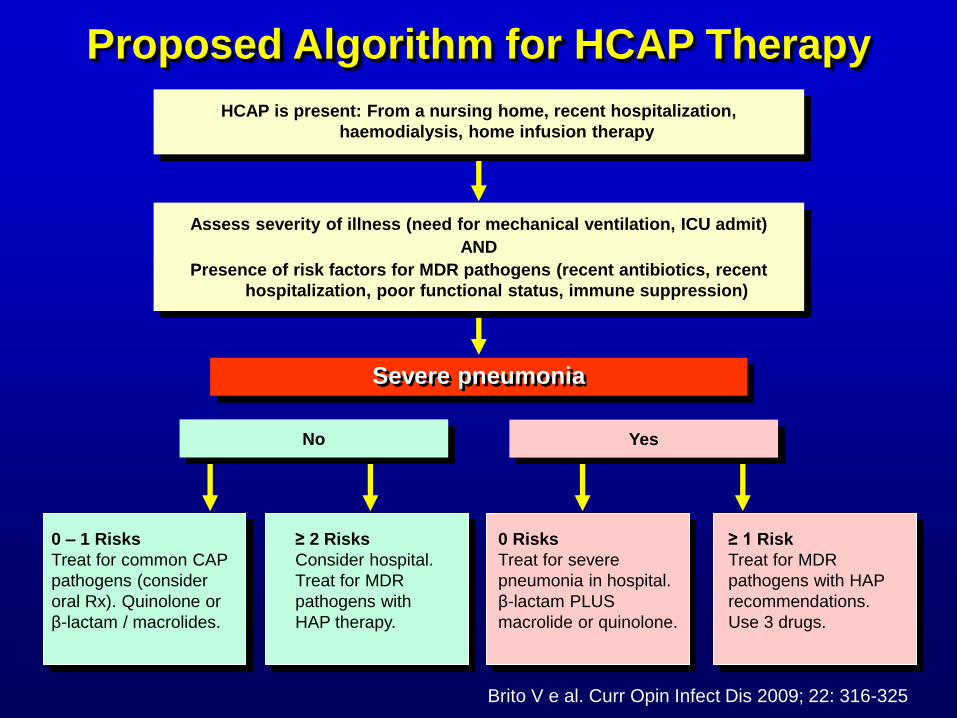
Proposed Algorithm for HCAP Therapy
Severe pneumonia
Assess severity of illness (need for mechanical ventilation, ICU admit)
AND
Presence of risk factors for MDR pathogens (recent antibiotics, recent
hospitalization, poor functional status, immune suppression)
HCAP is present: From a nursing home, recent hospitalization,
haemodialysis, home infusion therapy
No Yes
0 – 1 Risks
Treat for common CAP
pathogens (consider
oral Rx). Quinolone or
β-lactam / macrolides.
≥ 2 Risks
Consider hospital.
Treat for MDR
pathogens with
HAP therapy.
0 Risks
Treat for severe
pneumonia in hospital.
β-lactam PLUS
macrolide or quinolone.
≥ 1 Risk
Treat for MDR
pathogens with HAP
recommendations.
Use 3 drugs.
Brito V e al. Curr Opin Infect Dis 2009; 22: 316-325
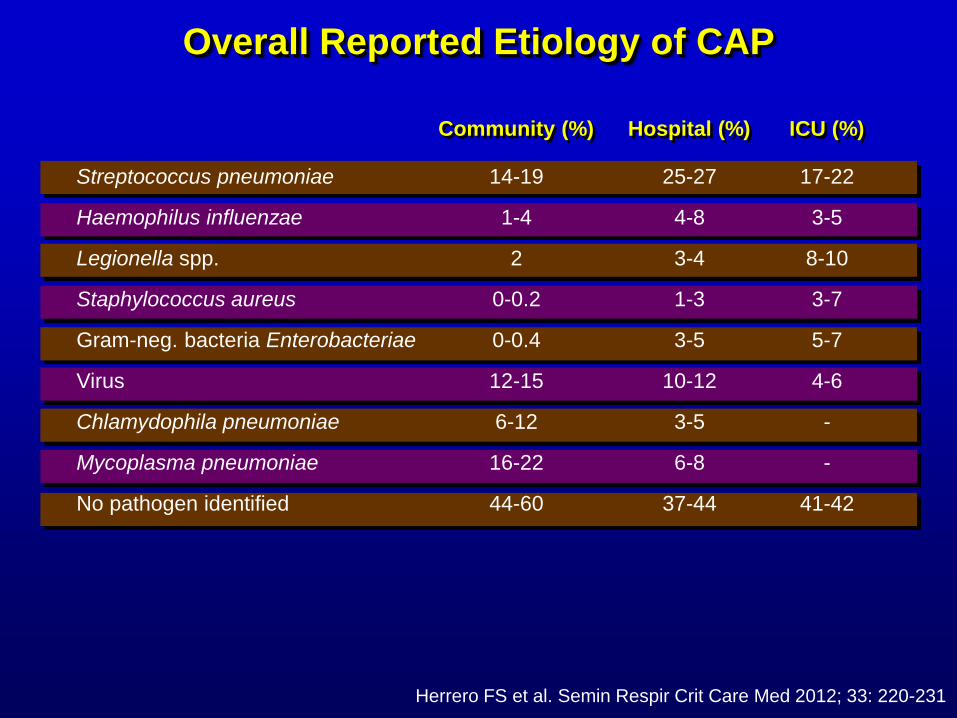
Overall Reported Etiology of CAP
Herrero FS et al. Semin Respir Crit Care Med 2012; 33: 220-231
Community (%) ICU (%) Hospital (%)
Streptococcus pneumoniae
Haemophilus influenzae
Legionella spp.
Staphylococcus aureus
Gram-neg. bacteria Enterobacteriae
Virus
Chlamydophila pneumoniae
Mycoplasma pneumoniae
No pathogen identified
14-19
1-4
2
0-0.2
0-0.4
12-15
6-12
16-22
44-60
25-27
4-8
3-4
1-3
3-5
10-12
3-5
6-8
37-44
17-22
3-5
8-10
3-7
5-7
4-6
-
-
41-42
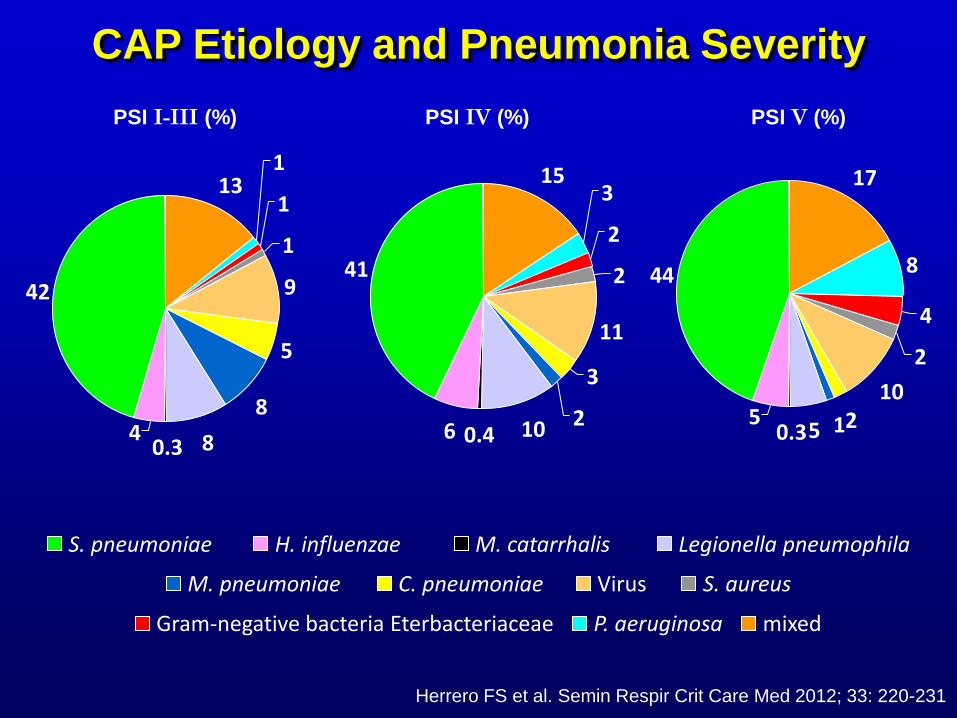
PSI I-III (%) PSI IV (%) PSI V (%)
Legionella pneumophila S. pneumoniae H. influenzae M. catarrhalis
Virus C. pneumoniae M. pneumoniae S. aureus
Gram-negative bacteria Eterbacteriaceae P. aeruginosa mixed
13 1
1
1
9
5
8
8 0.3 4
42
15 3
2
2
11
3
2 10 0.4 6
41
17
8
4
2
10
2 1 5 0.3 5
44
CAP Etiology and Pneumonia Severity
Herrero FS et al. Semin Respir Crit Care Med 2012; 33: 220-231
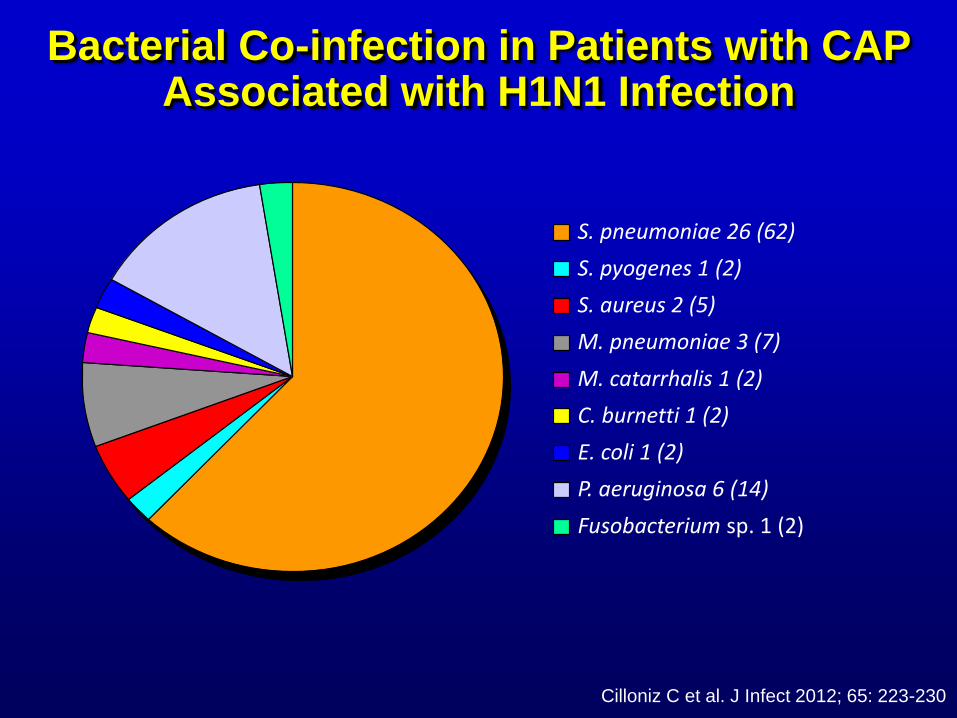
S. pneumoniae 26 (62)
S. pyogenes 1 (2)
S. aureus 2 (5)
M. pneumoniae 3 (7)
M. catarrhalis 1 (2)
C. burnetti 1 (2)
E. coli 1 (2)
P. aeruginosa 6 (14)
Fusobacterium sp. 1 (2)
Bacterial Co-infection in Patients with CAP Associated with H1N1 Infection
Cilloniz C et al. J Infect 2012; 65: 223-230
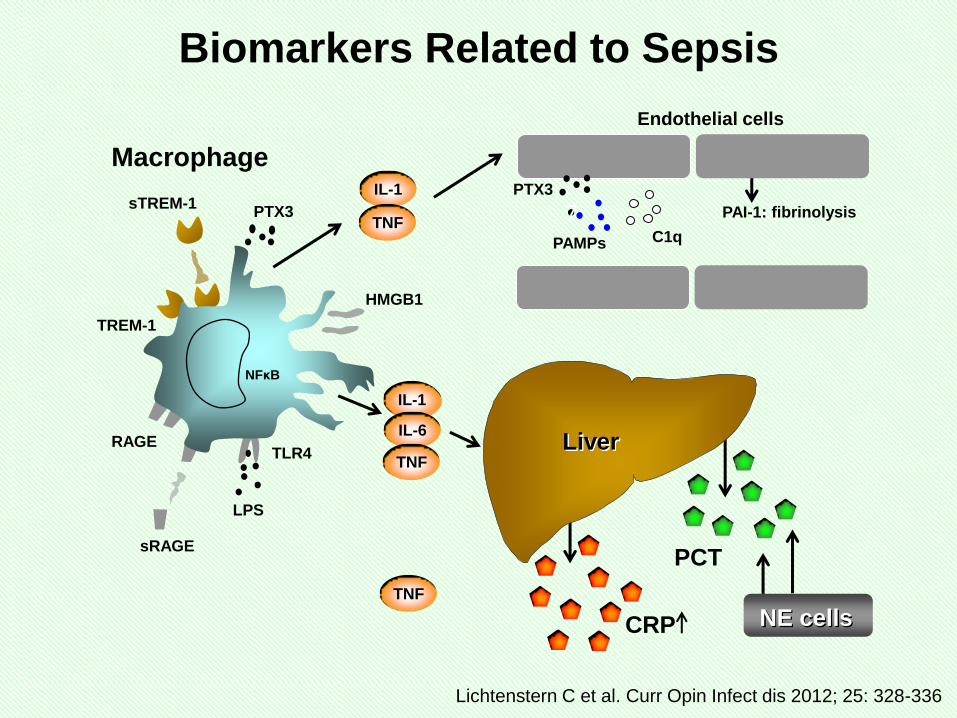
PCT
NE cells CRP
IL-1
IL-6
TNF TLR4
LPS
sRAGE
TREM-1
sTREM-1 PTX3
RAGE
TNF
IL-1
TNF
HMGB1
NFκB
Macrophage
Liver
7 PTX3
PAMPs C1q
PAI-1: fibrinolysis
Endothelial cells
Lichtenstern C et al. Curr Opin Infect dis 2012; 25: 328-336
Biomarkers Related to Sepsis
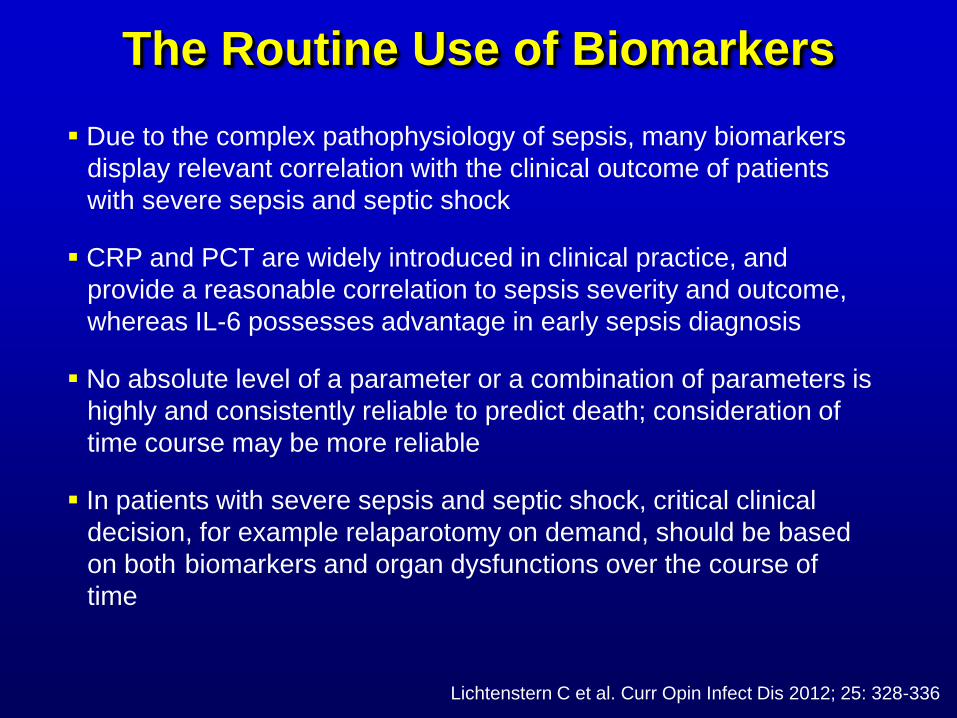
The Routine Use of Biomarkers
Due to the complex pathophysiology of sepsis, many biomarkers
display relevant correlation with the clinical outcome of patients
with severe sepsis and septic shock
CRP and PCT are widely introduced in clinical practice, and
provide a reasonable correlation to sepsis severity and outcome,
whereas IL-6 possesses advantage in early sepsis diagnosis
No absolute level of a parameter or a combination of parameters is
highly and consistently reliable to predict death; consideration of
time course may be more reliable
In patients with severe sepsis and septic shock, critical clinical
decision, for example relaparotomy on demand, should be based
on both biomarkers and organ dysfunctions over the course of
time
Lichtenstern C et al. Curr Opin Infect Dis 2012; 25: 328-336
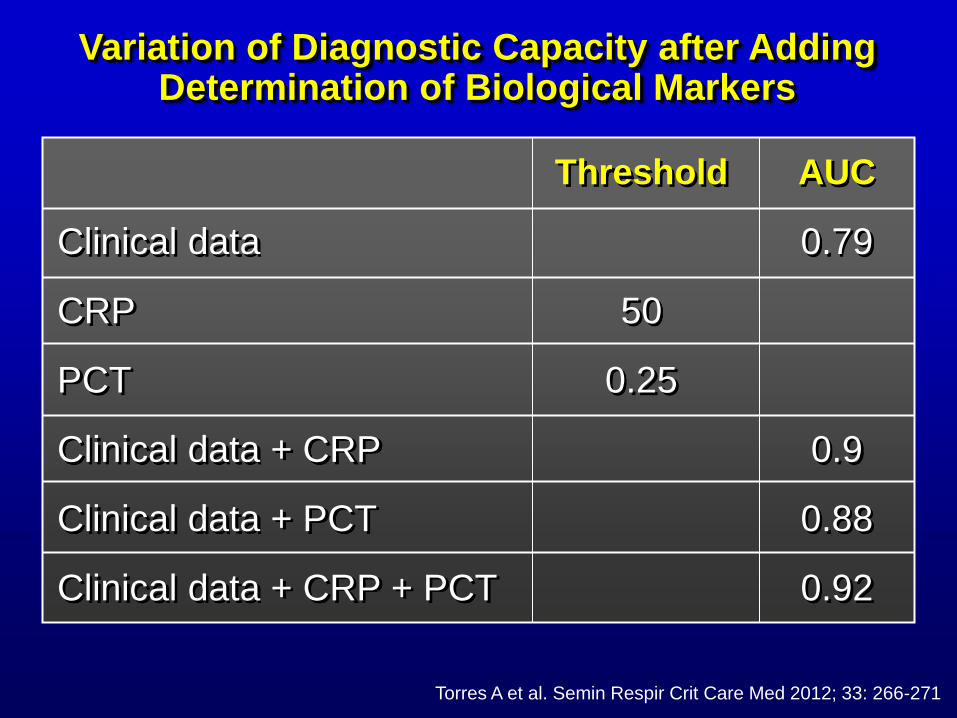
Variation of Diagnostic Capacity after Adding Determination of Biological Markers
Clinical data
CRP
PCT
Clinical data + CRP
Clinical data + PCT
Clinical data + CRP + PCT
50
0.25
0.79
0.9
0.88
0.92
Threshold AUC
Torres A et al. Semin Respir Crit Care Med 2012; 33: 266-271
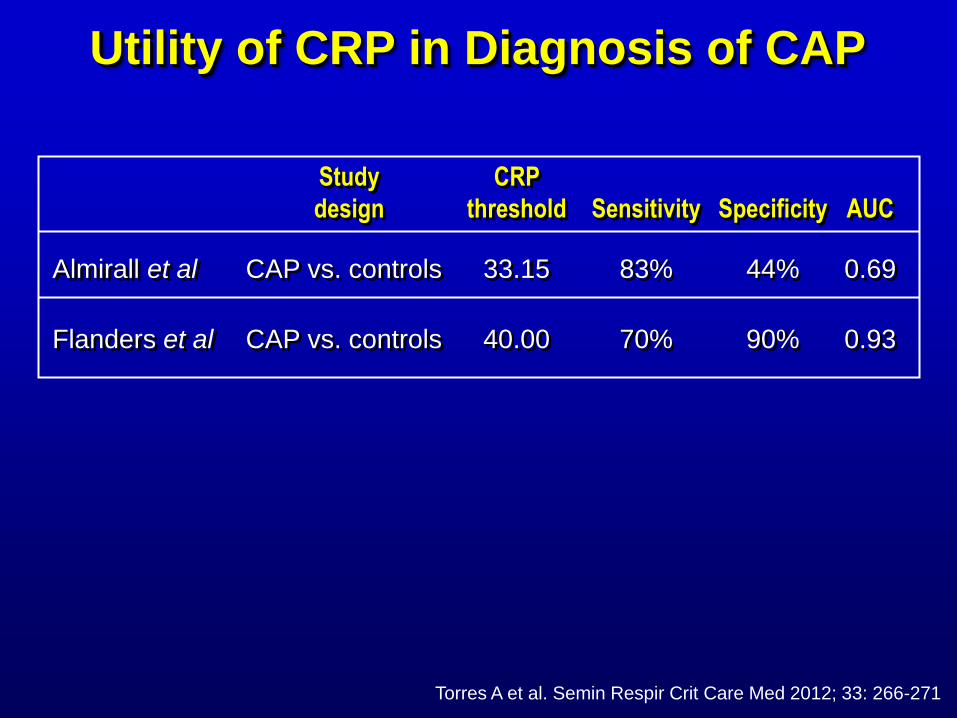
Utility of CRP in Diagnosis of CAP
Almirall et al
Flanders et al
Study
design
CRP
threshold Sensitivity Specificity AUC
CAP vs. controls
CAP vs. controls
33.15
40.00
83%
70%
44%
90%
0.69
0.93
Torres A et al. Semin Respir Crit Care Med 2012; 33: 266-271
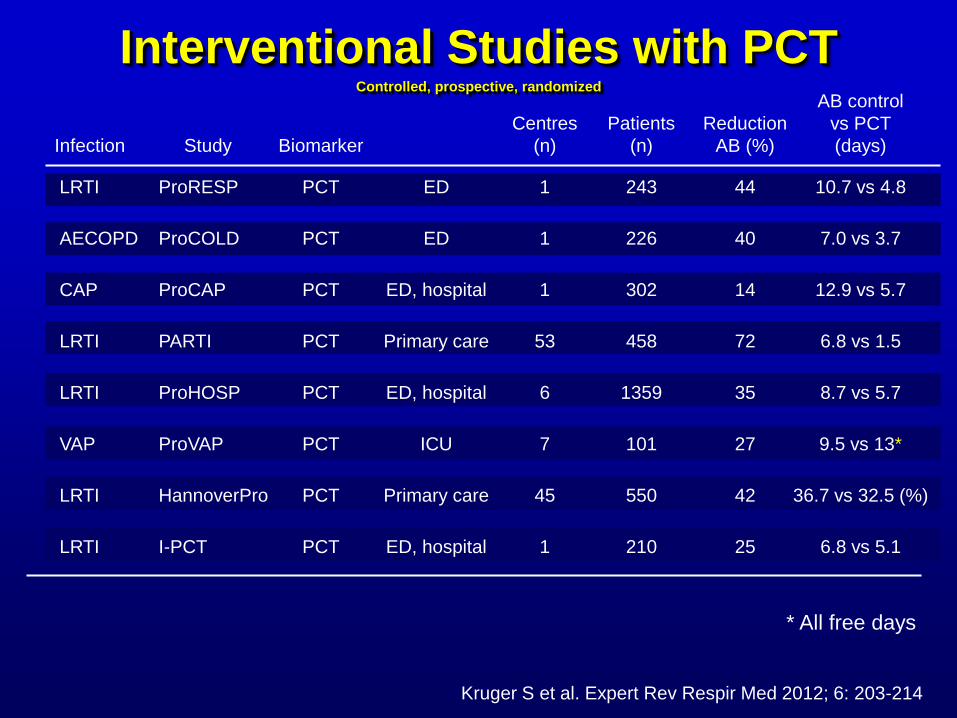
Interventional Studies with PCT Controlled, prospective, randomized
ProRESP
ProCOLD
ProCAP
PARTI
ProHOSP
ProVAP
HannoverPro
I-PCT
LRTI
AECOPD
CAP
LRTI
LRTI
VAP
LRTI
LRTI
PCT
PCT
PCT
PCT
PCT
PCT
PCT
PCT
ED
ED
ED, hospital
Primary care
ED, hospital
ICU
Primary care
ED, hospital
1
1
1
53
6
7
45
1
243
226
302
458
1359
101
550
210
44
40
14
72
35
27
42
25
Study Infection Biomarker
Centres
(n)
Patients
(n)
Reduction
AB (%)
10.7 vs 4.8
7.0 vs 3.7
12.9 vs 5.7
6.8 vs 1.5
8.7 vs 5.7
9.5 vs 13*
36.7 vs 32.5 (%)
6.8 vs 5.1
AB control
vs PCT
(days)
* All free days
Kruger S et al. Expert Rev Respir Med 2012; 6: 203-214
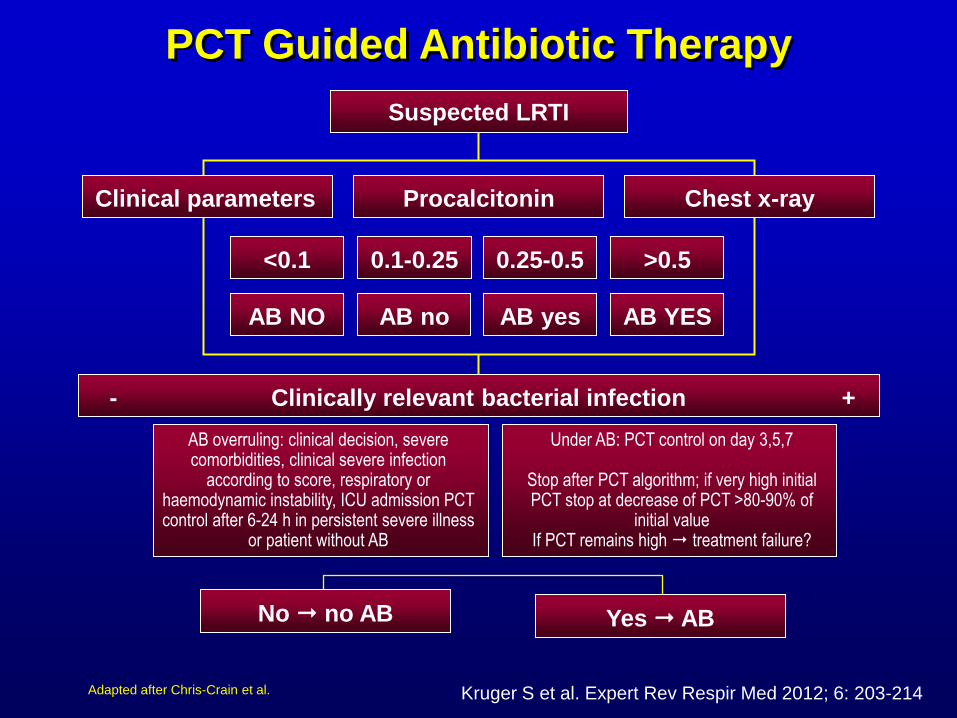
PCT Guided Antibiotic Therapy
Adapted after Chris-Crain et al.
Suspected LRTI
Clinical parameters Procalcitonin Chest x-ray
0.1-0.25 <0.1 0.25-0.5 >0.5
AB no AB NO AB yes AB YES
Yes AB No no AB
AB overruling: clinical decision, severe comorbidities, clinical severe infection
according to score, respiratory or haemodynamic instability, ICU admission PCT control after 6-24 h in persistent severe illness
or patient without AB
Under AB: PCT control on day 3,5,7
Stop after PCT algorithm; if very high initial PCT stop at decrease of PCT >80-90% of
initial value If PCT remains high treatment failure?
AB NO AB yes AB no AB NO
Clinically relevant bacterial infection - +
Kruger S et al. Expert Rev Respir Med 2012; 6: 203-214
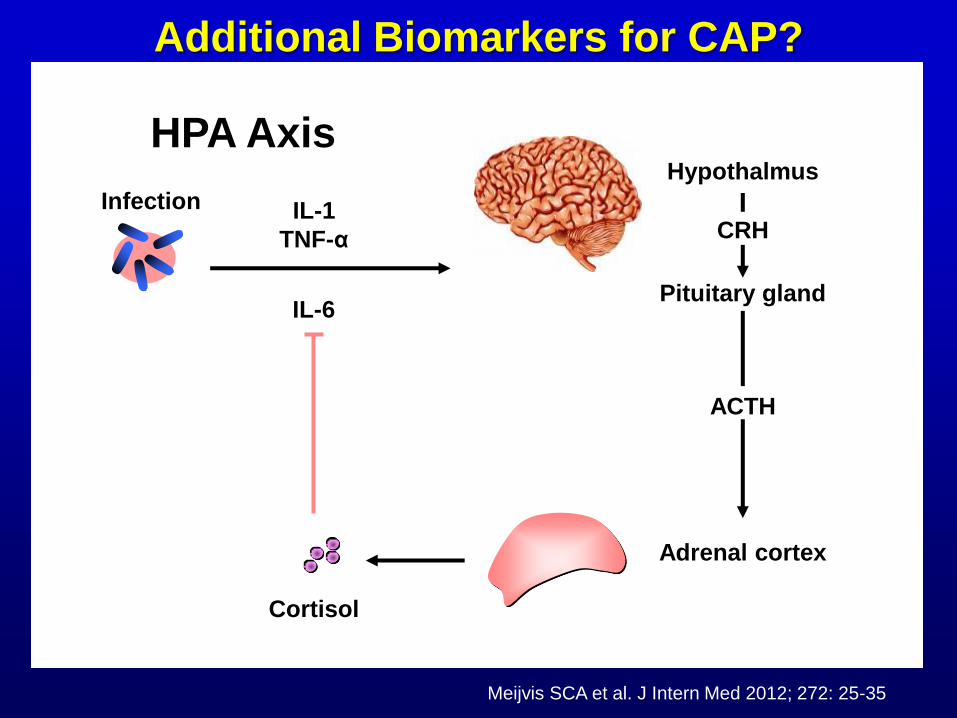
Infection IL-1
TNF-α
IL-6
Cortisol
Adrenal cortex
Pituitary gland
ACTH
Hypothalmus
CRH
Additional Biomarkers for CAP?
Meijvis SCA et al. J Intern Med 2012; 272: 25-35
HPA Axis
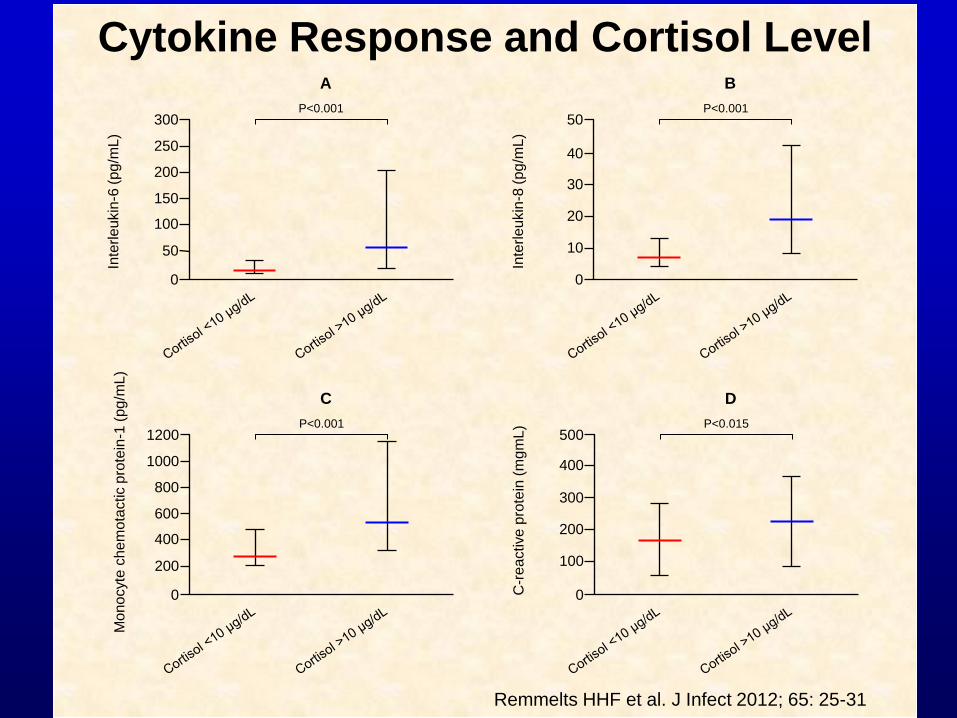
300
250
Inte
rle
ukin
-6 (
pg
/mL
)
150
100
50
0
200
P<0.001
A
50
40
Inte
rle
ukin
-8 (
pg
/mL
)
20
10
0
30
P<0.001
B
1200
1000
Mo
no
cyte
ch
em
ota
ctic p
rote
in-1
(p
g/m
L)
600
400
200
0
800
P<0.001
C
500
400
C-r
eactive
pro
tein
(m
gm
L)
200
100
0
300
P<0.015
D
Remmelts HHF et al. J Infect 2012; 65: 25-31
Cytokine Response and Cortisol Level
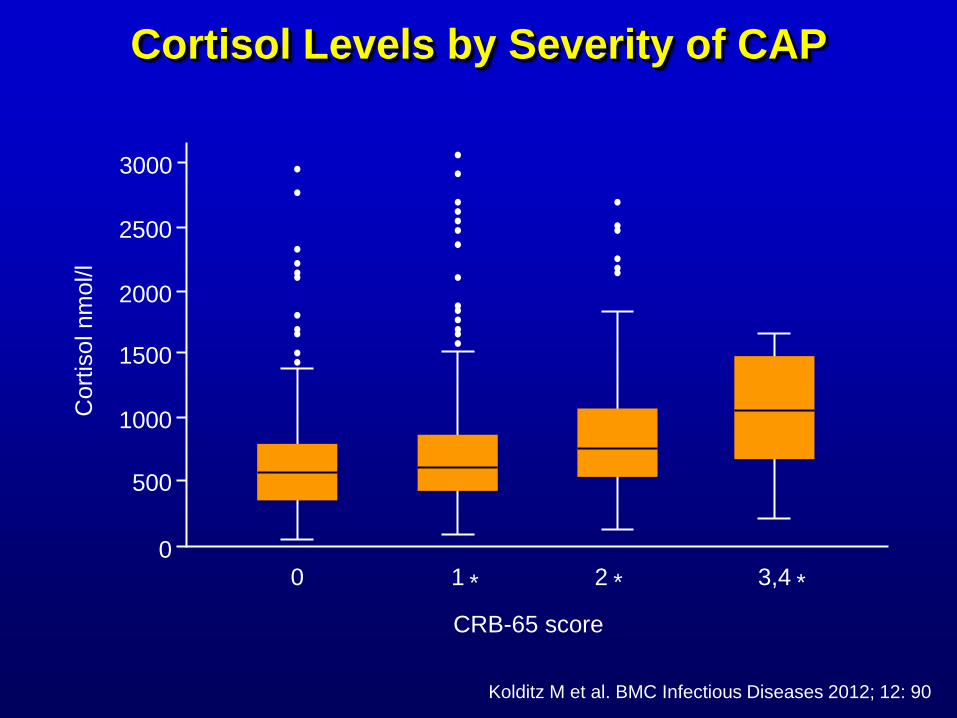
Cortisol Levels by Severity of CAP
3000
Cort
isol nm
ol/l
2500
2000
1500
1000
500
0 0 1 2 3,4
CRB-65 score
* * *
Kolditz M et al. BMC Infectious Diseases 2012; 12: 90
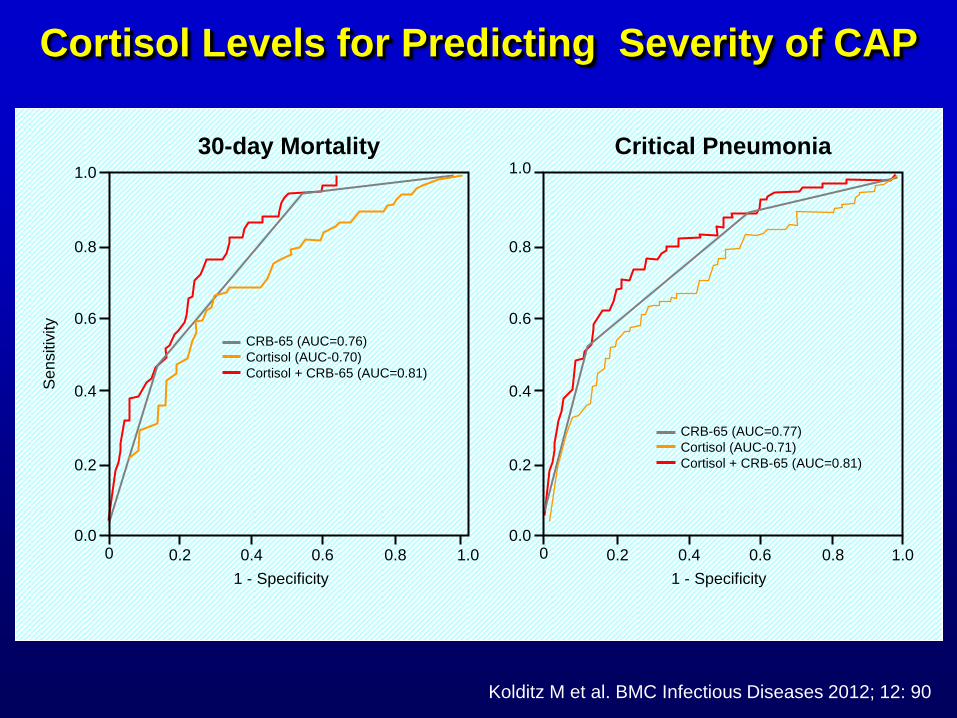
1.0
0.8
0.6
0.2
0.0
Se
nsitiv
ity
0.4
0 0.2
1 - Specificity
0.4 0.6 0.8 1.0
CRB-65 (AUC=0.76)
Cortisol (AUC-0.70)
Cortisol + CRB-65 (AUC=0.81)
1.0
0.8
0.6
0.2
0.0
0.4
0 0.2
1 - Specificity
0.4 0.6 0.8 1.0
CRB-65 (AUC=0.77)
Cortisol (AUC-0.71)
Cortisol + CRB-65 (AUC=0.81)
30-day Mortality Critical Pneumonia
Kolditz M et al. BMC Infectious Diseases 2012; 12: 90
Cortisol Levels for Predicting Severity of CAP
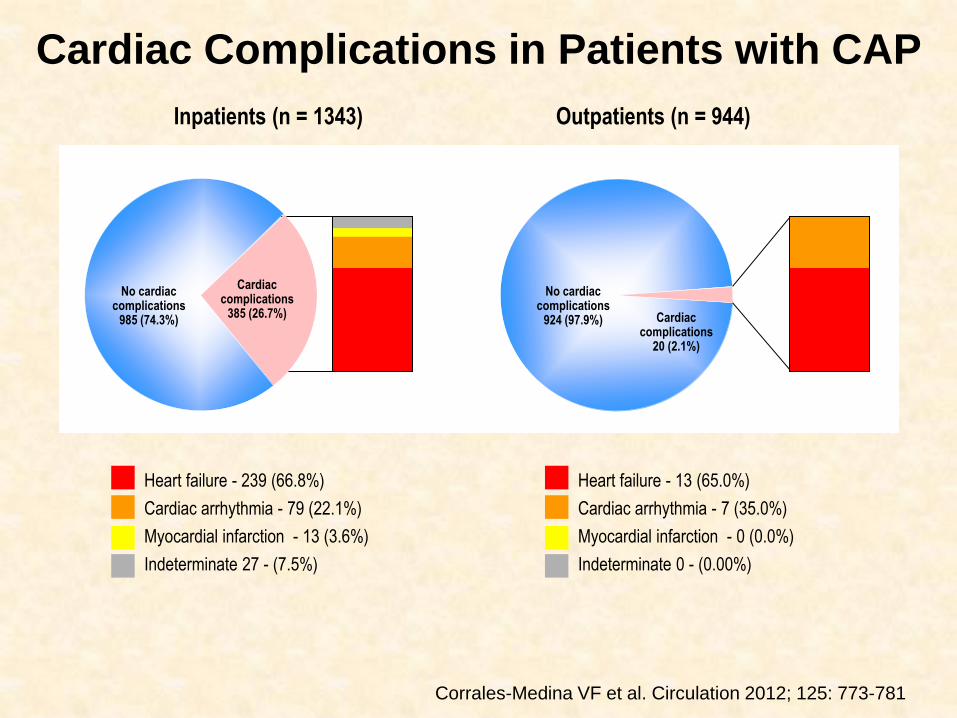
Heart failure - 239 (66.8%)
Cardiac arrhythmia - 79 (22.1%)
Myocardial infarction - 13 (3.6%)
Indeterminate 27 - (7.5%)
Inpatients (n = 1343)
Heart failure - 13 (65.0%)
Cardiac arrhythmia - 7 (35.0%)
Myocardial infarction - 0 (0.0%)
Indeterminate 0 - (0.00%)
Cardiac complications
385 (26.7%)
No cardiac complications
985 (74.3%) Cardiac complications
20 (2.1%)
No cardiac complications
924 (97.9%)
Outpatients (n = 944)
Cardiac Complications in Patients with CAP
Corrales-Medina VF et al. Circulation 2012; 125: 773-781
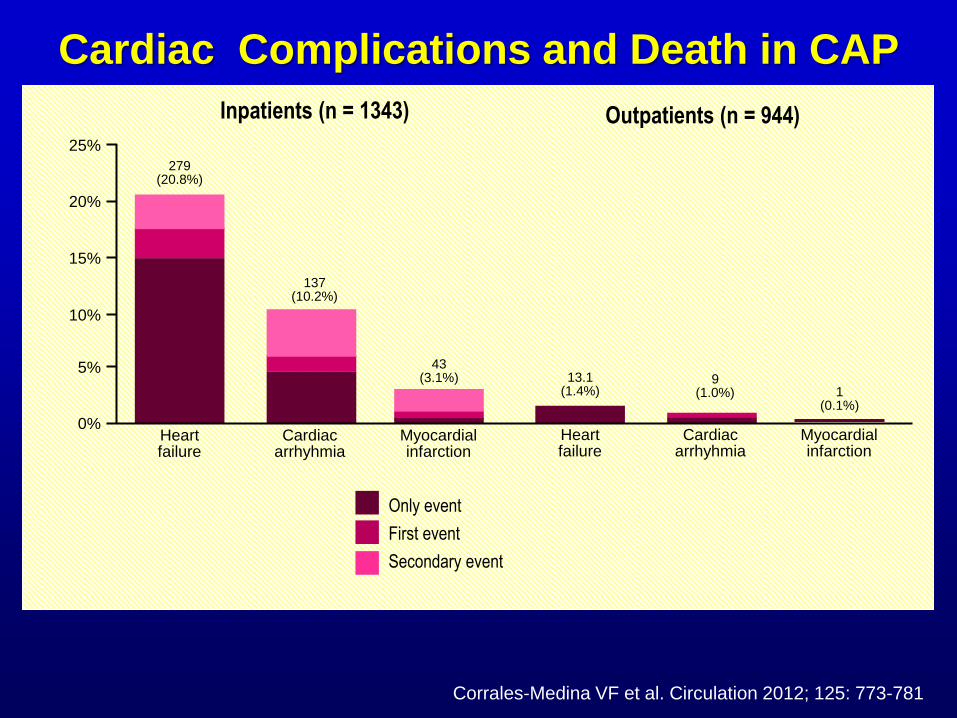
25%
20%
15%
10%
5%
0% Heart failure
279 (20.8%)
Cardiac arrhyhmia
137 (10.2%)
Myocardial infarction
43 (3.1%)
Inpatients (n = 1343) Outpatients (n = 944)
Heart failure
13.1 (1.4%)
Cardiac arrhyhmia
9 (1.0%)
Myocardial infarction
1 (0.1%)
Only event
First event
Secondary event
Corrales-Medina VF et al. Circulation 2012; 125: 773-781
Cardiac Complications and Death in CAP
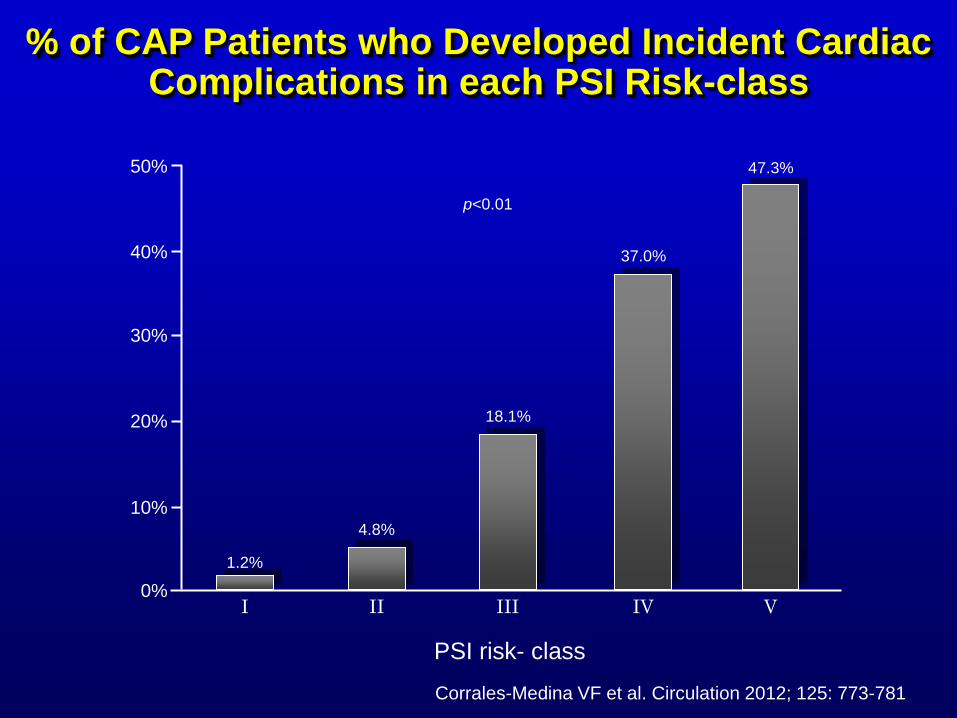
30%
20%
40%
50%
10%
0% I
1.2%
II
4.8%
III
18.1%
IV
37.0%
PSI risk- class
V
47.3%
p<0.01
% of CAP Patients who Developed Incident Cardiac Complications in each PSI Risk-class
Corrales-Medina VF et al. Circulation 2012; 125: 773-781
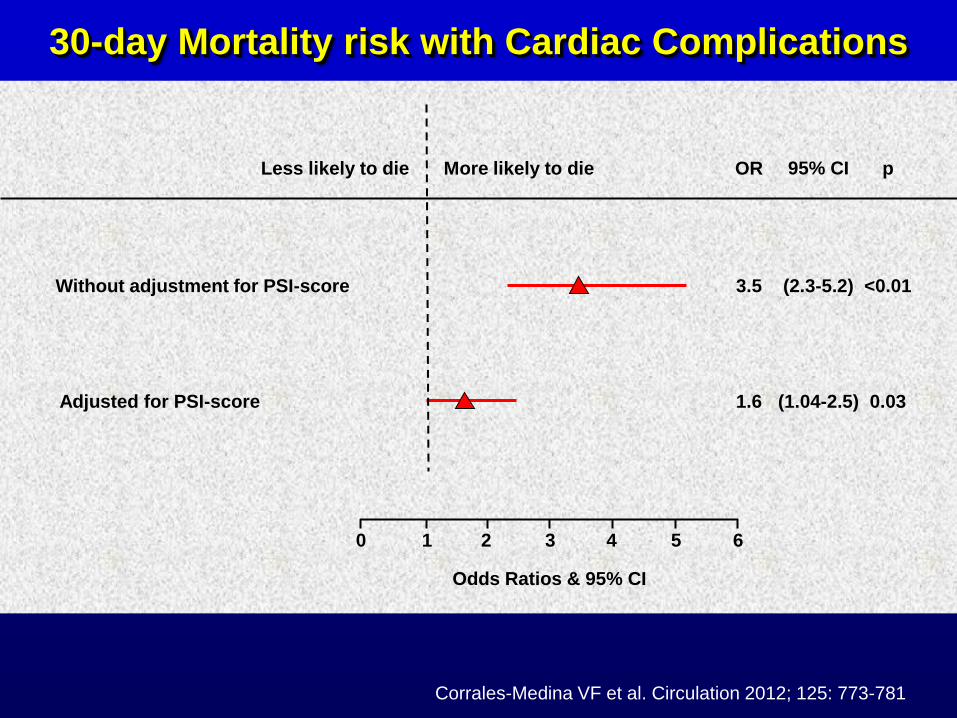
6 5 4 3 2 1 0
Odds Ratios & 95% CI
Adjusted for PSI-score 1.6 (1.04-2.5) 0.03
Without adjustment for PSI-score 3.5 (2.3-5.2) <0.01
OR 95% CI p Less likely to die More likely to die
Corrales-Medina VF et al. Circulation 2012; 125: 773-781
30-day Mortality risk with Cardiac Complications
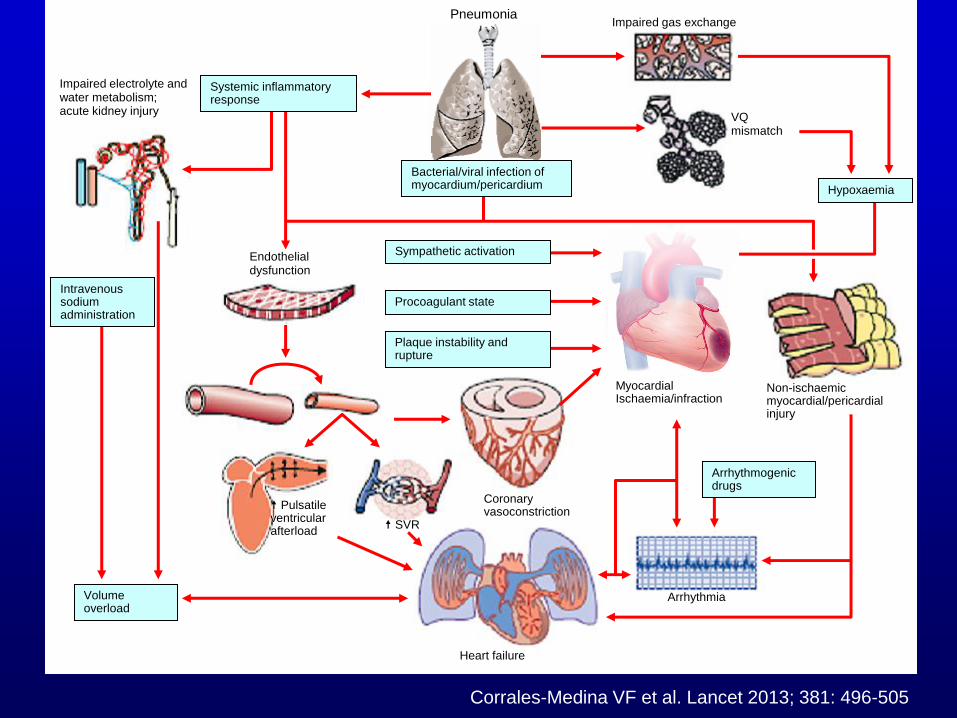
Pneumonia
Impaired electrolyte and water metabolism; acute kidney injury
Endothelial dysfunction
Non-ischaemic myocardial/pericardial injury
Impaired gas exchange
VQ mismatch
Myocardial Ischaemia/infraction
Coronary vasoconstriction
Arrhythmia
Heart failure
SVR
Pulsatile ventricular afterload
Volume overload
Bacterial/viral infection of myocardium/pericardium
Sympathetic activation
Procoagulant state
Plaque instability and rupture
Hypoxaemia
Systemic inflammatory response
Arrhythmogenic drugs
Intravenous sodium administration
Corrales-Medina VF et al. Lancet 2013; 381: 496-505
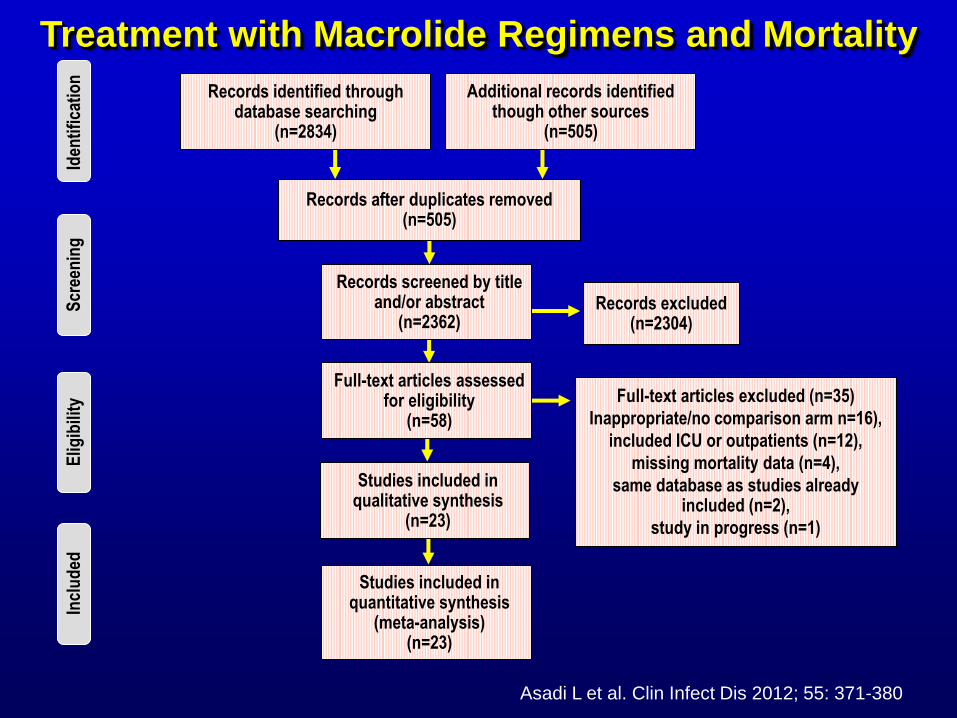
Records after duplicates removed (n=505)
Additional records identified though other sources
(n=505)
Records identified through database searching
(n=2834)
Records screened by title and/or abstract
(n=2362) Records excluded
(n=2304)
Full-text articles assessed for eligibility
(n=58)
Studies included in qualitative synthesis
(n=23)
Studies included in quantitative synthesis
(meta-analysis) (n=23)
Full-text articles excluded (n=35)
Inappropriate/no comparison arm n=16),
included ICU or outpatients (n=12),
missing mortality data (n=4),
same database as studies already included (n=2),
study in progress (n=1)
Elig
ibili
ty
Incl
ud
ed
Scr
een
ing
Id
enti
fica
tio
n
Asadi L et al. Clin Infect Dis 2012; 55: 371-380
Treatment with Macrolide Regimens and Mortality
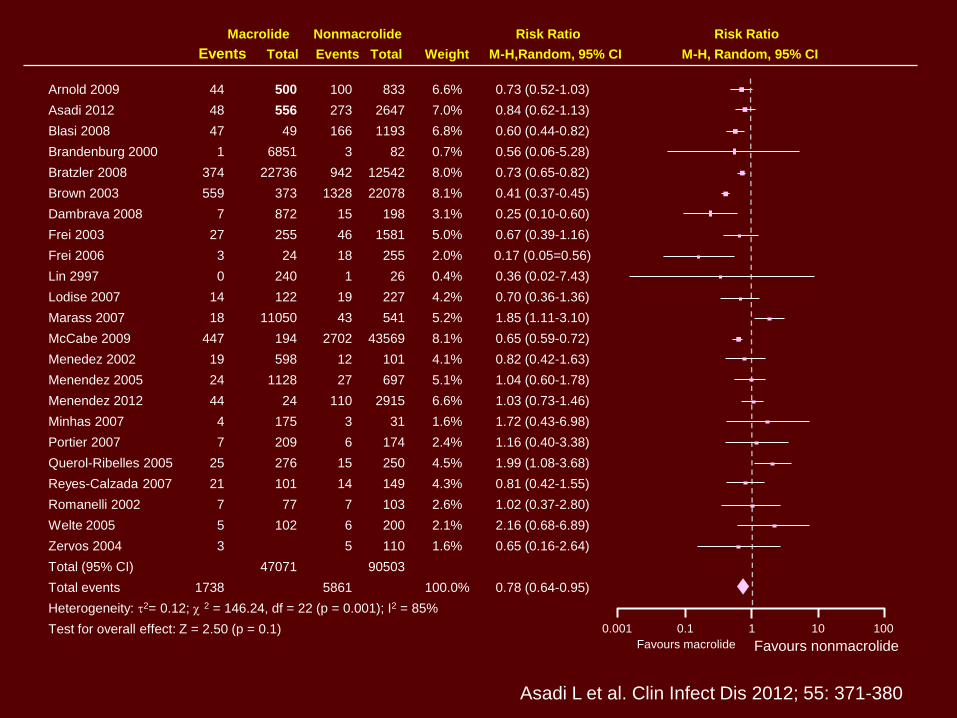
Arnold 2009
Asadi 2012
Blasi 2008
Brandenburg 2000
Bratzler 2008
Brown 2003
Dambrava 2008
Frei 2003
Frei 2006
Lin 2997
Lodise 2007
Marass 2007
McCabe 2009
Menedez 2002
Menendez 2005
Menendez 2012
Minhas 2007
Portier 2007
Querol-Ribelles 2005
Reyes-Calzada 2007
Romanelli 2002
Welte 2005
Zervos 2004
Total (95% CI)
Total events
Heterogeneity: t2= 0.12; 2 = 146.24, df = 22 (p = 0.001); I2 = 85%
Test for overall effect: Z = 2.50 (p = 0.1)
44
48
47
1
374
559
7
27
3
0
14
18
447
19
24
44
4
7
25
21
7
5
3
1738
Events Total Events Total Weight M-H,Random, 95% CI
Macrolide Nonmacrolide Risk Ratio Risk Ratio
M-H, Random, 95% CI
500
556
49
6851
22736
373
872
255
24
240
122
11050
194
598
1128
24
175
209
276
101
77
102
47071
100
273
166
3
942
1328
15
46
18
1
19
43
2702
12
27
110
3
6
15
14
7
6
5
5861
833
2647
1193
82
12542
22078
198
1581
255
26
227
541
43569
101
697
2915
31
174
250
149
103
200
110
90503
6.6%
7.0%
6.8%
0.7%
8.0%
8.1%
3.1%
5.0%
2.0%
0.4%
4.2%
5.2%
8.1%
4.1%
5.1%
6.6%
1.6%
2.4%
4.5%
4.3%
2.6%
2.1%
1.6%
100.0%
0.73 (0.52-1.03)
0.84 (0.62-1.13)
0.60 (0.44-0.82)
0.56 (0.06-5.28)
0.73 (0.65-0.82)
0.41 (0.37-0.45)
0.25 (0.10-0.60)
0.67 (0.39-1.16)
0.17 (0.05=0.56)
0.36 (0.02-7.43)
0.70 (0.36-1.36)
1.85 (1.11-3.10)
0.65 (0.59-0.72)
0.82 (0.42-1.63)
1.04 (0.60-1.78)
1.03 (0.73-1.46)
1.72 (0.43-6.98)
1.16 (0.40-3.38)
1.99 (1.08-3.68)
0.81 (0.42-1.55)
1.02 (0.37-2.80)
2.16 (0.68-6.89)
0.65 (0.16-2.64)
0.78 (0.64-0.95)
0.001 0.1 1 10
Favours macrolide
100
Favours nonmacrolide
Asadi L et al. Clin Infect Dis 2012; 55: 371-380
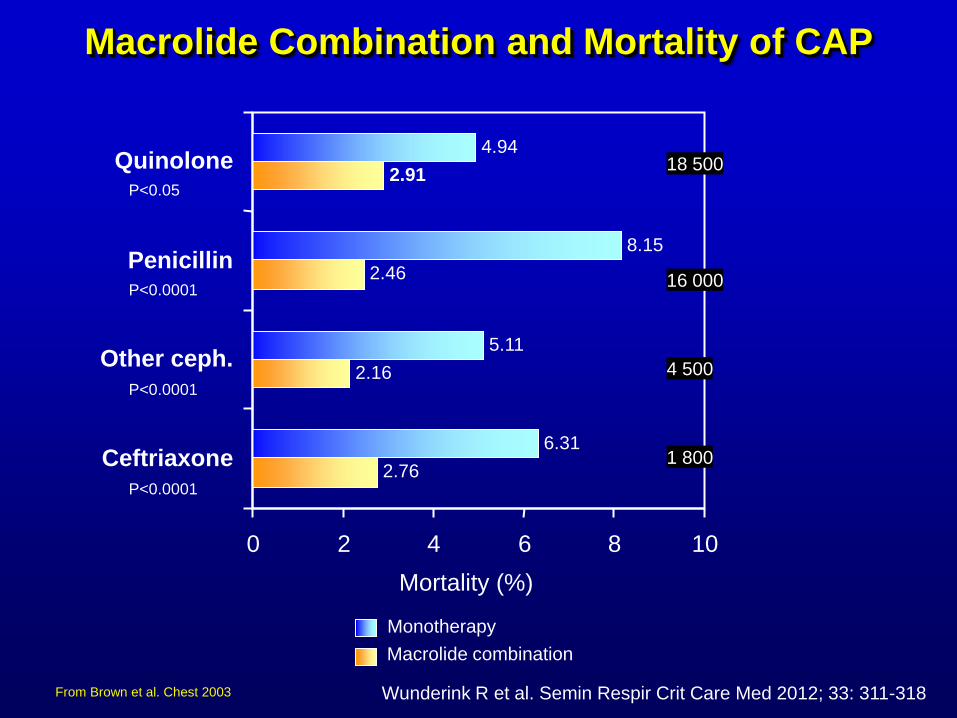
2.76
2.16
2.46
2.91
6.31
5.11
8.15
4.94
0 2 4 6 8
Mortality (%)
Ceftriaxone
Other ceph.
Penicillin
Quinolone
10
Monotherapy
Macrolide combination
18 500
16 000
4 500
1 800
P<0.05
P<0.0001
P<0.0001
P<0.0001
Macrolide Combination and Mortality of CAP
Wunderink R et al. Semin Respir Crit Care Med 2012; 33: 311-318 From Brown et al. Chest 2003
12
10
18
20
8
16
14
6
4
2
0
30 D
ay e
vent
rate
s (
%)
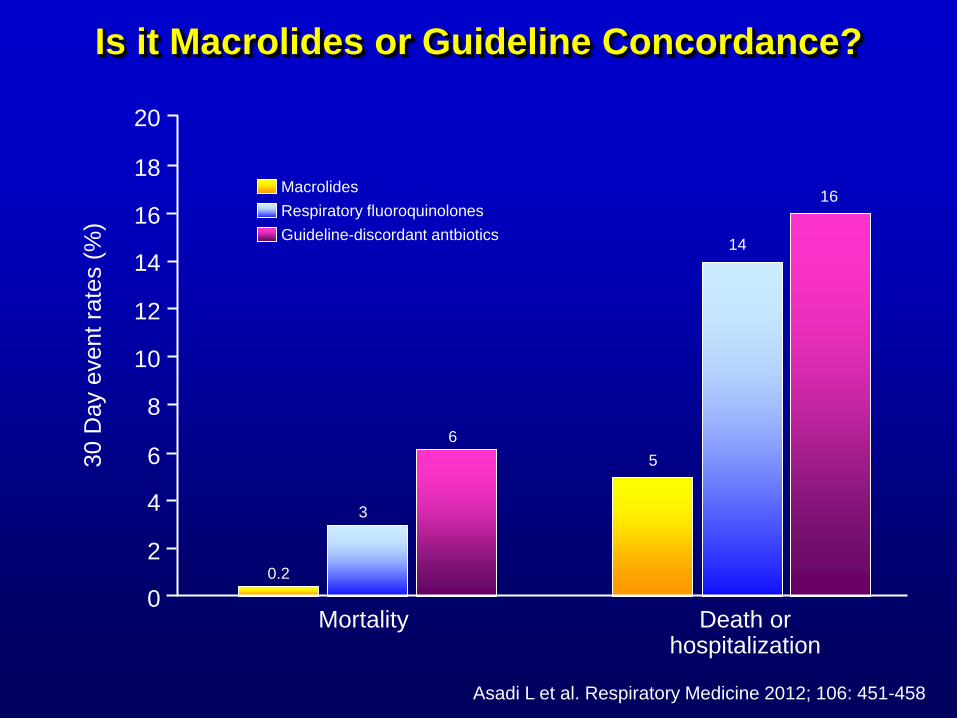
Mortality Death or hospitalization
0.2
3
6
5
14
16 Macrolides
Respiratory fluoroquinolones
Guideline-discordant antbiotics
Is it Macrolides or Guideline Concordance?
Asadi L et al. Respiratory Medicine 2012; 106: 451-458
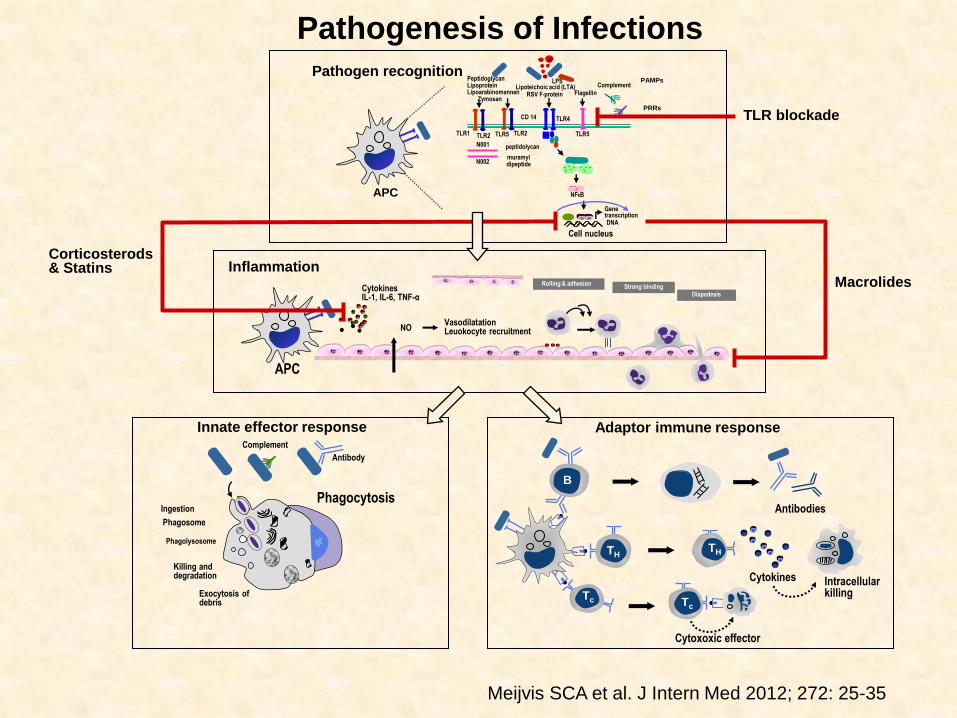
APC
Peptidoglycan Lipoprotein Lipoarabinomannan Zymosan
Lipoteichoic acid (LTA) RSV F-protein Flagellin
Complement PAMPs
Gene transcription DNA
TLR1 TLR2 TLR5 TLR2 TLR5
TLR4
peptidolycan N001
N002
CD 14
muramyl dipeptide
PRRs
LPS
Cytokines IL-1, IL-6, TNF-α
NFkB
Rolling & adhesion Strong binding
Cell nucleus
Diapedesis
NO Vasodilatation Leuokocyte recruitment
Inflammation
APC
Complement
Antibody
Ingestion
Phagosome
Innate effector response
Exocytosis of debris
Phagolysosome
Killing and degradation
Phagocytosis
Pathogen recognition
B
TH
Adaptor immune response
TH
Tc Tc
Corticosterods & Statins
Antibodies
Intracellular killing
Cytokines
Cytoxoxic effector
TLR blockade
Macrolides
Meijvis SCA et al. J Intern Med 2012; 272: 25-35
Pathogenesis of Infections
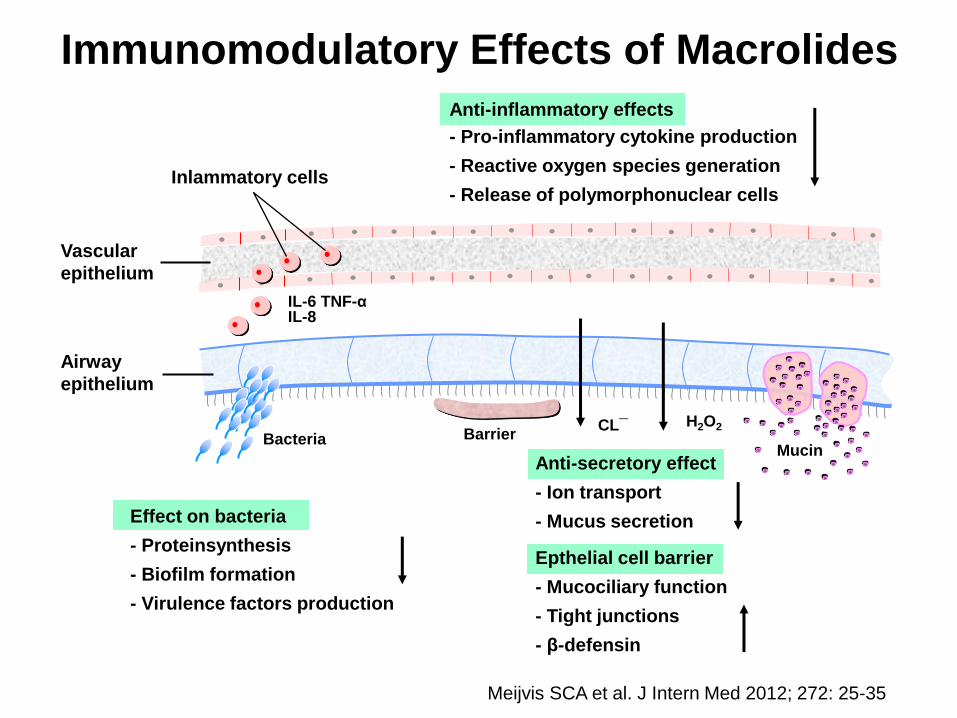
Immunomodulatory Effects of Macrolides
Vascular
epithelium
Inlammatory cells
IL-6 TNF-α IL-8
Barrier Bacteria CL¯ H2O2
Airway
epithelium
Mucin
- Pro-inflammatory cytokine production
- Reactive oxygen species generation
- Release of polymorphonuclear cells
Effect on bacteria
- Proteinsynthesis
- Biofilm formation
- Virulence factors production
Anti-secretory effect
- Ion transport
- Mucus secretion
Epthelial cell barrier
- Mucociliary function
- Tight junctions
- β-defensin
Meijvis SCA et al. J Intern Med 2012; 272: 25-35
Anti-inflammatory effects
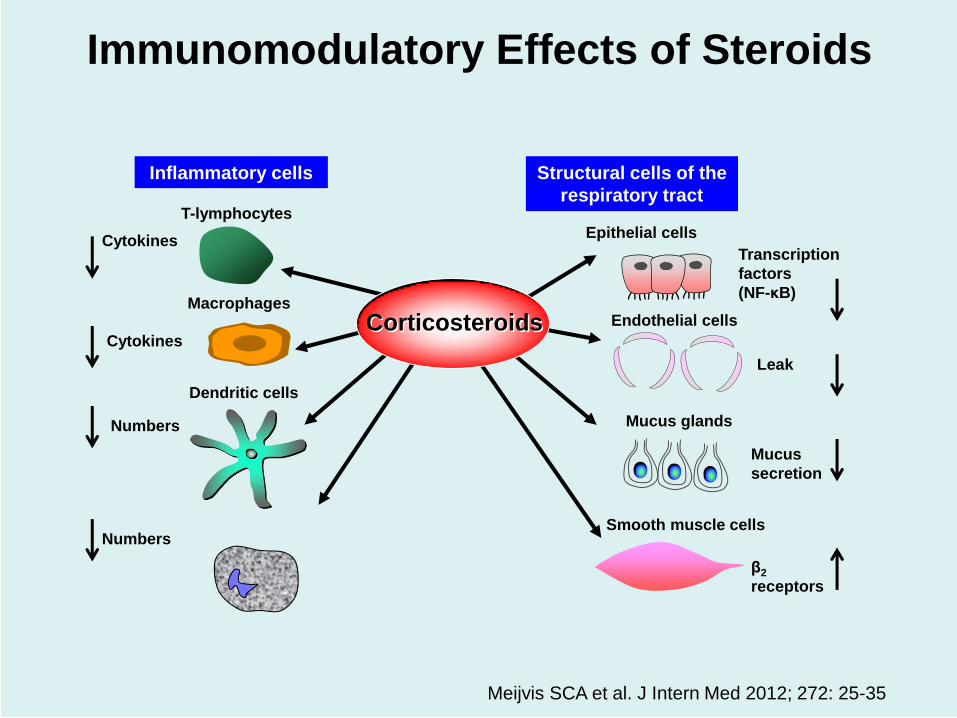
Cytokines
Cytokines
Numbers
Numbers
T-lymphocytes
Macrophages
Dendritic cells
Smooth muscle cells
β2
receptors
Mucus
secretion
Leak
Transcription
factors
(NF-κB)
Mucus glands
Endothelial cells
Inflammatory cells Structural cells of the
respiratory tract
Epithelial cells
Corticosteroids
Immunomodulatory Effects of Steroids
Meijvis SCA et al. J Intern Med 2012; 272: 25-35
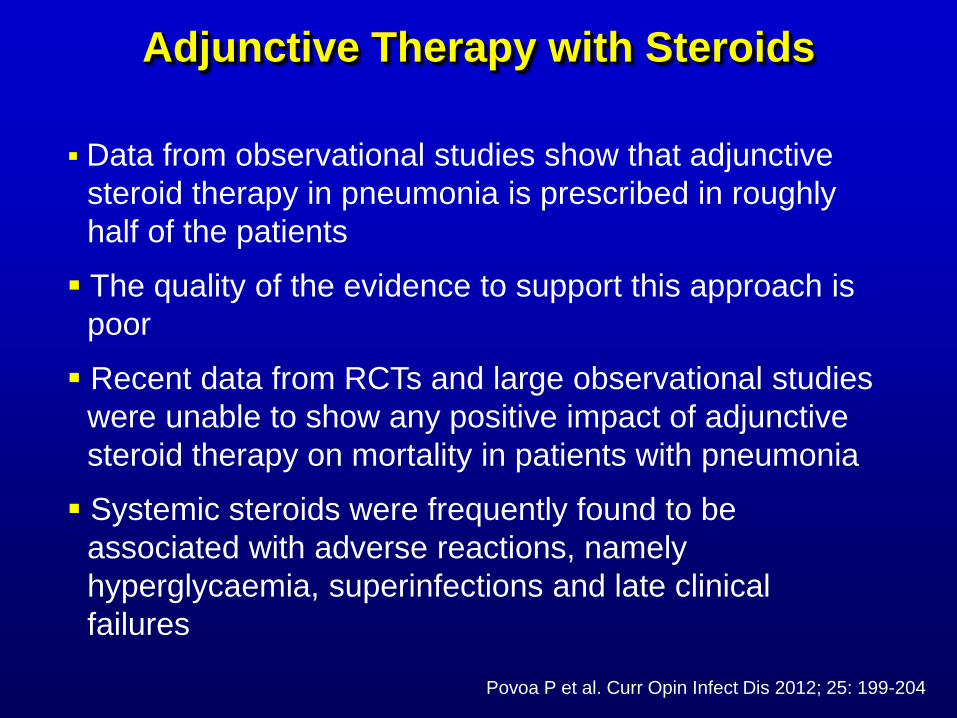
Adjunctive Therapy with Steroids
Data from observational studies show that adjunctive
steroid therapy in pneumonia is prescribed in roughly
half of the patients
The quality of the evidence to support this approach is
poor
Recent data from RCTs and large observational studies
were unable to show any positive impact of adjunctive
steroid therapy on mortality in patients with pneumonia
Systemic steroids were frequently found to be
associated with adverse reactions, namely
hyperglycaemia, superinfections and late clinical
failures
Povoa P et al. Curr Opin Infect Dis 2012; 25: 199-204
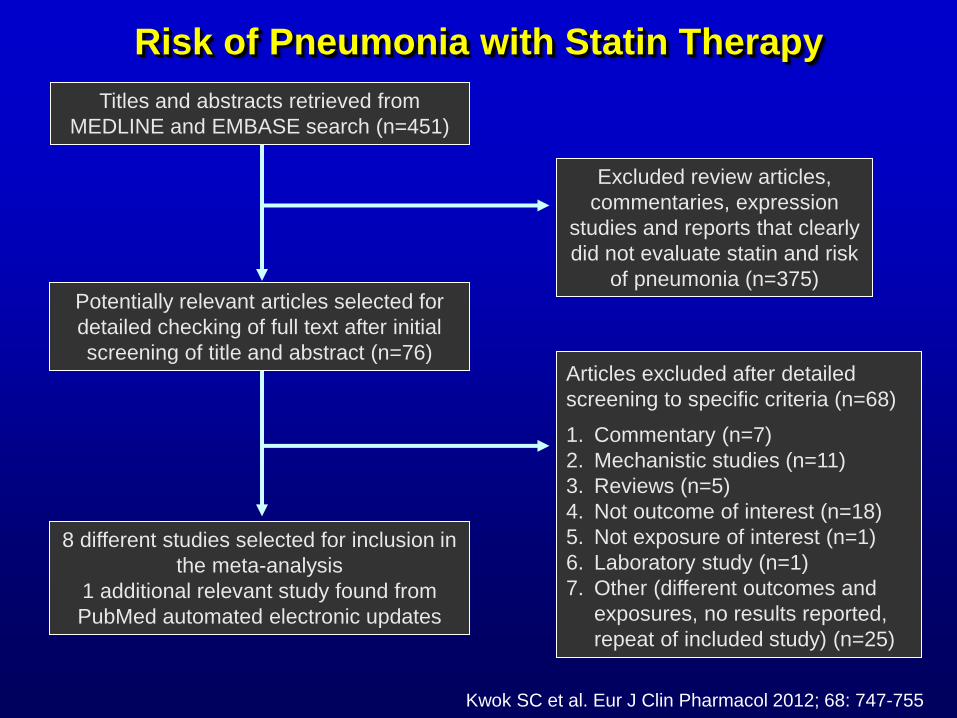
Excluded review articles,
commentaries, expression
studies and reports that clearly
did not evaluate statin and risk
of pneumonia (n=375)
1. Commentary (n=7)
2. Mechanistic studies (n=11)
3. Reviews (n=5)
4. Not outcome of interest (n=18)
5. Not exposure of interest (n=1)
6. Laboratory study (n=1)
7. Other (different outcomes and
exposures, no results reported,
repeat of included study) (n=25)
Articles excluded after detailed
screening to specific criteria (n=68)
Titles and abstracts retrieved from
MEDLINE and EMBASE search (n=451)
Potentially relevant articles selected for
detailed checking of full text after initial
screening of title and abstract (n=76)
8 different studies selected for inclusion in
the meta-analysis
1 additional relevant study found from
PubMed automated electronic updates
Kwok SC et al. Eur J Clin Pharmacol 2012; 68: 747-755
Risk of Pneumonia with Statin Therapy
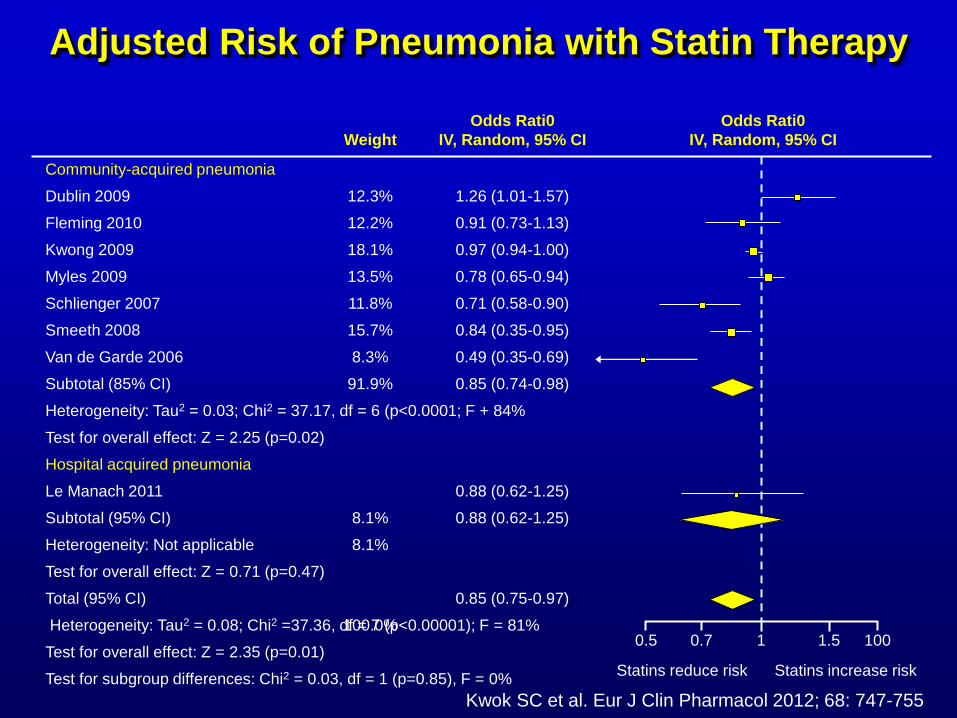
Adjusted Risk of Pneumonia with Statin Therapy
Community-acquired pneumonia
Dublin 2009
Fleming 2010
Kwong 2009
Myles 2009
Schlienger 2007
Smeeth 2008
Van de Garde 2006
Subtotal (85% CI)
Heterogeneity: Tau2 = 0.03; Chi2 = 37.17, df = 6 (p<0.0001; F + 84%
Test for overall effect: Z = 2.25 (p=0.02)
Hospital acquired pneumonia
Le Manach 2011
Subtotal (95% CI)
Heterogeneity: Not applicable
Test for overall effect: Z = 0.71 (p=0.47)
Total (95% CI)
Heterogeneity: Tau2 = 0.08; Chi2 =37.36, df = 7 (p<0.00001); F = 81%
Test for overall effect: Z = 2.35 (p=0.01)
Test for subgroup differences: Chi2 = 0.03, df = 1 (p=0.85), F = 0%
0.5 0.7 1 1.5
Statins reduce risk
100
Statins increase risk
12.3%
12.2%
18.1%
13.5%
11.8%
15.7%
8.3%
91.9%
8.1%
8.1%
100.0%
Weight
Odds Rati0
IV, Random, 95% CI
1.26 (1.01-1.57)
0.91 (0.73-1.13)
0.97 (0.94-1.00)
0.78 (0.65-0.94)
0.71 (0.58-0.90)
0.84 (0.35-0.95)
0.49 (0.35-0.69)
0.85 (0.74-0.98)
0.88 (0.62-1.25)
0.88 (0.62-1.25)
0.85 (0.75-0.97)
Odds Rati0
IV, Random, 95% CI
Kwok SC et al. Eur J Clin Pharmacol 2012; 68: 747-755
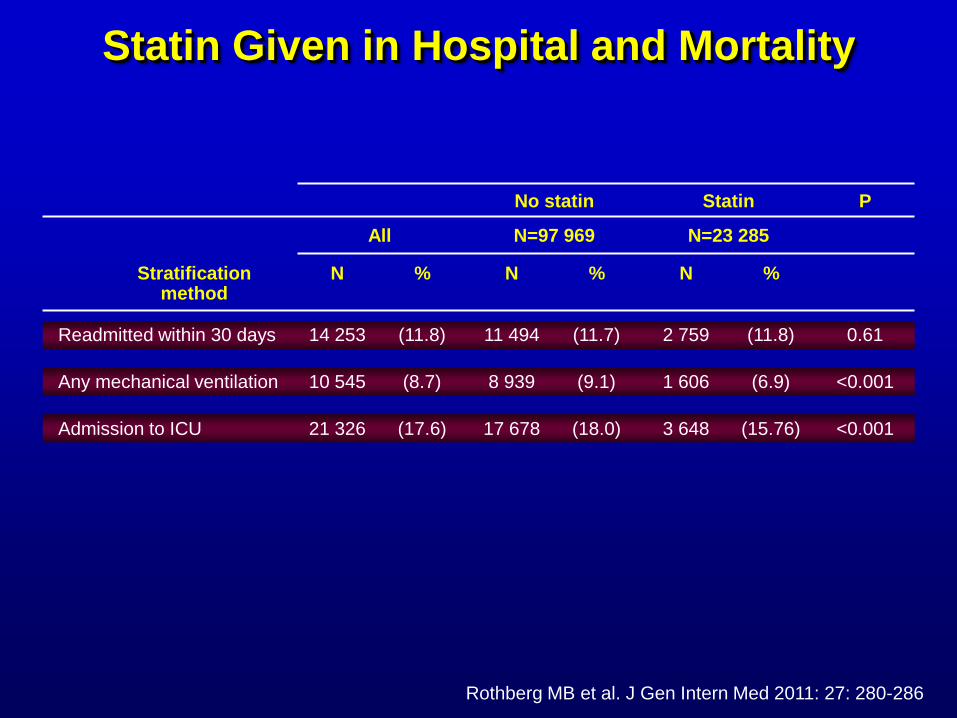
Readmitted within 30 days
Any mechanical ventilation
Admission to ICU
Stratification method
14 253
10 545
21 326
N
(11.8)
(8.7)
(17.6)
%
All
11 494
8 939
17 678
N
(11.7)
(9.1)
(18.0)
%
N=97 969
2 759
1 606
3 648
N
(11.8)
(6.9)
(15.76)
%
N=23 285
0.61
<0.001
<0.001
P No statin Statin
Rothberg MB et al. J Gen Intern Med 2011: 27: 280-286
Statin Given in Hospital and Mortality
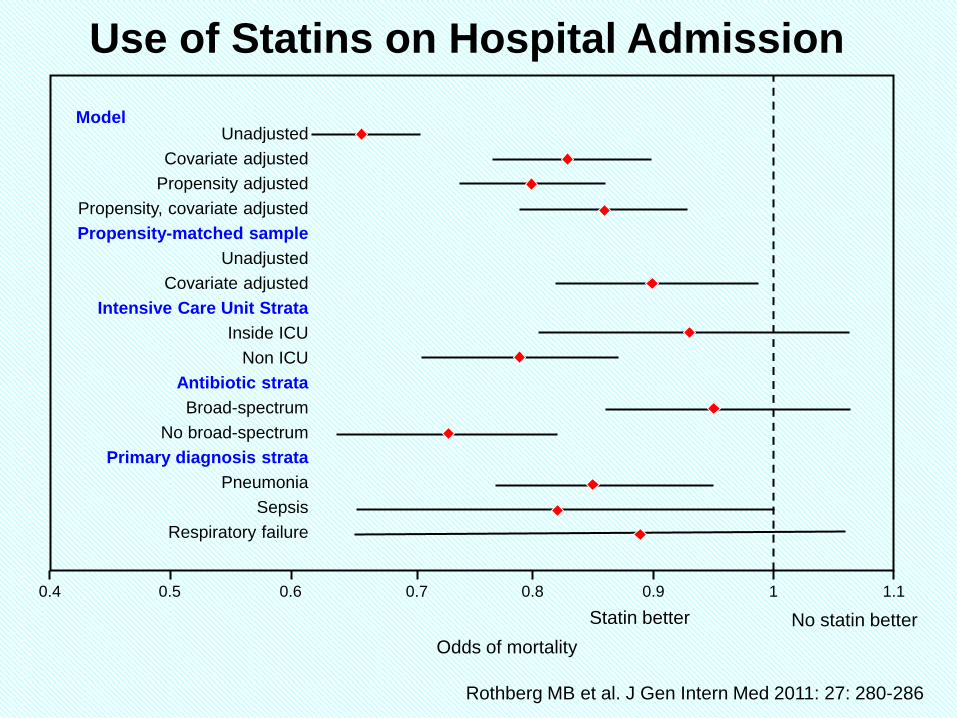
0.8 0.7
Unadjusted
Covariate adjusted
Propensity adjusted
Propensity, covariate adjusted
Propensity-matched sample
Unadjusted
Covariate adjusted
Intensive Care Unit Strata
Inside ICU
Non ICU
Antibiotic strata
Broad-spectrum
No broad-spectrum
Primary diagnosis strata
Pneumonia
Sepsis
Respiratory failure
Odds of mortality
0.6 0.5 0.9 0.4 1 1.1
Statin better No statin better
Model
Rothberg MB et al. J Gen Intern Med 2011: 27: 280-286
Use of Statins on Hospital Admission
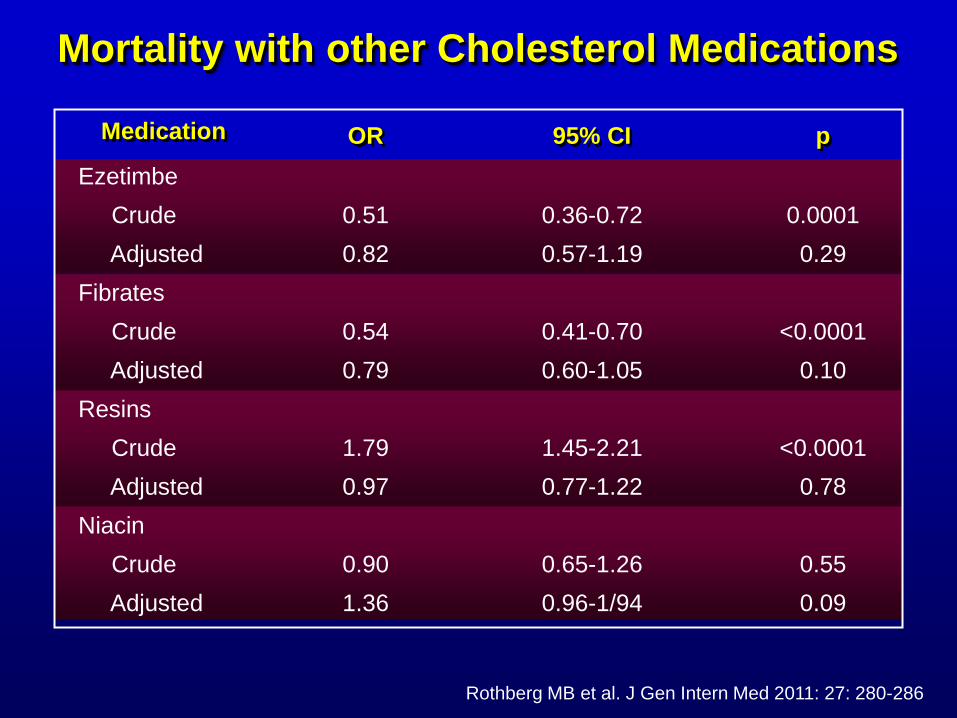
Mortality with other Cholesterol Medications
Ezetimbe
Crude
Adjusted
Fibrates
Crude
Adjusted
Resins
Crude
Adjusted
Niacin
Crude
Adjusted
Medication
0.51
0.82
0.54
0.79
1.79
0.97
0.90
1.36
0.36-0.72
0.57-1.19
0.41-0.70
0.60-1.05
1.45-2.21
0.77-1.22
0.65-1.26
0.96-1/94
0.0001
0.29
<0.0001
0.10
<0.0001
0.78
0.55
0.09
OR 95% CI p
Rothberg MB et al. J Gen Intern Med 2011: 27: 280-286
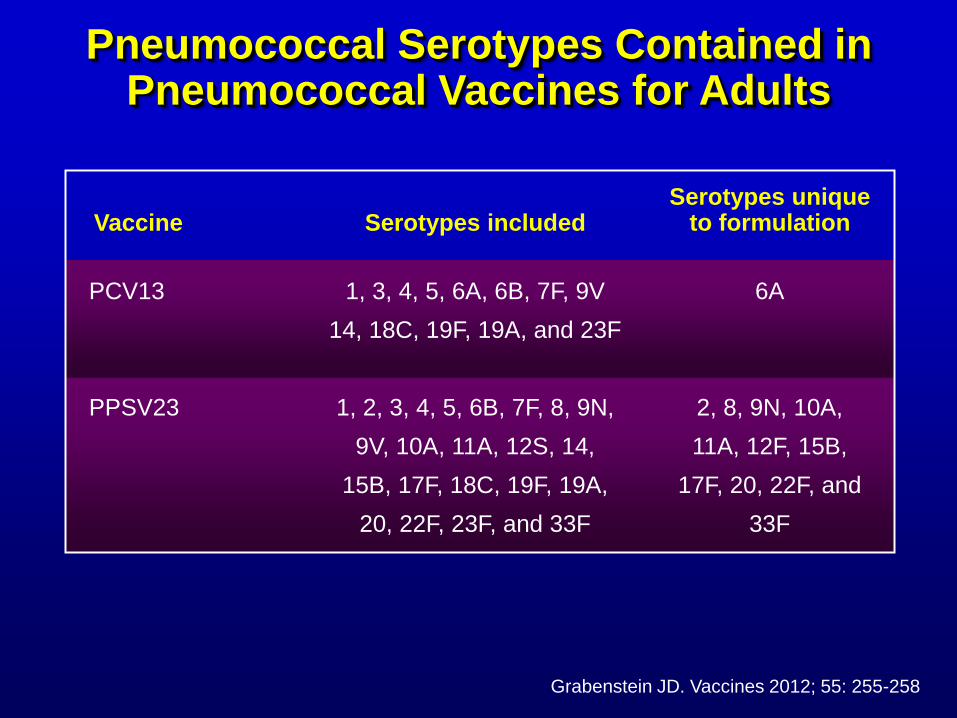
Pneumococcal Serotypes Contained in Pneumococcal Vaccines for Adults
1, 3, 4, 5, 6A, 6B, 7F, 9V
14, 18C, 19F, 19A, and 23F
1, 2, 3, 4, 5, 6B, 7F, 8, 9N,
9V, 10A, 11A, 12S, 14,
15B, 17F, 18C, 19F, 19A,
20, 22F, 23F, and 33F
6A
2, 8, 9N, 10A,
11A, 12F, 15B,
17F, 20, 22F, and
33F
PCV13
PPSV23
Vaccine Serotypes included Serotypes unique
to formulation
Grabenstein JD. Vaccines 2012; 55: 255-258
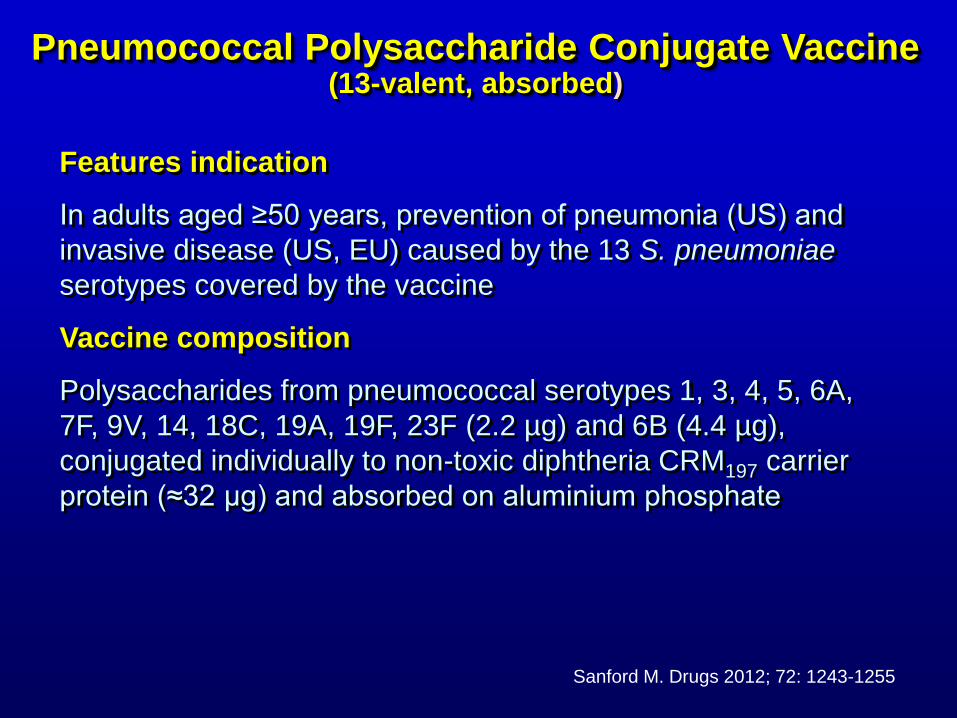
Pneumococcal Polysaccharide Conjugate Vaccine (13-valent, absorbed)
Features indication
In adults aged ≥50 years, prevention of pneumonia (US) and
invasive disease (US, EU) caused by the 13 S. pneumoniae
serotypes covered by the vaccine
Vaccine composition
Polysaccharides from pneumococcal serotypes 1, 3, 4, 5, 6A,
7F, 9V, 14, 18C, 19A, 19F, 23F (2.2 µg) and 6B (4.4 µg),
conjugated individually to non-toxic diphtheria CRM197 carrier
protein (≈32 µg) and absorbed on aluminium phosphate
Sanford M. Drugs 2012; 72: 1243-1255
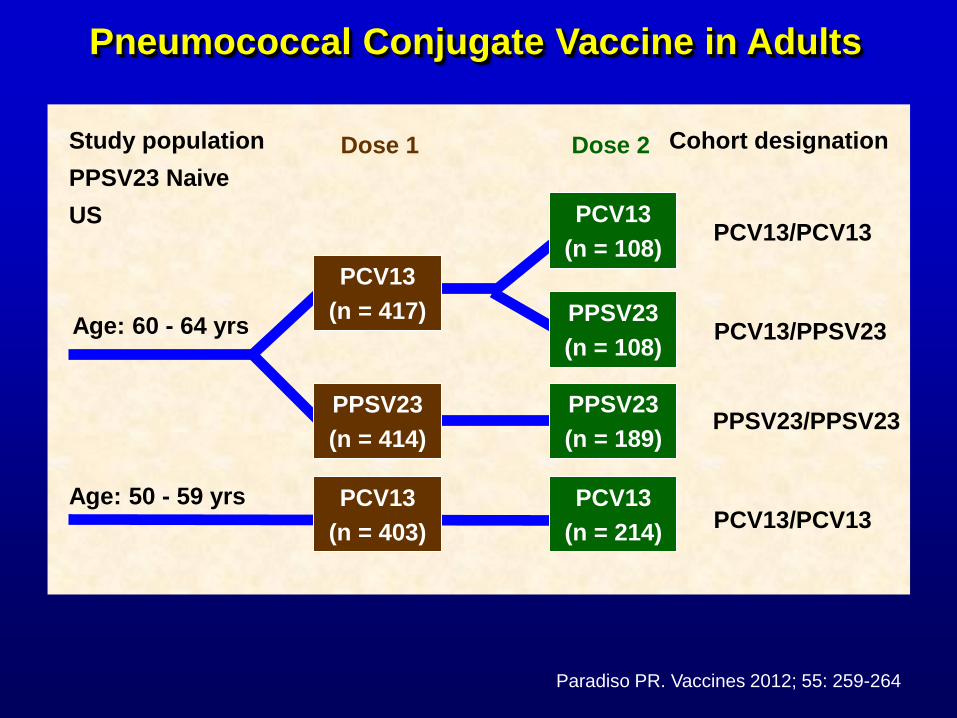
PCV13
(n = 417)
PCV13
(n = 403)
PPSV23
(n = 414)
PCV13
(n = 108)
PPSV23
(n = 108)
PPSV23
(n = 189)
PCV13
(n = 214)
Dose 1 Dose 2
Age: 60 - 64 yrs
Age: 50 - 59 yrs
Study population
PPSV23 Naive
US
Cohort designation
PCV13/PCV13
PCV13/PPSV23
PPSV23/PPSV23
PCV13/PCV13
Paradiso PR. Vaccines 2012; 55: 259-264
Pneumococcal Conjugate Vaccine in Adults
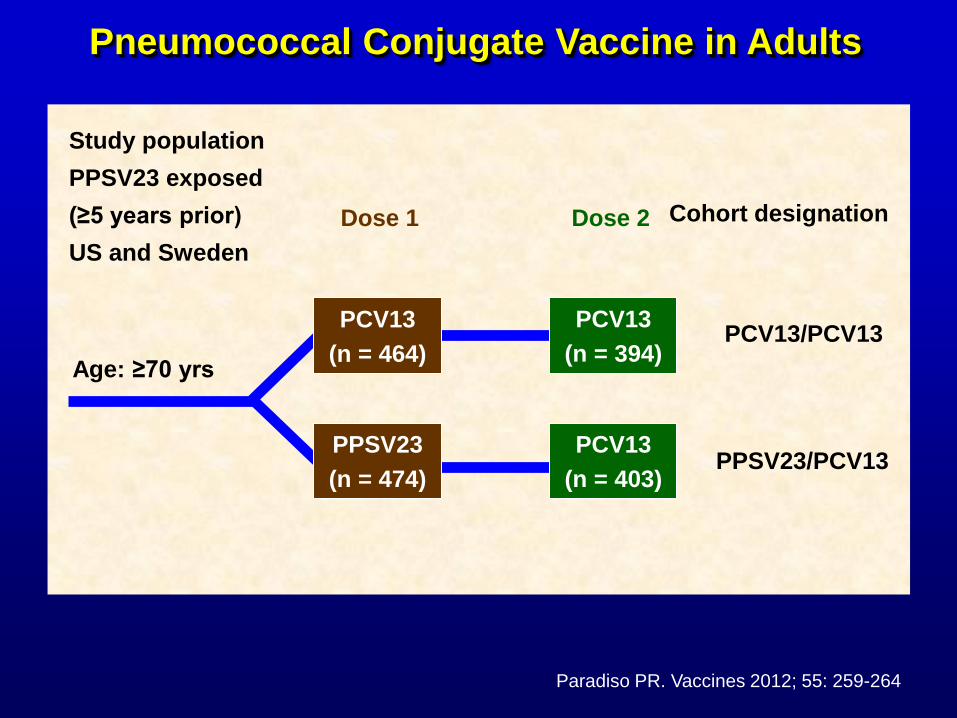
Study population
PPSV23 exposed
(≥5 years prior)
US and Sweden
Cohort designation
Age: ≥70 yrs
Dose 1 Dose 2
PPSV23
(n = 474)
PCV13
(n = 464)
PCV13
(n = 394)
PCV13
(n = 403)
PCV13/PCV13
PPSV23/PCV13
Pneumococcal Conjugate Vaccine in Adults
Paradiso PR. Vaccines 2012; 55: 259-264
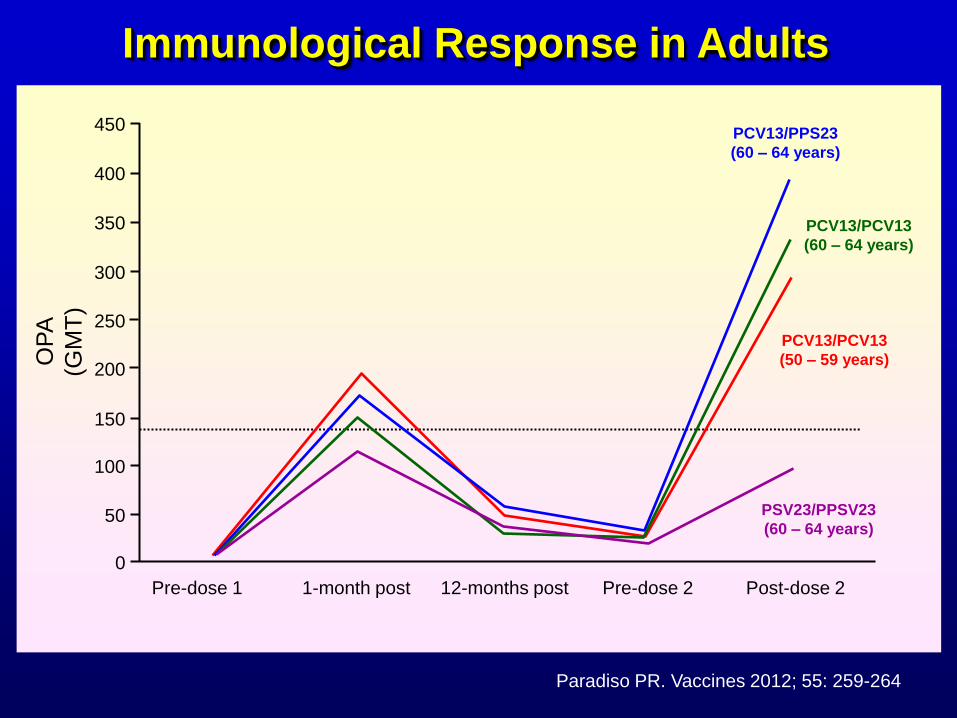
0
300
350
400
450
250
200
150
100
50
Pre-dose 1 1-month post 12-months post Pre-dose 2 Post-dose 2
PCV13/PCV13
(50 – 59 years)
PCV13/PPS23
(60 – 64 years)
PCV13/PCV13
(60 – 64 years)
PSV23/PPSV23
(60 – 64 years)
OP
A
(GM
T)
Immunological Response in Adults
Paradiso PR. Vaccines 2012; 55: 259-264
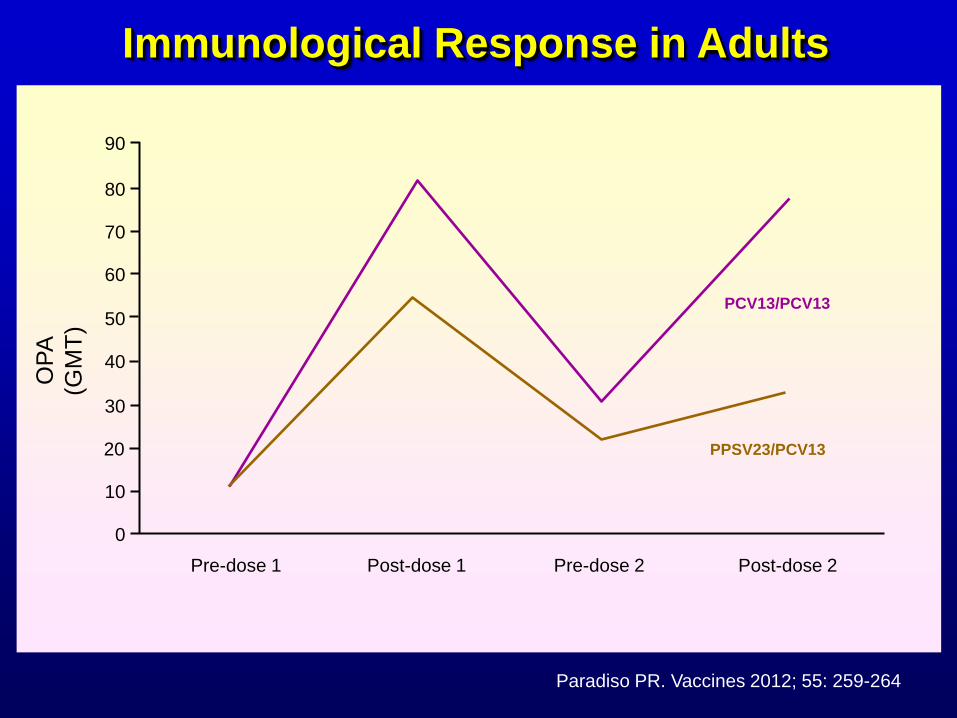
60
70
80
90
50
40
30
10
0
OP
A
(GM
T)
20
Pre-dose 1 Post-dose 1 Pre-dose 2 Post-dose 2
PCV13/PCV13
PPSV23/PCV13
Immunological Response in Adults
Paradiso PR. Vaccines 2012; 55: 259-264
Pneumonia is a leading cause of death and
continues to have significant medical impact
The concept of HCAP and its treatment are
problematic and evolving – more important to
look at severity of the infection and presence of
risk factors for MDR pathogens than routinely
treating for them
Biomarkers may be useful to confirm bacterial
cause, assess severity and guide antibiotic use
and CRP and PCT are currently most promising
Issues Regarding Pneumonia Arising from Recent Studies
Issues Regarding Pneumonia Arising from Recent Studies
Treatment that is guideline compliant is
associated with lower mortality and
macrolide-based combination therapy may
have an advantage over fluoroquinolone
monotherapy
Issues with regard to adjunctive therapy still
await further clarification
Pneumococcal conjugate vaccine is now
licenced for use in adults and the indications
may expand in the future