Embed Size (px)
Citation preview
maintenance & asset management vol 27 no 3 | ME | May/June 2012 | 41
THE BHOPAL DISASTER – learning from failures and evaluating risk
This particular gas then enters the lungs,
where it reacts with bodily fl uids, fi lling the
lungs and drowning a person ‘from the
inside’. This was a disaster the town might
eventually (over a long period of time and
with help) have come to terms with, were it
not for the following facts:
� The deaths did not stop at 3,000 – they are reputed to total 20,000 to date (see earlier) – and to this day approximately 120,000 people continue to suffer from the resulting serious ill health problems.
� ‘It was an accident waiting to happen’ – comparisons with the operation of similar plants in US and India indicate that the Bhopal plant was neglected to
INTRODUCTIONIn 1984 Bhopal city, located in the centre
of India with a population of approximately
1.4 million, became one of the best known
places in the world – but for all the wrong
reasons. On December 3rd , when the
town’s people slept, the Union Carbide
Pesticide Plant , about fi ve miles away,
unleashed ‘hell on earth’. Poisonous gases
were released into the atmosphere and
killed some 3,000 people (up-to-date
fi gures indicate 8,000 fatalities at the
time and a further 12,000 since). These
gases included one used in early World
Wars that attacks the ‘wet’ parts of the
body, such as the eyes, mouth and throat.
say the least. Cost cutting measures were introduced at the cost of safety. The value of human life in India was not a priority
� The lies – management at the plant (none of whom died that night) commented that the gas was similar to tear gas and that the effects would fade in three days…some twenty years later the effects are still evident. Union Carbide Corporation and the Indian Government claimed, until 1994, that the gas Methyl Isocyanate (MIC) had no long term effects.
� A vast history of events (since 1976) leading up to the event had gone unheeded by the Corporation, and to this day they have not claimed full responsibility for any wrongdoing; nor does anyone sit in jail for the ‘murder’ of so many.
� Reports issued months prior to the incident by scientists within Union Carbide Corp. warned of the possibility of an accident almost identical to that which happened – reports which were ignored and were never delivered to senior staff.
The aim of the study reported here was
to produce an objective Fault Tree which
would help to identify what could be
learned from this terrible incident and
to show that it was indeed ‘an accident
waiting to happen’, by –
� Discovering the technical causes of the failure from a design and operations perspective.
� Identifying the major consequences of the failure – then and today.
� Using a Fault Tree Analysis and Reliability Block Diagram analysis to determine the probability of such an occurrence happening.
� Recreating, using the Minimal Cut Set method, a ‘new’ Fault Tree Analysis.
� Setting recommendations regarding emergency and contingency planning.
BACKGROUNDIn 1969, the multi-national corporation
(MNC) Union Carbide (UC) established a
small Indian subsidiary – Union Carbide
India Ltd (UCIL) – to manufacture
pesticides at Bhopal in India. The Indian
plant offered competitive advantages
because of its low labour costs, access
to an established and rapidly growing
market and lower operating costs. In
addition UCIL was able to exploit India’s
lax environmental and safety regulations
as the country strived to attract large
MNCs for its developing industrialisation
programme. Until 1979 UCIL imported
Methyl Isocyanate (MIC), a key component
in the production of pesticides, from its
parent company, UC. The new Bhopal
facility was advertised as being designed
and built on the basis of twenty years of
Ab
stra
ct The economic, technological and organizational errors attributable to the root causes of the Bhopal disaster of the 2nd and 3rd of December 1984 are identifi ed. In particular, the technical causes of the failure from a design and operational perspective are highlighted. An investigation is then carried out to determine the major consequences of the failure. Fault Tree Analysis (FTA) and Reliability Block Diagrams (RBDs) are then used to model the causes, and determine the probability of occurrence, of the accident. The innovative aspect of this work is that whereas such techniques are usually employed at an equipment level they are used here to analyse a catastrophic event. Recommendations regarding emergency and contingency planning are then provided. It is concluded that, in future multi-national company (MNC) projects, designs of installations need to be peer reviewed and more stringent environmental, health and safety considerations adopted, and that governments need to be aware of the requirement for segregation of hazardous operations from facilities and adjacent domestic populations.
Keywords: Bhopal, Fault Tree Analysis, Reliability Block Diagrams
Ashraf W. Labib, Portsmouth Business School, University of Portsmouth
Ramesh Champaneri, School of Engineering, Science and Design, Glasgow Caledonian University
42 | May/June 2012 | ME | maintenance & asset management vol 27 no 3
experience with UC’s MIC facility in West
Virginia, USA.
Installation As early as 1972 a UC internal report
had recommended that if additional
MIC plants were to be built they should
be constructed of materials as good as
those used on the West Virginia plant. It
became clearly evident that although UC
engineers oversaw the design, build and
operation until the end of 1982 along with
technical support and safety reviews, the
Indian facility underwent cost-cutting
programmes in design and construction
which were not mirrored in comparable
Western plants, viz.
� Carbon steel piping, which is more corrosive, replaced stainless steel piping.
� The number and quality of safety devices was reduced (a $3-6 million saving).
� Installed safety devices in western plants were automatically controlled with back-up devices – at Bhopal they were manual.
� At similar Western plants computerised early warning systems sensed leaks, monitored their rates and concentrations and were linked to a telephone system to automatically dial out alerts – In Bhopal there were not even any emergency planning measures.
� At Bhopal one vent gas scrubber (VGS) was installed. resulting in no redundancy. The equivalent plant in the USA had four VGSs.
� At Bhopal only one fl are tower was installed, i.e. no redundancy. The equivalent plant in the USA had two.
� In Bhopal, no unit storage tank between MIC manufacture and the main storage tank was installed to check for purity. This was designed in and installed on the US plant.
None of the six main safety features of
the plant were effi cient due to design but
also on the night of the incident, none
were operational due to an under pressure
maintenance schedule (due to under
staffi ng).
At the local level, no emergency planning
was undertaken prior to the commissioning
of the plant. In the US emergency planning
had been essential and had involved all
of the emergency services and a public
broadcasting system.
Prior to the disaster, operating incidents
resulting in plant workers being killed or
injured, and minor amounts of toxic gases
being released, had caused UC to send, in
May 1982, a team of US experts to inspect
the Bhopal plant as part of a safety audit,
Their report, which was passed to UC’s
management in the USA indicated that
there was – “a serious potential for sizeable
releases of toxic materials in the MIC unit
either due to equipment failure, operating
problems or maintenance problem, thus
requiring various changes to reduce the
danger of the plant, There is no evidence
that the recommendations were ever
implemented” [1].
Precursors leading to the disasterPrior to the disaster, both training, manning
levels and the educational standards of
the employees of the plant workforce
were reduced. Between 1980 and 1984,
the plants workforce was reduced by half
with no clear investment in technology to
warrant this reduction
The basic operation of the plant was further
compromised by management decisions
to operate the plant either outside its
designed operating parameters or to
implement revised processes to ensure
continued production while essential
components of the system had known
defects which had the potential to impact
on the safety integrity of the plant.
DIRECT CAUSES OF THE ACCIDENTThe production of a deadly cloud of MIC
was produced as a consequence of a
cheap engineering solution to a known
maintenance problem. A “jumper line”
connected a relief valve header to a
pressure vent header enabling water from
a routine washing operation to pass to MIC
storage tank 610. The ingress of water to
the MIC tank created an uncontrollable
runaway exothermic reaction. The reaction
products passed through the process vent
header to the jumper line, to the relief valve
vent header, onto the vent gas scrubber
and fi nally to the atmosphere through the
atmospheric vent line. The toxic gases
were discharged for 2 hours 15 minutes.
The release of toxic gases was assisted
by the following defects and lapses in
standard operating procedures which
could have easily been averted in many
instances:
� MIC storage tank number 610 was fi lled beyond recommended capacity. Functional contents gauges should have provided warning of this and the process halted until rectifi ed.
� A storage tank which was supposed to be held in reserve for excess MIC already contained MIC [2]. The reserve storage tank should have been empty and any production should have been halted until this requirement had been established. This should have been a formal requirement ‘hold point’ in the control process prior to production
being allowed to continue.
� The blow-down valve of the MIC 610 tank was known to be malfunctioning; consequentially it was permanently open. This valve should have been repaired or the tank should have been removed from service until repaired.
� The danger alarm sirens used for warning the adjacent residential communities were switched off after fi ve minutes in accordance with revised company safety practices. This clearly highlights why the site required emergency procedures to be in place and continually reviewed.
� The plant superintendent did not notify external agencies of the accident and initially denied the accident had occurred. This was clear negligence on behalf of the management but typifi ed the poor health and safety culture within the plant.
� The civic authorities did not know what actions to take in light of there being no emergency procedures in place and were un-informed of the hazardous materials stored within the plant. The requirements for good communications and established emergency procedures with local agencies and emergency services highlighted these shortfalls.
� Gauges measuring temperature and pressure in the various parts of the facility, including the crucial MIC storage tanks, were so notoriously unreliable that workers ignored early signs [1]. The company should have had a robust maintenance regime which should have prevented this, coupled with a safety culture which should have questioned any unsafe conditions.
� The refrigeration unit for keeping MIC at low temperatures, and therefore making it less likely to undergo overheating and expansion should contamination enter the tank, had been shut off for some time [1]. This issue could have only been resolved by the management having a commitment to safety and process guarding as opposed to profi t generation.
The failings below are attributable to
design reductions and the fact that UCIL
was able to dilute its safety protection
devices in order to maximise profi ts, while
any local peer reviews of designs by local
safety/engineers were non-existent:
– The gas scrubber, designed to neutralize any escaping MIC, had been shut off for maintenance. Even had it been operative, post disaster inquiries revealed that the maximum pressure it could handle was only one quarter of that which was actually reached in the accident [1].
– The fl are tower, designed to burn off MIC escaping from the scrubber, was also turned off, waiting for the replacement of a corroded piece of pipe. The tower, however, was inadequately designed for its task, as it
maintenance & asset management vol 27 no 3 | ME | May/June 2012 | 43
provide protection against a disaster be a
low fi gure or a high one?
To attempt to answer this last seemingly
simple question, one needs to go back to
the fundamental defi nitions of the terms
involved. Availability is calculated as a
function of both the frequency of a failure
(i.e. the mean time between failures, a
measure of reliability) and its severity (i.e.
the mean time to repair, a measure of
Designing food product safety through an effective yimplementation of maintenance engineering
was capable of handling only a quarter of the volume of the gas released [1].
– The water curtain, designed to neutralise any remaining gas, was too short to reach the top of the fl are tower where the MIC billowed out [1].
– There was a lack of effective warning systems; the alarm on the storage tank failed to signal the increase in temperature on the night of the disaster
[2].
THEORY AND CALCULATIONFault Tree Analysis (FTA) and a Reliability
Block Diagram (RBD) have been used
to map the root causes of the disaster
and calculate its overall probability of
occurrence, the RBD being derived
from the FTA. The parallel and series
connections in the RBD, which are derived
from the AND and OR gates respectively
of the FTA, describe how the system
functions (or fails to function), but do not
necessarily indicate any actual physical
connection nor any sequence of operation.
In other words, the RBD does not model
the fl ow of material nor any sequence
of time events, but instead models the
inter-dependencies of the root causes that
led to the failure mode at the apex of the
Fault Tree.
There are many benefi ts derivable from an
analysis based on FTA and RBD modelling.
Firstly, it helps to highlight vulnerable,
or weak, areas in the model that need
attention in the form of adding, for example,
built-in-testing, redundancy, or more
preventive maintenance. Secondly, it acts
as a knowledge-base of how a system fails
and hence can be used for diagnostics
or fault fi nding. Finally, given the value
of availability of each ‘box’ in the RBD
model it is possible to estimate the whole
system’s reliability – which is useful both
when aiming to improve system reliability
by preventing things from going wrong,
and when aiming at system recovery by
restoring elements that have failed.
Normally, we use FTA and RBD to model a
failure mode at an equipment or machine
level. Such a mode may, for example,
be ‘Motor A fails to start’. In this study,
however, the same methods of analysis are
applied on a larger scale, where the failure
mode is the occurrence of a disastrous
situation such as that at Bhopal. Here,
there are two distinct features that need
to be considered. Firstly, the situation is
complex, infl uenced by a range of human,
social and environmental factors which are
diffi cult to evaluate. Secondly, the whole
meaning of ‘availability’, in the context of
modelling a disastrous situation, can be
a matter of debate or even confusion, To
pose a fundamental question: should we
expect that the total availability of a plant to
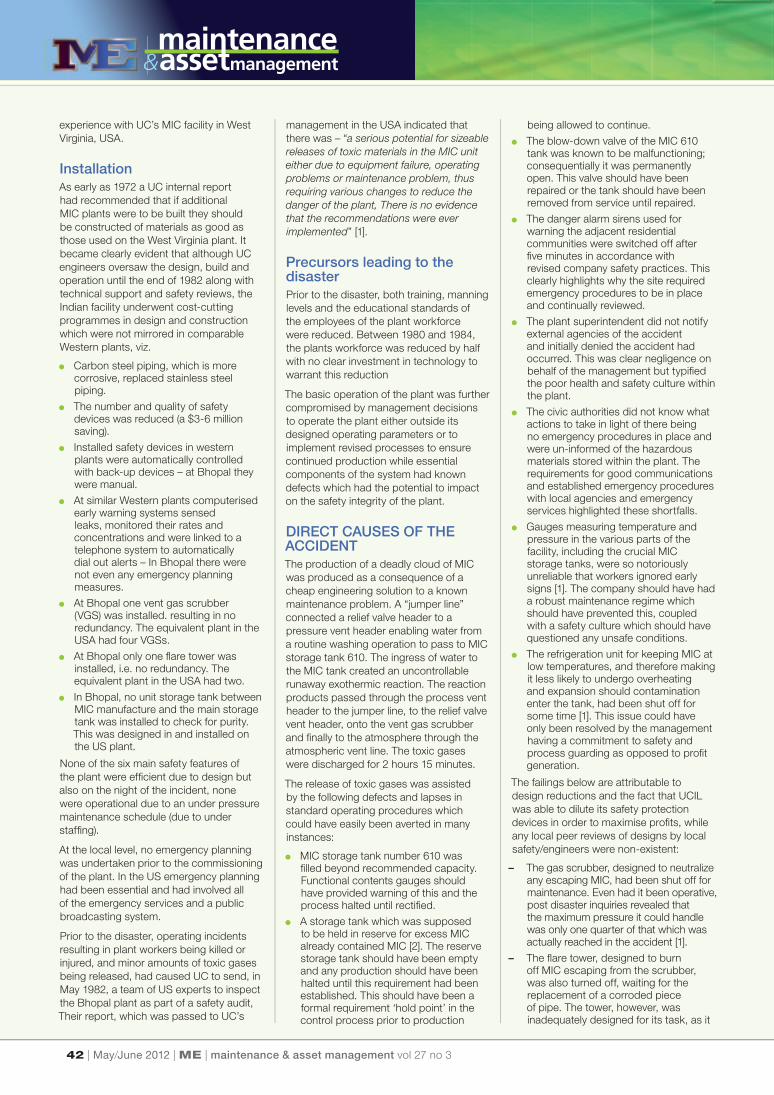
TE - Release of toxic gases to atmosphere
A - Ineffective workforce
B - Failure of plant due to diminished design specifications
of plant
C - Management Decisions
D - Poor maintenance of plant
E - Poor Health & Safety awareness
or Health & awareness
Go to Fig. 2
1 - Quality of employees reduced i.e.
lower educational standards
2 -Safety training of staff reduced
3- Poor Health and Safety
culture
Go to Fig. 3
Go to Fig. 4
Figure 1 Overall Fault Tree Analysis of the disaster
Figure 2 Fault Tree of failure due to diminished design specifi cations
B - Failure of plant due to Diminished Design Specifications of plant
4 -Stainless Steel piping replaced by Carbon steel
5 - No Computerized Warning
Systems
6 - No Unit
Storage Tank
7 -Ineffective water spray
system
G - Ineffective Flare Tower F - Safety Devices capability Impaired
9 - Quantity of
Safety devices reduced
8 - Quality of
safety devices reduced
10 - No
redundancy
11 Incapable of dealing with
quantity of gases released
THE BHOPAL DISASTER – learning from failures and evaluating risk
44 | May/June 2012 | ME | maintenance & asset management vol 27 no 3
18- Alarm siren turned off – Management
decision
16 - No emergency planning
procedures
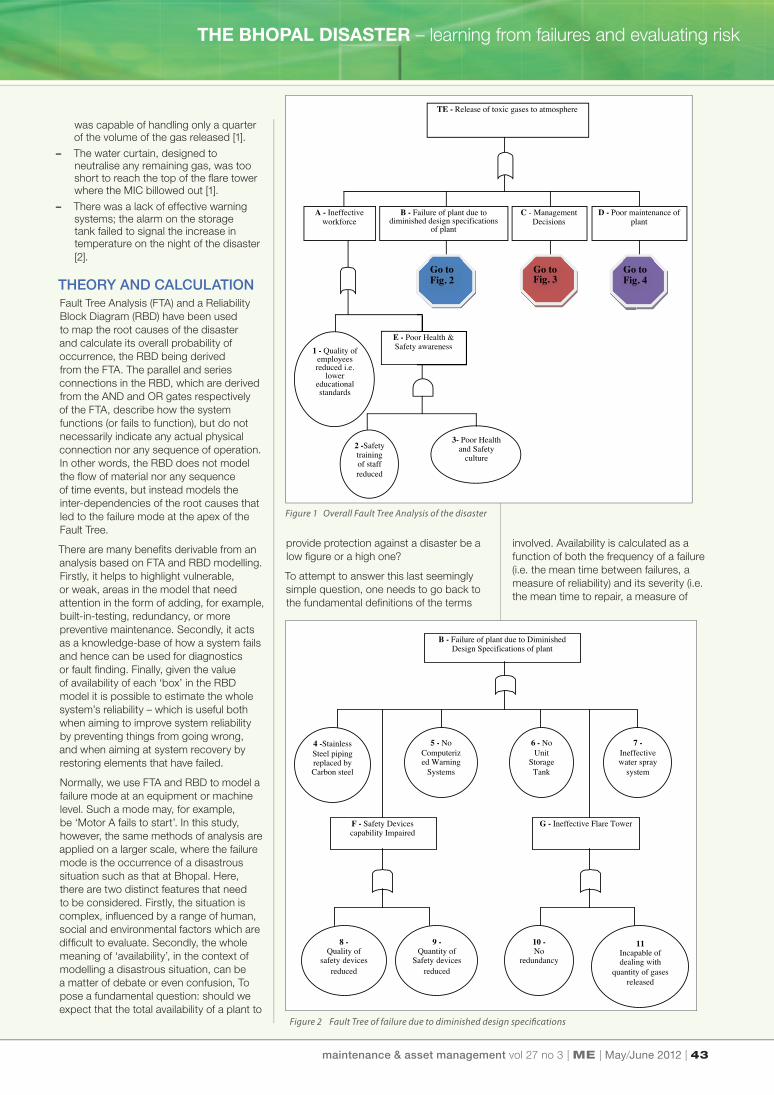
C – Incorrect management decisions
12 –Refrig’ation
unit shut down
17 -Lack of notification of
incident by plant
management
H -Emergency response deficiencies
13 - Plant manning
levels reduced
14 -Reserve MIC storage tank allowed
to be used
15 - Plant being operated outside design
parameters
D - Poor maintenance of plant
19 -Defective blow down
valve in MIC tank 610
20-Substitute engineering
solution used “Jumper line”
22 -Slip blind
process omitted
23 - No checking of related
lines
J - Poor maintenance procedures on plant 21 -
Defective gauges not
repaired
Figure 1 shows the overall Fault Tree
analysis.
Figures 2, 3 and 4 further extend the
analysis of Figure 1.
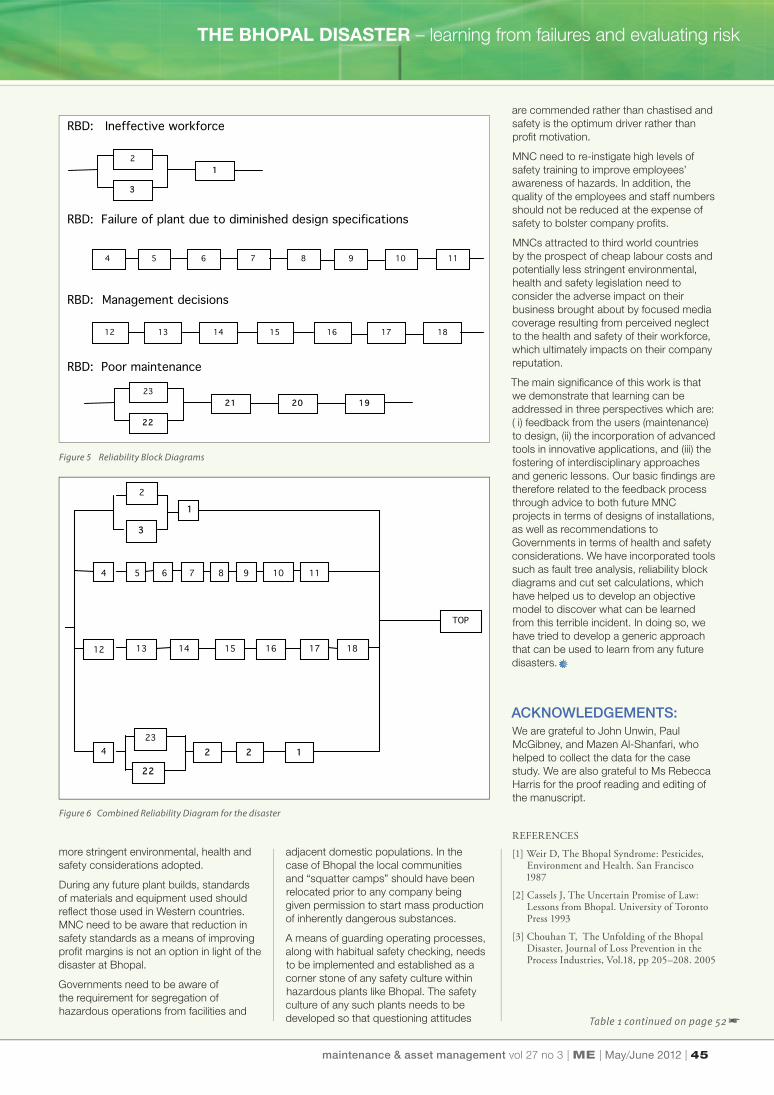
The reliability block diagrams for each tree
are then presented in Figure 5, and the
overall reliability block diagram related to
the disaster in Figure 6.
Table 1 (see pages 46-47) presents our
estimated ‘probabilities of failures’ for the
various contributory events discussed
in the previous, ‘Direct Causes’, Section.
Estimates of Pf (probability of systems
failure) are used as a measure of
unreliability – where the sum of Pf and Ps
(probability of success) equals one as the
system is either in a fault or running state.
Again, ‘probability’ may here have different
meanings, i.e. a measure of confi dence
or a measure of availability. Either way, we
use it in this context to provide us with
an indication of the relative importance
(priority) of the various factors that led
to the disaster. Note that the numbers
labelling the various FTA events and/
or RBD boxes in the fi gures refer to the
numbers used to list the various events/
factors listed in Table 1. It must be stressed
that this is very much a speculative
evaluation. It is suggested that using these
data and applying straightforward Boolean
analysis of the logic of the Fault Trees
(which is beyond the scope of this paper)
could form the basis of an informative
estimate of the relative signifi cance of the
factors that may have contributed to the
disaster.
DISCUSSIONUCIL had allowed safety standards and
maintenance at the plant to deteriorate
to cataclysmic levels even though the
potential for such an incident had been
highlighted two years prior in a UC internal
report. Clearly UCIL had dropped the
operating and safety standards of the
Bhopal facility well below those maintained
in the near identical facility in West
Virginia. The fact that UCIL was able to
do this was due in part to lacking safety
and environmental laws and regulations
which were not enforced by the Indian
government. Immediately after the
disaster in India, UC, while maintaining no
knowledge of the cause of the accident
in India, shut down the MIC plant in West
Virginia to allow fi ve million dollars worth
of changes to its safety devices to be
accomplished.
CONCLUSIONThe Indian government, although keen to
attract foreign investment, needed to factor
in basic safety requirements for its citizens.
During future MNC projects, designs of
installations need to be peer reviewed and Figure 4 Fault Tree of poor maintenance
Figure 3 Fault Tree of incorrect management decisions
maintainability). Since a disaster is, by its
very nature, a severe and yet a rare event,
one would normally expect high fi gures
for availability of protection against its
occurrence - due to its very low frequency
(a one-off event). However, this would
not be the case when the existing design
and operation of the system is not fi t for
purpose, and hence it is a disaster waiting
to happen, and in this situation one would
expect that total system availability would
be rather low.
maintenance & asset management vol 27 no 3 | ME | May/June 2012 | 45
are commended rather than chastised and
safety is the optimum driver rather than
profi t motivation.
MNC need to re-instigate high levels of
safety training to improve employees’
awareness of hazards. In addition, the
quality of the employees and staff numbers
should not be reduced at the expense of
safety to bolster company profi ts.
MNCs attracted to third world countries
by the prospect of cheap labour costs and
potentially less stringent environmental,
health and safety legislation need to
consider the adverse impact on their
business brought about by focused media
coverage resulting from perceived neglect
to the health and safety of their workforce,
which ultimately impacts on their company
reputation.
The main signifi cance of this work is that
we demonstrate that learning can be
addressed in three perspectives which are:
( i) feedback from the users (maintenance)
to design, (ii) the incorporation of advanced
tools in innovative applications, and (iii) the
fostering of interdisciplinary approaches
and generic lessons. Our basic fi ndings are
therefore related to the feedback process
through advice to both future MNC
projects in terms of designs of installations,
as well as recommendations to
Governments in terms of health and safety
considerations. We have incorporated tools
such as fault tree analysis, reliability block
diagrams and cut set calculations, which
have helped us to develop an objective
model to discover what can be learned
from this terrible incident. In doing so, we
have tried to develop a generic approach
that can be used to learn from any future
disasters.
ACKNOWLEDGEMENTS: We are grateful to John Unwin, Paul
McGibney, and Mazen Al-Shanfari, who
helped to collect the data for the case
study. We are also grateful to Ms Rebecca
Harris for the proof reading and editing of
the manuscript.
REFERENCES
[1] Weir D, The Bhopal Syndrome: Pesticides, Environment and Health. San Francisco 1987
[2] Cassels J, The Uncertain Promise of Law: Lessons from Bhopal. University of Toronto Press 1993
[3] Chouhan T, The Unfolding of the Bhopal Disaster, Journal of Loss Prevention in the Process Industries, Vol.18, pp 205–208. 2005
Designing food product safety through an effectiveyimplementation of maintenance engineering
RBD: Ineffective workforce RBD: Failure of plant due to diminished design specifications RBD: Management decisions RBD: Poor maintenance
2
3
1
4 5 6 7 8 9 10 11
12 13 14 15 16 17 18
23
22
21 20 19
Figure 5 Reliability Block Diagrams
more stringent environmental, health and
safety considerations adopted.
During any future plant builds, standards
of materials and equipment used should
refl ect those used in Western countries.
MNC need to be aware that reduction in
safety standards as a means of improving
profi t margins is not an option in light of the
disaster at Bhopal.
Governments need to be aware of
the requirement for segregation of
hazardous operations from facilities and
2
3
1
TOP
4 5 6 7 8 9 10 11
12 13 14 15 16 17 18
4 23
22
21
20
19
Figure 6 Combined Reliability Diagram for the disaster
adjacent domestic populations. In the
case of Bhopal the local communities
and “squatter camps” should have been
relocated prior to any company being
given permission to start mass production
of inherently dangerous substances.
A means of guarding operating processes,
along with habitual safety checking, needs
to be implemented and established as a
corner stone of any safety culture within
hazardous plants like Bhopal. The safety
culture of any such plants needs to be
developed so that questioning attitudes Table 1 continued on page 52 �
THE BHOPAL DISASTER – learning from failures and evaluating risk

46 | May/June 2012 | ME | maintenance & asset management vol 27 no 3
Event No. Comments Pf = F / S + F Actual Pf Value
1 – Quality of employees reduced
Reduction of Operators with High school education over 5 years
= 9
= (9 / 6 +15) / 43800 9.6 × 10ˉ 6
No. of Operators with High school education at time of disaster
= 6
No. of Operators with High school education in 1979 = 15
No. of hours for 5 year period = 24 x365 x 5 = 43800
2 – Safety training of staff reduced
Original No. of training days = 18 months x 30 days = 540 = (523/540 + 17) / 43800 21.4 × 10ˉ 6
Reduction in training days during 5 year period = 523
No .of actual training days = 17
No. of hours for 5 year period = 24 x 365 x 5 = 43800
3 – Poor Health and Safety Culture
Assumption – health and safety culture dependent upon quality
and training of staff
= 9.6 x 10ˉ 6 +21.4 x 10ˉ 6 31.1 × 10ˉ 6
Pf value = event 1 + 2
4 – Stainless Steel piping replaced by carbon steel
Guess – No. of new repairs performed = 1000 = 1000/25000 + 1000 40 × 10ˉ 3
No. of repairs performed since opening of plant = 25 000
5 – No computerized warning systems – human detection
Guess – No of failures detected by staff = 20000 = 2000/20000 + 2000 90.9 × 10ˉ 3
No. of failures missed during inspections = 2000
6 – No unit storage tank Guess: No unit storage tank fi tted to check purity therefore
assuming check performed once a week during 5 years 52 x 5
= 260
= 260/1825 142.4 × 10ˉ 3
System would fail once ever week day over 5 year period =
365x5 = 1825
7 – Ineffective water spray system
Guess: System would fail to suppress gases due to design error
associated with height in MIC area which represented area only
1/5000 of plant
= (1/ 5000) /1825 109.6 × 10ˉ 9
System failed in MIC area on day over 5 year period of MIC
production = 365x5 = 1825
8 – Quality of safety devices reduced
Assumptions: reduced quality of safety devices resulted in 50%
increase failure rate
16 × 10ˉ 3
Guess Previous Pf value = 8 x 10ˉ ³
9 – Quantity of safety devices reduced
Assumption: number of devices Reduced by 25% therefore Pf
value increased by 25%
10 × 10ˉ 3
Guess: Previous Pf value = 8 x 10ˉ ³
10 – No redundancy (fl are tower)
Two built in USA plant, 1 installed in India. Item under
maintenance for
(1/2) / 43800 11.4 × 10ˉ 6
Duration of use of single fl are tower over 5 years = 24 x 365 x5 =
43800 hours
� Continued from page 51

maintenance & asset management vol 27 no 3 | ME | May/June 2012 | 47
through an effectiveyimplementation of maintenance engineering
11 – Incapable of dealing with quantity of gasest
System not designed to deal with volume of gases. Therefore
the system failed to handle this volume of gas for 2.5 hours (time
of disaster)
2.5/43800 57.1 × 10ˉ 6
Duration in hours system operating over 5 years = 24 x 365 x5 =
43800 hours
12 – Refrigeration unit shut down
Unit shut down for past year = 365 days 365/1825 + 365 166.3 × 10ˉ 3
MIC production over last 5 years = 365 x 5 = 1825
13 – Plant manning levels reduced
Overall 20% reduction of staff in 4 years (20/100)/ 1460 136.9 × 10ˉ 6
Duration = 365 x 4 = 1460 days
14 – Reserve MIC storage tank allowed to be used
Assumption: MIC storage tank used for 50% of time (50/100) / 1825 273.9 × 10ˉ 6
Duration of use = 5 years = 1825 days
15 – Plant being operated outside design parameters
Assumption: 10% of plant being operated outside design
parameters for 5 years.
(10/100)/1825 54.8 × 10ˉ 6
16 – No emergency planning procedures
No Emergency planning in place – operation failed on day 1/1825 0.55 × 10ˉ 3
5 years of MIC production at plant = 5 x 365 =1825
17 – Lack of notifi cation of incident by plant management
No Emergency planning in place – operation failed on day 1/1825 0.55 × 10ˉ 3
5 years of MIC production at plant = 5 x 365 =1825
18 – Alarm siren turned off – Management decision
No. of hours siren turned off = 2
No. of hours available for use = 24 x 365 x 5 = 43800 2/43800 45.7 × 10ˉ 6
19 – Defective blow down valve in MIC tank
Total number of days Defective in past 5 years = 12 12/1825 6.6 × 10ˉ 3
Total number of days in 5 years = 1825
20 – Substitute engineering solution used “Jumper line”
No of times procedure used = 150 150/ 450 +150 250 × 10ˉ 3
Number of fl ushing operation = 450
21 – Defective gauges not repaired
Guess: No. of gauges defective or still in use = 1320 1320/1320 + 6000 180.3 × 10ˉ 3
Total number of gauges on plant = 6000
22 – Slip blind process omitted
Guess: No of procedures requiring slip blinds but not used = 50 50/220 + 50 185.1 × 10ˉ 3
Total number of procedures requiring slip blinds = 220
23 – No checking of related lines
Guess: No. of times procedure required during maintenance in
5 years = 300
300/15000 + 300 19.6 × 10ˉ 3
Total number of maintenance procedures in 5 years = 15 000
Table 1 Estimated ‘Probabilities of Failure’ for contributory events’ (MIC production assumed to have commenced in 1979, i.e. fi ve years before disaster)
THE BHOPAL DISASTER – learning from failures and evaluating risk