Embed Size (px)
Citation preview
The bHLH Transcription Factor POPEYE Regulates Responseto Iron Deficiency in Arabidopsis Roots W OA
Terri A. Long,a,1 Hironaka Tsukagoshi,a,2 Wolfgang Busch,a,2 Brett Lahner,b David E. Salt,b,c and Philip N. Benfeya,3
a Department of Biology and Institute for Genome Science and Policy Center for Systems Biology, Duke University, Durham,
North Carolina 27708b Bindley Bioscience Center, Purdue University, West Lafayette, Indiana 47907c Department of Horticulture and Landscape Architecture, Purdue University, West Lafayette, Indiana 47907
Global population increases and climate change underscore the need for better comprehension of how plants acquire and
process nutrients such as iron. Using cell type–specific transcriptional profiling, we identified a pericycle-specific iron
deficiency response and a bHLH transcription factor, POPEYE (PYE), that may play an important role in this response.
Functional analysis of PYE suggests that it positively regulates growth and development under iron-deficient conditions.
Chromatin immunoprecipitation-on-chip analysis and transcriptional profiling reveal that PYE helps maintain iron homeo-
stasis by regulating the expression of known iron homeostasis genes and other genes involved in transcription,
development, and stress response. PYE interacts with PYE homologs, including IAA–Leu Resistant3 (ILR3), another bHLH
transcription factor that is involved in metal ion homeostasis. Moreover, ILR3 interacts with a third protein, BRUTUS (BTS), a
putative E3 ligase protein, with metal ion binding and DNA binding domains, which negatively regulates the response to iron
deficiency. PYE and BTS expression is also tightly coregulated. We propose that interactions among PYE, PYE homologs,
and BTS are important for maintaining iron homeostasis under low iron conditions.
INTRODUCTION
Iron is an essential nutrient for both plants and animals. In most
human populations, nutritional iron is obtained predominantly
from plants. Consequently, understanding how plants absorb
and use iron is important for meeting increasing global nutritional
demands. Even though iron is one of the most abundant ele-
ments on earth, in most soil environments, it forms highly stable
insoluble oxyhydroxides. As a result, plants have evolved differ-
ent mechanisms to solubilize and absorb iron from soil (Schmidt,
1999; Walker and Connolly, 2008; Palmer and Guerinot, 2009).
Nongraminaceous plants such as Arabidopsis thaliana re-
spond to iron deficiency with increased expression of the bHLH
transcription factor FER-LIKE IRON DEFICIENCY-INDUCED
TRANSCRIPTION FACTOR (FIT) (Bauer et al., 2007) whose pro-
tein forms heterodimers with bHLH protein bHLH38 or bHLH39
(Yuan et al., 2008). FIT positively regulates expression of FRO2,
which encodes an epidermal iron reductase that reduces ferric
iron in response to iron deficiency (Robinson et al., 1999). FIT
also positively regulates the accumulation of IRT1 protein, which
transports reduced Fe2+ into the symplast (Eide et al., 1996; Vert
et al., 2002; Colangelo and Guerinot, 2004). Moreover, FIT
regulates the expression of >40% of all iron deficiency inducible
genes and is essential for normal growth and development
under iron sufficient conditions (Colangelo and Guerinot, 2004).
An additional bHLH protein, ILR3, has also been shown to play a
role in metal ion–mediated auxin sensing within Arabidopsis
roots. ILR3 gain-of-function mutants not only display altered
iron deficiency–induced metal ion uptake, but also a decreased
expression of the three genes homologous to yeast Ccc1p
(Rampey et al., 2006). Yeast Ccc1p and its Arabidopsis homo-
log, VIT1, are both involved in vacuolar iron influx (Lapinskas
et al., 1996; Li et al., 2001; Kim et al., 2006). Thus, ILR3 might
control metal homeostasis by regulating the expression of
genes implicated in intracellular iron transport (Rampey et al.,
2006).
In addition to VIT1, other proteins involved in intracellular metal
transport are also important for maintaining iron homeostasis in
plants. For example, disruption of the vacuolar iron transporters
NRAMP3/4, similar to VIT1, causes increased sensitivity to iron
deficiency (Lanquar et al., 2005; Kim et al., 2006). Furthermore,
IRT1 nonspecifically takes up other metals, such as Zn, Mn, Co,
Cd, and Ni, in addition to Fe, under iron-deficient conditions (Vert
et al., 2002). Therefore, genes involved in vacuolar sequestration
and detoxification of Zn, such as ZIF1, MTPa2 (Arrivault et al.,
2006; Haydon and Cobbett, 2007), or Ni, Co, and excess Fe,
such as FPN2 (Schaaf et al., 2006; Morrissey et al., 2009), are
also primary components of the iron deficiency response
(Buckhout et al., 2009). Differential expression and localization
of iron reductases FRO2, FRO3, and FRO7 to the root epidermal
plasma membrane, root vasculature mitochondria, and shoot
plasma membrane, respectively (Jeong and Connolly, 2009),
1 Current address: Department of Biological Sciences, University ofIllinois at Chicago, Chicago, IL 60607.2 These authors contributed equally to this work.3 Address correspondence to [email protected] author responsible for distribution of materials integral to thefindings presented in this article in accordance with the policy describedin the Instructions for Authors (www.plantcell.org) is: Philip N. Benfey([email protected]).WOnline version contains Web-only data.OAOpen Access articles can be viewed online without a subscription.www.plantcell.org/cgi/doi/10.1105/tpc.110.074096
The Plant Cell, Vol. 22: 2219–2236, July 2010, www.plantcell.org ã 2010 American Society of Plant Biologists
also suggest that there are organ and organelle-specific require-
ments for reduced iron.
The intercellular distribution of iron between the root and shoot
is also essential for tolerating fluctuations in iron availability.
Studies show that after iron is loaded into the root xylem from the
pericycle, FRD3, a multidrug and toxin efflux protein, facilitates
Fe chelation to citrate and subsequent transport of Fe-citrate
from the root to the shoot (Green and Rogers, 2004; Grotz and
Guerinot, 2006; Durrett et al., 2007).Within developing seeds and
young leaf tissues, iron is then thought to be transported from
the xylem to the phloem in the form of Fe (II)-nicotianamine
complexes via Yellow Stripe-Like1 (YSL1), an Fe transporter
localized in the xylemparenchyma (Curie et al., 2009; Klatte et al.,
2009). Disruption of FRD3, nicotianamine synthases (NAS1,
NAS2, NAS3, and NAS4), or YSL genes leads to chlorosis,
reduced growth, and increased sensitivity to iron deficiency (Ling
et al., 1999; Rogers and Guerinot, 2002; Waters et al., 2006;
Klatte et al., 2009). Thus, proper iron distribution within each
plant organ is essential for normal growth and development.
Previously, a systems biology approach, which included high-
resolution transcriptional profiling, was used to characterize root
transcriptional regulatory networks involved in maintaining iron
homeostasis under iron-deficient conditions (Dinneny et al.,
2008). In this study, our objective was to identify key regulators
of the initialization of iron deficiency response that act in a
spatiotemporally specific manner. Through cell type–specific
transcriptional profiling, we found that the pericycle may act as a
regulatory center for sensing and responding to root iron content.
Furthermore, whole root time-course microarray analyses
showed that numerous transcription factors are temporally
coexpressed when plants are exposed to iron-deficient growth
conditions. We screened mutants of these transcription factors
looking for alterations in response to iron deficiency. We found
two genes that are induced by iron deficiency, one of which
encodes a bHLH protein, which we named POPEYE (PYE), and
a second gene tightly coregulated with PYE that we called
BRUTUS (BTS). Both PYE and BTS appear to play important
roles in responding to iron-deficient conditions and interact with
the same PYE homologs, including ILR3. Our findings indicate
that PYE, possibly in combination with BTS and other regulatory
proteins, controls iron homeostasis by regulating the expression
of genes involved in iron homeostasis and other biological
processes.
RESULTS
A Transcription Factor Involved in Responding to Iron
Deficiency Is Highly Expressed in the Pericycle
Rapid activation of iron reductase activity and IRT1 expression
are common markers of the iron deficiency response in Arabi-
dopsis roots (Eide et al., 1996; Robinson et al., 1999). In our
study, we found that when plants are germinated and grown on
iron-sufficient conditions for 5 d and then shifted to iron-deficient
conditions, their roots displayed increased iron reductase
activity and IRT1 expression within 24 h (see Supplemental
Figure 1A online). In addition, plants exposed to iron deprivation
displayed increased lateral root emergence (see Supplemental
Figure 1B online). These are typical responses to iron deprivation
(Romheld and Marschner, 1981; Moog et al., 1995). We also
discovered that roots exposed to iron-deficient growth media
(Figure 2B) became wavier under our growth conditions than
those maintained on iron-sufficient media (see Supplemental
Figure 3A online).
To detect novel regulatory genes that control these physio-
logical and developmental alterations, we queried our transcrip-
tional profile data from roots exposed to iron-deficient media for
0, 3, 6, 12, 24, 48, and 72 h (Dinneny et al., 2008) for genes that
encode proteins with DNA binding domains. We selected and
screened 38 T-DNA insertion mutants of putative transcription
factors whose expression is affected during the iron deficiency
time course. We found that a T-DNA insertion in At3g47640,
which we named PYE, causes alterations in response to iron
deprivation that we describe later in the study.
PYE is over 3-fold upregulated after 72 h of growth on iron-
deficient media (Figures 1A and 2A). To assess which biological
activitiesmight becoordinated alongwithPYE,weselectedgenes
from the Dinneny et al. (2008) data set that were at least 1.5-fold
differentially regulated by iron deficiency with a Q-value < 1024.
We then used affinity propagation (Frey and Dueck, 2007) with
Pearson correlation to group genes with temporal expression
patterns similar to PYE. We found that PYE is coexpressedwith a
group of genes that is enriched in transcription (P value, 1024.3)
and transcriptional repressor (P value, 1023.2) activity (see Sup-
plemental Figure 1C and Supplemental Data Sets 1A and 1B
online).
To validate this expression pattern in vivo, we transformed
wild-type plants with a construct that has the PYE promoter
upstream of green fluorescent protein (ProPYE:GFP). Trace
levels of ProPYE:GFP expression were visible in the root vas-
culature, columella root cap, and lateral root cap under iron
sufficiency. However, ProPYE:GFP expression was elevated
throughout the root after exposure to iron deficiency with the
highest expression occurring in the pericycle in the maturation
zone (Figure 1C; see Supplemental Figure 2A online). These
findings led us to ask if PYE protein localization is concentrated
in this same region. We generated translational fusions with the
full-length PYE cDNA fused to the GFP open reading frame
downstream of the PYE promoter (ProPYE:PYE:GFP). Notably,
we detected trace levels of PYE:GFP in multiple cell types of the
root under iron sufficiency and rapid accumulation of PYE:GFP in
the nuclei of all cells throughout the root upon exposure to iron
deprivation (Figure 1D; see Supplemental Figure 2B online). This
finding suggests that although PYE expression is strongest in the
pericycle, PYE protein may function in multiple cell types.
Iron Deficiency Induces Pericycle-Specific Enrichment of
Transcription Factor Activity
The strong induction of PYE expression in the pericycle led us to
investigate what role this cell type plays in responding to iron
deficiency. Previous work has shown that FRD3, which encodes
an iron deficiency–inducible citrate transporter required for long-
distance transport of iron from the root to the shoot, is expressed
in and localized to the pericycle (Rogers and Guerinot, 2002;
2220 The Plant Cell
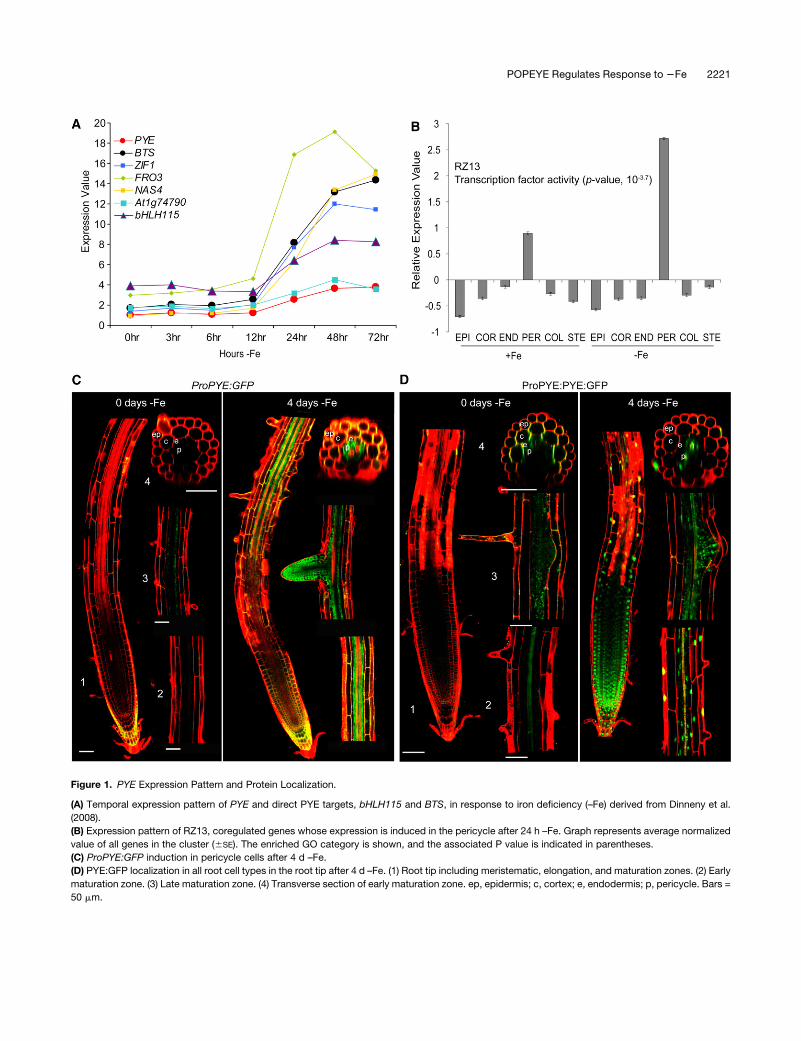
Figure 1. PYE Expression Pattern and Protein Localization.
(A) Temporal expression pattern of PYE and direct PYE targets, bHLH115 and BTS, in response to iron deficiency (–Fe) derived from Dinneny et al.
(2008).
(B) Expression pattern of RZ13, coregulated genes whose expression is induced in the pericycle after 24 h –Fe. Graph represents average normalized
value of all genes in the cluster (6SE). The enriched GO category is shown, and the associated P value is indicated in parentheses.
(C) ProPYE:GFP induction in pericycle cells after 4 d –Fe.
(D) PYE:GFP localization in all root cell types in the root tip after 4 d –Fe. (1) Root tip including meristematic, elongation, and maturation zones. (2) Early
maturation zone. (3) Late maturation zone. (4) Transverse section of early maturation zone. ep, epidermis; c, cortex; e, endodermis; p, pericycle. Bars =
50 mm.
POPEYE Regulates Response to 2Fe 2221
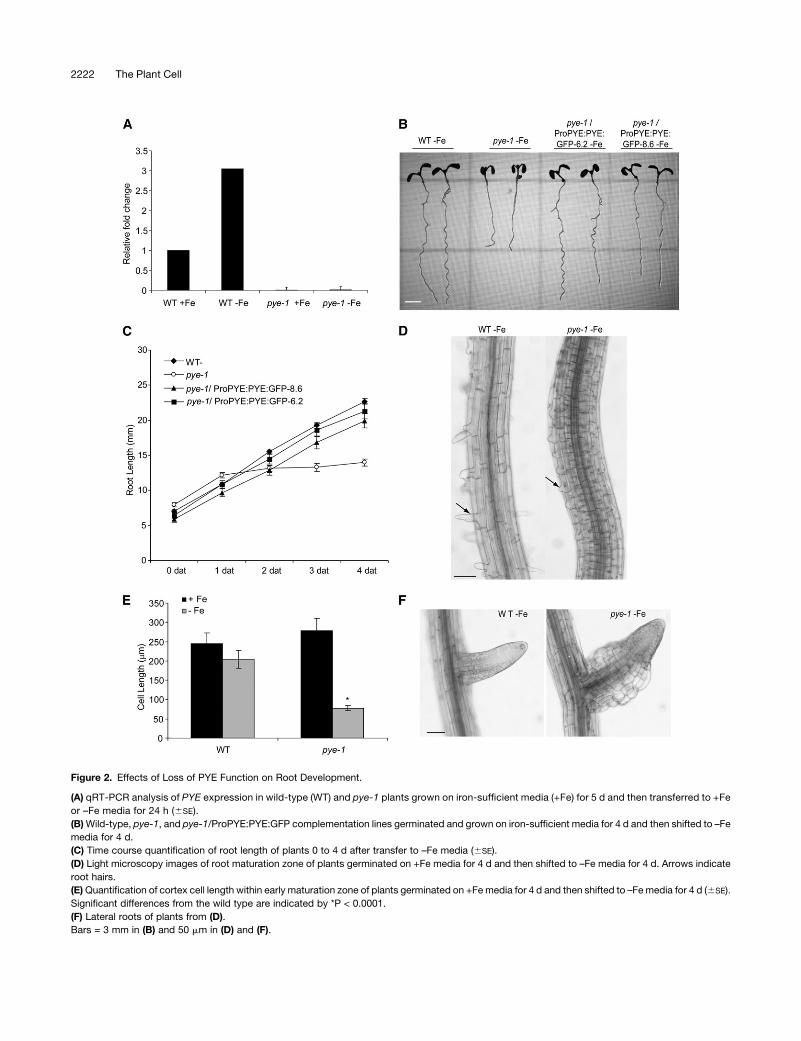
Figure 2. Effects of Loss of PYE Function on Root Development.
(A) qRT-PCR analysis of PYE expression in wild-type (WT) and pye-1 plants grown on iron-sufficient media (+Fe) for 5 d and then transferred to +Fe
or –Fe media for 24 h (6SE).
(B)Wild-type, pye-1, and pye-1/ProPYE:PYE:GFP complementation lines germinated and grown on iron-sufficient media for 4 d and then shifted to –Fe
media for 4 d.
(C) Time course quantification of root length of plants 0 to 4 d after transfer to –Fe media (6SE).
(D) Light microscopy images of root maturation zone of plants germinated on +Fe media for 4 d and then shifted to –Fe media for 4 d. Arrows indicate
root hairs.
(E)Quantification of cortex cell length within early maturation zone of plants germinated on +Femedia for 4 d and then shifted to –Femedia for 4 d (6SE).
Significant differences from the wild type are indicated by *P < 0.0001.
(F) Lateral roots of plants from (D).
Bars = 3 mm in (B) and 50 mm in (D) and (F).
2222 The Plant Cell
Green andRogers, 2004). The pericycle surrounds the xylem and
phloem cells in which iron is transported throughout the plant.
Moreover, the pericycle is the outermost layer of the stele, which
is the most transcriptionally active group of cells in the root in
response to iron deprivation (Dinneny et al., 2008). Therefore, it is
possible that the pericycle plays an important role in mediating
the presence or absence of iron between the outer layers of the
root and the vasculature.
To determine how the pericycle might be involved in the iron
deficiency response, we profiled gene expression in this cell type
after 24 h of exposure to iron-deficient media (see Supplemental
Data Set 2A online). We then compared the pericycle expression
data to that of the epidermis, columella, cortex, endodermis, and
stele exposed to 24 h of iron deficiency derived from the Dinneny
et al. (2008) data set. Our query identified >4300 genes at least
1.5-fold upregulated or downregulated after 24 h exposure to
iron deficiency in any of the six cell types (see Supplemental Data
Set 1C online). We again used affinity propagation (Frey and
Dueck, 2007)with Pearson correlation to identify groups of genes
with similar spatial expression patterns. We found 83 clusters of
genes, which we termed radial zone (RZ) clusters (see Supple-
mental Data Sets 1C and 1D online). Three of these clusters,
RZ13, RZ10, and RZ48, contain genes that are induced in the
pericycle by iron deprivation (see Supplemental Data Set 1C
online). In fact, 159 genes, the largest set of coexpressed genes in
the entire radial zone data set, are found in RZ13 alone (see
Supplemental Data Set 1C online). Gene ontology (GO) term
enrichment indicates that, in contrast with all other groups of
coregulated genes, all three of these clusters are enriched in
transcription factor activity (Figure 1B; seeSupplemental DataSet
1D online). PYE may be one of these transcription factors as it is
most highly induced in the pericycle after 24 h of exposure to iron
deficiency (Figure 1C; see Supplemental Figure 1D online). Based
on this enrichment of transcription factors that respond to iron
deficiency, we propose that the pericycle acts as a transcriptional
regulatory center for sensing and responding to iron levels.
Loss of PYE Function Alters Response to Iron Deficiency
and Disrupts Iron Accumulation
In wild-type plants, expression of PYE is elevated in response to
iron deprivation (Figures 1A and 2A). A T-DNA insertion in the
third exon of this gene results in a significant decrease in PYE
expression (Figure 2A), resulting in inhibition of root growth under
iron-deficient conditions (Figures 2B and 2C; see Supplemental
Figures 3A and 3B online). pye-1 root growth inhibition is due to
decreased elongation of cells compared with the wild type
(Figures 2D and 2E; see Supplemental Figure 3C online). In
addition, although exposure to iron deficiency causes root hairs
to be distorted and misshapen (Muller and Schmidt, 2004;
Dinneny et al., 2008), the pye-1 mutation appears to inhibit
emergence of root hairs (Figure 2D; see Supplemental Figure 3C
online) and causes swelling of cells within the elongation zone of
lateral roots, particularly the epidermal and cortex cells only
under iron deficiency (Figure 2F; see Supplemental Figure 3D
online). Based upon this enlargement of certain cells, in addition
to the altered response to iron deprivation, we named the gene
associated with this mutant PYE.
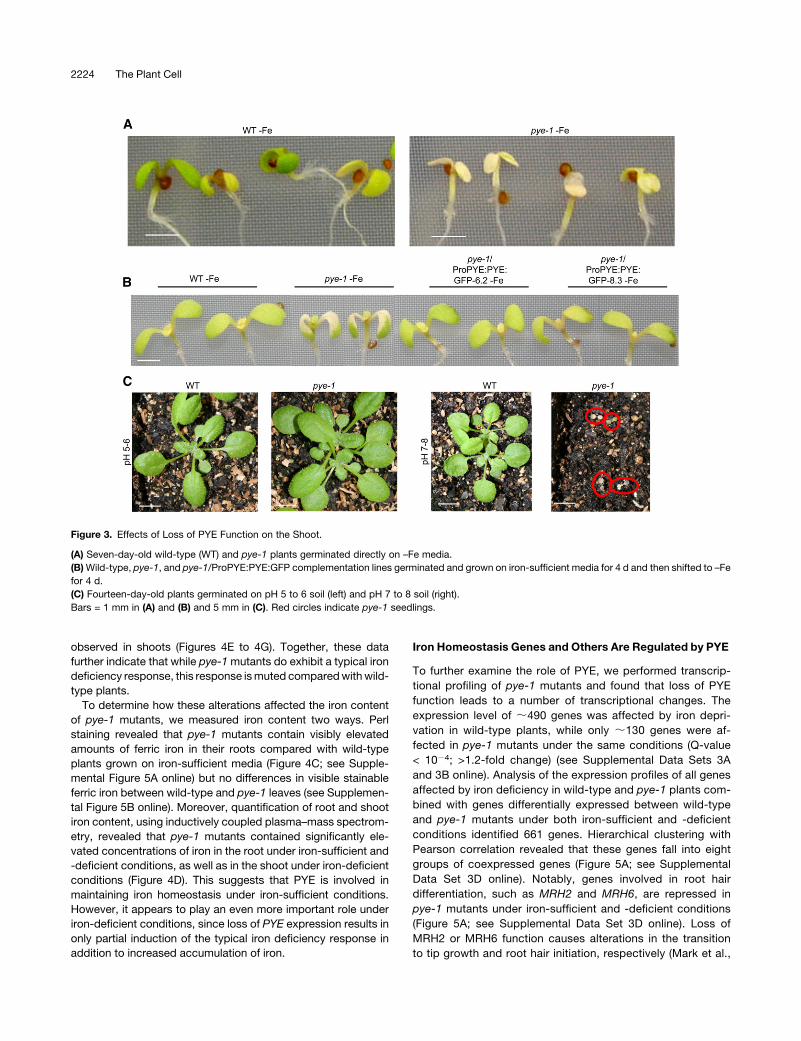
We also observed alterations in shoot responses to iron-
deficient conditions. The leaves of pye-1mutants germinated on
iron deficiency media became severely chlorotic after 7 d (Figure
3A). The shoots of pye-1 plants germinated and grown on iron-
sufficient media were initially green, similar to the wild type (see
Supplemental Figure 4A online). When shifted to iron-deficient
media, the shoots of both wild-type and pye-1 lines became
chlorotic within days. However, this phenotypewasmore intense
in pye-1 mutants (Figure 3B), and pye-1 mutants contained
lower chlorophyll content compared with wild-type plants (see
Supplemental Figure 4B online).
To validate that these phenotypes are due to loss of
PYE expression, we transformed the PYE translational fusion
(ProPYE:PYE:GFP) into pye-1 mutants. ProPYE:PYE:GFP ex-
pression led to higher PYE transcript levels compared with the
wild type (see Supplemental Figure 4C online), possibly due to
positional affects upon the transgene or the absence of certain
repressor elements within the promoter fragment we used.
Despite this increase in transcript levels, both shoot and root
phenotypes were rescued by expression of ProPYE:PYE:GFP in
pye-1 mutants exposed to iron-deficient media (Figures 2B, 2C,
and 3B; see Supplemental Figure 4A online).
To characterize the pye-1 phenotype on iron-deficient soil, we
germinated plants on alkaline soil (pH 7 to 8), in which iron is
insoluble, and compared them to growth on soil with standard
pH (pH 5 to 6). Although pye-1 mutants were able to germinate
on high pH soil, their cotyledons became chlorotic after 6 to 7 d,
and seedlings arrested growth before producing true leaves
(Figure 3C). Therefore, PYE appears to regulate tolerance to
multiple growth conditions in which iron availability is reduced.
To further determine how PYE controls responses to iron
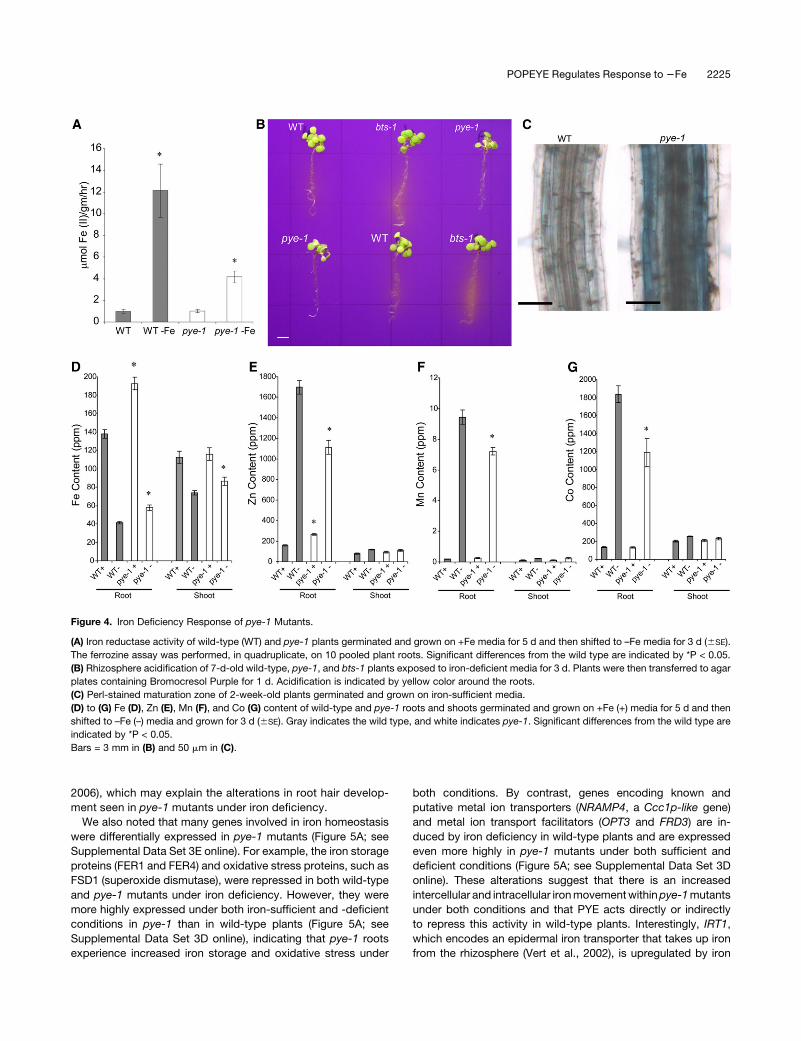
deprivation, we analyzed the typical indicators of iron deficiency,
including iron reductase activity, using the ferrozine assay (Yi and
Guerinot, 1996). Although iron reductase activity was elevated in
both wild-type and pye-1 plants in response to iron deprivation,
pye-1 mutants showed decreased iron reductase activity com-
pared with the wild type (Figure 4A). Plant roots also respond to
iron deprivation by extruding protons into the apoplast (Yi et al.,
1994). This response lowers the rhizosphere pH and solubilizes
iron, thus increasing iron availability. To determine whether loss
of PYE expression alters iron deficiency–induced rhizosphere
acidification, we grew plants on iron-sufficient media for 5 d,
transferred them to iron-deficient media for 3 d, and then placed
them on agar plates containing the pH indicator Bromocresol
Purple for 24 h. Wild-type plants exhibit typical acidification of
the rhizosphere, which causes the media around the roots to
become yellow. By contrast, pye-1 mutants exhibit a visible
decrease in rhizosphere acidification as indicated by the lack of
discoloration around the root (Figure 4B). These findings suggest
that disruption of PYE expression leads to decreased activation
of typical markers of the iron deficiency response.
We also measured ion content of plants exposed to iron-
sufficient and iron-deficient media. Plants commonly contain
elevated amounts of Zn, Mn, and Co under iron-deficient con-
ditions (Vert et al., 2002) because IRT1 nonspecifically takes up
these metals. Interestingly, roots of pye-1 plants displayed
decreased root Zn, Mn, and Co levels under iron deficiency
compared with the wild type, whereas no differences were
POPEYE Regulates Response to 2Fe 2223
observed in shoots (Figures 4E to 4G). Together, these data
further indicate that while pye-1mutants do exhibit a typical iron
deficiency response, this response ismuted comparedwithwild-
type plants.
To determine how these alterations affected the iron content
of pye-1 mutants, we measured iron content two ways. Perl
staining revealed that pye-1 mutants contain visibly elevated
amounts of ferric iron in their roots compared with wild-type
plants grown on iron-sufficient media (Figure 4C; see Supple-
mental Figure 5A online) but no differences in visible stainable
ferric iron between wild-type and pye-1 leaves (see Supplemen-
tal Figure 5B online). Moreover, quantification of root and shoot
iron content, using inductively coupled plasma–mass spectrom-
etry, revealed that pye-1 mutants contained significantly ele-
vated concentrations of iron in the root under iron-sufficient and
-deficient conditions, as well as in the shoot under iron-deficient
conditions (Figure 4D). This suggests that PYE is involved in
maintaining iron homeostasis under iron-sufficient conditions.
However, it appears to play an even more important role under
iron-deficient conditions, since loss of PYE expression results in
only partial induction of the typical iron deficiency response in
addition to increased accumulation of iron.
Iron Homeostasis Genes and Others Are Regulated by PYE
To further examine the role of PYE, we performed transcrip-
tional profiling of pye-1 mutants and found that loss of PYE
function leads to a number of transcriptional changes. The
expression level of ;490 genes was affected by iron depri-
vation in wild-type plants, while only ;130 genes were af-
fected in pye-1 mutants under the same conditions (Q-value
< 1024; >1.2-fold change) (see Supplemental Data Sets 3A
and 3B online). Analysis of the expression profiles of all genes
affected by iron deficiency in wild-type and pye-1 plants com-
bined with genes differentially expressed between wild-type
and pye-1 mutants under both iron-sufficient and -deficient
conditions identified 661 genes. Hierarchical clustering with
Pearson correlation revealed that these genes fall into eight
groups of coexpressed genes (Figure 5A; see Supplemental
Data Set 3D online). Notably, genes involved in root hair
differentiation, such as MRH2 and MRH6, are repressed in
pye-1 mutants under iron-sufficient and -deficient conditions
(Figure 5A; see Supplemental Data Set 3D online). Loss of
MRH2 or MRH6 function causes alterations in the transition
to tip growth and root hair initiation, respectively (Mark et al.,
Figure 3. Effects of Loss of PYE Function on the Shoot.
(A) Seven-day-old wild-type (WT) and pye-1 plants germinated directly on –Fe media.
(B)Wild-type, pye-1, and pye-1/ProPYE:PYE:GFP complementation lines germinated and grown on iron-sufficient media for 4 d and then shifted to –Fe
for 4 d.
(C) Fourteen-day-old plants germinated on pH 5 to 6 soil (left) and pH 7 to 8 soil (right).
Bars = 1 mm in (A) and (B) and 5 mm in (C). Red circles indicate pye-1 seedlings.
2224 The Plant Cell
2006), which may explain the alterations in root hair develop-
ment seen in pye-1 mutants under iron deficiency.
We also noted that many genes involved in iron homeostasis
were differentially expressed in pye-1 mutants (Figure 5A; see
Supplemental Data Set 3E online). For example, the iron storage
proteins (FER1 and FER4) and oxidative stress proteins, such as
FSD1 (superoxide dismutase), were repressed in both wild-type
and pye-1 mutants under iron deficiency. However, they were
more highly expressed under both iron-sufficient and -deficient
conditions in pye-1 than in wild-type plants (Figure 5A; see
Supplemental Data Set 3D online), indicating that pye-1 roots
experience increased iron storage and oxidative stress under
both conditions. By contrast, genes encoding known and
putative metal ion transporters (NRAMP4, a Ccc1p-like gene)
and metal ion transport facilitators (OPT3 and FRD3) are in-
duced by iron deficiency in wild-type plants and are expressed
even more highly in pye-1 mutants under both sufficient and
deficient conditions (Figure 5A; see Supplemental Data Set 3D
online). These alterations suggest that there is an increased
intercellular and intracellular ironmovementwithinpye-1mutants
under both conditions and that PYE acts directly or indirectly
to repress this activity in wild-type plants. Interestingly, IRT1,
which encodes an epidermal iron transporter that takes up iron
from the rhizosphere (Vert et al., 2002), is upregulated by iron
Figure 4. Iron Deficiency Response of pye-1 Mutants.
(A) Iron reductase activity of wild-type (WT) and pye-1 plants germinated and grown on +Fe media for 5 d and then shifted to –Fe media for 3 d (6SE).
The ferrozine assay was performed, in quadruplicate, on 10 pooled plant roots. Significant differences from the wild type are indicated by *P < 0.05.
(B) Rhizosphere acidification of 7-d-old wild-type, pye-1, and bts-1 plants exposed to iron-deficient media for 3 d. Plants were then transferred to agar
plates containing Bromocresol Purple for 1 d. Acidification is indicated by yellow color around the roots.
(C) Perl-stained maturation zone of 2-week-old plants germinated and grown on iron-sufficient media.
(D) to (G) Fe (D), Zn (E), Mn (F), and Co (G) content of wild-type and pye-1 roots and shoots germinated and grown on +Fe (+) media for 5 d and then
shifted to –Fe (–) media and grown for 3 d (6SE). Gray indicates the wild type, and white indicates pye-1. Significant differences from the wild type are
indicated by *P < 0.05.
Bars = 3 mm in (B) and 50 mm in (C).
POPEYE Regulates Response to 2Fe 2225
deficiency in both wild-type and pye-1 plants. However, IRT1 is
not as elevated in pye-1 plants as in wild-type plants by iron
deficiency (Figure 5A; see Supplemental Data Set 3D online).
Thus, although there is increased iron movement within pye-1
mutants, there is decreased iron uptake from the rhizosphere.
PYE Binds to the Promoters of Genes Involved in
Iron Homeostasis
To determine if and how PYE directly regulates iron homeostasis
genes, we set out to identify PYE direct targets by performing
chromatin immunoprecipitation (ChIP) on roots of pye-1mutants
expressing ProPYE:PYE:GFP grown on iron-deficient media. As
a control, we conducted the same experiment on wild-type
plants. These samples were hybridized to custom long oligonu-
cleotide (;60-mer) Arabidopsis promoter microarrays (Sozzani
et al., 2010). We reasoned that genes that are differentially
expressed under iron-deficient conditions in pye-1 should be
overrepresented among the direct targets. With this information
in hand, we systematically explored the parameter space to
optimize our detection settings for enriched regions in the ChIP-
on-chip experiments (see Supplemental Figure 8A online). Using
highly stringent conditions in which transcriptional targets were
mostly enriched, we identified 44 chromosomal regions that
could be attributed to >70 PYE direct target genes (see Supple-
mental Data Set 3F online). Among these are members of the
major facilitator superfamily (MFS-1) general substrate trans-
porters, amino acid transporters, hydrolases, and transcription
factors.
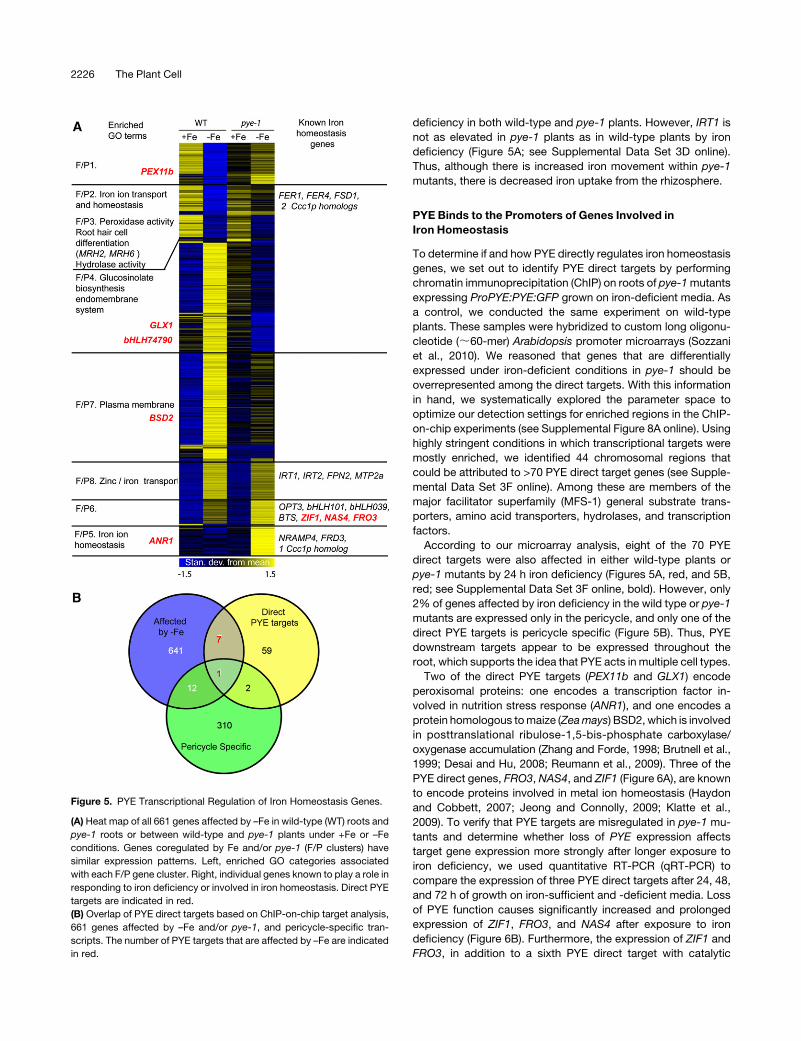
According to our microarray analysis, eight of the 70 PYE
direct targets were also affected in either wild-type plants or
pye-1 mutants by 24 h iron deficiency (Figures 5A, red, and 5B,
red; see Supplemental Data Set 3F online, bold). However, only
2% of genes affected by iron deficiency in the wild type or pye-1
mutants are expressed only in the pericycle, and only one of the
direct PYE targets is pericycle specific (Figure 5B). Thus, PYE
downstream targets appear to be expressed throughout the
root, which supports the idea that PYE acts in multiple cell types.
Two of the direct PYE targets (PEX11b and GLX1) encode
peroxisomal proteins: one encodes a transcription factor in-
volved in nutrition stress response (ANR1), and one encodes a
protein homologous tomaize (Zeamays) BSD2, which is involved
in posttranslational ribulose-1,5-bis-phosphate carboxylase/
oxygenase accumulation (Zhang and Forde, 1998; Brutnell et al.,
1999; Desai and Hu, 2008; Reumann et al., 2009). Three of the
PYE direct genes, FRO3, NAS4, and ZIF1 (Figure 6A), are known
to encode proteins involved in metal ion homeostasis (Haydon
and Cobbett, 2007; Jeong and Connolly, 2009; Klatte et al.,
2009). To verify that PYE targets are misregulated in pye-1 mu-
tants and determine whether loss of PYE expression affects
target gene expression more strongly after longer exposure to
iron deficiency, we used quantitative RT-PCR (qRT-PCR) to
compare the expression of three PYE direct targets after 24, 48,
and 72 h of growth on iron-sufficient and -deficient media. Loss
of PYE function causes significantly increased and prolonged
expression of ZIF1, FRO3, and NAS4 after exposure to iron
deficiency (Figure 6B). Furthermore, the expression of ZIF1 and
FRO3, in addition to a sixth PYE direct target with catalytic
Figure 5. PYE Transcriptional Regulation of Iron Homeostasis Genes.
(A) Heat map of all 661 genes affected by –Fe in wild-type (WT) roots and
pye-1 roots or between wild-type and pye-1 plants under +Fe or –Fe
conditions. Genes coregulated by Fe and/or pye-1 (F/P clusters) have
similar expression patterns. Left, enriched GO categories associated
with each F/P gene cluster. Right, individual genes known to play a role in
responding to iron deficiency or involved in iron homeostasis. Direct PYE
targets are indicated in red.
(B) Overlap of PYE direct targets based on ChIP-on-chip target analysis,
661 genes affected by –Fe and/or pye-1, and pericycle-specific tran-
scripts. The number of PYE targets that are affected by –Fe are indicated
in red.
2226 The Plant Cell
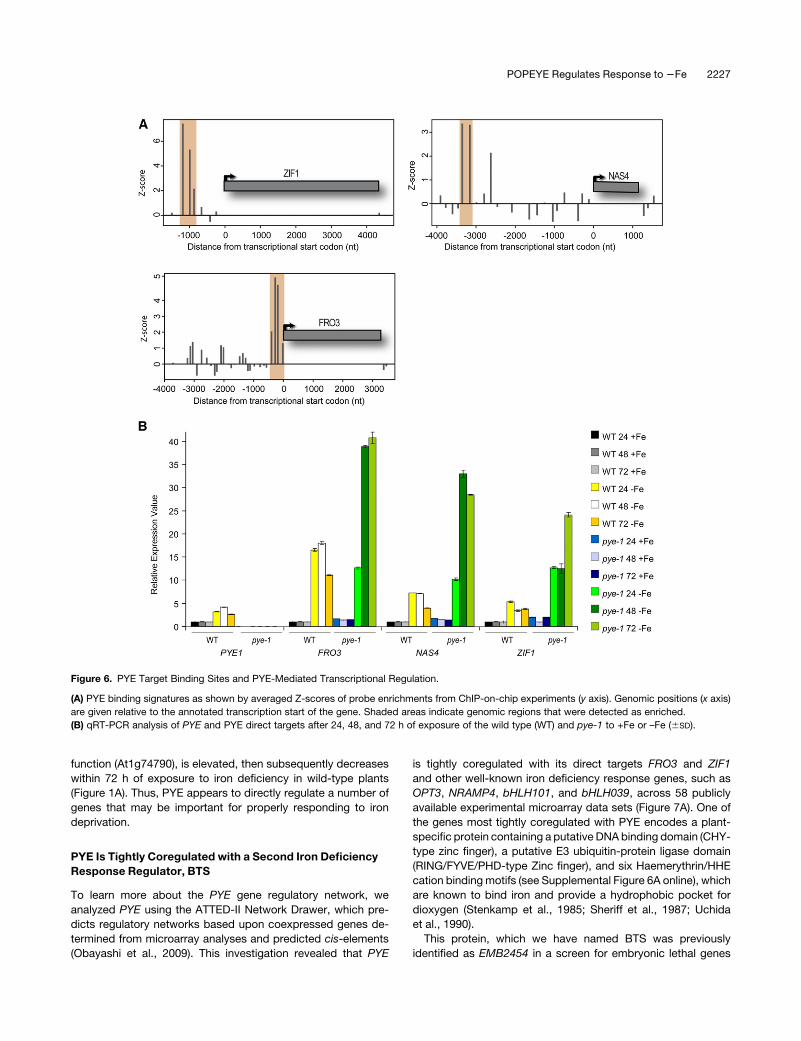
function (At1g74790), is elevated, then subsequently decreases
within 72 h of exposure to iron deficiency in wild-type plants
(Figure 1A). Thus, PYE appears to directly regulate a number of
genes that may be important for properly responding to iron
deprivation.
PYE Is Tightly Coregulated with a Second Iron Deficiency
Response Regulator, BTS
To learn more about the PYE gene regulatory network, we
analyzed PYE using the ATTED-II Network Drawer, which pre-
dicts regulatory networks based upon coexpressed genes de-
termined from microarray analyses and predicted cis-elements
(Obayashi et al., 2009). This investigation revealed that PYE
is tightly coregulated with its direct targets FRO3 and ZIF1
and other well-known iron deficiency response genes, such as
OPT3, NRAMP4, bHLH101, and bHLH039, across 58 publicly
available experimental microarray data sets (Figure 7A). One of
the genes most tightly coregulated with PYE encodes a plant-
specific protein containing a putative DNAbinding domain (CHY-
type zinc finger), a putative E3 ubiquitin-protein ligase domain
(RING/FYVE/PHD-type Zinc finger), and six Haemerythrin/HHE
cation bindingmotifs (see Supplemental Figure 6A online), which
are known to bind iron and provide a hydrophobic pocket for
dioxygen (Stenkamp et al., 1985; Sheriff et al., 1987; Uchida
et al., 1990).
This protein, which we have named BTS was previously
identified as EMB2454 in a screen for embryonic lethal genes
Figure 6. PYE Target Binding Sites and PYE-Mediated Transcriptional Regulation.
(A) PYE binding signatures as shown by averaged Z-scores of probe enrichments from ChIP-on-chip experiments (y axis). Genomic positions (x axis)
are given relative to the annotated transcription start of the gene. Shaded areas indicate genomic regions that were detected as enriched.
(B) qRT-PCR analysis of PYE and PYE direct targets after 24, 48, and 72 h of exposure of the wild type (WT) and pye-1 to +Fe or –Fe (6SD).
POPEYE Regulates Response to 2Fe 2227
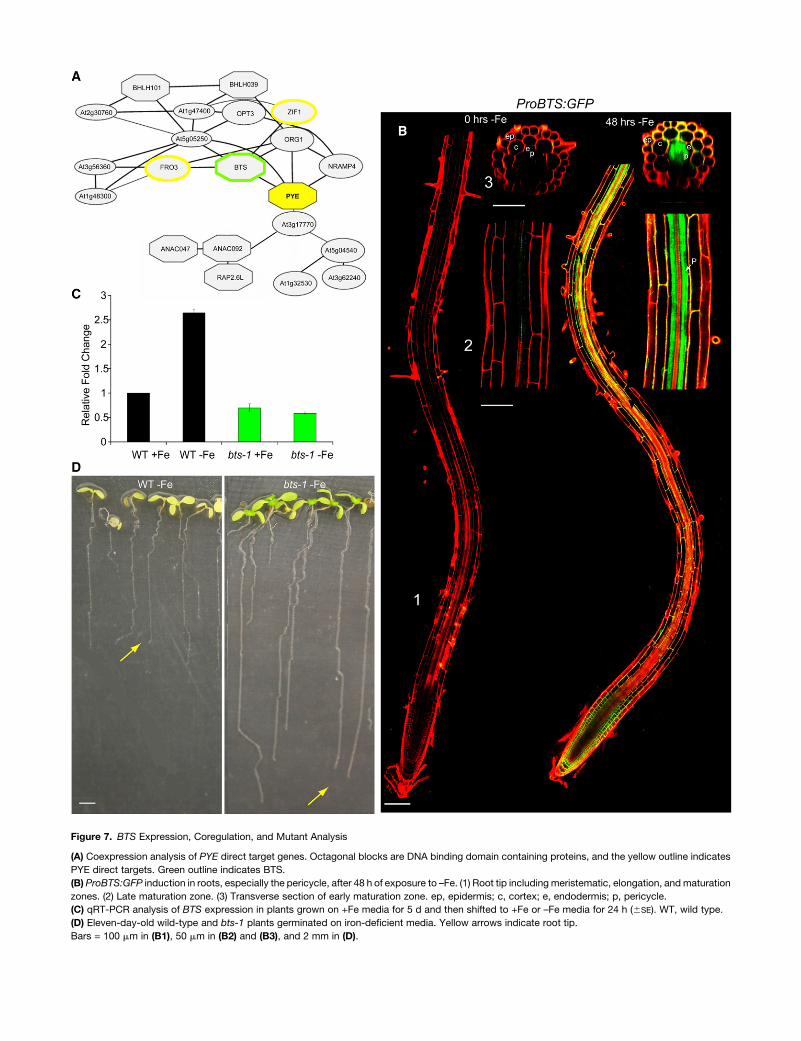
Figure 7. BTS Expression, Coregulation, and Mutant Analysis
(A) Coexpression analysis of PYE direct target genes. Octagonal blocks are DNA binding domain containing proteins, and the yellow outline indicates
PYE direct targets. Green outline indicates BTS.
(B) ProBTS:GFP induction in roots, especially the pericycle, after 48 h of exposure to –Fe. (1) Root tip including meristematic, elongation, and maturation
zones. (2) Late maturation zone. (3) Transverse section of early maturation zone. ep, epidermis; c, cortex; e, endodermis; p, pericycle.
(C) qRT-PCR analysis of BTS expression in plants grown on +Fe media for 5 d and then shifted to +Fe or –Fe media for 24 h (6SE). WT, wild type.
(D) Eleven-day-old wild-type and bts-1 plants germinated on iron-deficient media. Yellow arrows indicate root tip.
Bars = 100 mm in (B1), 50 mm in (B2) and (B3), and 2 mm in (D).
(McElver et al., 2001), indicating that it is essential for survival
even under standard growth conditions. We characterized its
expression pattern using microarray analysis and visual inspec-
tion of lines containing a transcriptional GFP fusion construct.
We found that, similar to PYE, BTS is upregulated by iron
deficiency specifically in the pericycle (Figures 1A and 7B). We
also analyzed the growth and development of a partial loss-of-
function allele in which BTS induction by iron deficiency is
disrupted (Figure 7C). In contrast with pye-1 mutants, bts-1
plants germinated on iron-sufficient media then shifted to iron-
deficient media developed longer roots (Figure 7D) that acidified
the rhizosphere more than the wild type (Figure 4B), and their
shoots were greener and larger than wild-type plants after
extended exposure to iron deficiency (Figure 7D). These findings
suggest that bts-1 plants have increased tolerance to iron
deprivation. Hence, the name BTS, which reflects how this
protein appears to play a role in responding to iron deficiency
opposite that of PYE.
Based on its putative protein structure, it is possible that BTS
may have both transcriptional regulatory capabilities as well as
the ability to act as an E3 ligase that interactswith target proteins,
causing protein degradation through ubiquitin-mediated conju-
gation. Suspecting that BTS may interact with PYE or PYE
targets, we performed yeast two-hybrid screening with the
hybrid BTS protein as bait and a root-specific cDNA library as
prey. We found nine interacting proteins with this approach (see
Supplemental Figures 7A and 7B online). Two of these proteins,
bHLH115 (At1g51070) and bHLH104 (At4g14410), are members
of the Group IVc bHLH family, which also includes the iron
homeostasis protein ILR3. Moreover, bHLH family IVc is a small
subgroup of the bHLH family IV, which also includes PYE (Heim
et al., 2003) (Figure 8A; see Supplemental Data Set 4A online).
To validate our original yeast two-hybrid screen and further
determine whether BTS might interact with additional members
of the bHLH IV family, such as PYE, we cloned the open read-
ing frames of the six remaining members of the bHLHIVb and
bHLHIVc gene families (At1g51070 [bHLH115], At4g14410
[bHLH104], At4g36060 [bHLH11], At3g19860 [bHLH121],
At5g54680 [ILR3], and At3g23210 [bHLH34]) and performed
directed yeast two-hybrid analysis. We used BTS as the bait and
PYE and the six putative PYE homolog proteins, as well as the
bHLH domain of MYC2 as a bHLH domain control, as prey. We
found that BTS interacts with three members of subgroup IVc,
AtbHLH104, ILR3, and AtbHLH115, but does not interact with
PYE (Figure 8B).
Although BTS does not interact with PYE or PYE targets in
yeast, we were intrigued by the finding that BTS interacts with
proteins so closely related to PYE. Since bHLH proteins com-
monly form heterodimers and homodimers that interact with
downstream targets, we theorized that PYE might form hetero-
dimers with the PYE homologs that interact with BTS. We
performed directed yeast two-hybrid analysis using PYE as
prey and bHLH104, ILR3, and bHLH115 as baits. We found
that PYE interacts specifically with ILR3 and bHLH115 (Figure
8C). bHLH115 is also ;2-fold upregulated within 72 h of iron
deficiency in whole roots (Figure 1A). Moreover, ILR3 and
AtbHLH115 are induced specifically in the pericycle (P value <
0.0011) and stele (P value < 0.00013), respectively, by iron
deficiency (see Supplemental Data Set 2A online; Dinneny et al.,
2008). These findings suggest that PYE and ILR3 or bHLH115
could form heterodimers that may interact with BTS.
DISCUSSION
Plants have evolved remarkable abilities to withstand a range of
environmental changes. The capacity to take up and store
excess iron under sufficient conditions and use it when plants
are exposed to low iron conditions is important for tolerating
fluctuations in local iron availability. Recent studies have high-
lighted transcriptional responses to iron deprivation (Dinneny
et al., 2008; Buckhout et al., 2009; Yang et al., 2010). In this study,
we describe a transcriptional regulator, PYE, which appears to
regulate these responses.
A Pericycle-Specific Iron Deficiency Response Is Important
for Growth and Development
Previously, using cell type–specific transcriptional profiling, we
found that the stele, which includes the pericycle, is the most
responsive cell type within the root (Dinneny et al., 2008). In this
study, we observed that the largest group of genes coordinately
expressed in response to iron deficiency is found in the pericycle.
In addition, the iron deficiency response in the pericycle appears
to be enriched in GO terms associated with transcription factors.
Therefore, we propose that the pericycle serves as a transcrip-
tional regulatory center for the iron deficiency response, which
may explain why the transcription factor, PYE, is expressedmost
highly in the pericycle in response to iron deprivation.
Microarray data and in vivo analysis of ProPYE:GFP expres-
sion indicate that PYE is most highly expressed in the pericycle
within the maturation zone. However, PYE protein is localized in
the nuclei of all cells within the root when plants are exposed to
iron deficiency, and the majority of PYE downstream targets are
expressed outside of the pericycle in response to iron deficiency
(Figure 5B). Furthermore, Perl staining indicates that excess iron
is localized to multiple cell types. Thus, after induction by iron
deficiency within the pericycle, PYEmight thenmove throughout
the root, where it localizes to the nuclei, binds to DNA, and
regulates the transcription of its target genes. Thiswould suggest
that the sensing of iron deficiency may occur in a dedicated
tissue, the pericycle, and that the response is orchestrated over
all cell types by transcription factormovement. Alternatively,PYE
could be expressed to some extent throughout the root in
response to iron deprivation. The accumulation of PYE protein
within all cells of the root could be due to differential stability
within different cell types and developmental zones.
PYE-MediatedGeneRegulation Is Important forMaintaining
Fe Homeostasis
Transcriptional profiling of wild-type plants (Dinneny et al., 2008;
Buckhout et al., 2009; this study) reveals that the iron deprivation
response causes widespread transcriptional alterations. It ap-
pears that many genes must be coordinately regulated before
and after exposure to iron deficiency to trigger a sufficient iron
deficiency response.Our data indicate that PYE is involved in this
POPEYE Regulates Response to 2Fe 2229
coordination. For example, ChIP-on-chip analysis indicates that
the FRO3 and NAS4 promoters are directly bound by PYE. In
addition, transcriptional analysis indicates that FRO3 and NAS4
are upregulated in wild-type plants by iron deficiency, yet they
are upregulated even more in pye-1 mutants by iron deficiency.
Thus, PYE appears to directly repress the induction of FRO3 and
NAS4 under iron deficiency. FRO3 encodes an iron reductase,
while NAS4 is an enzyme that synthesizes nicotianamine, an iron
chelator important for intercellular Fe transport (Klatte et al.,
2009). Although FRO3 and NAS4 single mutants do not have a
phenotype under iron sufficiency or iron deficiency, FRO3 is
induced in the vasculature of roots and in the root tip by iron
deficiency and localized to the mitochondrial membrane (Jeong
andConnolly, 2009). Moreover, quadruple nasmutants (nas4x-1)
are sterile with constitutive expression of iron uptake responses
and intercostal chlorosis (Klatte et al., 2009). Notably, nas4x-1
and the related chloronervamutant of tomato (Solanum lycoper-
sicum) accumulate iron that is biologically unavailable and,
consequently, exhibit an increase in the iron deprivation re-
sponse (King, 1991; Klatte et al., 2009).
By contrast, pye-1 mutants, which also exhibit elevated iron
content compared with the wild type, display decreased toler-
ance to iron deprivation and exhibit a weaker iron deficiency
response. We propose that this difference could be due to
differences in the function of PYE compared with NAS4. PYE is a
regulatory protein that regulates the expression of iron defi-
ciency–responsive genes, while NAS is an enzymatic protein
involved in the synthesis of NA, an iron chelator important for
intercellular iron transport. While lower NAS may disrupt the
bioavailability of iron within specific plant organs, triggering a
typical iron deprivation response, loss of PYE appears to first
affect the global transcriptional response to iron deprivation.
These altered transcriptional responses likely result in lower
induction of the iron deficiency response, comparedwith thewild
type, and decreased use of iron stores. Consequently, pye-1
mutants exhibit increased iron accumulation in addition to de-
creased iron deficiency response.
Elevated iron content can lead to the formation of harmful
reactive oxygen species and could explain why iron storage
proteins FER1, FER4, and superoxide dismutase (FSD1) are
constitutively upregulated in pye-1 mutants. This may also
explain why pye-1 mutants exhibit decreased expression of
IRT1, which uptakes iron from the rhizosphere under iron defi-
ciency and why genes involved in intra- and intercellular iron
transport, such as NRAMP4,OPT3, and FRD3, are misregulated
in pye-1. IRT1 takes up Zn, Mn, and Co from the rhizosphere
under iron deficiency. Thus, decreased Fe uptake by IRT1 likely
leads to the decreased Mn and Zn content and decreased
expression of Zn, Ni, Mn, and Co detoxification genes we
observed in pye-1 roots relative to the wild type. ZIF1, however,
is an exception to this observation. The gene that encodes ZIF1,
a Zn vacuolar efflux protein involved in Zn detoxification (Haydon
and Cobbett, 2007), is upregulated by iron deficiency in pye-1
compared with the wild type. This difference could occur
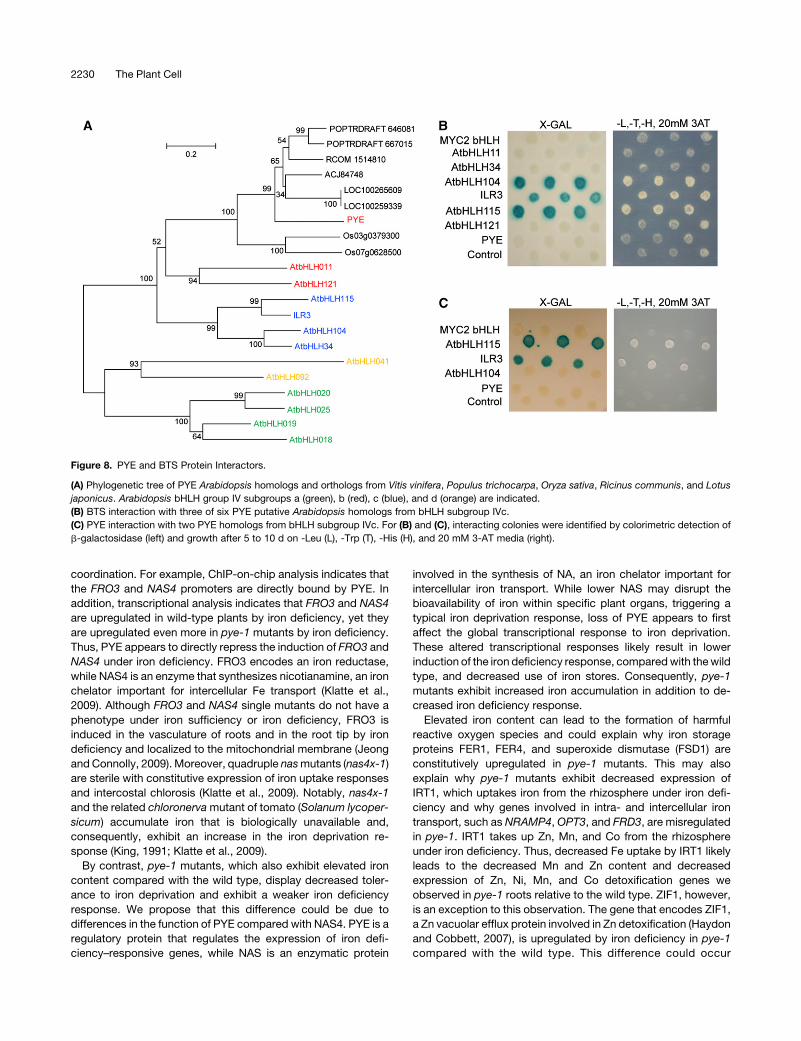
Figure 8. PYE and BTS Protein Interactors.
(A) Phylogenetic tree of PYE Arabidopsis homologs and orthologs from Vitis vinifera, Populus trichocarpa, Oryza sativa, Ricinus communis, and Lotus
japonicus. Arabidopsis bHLH group IV subgroups a (green), b (red), c (blue), and d (orange) are indicated.
(B) BTS interaction with three of six PYE putative Arabidopsis homologs from bHLH subgroup IVc.
(C) PYE interaction with two PYE homologs from bHLH subgroup IVc. For (B) and (C), interacting colonies were identified by colorimetric detection of
b-galactosidase (left) and growth after 5 to 10 d on -Leu (L), -Trp (T), -His (H), and 20 mM 3-AT media (right).
2230 The Plant Cell
because ZIF1 is a direct PYE target. Therefore, PYE-mediated
repression of ZIF1 may be important for maintaining Zn homeo-
stasis under iron deficiency while other Zn detoxification genes
(MTPa2) and Ni, Co, and Mn detoxification genes (FPN2 and
Ccc1p-like) are misregulated indirectly by PYE.
Since iron is a major component of the photosynthetic and
mitochondrial electron transport chains and a component of
many enzymatic cofactors, alterations in iron content may also
disrupt metabolism, leading to the generation of harmful cyto-
toxins, in addition to reactive oxygen species. This may explain
why genes encoding proteins involved in critical metabolic
processes are direct PYE targets. For example, PEX11b, a
peroxin involved in light-induced peroxisome proliferation (Desai
and Hu, 2008), is downregulated by iron deprivation in wild-type
plants, yet unaffected by iron deficiency inpye-1, suggesting that
PYE may repress PEX11b. By contrast, a BSD2-like gene is
downregulated in pye-1 mutants under both iron-sufficient and
-deficient conditions compared with wild-type plants. BSD2
positively regulates the accumulation of ribulose-1,5-bisphos-
phate carboxylase/oxygenase protein in maize (Brutnell et al.,
1999), suggesting that PYE activates key photosynthetic pro-
cesses. In addition, GLX1, a glyoxalase I homolog (Reumann
et al., 2009), is activated by iron deficiency in the wild type and
repressed in pye-1 by iron deficiency. Glyoxalase I enzymes
catalyze a reaction that causes the detoxification of methylgly-
oxal, a cytotoxic byproduct of glycolysis. GLX1 has been shown
to play a role in salt stress and to be induced by salt, osmotic
stress, and phytohormonal stimuli, presumably as a result of
elevated glycolysis caused by salt stress (Espartero et al., 1995).
Thus, it is possible that PYE both represses and activates
specific metabolic processes in response to iron deprivation.
Loss of PYE function leads to several additional physiological
and developmental alterations in response to iron deficiency. In
addition to becoming chlorotic, pye-1 mutants develop swollen
emerging lateral roots, develop shorter primary and lateral roots
due to inhibition of epidermal and cortical cell elongation, and
arrest growth shortly after exposure to iron-deficient conditions.
Although chlorosis and growth arrest are commonly associated
with iron deficiency, we were surprised by the developmental
alterations pye-1 mutants also displayed. Transcriptional profil-
ing of pye-1 roots helped us identify several genes involved in
development that may also be part of the response to iron
deficiency. Peroxidases and hydrolases associated with cell wall
remolding are upregulated by iron deficiency in wild-type plants.
However, these genes appear to be repressed in pye-1mutants
under iron-sufficient and -deficient conditions. This transcrip-
tional alteration may explain why the lateral roots of pye-1 plants
are swollen andwhy the epidermal and cortex cells of the primary
root are not as elongated as wild-type plants. In addition, the
transcriptional regulator ANR1 is a direct PYE target that is
misregulated in pye-1 mutants exposed to iron deprivation.
ANR1 is aMADSbox transcription factor that positively regulates
lateral root development in response to nitrate deficiency (Zhang
and Forde, 1998). Therefore, misregulation of ANR1 expression
may be associated with disruption of lateral root development
exhibited by pye-1 mutants.
Iron deprivation also causes decreased expression of root hair
morphogenesis genes, MRH2 and MRH6, in both the wild type
and pye-1 mutants. In addition, loss of PYE function results in
lower expression of MRH2 and MRH6 under iron-sufficient
conditions. Loss ofMRH2 andMRH6 function in wild-type plants
under normal growth conditions causes developmental altera-
tions in root hair development similar to those seen in pye-1
mutants grown under iron deficiency (Mark et al., 2006). There-
fore, lowered expression of these genes in pye-1 mutants under
iron-sufficient and -deficient conditions may explain the exacer-
bated root hair phenotype observed in pye-1 mutants.
While PYE directly regulates ANR1, PYE also appears to
indirectly regulate other transcription factors, such as bHLH039
and bHLH101. bHLH039 and bHLH101 are two bHLH subgroup
Ib members that are strongly induced by iron deficiency (Yuan
et al., 2008). The upregulation of bHLH039 in pye-1 mutants
under both normal and iron deficiency conditions is of particular
interest because bHLH039 is an FIT binding partner. FIT is a
master regulator of the iron deficiency response. Therefore, PYE
function may mediate widespread transcriptional changes
through interaction with FIT or other factors that are direct PYE
targets.
We have shown that genes encoding proteins with different
biological functions are affected by loss of PYE function under
iron-sufficient conditions (Figure 5A). Furthermore, iron content
is elevated in pye-1 roots under iron sufficiency. Expression
analysis and ProPYE:GFP analysis using confocal microscopy
suggest that PYE is present in trace amounts under iron suffi-
ciency conditions. Thus, PYE appears to play some role in iron
homeostasis under iron-sufficient conditions. However, PYE
expression is induced by iron deficiency and, in contrast with
FIT, another bHLH transcription factor that plays a key role in iron
homeostasis, the physiological effects of loss of PYE function are
seen primarily under low iron conditions. Taken together, our
data indicate that PYE is a unique transcriptional regulator that,
when elevated under conditions of low iron availability, regulates
the expression of genes involved in a range of biological activities
important for responding to iron-deficient conditions.
PYE Interacts with Other Proteins Involved in
Iron Homeostasis
bHLH proteins, such as PYE, commonly form heterodimers and
homodimers that interact with downstream targets. Therefore, it
is possible that PYE may regulate downstream targets with a
binding partner, specifically ILR3 or bHLH115. ILR3 plays a role
in metal ion–mediated auxin sensing, and microarray analysis of
gain of function ilr3-1 mutants reveals decreased expression of
three Ccc1p homologs possibly involved in facilitating metal ion
transport (Rampey et al., 2006). Notably, Ccc1p homologs are
also elevated in pye-1 under both iron-sufficient and -deficient
conditions. Therefore, both PYE and ILR3 appear to repress
expression of these genes. While we were not able to detect
binding of PYE to the promoters of these homologs under our
conditions, it is possible that PYE and ILR3 could interact to
regulate the expression of Ccc1p homologs and other down-
stream targets involved in metal iron homeostasis.
Surprisingly, in addition to PYE, ILR3 and bHLH115 also
interact with BTS, which is involved in iron homeostasis and
tightly coregulated with PYE. Thus, it is tempting to speculate
POPEYE Regulates Response to 2Fe 2231
that interactions among PYE, ILR3, bHLH115, and BTS are
important for responding to iron deficiency. But the question
remains: Why are PYE and BTS both induced in response to –Fe
when they appear to play opposite roles in the iron deficiency
response? Maintaining iron homeostasis under fluctuating
growth conditions requires a balance of many processes, in-
cluding inhibition and activation of iron uptake from the rhizo-
sphere, intercellular and intracellular iron transport, and
alterations in photosynthesis and metabolism. We propose that
under conditions of low iron availability, PYE expression is
induced so that PYE can help maintain this balance by tran-
scriptionally regulating the expression of genes involved in many
of these processes. However, too much or too little of this
regulation could disrupt metal ion homeostasis rather than
maintain it. Hence, the inhibitory effects of BTS, which we
hypothesize acts as a check on PYE activity since it appears to
negatively regulate the response to iron deprivation, are induced
by this condition in a similar manner to PYE. BTS could be
elevated in response to iron deficiency to disrupt PYE function by
interacting with PYE binding partners, such as ILR3 and
bHLH115. Based on the increased expression of BTS in a
pye-1 background under iron deficiency (Figure 5A), it is also
possible that BTS is a negatively regulated downstream target of
PYE. In that case, elevation of PYE under iron deficiency would
inhibit the repressive activity of BTS. Alternatively, BTS and PYE
could be regulated independently by separate activators and
repressors involved inmaintaining iron homeostasis. Futurework
will explore the relevance of the potential interaction between
BTS and PYE.
The discovery of two novel coregulated proteins, one of which
is a bHLH transcription factor that plays an important role in iron
homeostasis, increases our understanding of the regulatory
networks involved in plant responses to the environment and
enables us to further explore how spatiotemporal regulation of
regulatory factors and their interactors controls the nutritional
status of plants.
METHODS
Plant Materials and Growth Conditions
The Arabidopsis thaliana ecotype Columbia (Col-0) was used for all
experiments. A T-DNA insertion line for pye-1 (SALK_021217) was
confirmed using PCR with T-DNA left border primer (LBb1) and gene-
specific primers (59- TTCAAGACCTCATTCACTGGC-39 and 59-GGGG-
ATTGATTATGTTTGGTG-39). bts-1 (SALK_016526) was confirmed with
59-CCAAATGCGTTCGTAGGTAAG-39 and 59-TCAGATTTACACAAATT-
TGCAGC-39. After surface sterilization using 70% ethanol for 2 min
followed by 30% bleach and 0.02% Triton X-100 for 15 min, seeds were
rinsed three times with sterile water and stratified at 48C for 2 to 4 d
before being planted on media. Iron-sufficient (+Fe) media is standard
Murashige andSkoogmediawith 0.05%MES, 1%sucrose, 1%agar, and
0.1 mM FeEDTA substituted for iron sulfate. Iron deficient (2Fe) media is
the same, with 300 mM ferrozine, an iron chelator, substituted for iron
sulfate. For microarray analysis and all other experiments in which
seedlings were shifted from iron-sufficient to either sufficient or deficient
media, Nylon mesh (Nitex Cat 03-100/44; Sefar) was placed on top of the
solidified media to facilitate transfer. Seeds were evenly placed on the
mesh in a single row at a density of ;20 seeds/cm in two rows. For
characterization of phenotypes, 8 to 10 seeds were sown 3 to 4 mm
apart. Seeds were sown and allowed to germinate on vertically posi-
tioned media plates in a Percival incubator with 16 h of daily illumination
at 228C. High pH soil was generated by adding CaO (7.8 gm CaO/kg;
Sigma-Aldrich) to soil as in Kim et al. (2006).
Plasmid Construction and Plant Transformation
Standard molecular biology techniques and the Gateway system
(Invitrogen) were used for the cloning procedures. Genomic DNA from
Arabidopsis ecotype Col-0 was used as the template for amplifica-
tion of the upstream regulatory promoter sequence for ProBTS:
GFP (3000 bp) using 59-ATGAGATGAAATGTCTTATCTTTAT-39 and
59-TTCCCCCAAAGCTTATCTCCGTTTT-39andProPYE:GFP (1120bp) using
59- ACCGCAAAACTATATATAGTATTT-39 and 59-CTTTGCTTTTATTACA-
GAACAAGA-39. Each promoter region was cloned into pDONRP4P1R
(Invitrogen). For the translational fusions, 59-ATGGCGACGCCGTTAC-
CAGA-39 and 59-GGATGAGGTTGAGCAGTCCGGGGG-39 were used to
clone the BTS open reading frame. 59-ATGGTATCGAAAACTCCTTC-39
and 59-TTCACTGGCTTTCAGCCGCTCTCC-39 were used to clone the
PYE open reading frame. Each open reading frame was cloned into
pENTR/D-TOPO (Invitrogen). Multisite cloning (Invitrogen) was used
to place each promoter and open reading frame into a pGREEN
(Hellens et al., 2000) binary vector derivative containing a NOS termi-
nator with a C-terminal GFP fusion and spectinomycin and BASTA
resistance genes (Lee et al., 2006). Each plasmid was transformed
into the wild type by the floral dip method. Single gene transformants
were detected by T2 3:1 growth segregation on growth media
containing BASTA. To determine whether PYE complements the
pye-1 mutation, ProPYE:PYE:GFP was transformed into pye-1 homo-
zygous lines. For all transgenic plant lines constructed, five to six
different T3 homozygous lines were analyzed. Lines shown in
Figures 1C, 1D, 7B, and Supplemental Figure 2 online are represen-
tative of typical expression patterns.
Microscopy and Phenotypic Analyses
Root growth rates were examined by marking the position of the root tips
daily after shifting to iron-deficient media. Plates were scanned when
plants were 8 d old, and ImageJ software was used for root length
measurements. Lateral roots and lateral root primordia of 8-d-old plants
were measured using light microscopy. Laser scanning confocal micros-
copy (Zeiss LSM 510) was used for observation of roots of plants stained
with 10 mM propidium iodide.
Ferric chelate reductase assays were performed as previously de-
scribed (Yi and Guerinot, 1996). Chlorophyll content was measured
in 2-week-old plants germinated on pH 7 to 8 soil. All leaves were
collected and ground to powder in liquid nitrogen. The powder was
resuspended in 80% acetone on ice and centrifuged at 10,000g at
48C for 5 min. Chlorophyll concentrations were calculated from spec-
troscopy absorbance measurements at 663.2, 646.8, and 470 nm
(Lichtenthaler, 1987).
To localize Fe3+, 7- and 14-d-old seedlings grown on iron-sufficient
media were vacuum infiltrated with Perl’s stain solution (equal volumes of
4% [v/v] HCl and 4% [w/v] K-ferrocyanide) for 30 min. Seedlings were
then incubated for another 30min in PERL staining solution, washed three
times with water, observed, and photographed with a Leica DM500B
microscope.
Rhizosphere acidification was performed as previously described
(Yi and Guerinot, 1996). Briefly, seeds were germinated on iron-sufficient
media for 4 d and then transferred to iron-deficient media for 3 d. The
seeds were finally transferred to a 1% agar plate containing 0.006%
Bromocresol Purple and 0.2 mM CaSO4 (pH adjusted to 6.5 with NaOH)
for 24 h.
2232 The Plant Cell
Tissue Elemental Analysis
Seeds were evenly placed on the mesh in a single row at a density of
;20 seeds/cm in two rows, germinated, and grown on mesh on iron-
sufficient media for 4 d, and then shifted to iron-sufficient or -deficient
plates for 3 d. Three plates of seedlings per replicate were combined
to generate at least 150 mg of fresh weight. Five replicates of root and
shoot samples were collected separately, rinsed in 18 MV water, and
analyzed by inductively coupled plasma–mass spectrometry for Li, B, Na,
Mg, P, S,K, Ca, Mn, Fe, Co, Ni, Cu, Zn, As, Se, Mo, and Cd as described
by Morrissey et al. (2009).
Gene Expression Analysis and Identification of Differentially
Expressed Genes
For qRT-PCR analyses, whole roots were sliced off and collected in liquid
nitrogen. cDNA was synthesized with Superscript III cDNA synthesis kit
(Invitrogen) from RNA extracted with the RNeasy plant mini kit (Qiagen).
The primers used for qRT-PCR analysis and their associated gene
accession numbers are listed in Supplemental Table 1A online.
For transcriptional profiling of pericycle cells, wild-type seeds from the
J2661 enhancer trap line (Levesque et al., 2006) were germinated on iron-
sufficient media and then shifted to either iron-sufficient or iron-deficient
media for 24 h. Whole roots were sliced off;0.5 cm from the apex. GFP-
marked cells were then collected by fluorescence-activated cell sorting
after protoplastingwhole roots (Birnbaum et al., 2003). Three replicates of
the pericycle samples were collected and analyzed. For global analysis of
gene expression of wild-type and pye-1mutants, whole roots were sliced
off ;0.5 cm from the apex and collected in liquid nitrogen after 24 h of
exposure to iron-deficient or iron-sufficient media. Two replicates of the
whole roots analysis were performed. Total RNA was isolated from the
frozen material using the RNeasy plant mini kit (Qiagen). Fragmented
cRNA probes were prepared using the two-cycle (pericycle) or one-cycle
(whole root) amplification protocol by Affymetrix. Samples were sub-
mitted to Expression Analysis, Inc. for hybridization to Arabidopsis
whole-genome ATH1 Affymetrix GeneChips.
Normalization of probe sets on all arrays and identification of differen-
tially expressed was performed as described (Levesque et al., 2006;
Brady et al., 2007). To detect reproducibility, the Pearson correlation was
calculated between replicates, and a cutoff value to 0.92 was used for all
experiments except for the radial zone data sets where 0.89 was used.
Replicates that did not meet this criterion were not used in the analysis.
Raw values for the whole root time course and all radial zones datasets
except the pericycle were indicated by Dinneny et al. (2008). Raw values
for the pericycle radial zone data set are indicated in Supplemental
Data Set 2A online. Raw values of all genes affected in wild-type and
pye-1 mutants are indicated in Supplemental Data Sets 3A to 3D online.
Affymetrix probe sets that are predicted to hybridize to transcripts from
multiple loci were eliminated based on the lookup table published by
Affymetrix on May 29, 2008. Probe sets that only detect expression
for nuclear-encoded genes were used for further analysis. Genes with a
Q-value < 1024 were declared differentially expressed. For the interpre-
tation of the results, we focused on those with a Q-value < 1024 and a
>1.2- or >1.5-fold change between treatments. To eliminate the effects of
protoplasting, genes whose expression was affected by protoplasting in
a manner opposite from that seen by the treatment in question were
removed from the cell type–specific microarray data sets.
The National Center for Biotechnology Information (NCBI) Gene Ex-
pression Omnibus (GEO) SuperSeries accession number for both micro-
array data sets is GSE21582.
Phylogenetic Analysis
Sequences of putative PYE paralogs were aligned using ClustalW
(Thompson et al., 1994) (see Supplemental Data Set 4A online). Unrooted
phylogenic trees were generated using the neighbor-joining method
(Saitou and Nei, 1987). The optimal trees are shown. The percentage of re-
plicate trees in which the associated taxa clustered together in the boot-
strap test (1000 replicates) are shown next to the branches (Felsenstein,
1985). The trees are drawn to scale, with branch lengths in the same units
as those of the evolutionary distances used to infer the phylogenetic tree.
The evolutionary distances were computed using the Poisson correction
method (Zuckerkandl and Pauling, 1965) and are in the units of the
number of amino acid substitutions per site. All positions containing gaps
and missing data were eliminated from the data set (complete deletion
option). Phylogenetic analyses were conducted in MEGA4 (Tamura et al.,
2007).
Yeast Two-Hybrid Analysis
Yeast two-hybrid analysis was performed as previously described
(Walhout and Vidal, 2001) using a root-specific cDNA library kindly
provided by Ben Scheres. BP cloning (Invitrogen) was used to fuse
BTS and PYE, which had both been cloned into pENTR/D TOPO, into
pDEST-BD. This reaction generated a 59 fusion of the yeast Gal4p binding
domain (BD) to BTS and PYE (BD:BTS and BD:PYE). These constructs
were transformed into yeast strain MaV103 and mated with MaV203,
which had been transformed with 300 ng of a root-specific cDNA library
fused to the Gal4p activation domain (AD). Interacting colonies were
identified by growth after 5 to 10 d on -Leu, -Trp, -His, 20mM3-ATmedia,
-Leu, -Trp, -Uramedia, and colorimetric detection ofb-galactosidase. For
directed yeast two-hybrid analysis between BTS, PYE, and PYE homo-
logs, primers listed in Supplemental Table 1B online were used to clone
the PYE homologs from Col-0 root-specific cDNA library. Each open
reading frame was cloned into pENTR/D-TOPO; the resulting constructs
were used along with pDEST-AD in LR cloning (Invitrogen) reactions
to fuse each open reading frame to the Gal4p activation domain.
ChIP-on-Chip Assay
pye-1/ProPYE:PYE:GFP and wild-type lines were germinated and grown
on iron-deficient media for 5 d. Whole root tissue was fixed and ChIP was
performed using a GFP antibody (Abcam) as described previously
(Leibfried et al., 2005) with some modifications, including chromatin
shearing using a Bioruptor UCD-200 (Diagenode). DNA from the pye-1/
ProPYE:PYE:GFP and wild-type ChIPs were blunted using T4 DNA
polymerase, cleaned up with the Qiagen reaction cleanup kit, amplified
with 22 PCR cycles, and subsequently cleaned up according to the
Agilent Mammalian ChIP-on-chip kit protocol. Two micrograms of DNA
were fragmented and labeled with Cyanine 3-dUTP and Cyanine 5-dUTP
according to the Agilent Mammalian ChIP-on-chip kit protocol. This
labeled wild-type and pye-1/ProPYE:PYE:GFP DNA was hybridized to a
custom long oligonucleotide (;60-mer)Arabidopsis promotermicroarray
(NCBI GEO Platform record GPL10326). The probes on this array cover
the intergenic region, the first intron, and the 59 and 39 untranslated region
sequences of nearly all of the genes of the Arabidopsis genome. A total of
244,000 probes are evenly distributed with densities around 125 bp per
probe for genes encoding transcription factors and 250 bp per probe for
other genes. Hybridization was performed according to the Agilent ChIP-
on-chip protocol, and images were obtained using an Agilent microarray
scanner (model G2565BA) at a resolution of 5 mm (Sozzani et al., 2010).
The NCBI GEO accession number associated with the ChIP-on-chip data
is GSE21338.
Signal extraction and initial data processing were done using the
Agilent feature extraction software. Two biological replicates were con-
ducted, and two technical replicates performed by dye swapping. Each of
the four replicates was treated individually in the subsequent steps. A
processed signal ratio for each probe was calculated by dividing the
processed signal value of the PYE-GFP sample by the processed signal
POPEYE Regulates Response to 2Fe 2233
value of the wild-type sample. To assess the statistical significance for
the enrichment, empirical P values were calculated by random sampling
of processed signal ratios on a single probe basis. For this, 100,000
randomly sampled processed signal ratios were ranked according their
value. From this distribution we derived empirical P values for processed
signal ratios with P = r/n, where P is the empirical P value, r is the number
of simulated replicates that yield in a signal ratio that is higher than the
actual data, and n is the number of replicate samples that have been
simulated (in our case 100,000). Whereas the previous steps were
performed independently for each replicate, we combined the informa-
tion from each replicate by calculating the final probe P values by
multiplying probe P values over all experiments. Those probe P values
were fed into a seed extension algorithm called SeedXrich (Busch et al.,
2010). This algorithm systematically combines different parameters to
call enriched regions. Those parameters were as follows: (1) length of
region in base pairs covered by probes below a definedP value threshold,
(2) a local P value minimum (seed), and (3) the number of nucleotides
allowed as gaps within called regions. For each combination of param-
eters, the detected regions were registered. A gene was assigned to an
enriched region if that region was present within 4000 bp upstream or 300
bp downstream of the transcription start site, in an intron, or 300 bp
downstreamof the genemodel. Each parameter combination produced a
list of called regions and, thus, of assigned genes. The proportion of PYE
response genes (genes that are upregulated or downregulated between
wild-type and pye-1 mutants under iron deficiency; see Supplemental
Data Set 3C online) to all of the assigned genes, which were represented
on the ATH1 array, was recorded for each list. To select optimal param-
eters, we first excluded enriched regions that spanned less than the
expected hybridization length of 200 bp. We also had to exclude the
upstream regulatory region of PYE because there is an additional copy
present in the transgenic line we used for ChIP. We then analyzed the
distribution of the lists created by SeedXrich by parameter sweeping for
the highest number of PYE responses genes (see Supplemental Figure 8
online). The list was obtainedwith the following parameters: probeP value
seed, P < 5 3 1029; probe P value, P < 0.006; minimum length of
hybridization, 210 bp; maximum gap, 200 bp. The SeedXrich program is
available upon request as a python script. To further evaluate our results,
we compared them to the results that we would have obtained using the
ChIPmix algorithm (Martin-Magniette et al., 2008) in a regular fashion.
Compared with SeedXrich, none of the different false discovery rate
thresholds that we tested using ChIPmix produced a higher overlap with
PYE response genes (see Supplemental Figure 8 online).
Accession Numbers
Sequence data from this article can be found in the Arabidopsis Genome
Initiative or GenBank/EMBL databases under the following accession
numbers: At3g47640 (PYE), AT5G13740 (ZIF1), AT1G23020 (FRO3),
AT1G56430 (NAS4), AT1G20010 (btub), At3g18290 (BTS), At4g36060
(bHLH11), At3g23210 (bHLH34), At4g14410 (bHLH104), At5g54680
(bHLH105), At1g51070 (bHLH115), and At3g19860 (bHLH121). Addi-
tional accession numbers can be found in Supplemental Table 1 online.
Supplemental Data
The following materials are available in the online version of this article.
Supplemental Figure 1. Early Responses to Iron Deficiency.
Supplemental Figure 2. PYE Expression Pattern and Localization.
Supplemental Figure 3. Effects of Loss of PYE Function on Root
Development under Iron-Sufficient Conditions.
Supplemental Figure 4. Effects of Loss of PYE Function on Shoot
Development under Iron-Sufficient Conditions and PYE Complemen-
tation.
Supplemental Figure 5. Perl Stain of pye-1 Roots and Leaves.
Supplemental Figure 6. BTS Protein Alignment.
Supplemental Figure 7. PYE and BTS Yeast Two-Hybrid Analysis.
Supplemental Figure 8. Detection of PYE Direct Targets by Inter-
secting Genes from the Set of PYE Response Genes (Supplemental
Table 3C) to the ChIP-on-Chip Gene Lists.
Supplemental Table 1. Primers and Accession Numbers.
Supplemental Data Set 1. Genes Affected by Iron Deficiency in Wild-
Type Roots.
Supplemental Data Set 2. Pericycle-Specific Transcriptional Profile.
Supplemental Data Set 3. Microarray Analysis of Wild-Type and
pye-1 Mutants after 24 h of Exposure to +Fe or –Fe Media.
Supplemental Data Set 4. Alignment of PYE and Putative PYE
Homologs and Orthologs.
ACKNOWLEDGMENTS
We thank Joel Burrill, Krisstonia Spruiell, and Kimberly Lewis for
technical assistance, David Orlando for writing the R-script used for
running the affinity propagation clustering algorithm, Hongchang Cui
for designing and implementing the ChIP-on-chip technology, and
Mary Lou Guerinot, Erin Connolly, Jose Dinneny, Siobhan Brady, and
members of the Benfey lab and Guerinot lab for helpful discussion
and reviewing of the manuscript. T.A.L. was supported by a National
Science Foundation Minority Postdoctoral Research Fellowship. This
work was funded by a grant from the National Science Foundation
AT2010 Program.
Received January 25, 2010; revised June 21, 2010; accepted July 13,
2010; published July 30, 2010.
REFERENCES
Arrivault, S., Senger, T., and Kramer, U. (2006). The Arabidopsis metal
tolerance protein AtMTP3 maintains metal homeostasis by mediating
Zn exclusion from the shoot under Fe deficiency and Zn oversupply.
Plant J. 46: 861–879.
Bauer, P., Ling, H.-Q., and Guerinot, M.L. (2007). FIT, the FER-LIKE
IRON DEFICIENCY INDUCED TRANSCRIPTION FACTOR in Arabi-
dopsis. Plant Physiol. Biochem. 45: 260–261.
Birnbaum, K., Shasha, D.E., Wang, J.Y., Jung, J.W., Lambert, G.M.,
Galbraith, D.W., and Benfey, P.N. (2003). A gene expression map of
the Arabidopsis root. Science 302: 1956–1960.
Brady, S.M., Orlando, D.A., Lee, J.Y., Wang, J.Y., Koch, J., Dinneny,
J.R., Mace, D., Ohler, U., and Benfey, P.N. (2007). A high-resolution
root spatiotemporal map reveals dominant expression patterns.
Science 318: 801–806.
Brutnell, T.P., Sawers, R.J.H., Mant, A., and Langdale, J.A. (1999).
BUNDLE SHEATH DEFECTIVE2, a novel protein required for post-
translational regulation of the rbcL gene of maize. Plant Cell 11:
849–864.
Buckhout, T.J., Yang, T.J., and Schmidt, W. (2009). Early iron-
deficiency-induced transcriptional changes in Arabidopsis roots as
revealed by microarray analyses. BMC Genomics 10: 147.
Busch, W., et al. (2010). Transcriptional control of a plant stem cell
niche. Dev. Cell 18: 849–861.
Colangelo, E.P., and Guerinot, M.L. (2004). The essential basic
2234 The Plant Cell
helix-loop-helix protein FIT1 is required for the iron deficiency
response. Plant Cell 16: 3400–3412.
Curie, C., Cassin, G., Couch, D., Divol, F., Higuchi, K., Le Jean, M.,
Misson, J., Schikora, A., Czernic, P., and Mari, S. (2009). Metal
movement within the plant: Contribution of nicotianamine and yellow
stripe 1-like transporters. Ann. Bot. (Lond.) 103: 1–11.
Desai, M., and Hu, J. (2008). Light induces peroxisome proliferation in
Arabidopsis seedlings through the photoreceptor phytochrome A, the
transcription factor HY5 HOMOLOG, and the peroxisomal protein
PEROXIN11b. Plant Physiol. 146: 1117–1127.
Dinneny, J.R., Long, T.A., Wang, J.Y., Jung, J.W., Mace, D., Pointer,
S., Barron, C., Brady, S.M., Schiefelbein, J., and Benfey, P.N.
(2008). Cell identity mediates the response of Arabidopsis roots to
abiotic stress. Science 320: 942–945.
Durrett, T.P., Gassmann, W., and Rogers, E.E. (2007). The FRD3-
mediated efflux of citrate into the root vasculature is necessary for
efficient iron translocation. Plant Physiol. 144: 197–205.
Eide, D., Broderius, M., Fett, J., and Guerinot, M.L. (1996). A novel
iron-regulated metal transporter from plants identified by functional
expression in yeast. Proc. Natl. Acad. Sci. USA 93: 5624–5628.
Espartero, J., Sanchez-Aguayo, I., and Pardo, J. (1995). Molecular
characterization of glyoxalase-I from a higher plant; upregulation by
stress. Plant Mol. Biol. 29: 1223–1233.
Felsenstein, J. (1985). Confidence limits on phylogenies: An approach
using the bootstrap. Evolution 39: 783–791.
Frey, B.J., and Dueck, D. (2007). Clustering by passing messages
between data points. Science 315: 972–976.
Green, L.S., and Rogers, E.E. (2004). FRD3 controls iron localization in
Arabidopsis. Plant Physiol. 136: 2523–2531.
Grotz, N., and Guerinot, M.L. (2006). Molecular aspects of Cu, Fe and
Zn homeostasis in plants. Biochim. Biophys. Acta 1763: 595–608.
Haydon, M.J., and Cobbett, C.S. (2007). A novel major facilitator
superfamily protein at the tonoplast influences zinc tolerance and
accumulation in Arabidopsis. Plant Physiol. 143: 1705–1719.
Heim, M.A., Jakoby, M., Werber, M., Martin, C., Weisshaar, B., and
Bailey, P.C. (2003). The basic helix-loop-helix transcription factor
family in plants: A genome-wide study of protein structure and
functional diversity. Mol. Biol. Evol. 20: 735–747.
Hellens, R.P., Edwards, E.A., Leyland, N.R., Bean, S., and Mullineaux,
P.M. (2000). pGreen: A versatile and flexible binary Ti vector for
Agrobacterium-mediated plant transformation. Plant Mol. Biol. 42:
819–832.
Jeong, J., and Connolly, E.L. (2009). Iron uptake mechanisms in
plants: Functions of the FRO family of ferric reductases. Plant Sci. 176:
709–714.
Kim, S.A., Punshon, T., Lanzirotti, A., Li, L., Alonso, J.M., Ecker, J.R.,
Kaplan, J., and Guerinot, M.L. (2006). Localization of iron in
Arabidopsis seed requires the vacuolar membrane transporter VIT1.
Science 314: 1295–1298.
King, J. (1991). The Genetic Basis of Plant Physiological Processes.
(London: Oxford University Press).
Klatte, M., Schuler, M., Wirtz, M., Fink-Straube, C., Hell, R., and
Bauer, P. (2009). The analysis of Arabidopsis nicotianamine synthase
mutants reveals functions for nicotianamine in seed iron loading and
iron deficiency responses. Plant Physiol. 150: 257–271.
Lanquar, V., Lelievre, F., Bolte, S., Hames, C., Alcon, C., Neumann,
D., Vansuyt, G., Curie, C., Schroder, A., Kramer, U., Barbier-
Brygoo, H., and Thomine, S. (2005). Mobilization of vacuolar iron by
AtNRAMP3 and AtNRAMP4 is essential for seed germination on low
iron. EMBO J. 24: 4041–4051.
Lapinskas, P.J., Lin, S.J., and Culotta, V.C. (1996). The role of the
Saccharomyces cerevisiae CCC1 gene in the homeostasis of man-
ganese ions. Mol. Microbiol. 21: 519–528.
Lee, J.Y., Colinas, J., Wang, J.Y., Mace, D., Ohler, U., and Benfey,
P.N. (2006). Transcriptional and posttranscriptional regulation of
transcription factor expression in Arabidopsis roots. Proc. Natl.
Acad. Sci. USA 103: 6055–6060.
Leibfried, A., To, J.P.C., Busch, W., Stehling, S., Kehle, A., Demar,
M., Kieber, J.J., and Lohmann, J.U. (2005). WUSCHEL controls
meristem function by direct regulation of cytokinin-inducible response
regulators. Nature 438: 1172–1175.
Levesque, M.P., Vernoux, T., Busch, W., Cui, H., Wang, J.Y., Blilou,
I., Hassan, H., Nakajima, K., Matsumoto, N., Lohmann, J.U.,
Scheres, B., and Benfey, P.N. (2006). Whole-genome analysis of
the SHORT-ROOT developmental pathway in Arabidopsis. PLoS Biol.
4: e143.
Lichtenthaler, H.K. (1987). Chlorophylls and carotenoids: Pigments of
photosynthetic biomembranes. Methods Enzymol. 148: 350–382.
Li, L., Chen, O.S., McVey Ward, D., and Kaplan, J. (2001). CCC1 is a
transporter that mediates vacuolar iron storage in yeast. J. Biol.
Chem. 276: 29515–29519.
Ling, H.Q., Koch, G., Baumlein, H., and Ganal, M.W. (1999). Map-
based cloning of chloronerva, a gene involved in iron uptake of higher
plants encoding nicotianamine synthase. Proc. Natl. Acad. Sci. USA
96: 7098–7103.
Mark, A.J., Marjorie, J.R., and Nicholas, S. (2006). Analysis of the
root-hair morphogenesis transcriptome reveals the molecular iden-
tity of six genes with roles in root-hair development in Arabidopsis.
Plant J. 45: 83–100.
Martin-Magniette, M.-L., Mary-Huard, T., Berard, C., and Robin, S.
(2008). ChIPmix: Mixture model of regressions for two-color ChIP-
chip analysis. Bioinformatics 24: i181–i186.
McElver, J., et al. (2001). Insertional mutagenesis of genes required for
seed development in Arabidopsis thaliana. Genetics 159: 1751–1763.
Moog, P.R., van der Kooij, T.A., Bruggemann, W., Schiefelbein, J.W.,
and Kuiper, P.J. (1995). Responses to iron deficiency in Arabidopsis
thaliana: The Turbo iron reductase does not depend on the formation
of root hairs and transfer cells. Planta 195: 505–513.
Morrissey, J., Baxter, I.R., Lee, J., Li, L., Lahner, B., Grotz, N.,
Kaplan, J., Salt, D.E., and Guerinot, M.L. (2009). The ferroportin
metal efflux proteins function in iron and cobalt homeostasis in
Arabidopsis. Plant Cell 21: 3326–3338.
Muller, M., and Schmidt, W. (2004). Environmentally induced plasticity
of root hair development in Arabidopsis. Plant Physiol. 134: 409–419.
Obayashi, T., Hayashi, S., Saeki, M., Ohta, H., and Kinoshita, K.
(2009). ATTED-II provides coexpressed gene networks for Arabidop-
sis. Nucleic Acids Res. 37: D987–D991.
Palmer, C.M., and Guerinot, M.L. (2009). Facing the challenges of Cu,
Fe and Zn homeostasis in plants. Nat. Chem. Biol. 5: 333–340.
Rampey, R.A., Woodward, A.W., Hobbs, B.N., Tierney, M.P., Lahner,
B., Salt, D.E., and Bartel, B. (2006). An Arabidopsis basic helix-loop-
helix leucine zipper protein modulates metal homeostasis and auxin
conjugate responsiveness. Genetics 174: 1841–1857.
Reumann, S., Quan, S., Aung, K., Yang, P., Manandhar-Shrestha, K.,
Holbrook, D., Linka, N., Switzenberg, R., Wilkerson, C.G., Weber,
A.P.M., Olsen, L.J., and Hu, J. (2009). In-depth proteome analysis of
Arabidopsis leaf peroxisomes combined with in vivo subcellular
targeting verification indicates novel metabolic and regulatory func-
tions of peroxisomes. Plant Physiol. 150: 125–143.
Robinson, N.J., Procter, C.M., Connolly, E.L., and Guerinot, M.L.
(1999). A ferric-chelate reductase for iron uptake from soils. Nature
397: 694–697.
Rogers, E.E., and Guerinot, M.L. (2002). FRD3, a member of the
multidrug and toxin efflux family, controls iron deficiency responses in
Arabidopsis. Plant Cell 14: 1787–1799.
Romheld, V., and Marschner, H. (1981). Iron deficiency stress induced
POPEYE Regulates Response to 2Fe 2235
morphological and physiological changes in root tips of sunflower.
Physiol. Plant. 53: 354–360.
Saitou, N., and Nei, M. (1987). The neighbor-joining method: A new
method for reconstructing phylogenetic trees. Mol. Biol. Evol. 4:
406–425.
Schaaf, G., Honsbein, A., Meda, A.R., Kirchner, S., Wipf, D., and von
Wiren, N. (2006). AtIREG2 encodes a tonoplast transport protein
involved in iron-dependent nickel detoxification in Arabidopsis thali-
ana roots. J. Biol. Chem. 281: 25532–25540.
Schmidt, W. (1999). Review: Mechanisms and regulation of reduction-
based iron uptake in plants. New Phytol. 141: 1–26.
Sheriff, S., Hendrickson, W.A., and Smith, J.L. (1987). Structure of
myohemerythrin in the azidomet state at 1.7/1.3 A resolution. J. Mol.
Biol. 197: 273–296.
Sozzani, R., Cui, H., Moreno-Risueno, M.A., Busch, W., Van Norman,
J.M., Vernoux, T., Brady, S.M., Dwitte, W., Murray, J.A., and
Benfey, P.N. (2010). Spatiotemporal regulation of cell-cycle gene by
SHORTROOT links patterning and growth. Nature 466: 128–132.
Stenkamp, R.E., Sieker, L.C., Jensen, L.H., McCallum, J.D., and
Sanders-Loehr, J. (1985). Active site structures of deoxyhemerythrin
and oxyhemerythrin. Proc. Natl. Acad. Sci. USA 82: 713–716.
Tamura, K., Dudley, J., Nei, M., and Kumar, S. (2007). MEGA4:
Molecular Evolutionary Genetics Analysis (MEGA) software version
4.0. Mol. Biol. Evol. 24: 1596–1599.
Thompson, J.D., Higgins, D.G., and Gibson, T.J. (1994). CLUSTAL W:
Improving the sensitivity of progressive multiple sequence alignment
through sequence weighting, position-specific gap penalties and
weight matrix choice. Nucleic Acids Res. 11: 4673–4680.
Uchida, T., Yano, H., Satake, K., Kubota, I., and Tsugita, A. (1990).
The amino acid sequence of hemerythrin from Siphonosoma cuma-
nense. Protein Seq. Data Anal. 3: 141–147.
Vert, G., Grotz, N., Dedaldechamp, F., Gaymard, F., Guerinot, M.L.,
Briat, J.F., and Curie, C. (2002). IRT1, an Arabidopsis transporter
essential for iron uptake from the soil and for plant growth. Plant Cell
14: 1223–1233.
Walhout, A.J.M., and Vidal, M. (2001). High-throughput yeast two-
hybrid assays for large-scale protein interaction mapping. Methods
24: 297–306.
Walker, E.L., and Connolly, E.L. (2008). Time to pump iron: Iron
deficiency signaling mechanisms of higher plants. Curr. Opin. Plant
Biol. 11: 530–535.
Waters, B.M., Chu, H.H., Didonato, R.J., Roberts, L.A., Eisley, R.B.,
Lahner, B., Salt, D.E., and Walker, E.L. (2006). Mutations in
Arabidopsis yellow stripe-like1 and yellow stripe-like3 reveal their
roles in metal ion homeostasis and loading of metal ions in seeds.
Plant Physiol. 141: 1446–1458.
Yang, T.J.W., Lin, W.-D., and Schmidt, W. (2010). Transcriptional
profiling of the Arabidopsis iron deficiency response reveals con-
served transition metal homeostasis networks. Plant Physiol. 152:
2130–2141.
Yi, Y., and Guerinot, M.L. (1996). Genetic evidence that induction of
root Fe(III) chelate reductase activity is necessary for iron uptake
under iron deficiency. Plant J. 10: 835–844.
Yi, Y., Saleeba, J.A., and Guerinot, M.L. (1994). Iron uptake in
Arabidopsis thaliana. In Biochemistry of Metal Micronutrients in the
Rhizosphere, J. Manthey, D. Luster, and D.E. Crowley, eds (Chelsea,
MI: Lewis Publishers), pp. 295–307.
Yuan, Y., Wu, H., Wang, N., Li, J., Zhao, W., Du, J., Wang, D., and
Ling, H.-Q. (2008). FIT interacts with AtbHLH38 and AtbHLH39 in
regulating iron uptake gene expression for iron homeostasis in
Arabidopsis. Cell Res. 18: 385–397.
Zhang, H., and Forde, B.G. (1998). An Arabidopsis MADS box gene
that controls nutrient-induced changes in root architecture. Science
279: 407–409.
Zuckerkandl, E., and Pauling, L. (1965). Evolving Genes and Proteins.
(New York: Academic Press).
2236 The Plant Cell
DOI 10.1105/tpc.110.074096; originally published online July 30, 2010; 2010;22;2219-2236Plant Cell
Terri A. Long, Hironaka Tsukagoshi, Wolfgang Busch, Brett Lahner, David E. Salt and Philip N. BenfeyRoots
ArabidopsisThe bHLH Transcription Factor POPEYE Regulates Response to Iron Deficiency in
This information is current as of April 10, 2020
Supplemental Data /content/suppl/2010/07/15/tpc.110.074096.DC1.html
References /content/22/7/2219.full.html#ref-list-1
This article cites 60 articles, 27 of which can be accessed free at:
Permissions https://www.copyright.com/ccc/openurl.do?sid=pd_hw1532298X&issn=1532298X&WT.mc_id=pd_hw1532298X
eTOCs http://www.plantcell.org/cgi/alerts/ctmain
Sign up for eTOCs at:
CiteTrack Alerts http://www.plantcell.org/cgi/alerts/ctmain
Sign up for CiteTrack Alerts at:
Subscription Information http://www.aspb.org/publications/subscriptions.cfm
is available at:Plant Physiology and The Plant CellSubscription Information for
ADVANCING THE SCIENCE OF PLANT BIOLOGY © American Society of Plant Biologists


![The bHLH Transcription Factors TSAR1 and TSAR2 …...The bHLH Transcription Factors TSAR1 and TSAR2 Regulate Triterpene Saponin Biosynthesis in Medicago truncatula1[OPEN] Jan Mertens,](https://img.pdfslide.us/doc/110x75/5f0a45ca7e708231d42ad955/the-bhlh-transcription-factors-tsar1-and-tsar2-the-bhlh-transcription-factors.jpg)