Embed Size (px)
Citation preview
The Bernoulli distribution
Discrete distributions
1 0
1
q p xp x P X x
p x
0
0.2
0.4
0.6
0.8
1
0 1
1 Bernoulli trial =
0 Bernoulli trial = X
S
F
The Binomial distribution
0,1,2, ,x n xnp x P X x p q x n
x
-
0.0500
0.1000
0.1500
0.2000
0.2500
0.3000
0 1 2 3 4 5 6 7 8 9 10 11 12 13 14 15 16 17 18 19 20
p(x)
x
X = the number of successes in n repetitions of a Bernoulli trial
p = the probability of success
-
0.02
0.04
0.06
0.08
0.10
0.12
0 2 4 6 8 10 12 14 16 18 20 22 24 26 28 30 32 34 36 38 40
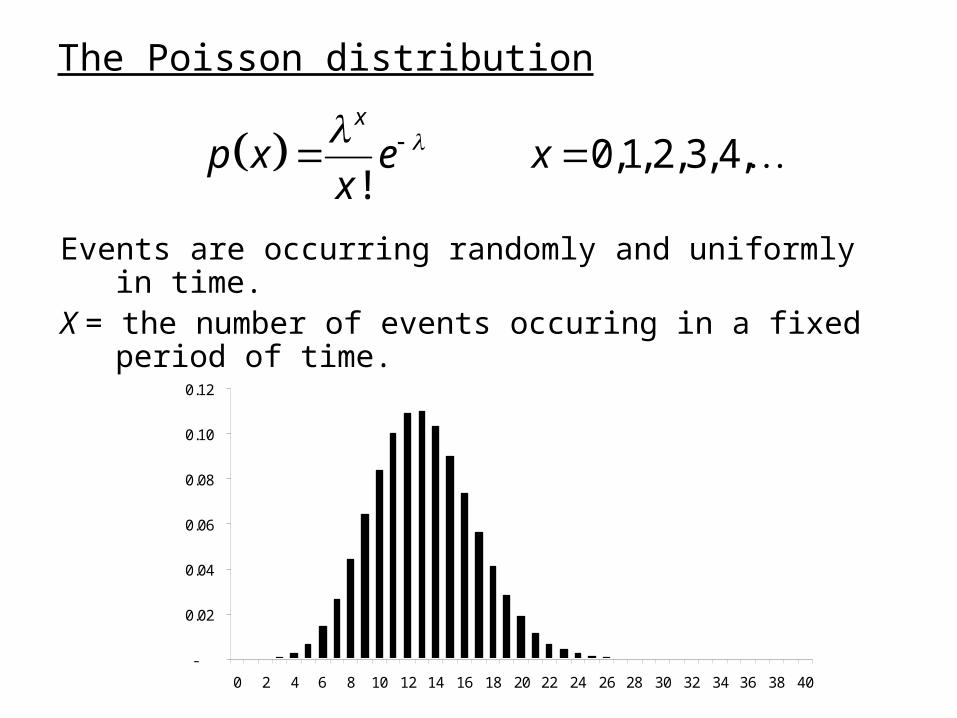
The Poisson distribution
Events are occurring randomly and uniformly in time.X = the number of events occuring in a fixed period of
time.
0,1,2,3,4,!
x
p x e xx

The Geometric DistributionThe Negative Binomial Distribution
The Binomial distribution, the Geometric distribution and the Negative Binomial distribution each arise when repeating independently Bernoulli trials
The Binomial distribution the Bernoulli trials are repeated independently a fixed number of times n and X = the numbers of successes
The Negative Binomial distribution the Bernoulli trials are repeated independently until a fixed number, k, of successes has occurred and X = the trial on which the kth success occurred.
The Geometric distribution the Bernoulli trials are repeated independently the first success occurs (,k = 1) and X = the trial on which the 1st success occurred.
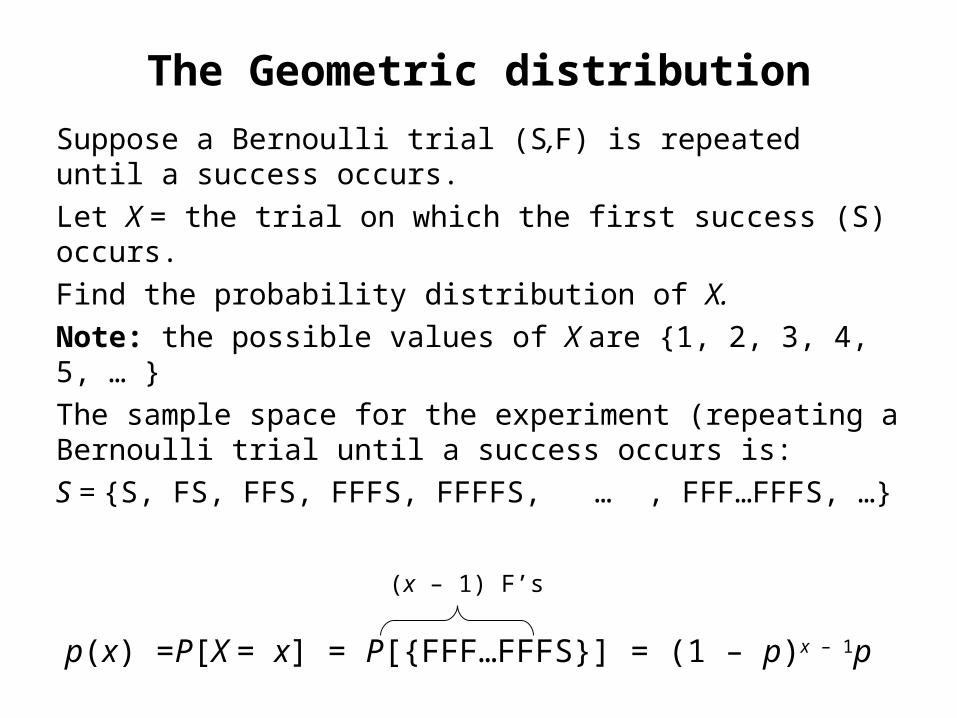
The Geometric distribution
Suppose a Bernoulli trial (S,F) is repeated until a success occurs.
Let X = the trial on which the first success (S) occurs.
Find the probability distribution of X.
Note: the possible values of X are {1, 2, 3, 4, 5, … }
The sample space for the experiment (repeating a Bernoulli trial until a success occurs is:
S = {S, FS, FFS, FFFS, FFFFS, … , FFF…FFFS, …}
p(x) =P[X = x] = P[{FFF…FFFS}] = (1 – p)x – 1p
(x – 1) F’s

Thus the probability function of X is:
P[X = x] = p(x) = p(1 – p)x – 1 = pqx – 1
A random variable X that has this distribution is said to have the Geometric distribution.
Reason p(1) = p, p(2) = pq, p(3) = pq2 , p(4) = pq3 , …
forms a geometric series
1
1 + 2 + 3 + x
p x p p p
2 3 1
1-
p pp pq pq pq
q p

Example
Suppose a die is rolled until a six occurs
Success = S = {six} , p = 1/6.
Failure = F = {no six} q = 1 – p = 5/6.
1. What is the probability that it took at most 5 rolls of a die to roll a six?
2. What is the probability that it took at least 10 rolls of a die to roll a six?
3. What is the probability that the “first six” occurred on an even number toss?
4. What is the probability that the “first six” occurred on a toss divisible by 3 given that the “first six” occurred on an even number toss?
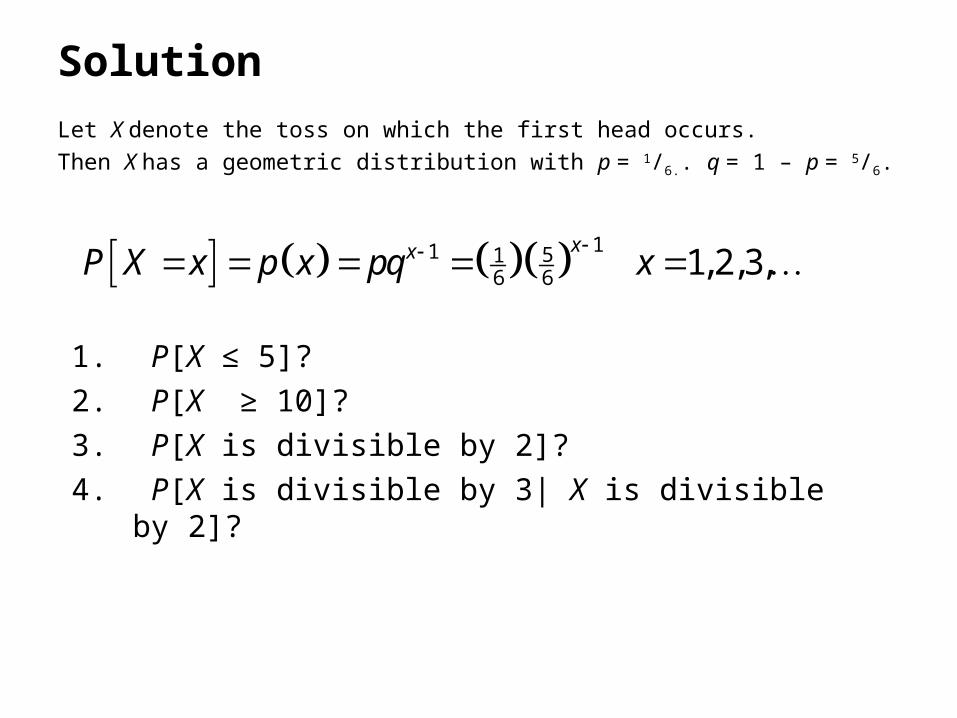
Solution
Let X denote the toss on which the first head occurs.
Then X has a geometric distribution with p = 1/6.. q = 1 – p = 5/6.
1. P[X ≤ 5]?
2. P[X ≥ 10]?
3. P[X is divisible by 2]?
4. P[X is divisible by 3| X is divisible by 2]?
11 516 6 1, 2,3,
xxP X x p x pq x

1. P[X ≤ 5]?
5 1 2 3 4 5P X p p p p p
0 1 2 3 45 5 5 5 51 1 1 1 16 6 6 6 6 6 6 6 6 6+ + + +
1 2 3 45 5 5 516 6 6 6 61+ + + +
2 1 1
1
nn r
a ar ar ar ar
Using
55
56 516 65
6
1-1
1
556
2 1
1a ar ar a
r
Note also
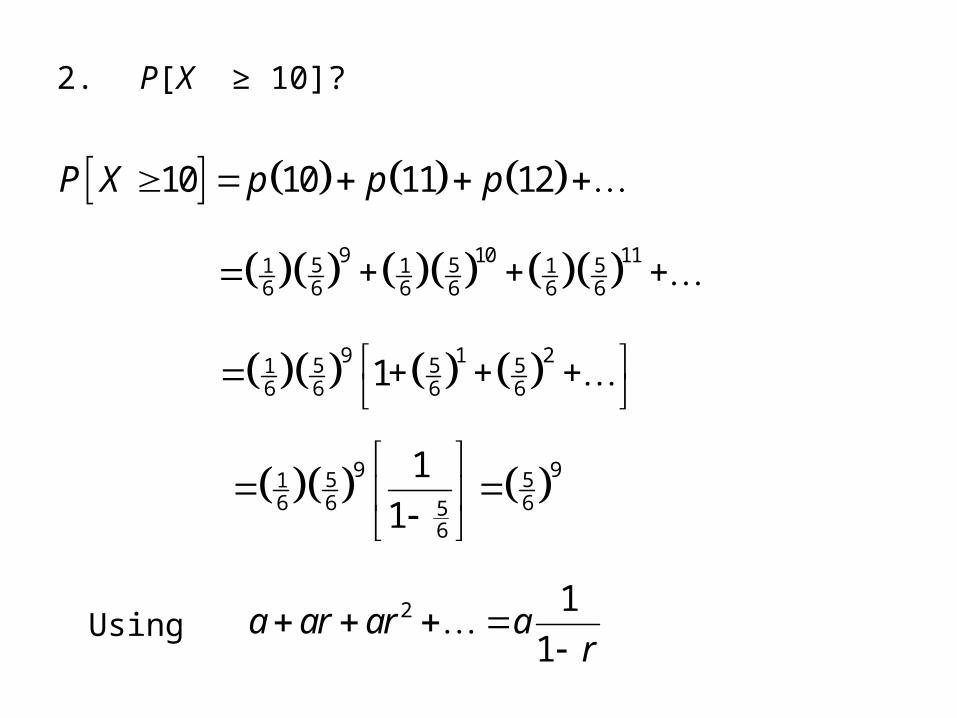
10 10 11 12P X p p p
2. P[X ≥ 10]?
9 10 115 5 51 1 16 6 6 6 6 6+ + +
9 1 25 5 516 6 6 61+ + +
9 95 516 6 65
6
1
1
Using2 1
1a ar ar a
r

is divisible by 2 2 4 6P X p p p
3. P[X is divisible by 2]?
1 3 55 5 51 1 16 6 6 6 6 6+ + +
2 45 5 5 51 16 6 6 6 6 6 25
6
11+ + +
1
5 5 536 36 25 1125
36
1
1
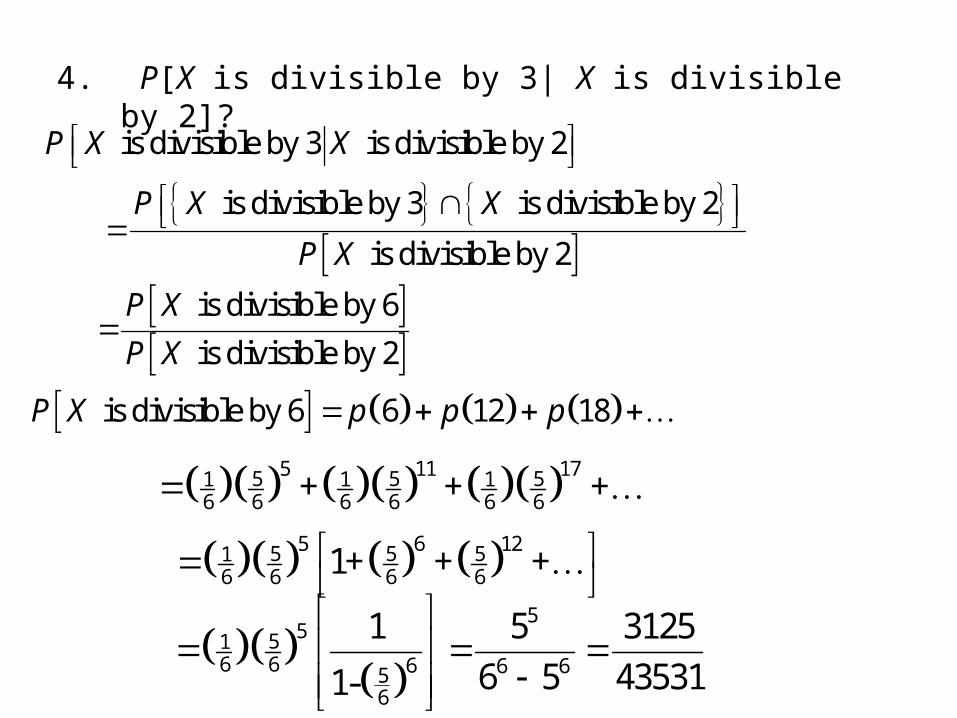
4. P[X is divisible by 3| X is divisible by 2]?
5 11 175 5 51 1 16 6 6 6 6 6+ + +
5 6 125 5 516 6 6 61+ + +
is divisible by 3 is divisible by 2P X X
is divisible by 3 is divisible by 2
is divisible by 2
P X X
P X
is divisible by 6
is divisible by 2
P X
P X
is divisible by 6 6 12 18P X p p p
5551
6 6 6 6 656
1 5 3125
6 5 435311-
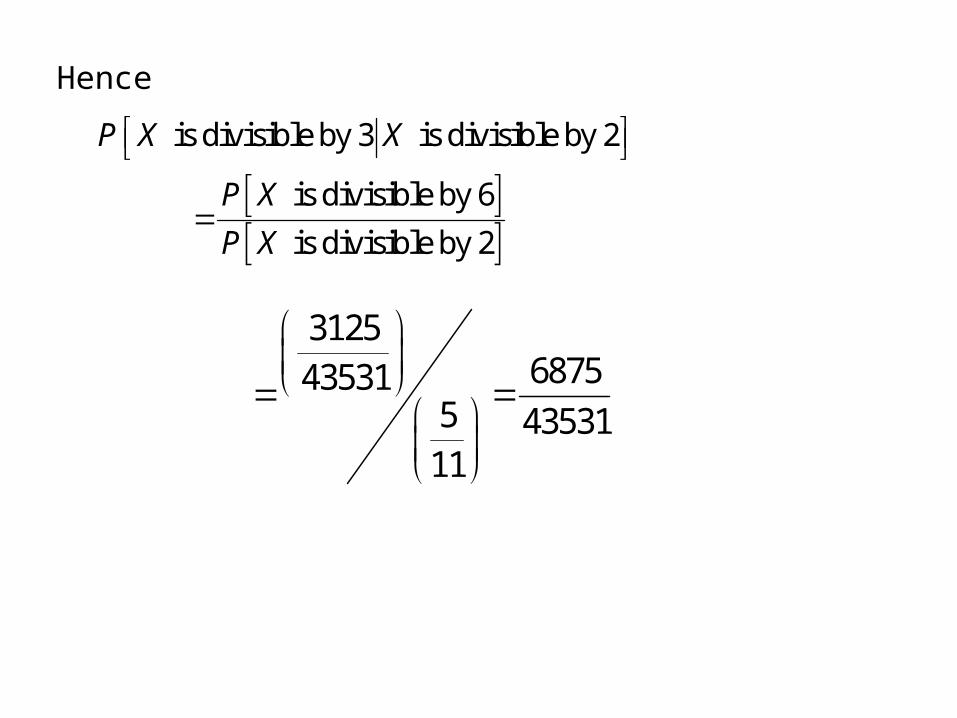
Hence
is divisible by 3 is divisible by 2P X X
is divisible by 6
is divisible by 2
P X
P X
3125687543531
5 4353111
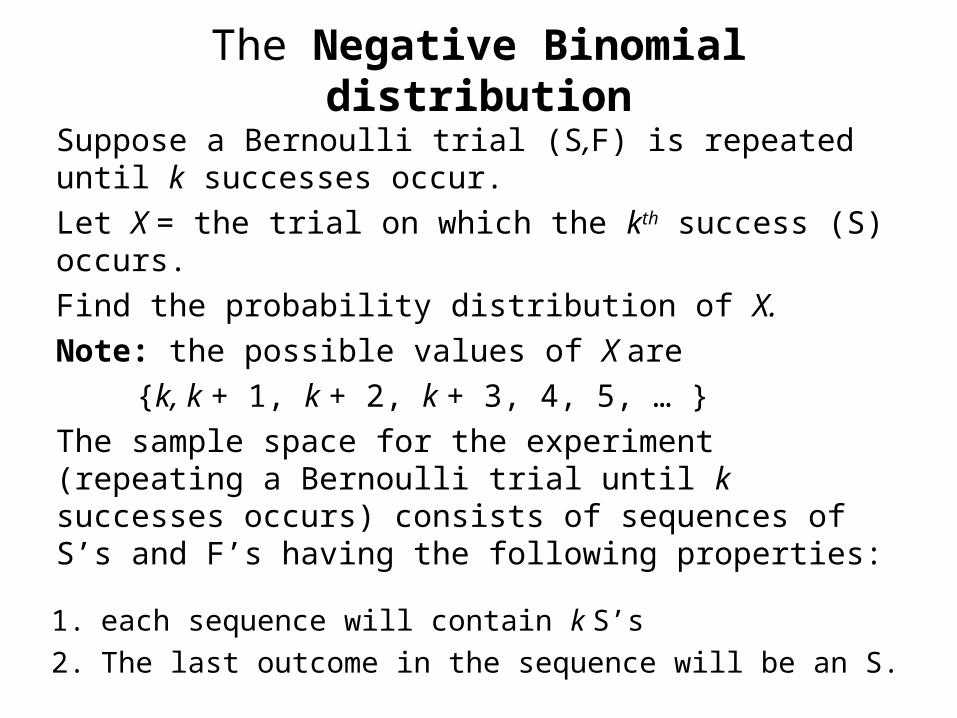
The Negative Binomial distribution
Suppose a Bernoulli trial (S,F) is repeated until k successes occur.
Let X = the trial on which the kth success (S) occurs.
Find the probability distribution of X.
Note: the possible values of X are
{k, k + 1, k + 2, k + 3, 4, 5, … }
The sample space for the experiment (repeating a Bernoulli trial until k successes occurs) consists of sequences of S’s and F’s having the following properties:
1. each sequence will contain k S’s
2. The last outcome in the sequence will be an S.
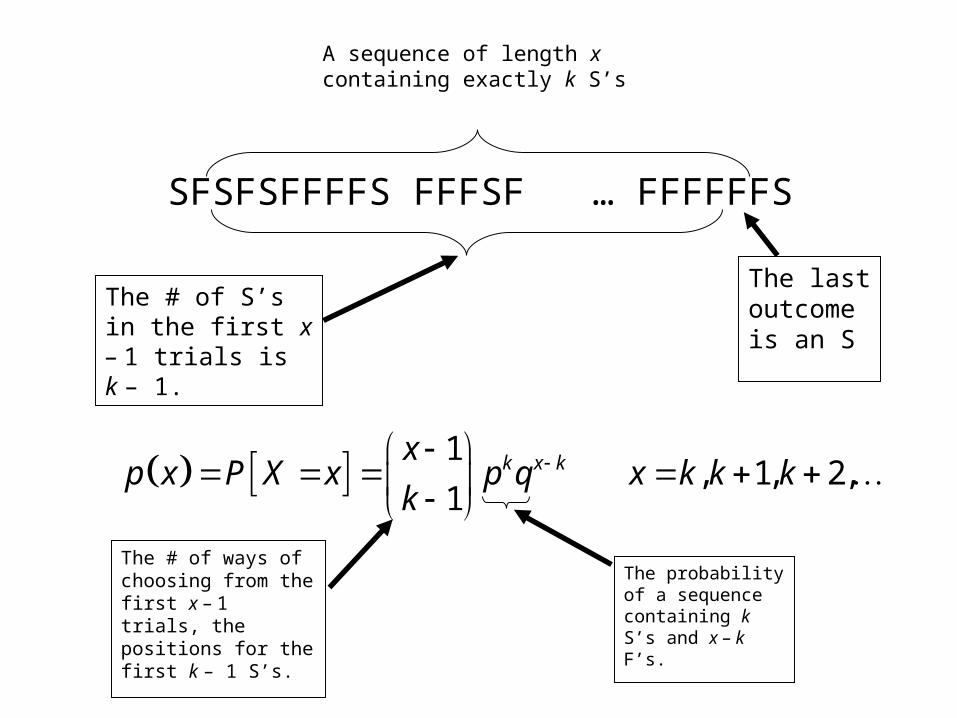
SFSFSFFFFS FFFSF … FFFFFFS
A sequence of length x containing exactly k S’s
The last outcome is an S
The # of S’s in the first x – 1 trials is k – 1.
1 , 1, 2,
1k x kx
p x P X x p q x k k kk
The # of ways of choosing from the first x – 1 trials, the positions for the first k – 1 S’s.
The probability of a sequence containing k S’s and x – k F’s.
Example
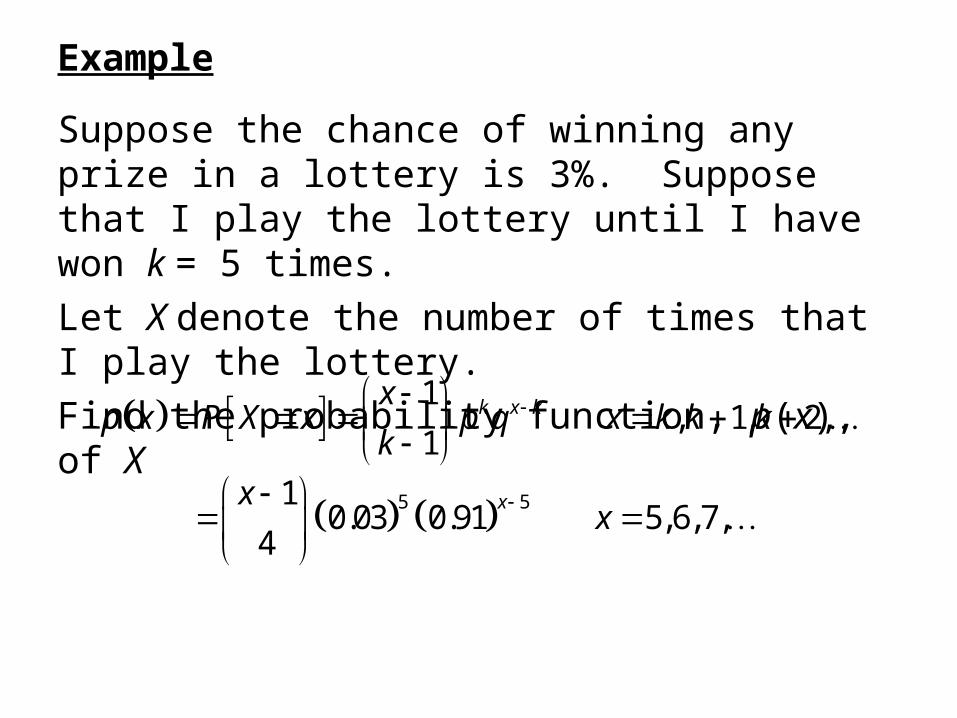
Suppose the chance of winning any prize in a lottery is 3%. Suppose that I play the lottery until I have won k = 5 times.
Let X denote the number of times that I play the lottery.
Find the probability function, p(x), of X
1 , 1, 2,
1k x kx
p x P X x p q x k k kk
5 510.03 0.91 5,6,7,
4xx
x

-
0.001
0.002
0.003
0.004
0.005
0.006
0.007
0 100 200 300 400 500 600
Graph of p(x)
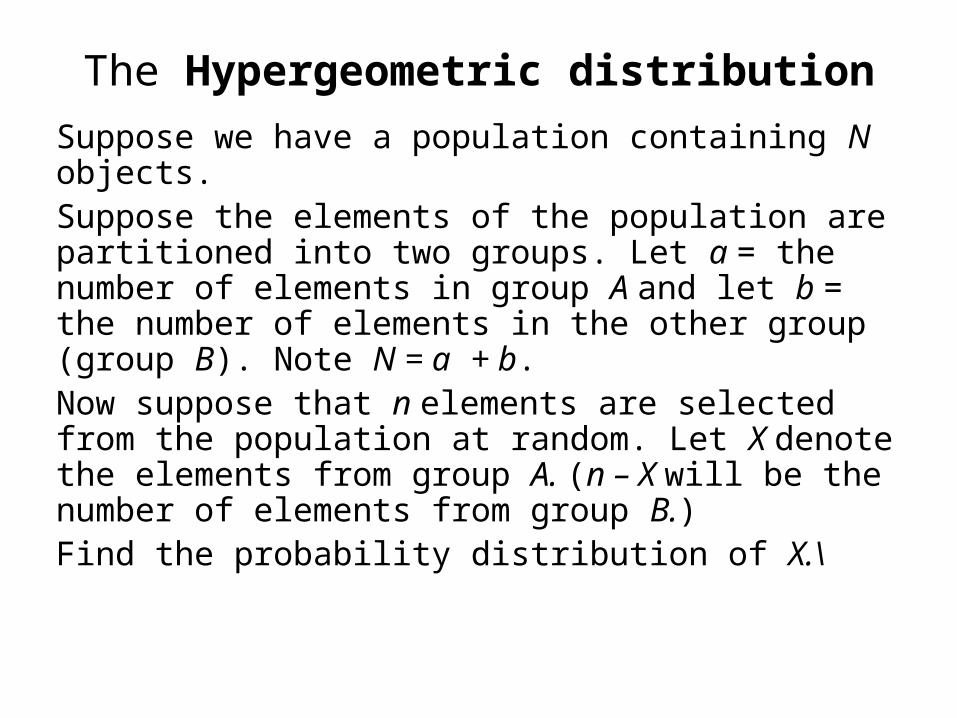
The Hypergeometric distribution
Suppose we have a population containing N objects.Suppose the elements of the population are partitioned into two groups. Let a = the number of elements in group A and let b = the number of elements in the other group (group B). Note N = a + b.Now suppose that n elements are selected from the population at random. Let X denote the elements from group A. (n – X will be the number of elements from group B.)Find the probability distribution of X.\
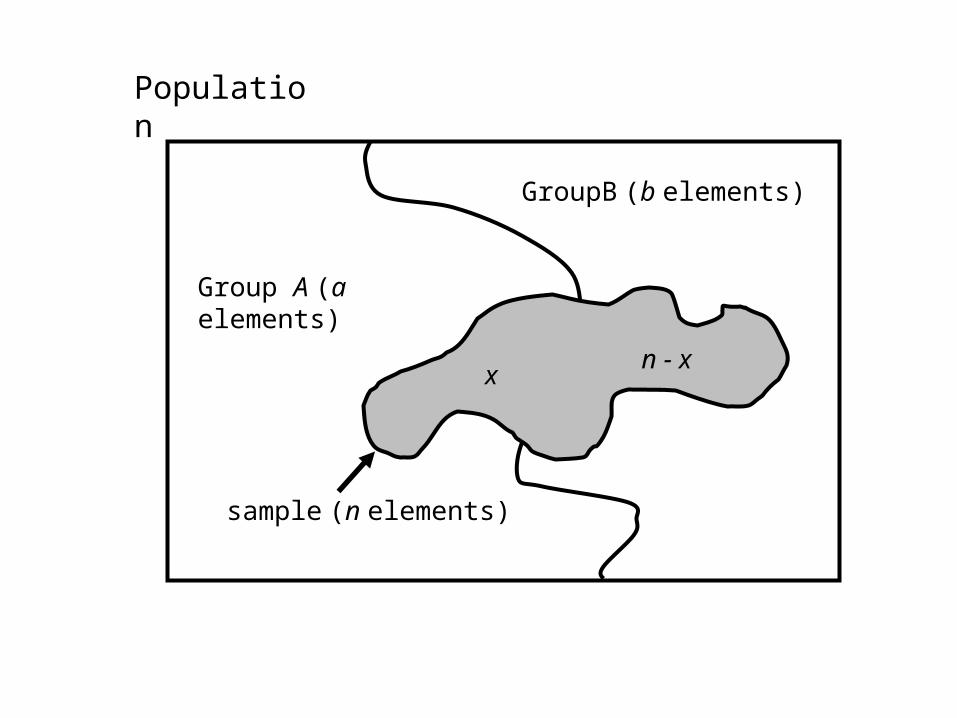
Population
Group A (a elements)
GroupB (b elements)
sample (n elements)
xn - x
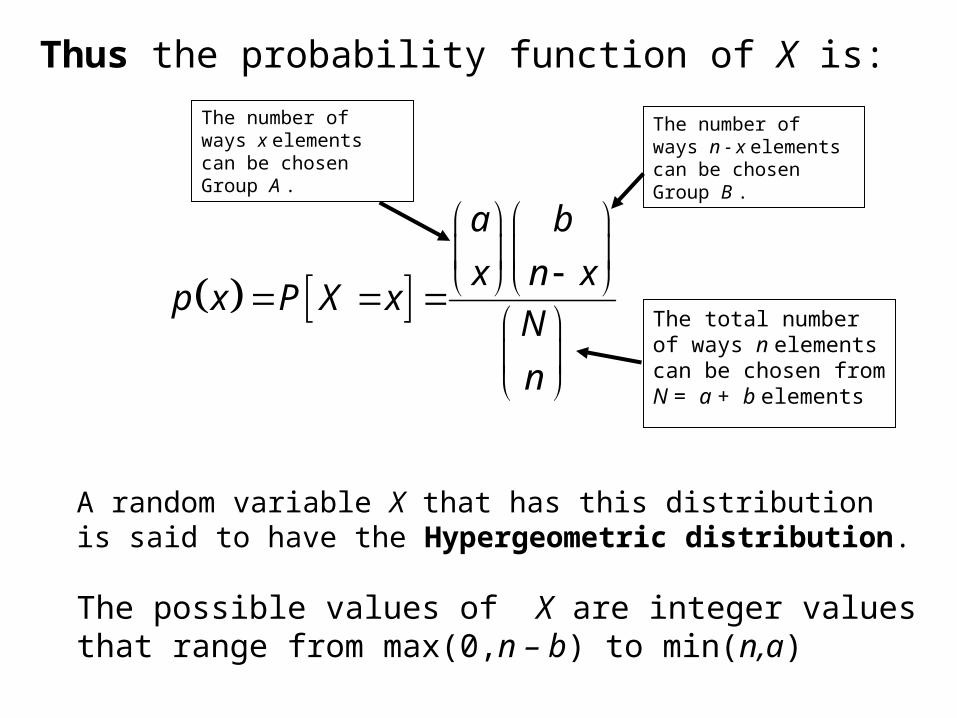
Thus the probability function of X is:
A random variable X that has this distribution is said to have the Hypergeometric distribution.
The total number of ways n elements can be chosen from N = a + b elements
a b
x n xp x P X x
N
n
The number of ways n - x elements can be chosen Group B .
The number of ways x elements can be chosen Group A .
The possible values of X are integer values that range from max(0,n – b) to min(n,a)
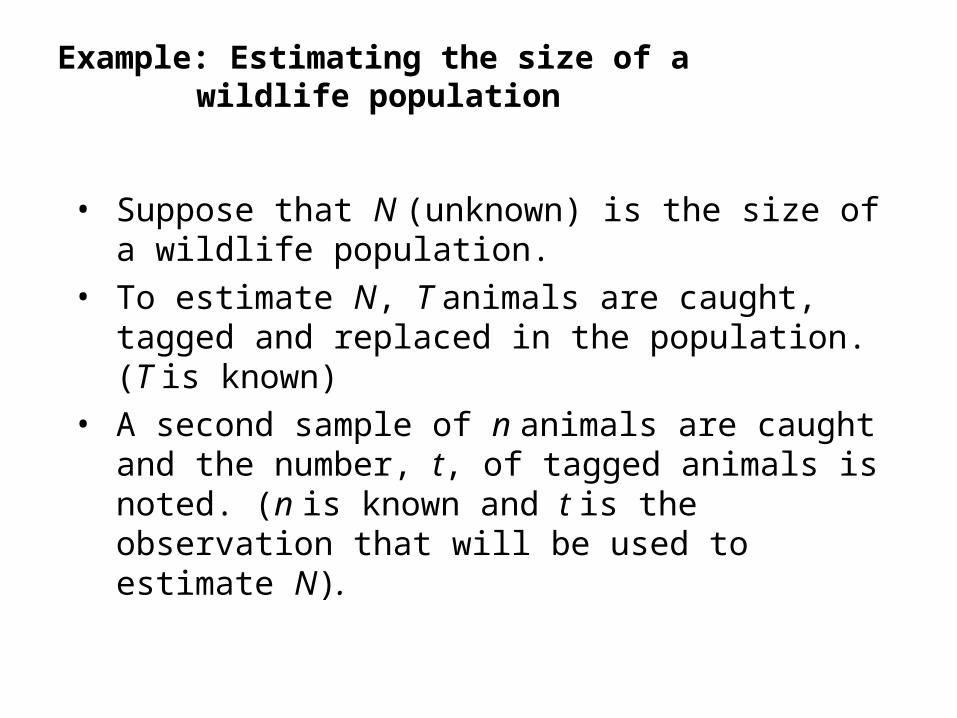
• Suppose that N (unknown) is the size of a wildlife population.
• To estimate N, T animals are caught, tagged and replaced in the population. (T is known)
• A second sample of n animals are caught and the number, t, of tagged animals is noted. (n is known and t is the observation that will be used to estimate N).
Example: Estimating the size of a wildlife population
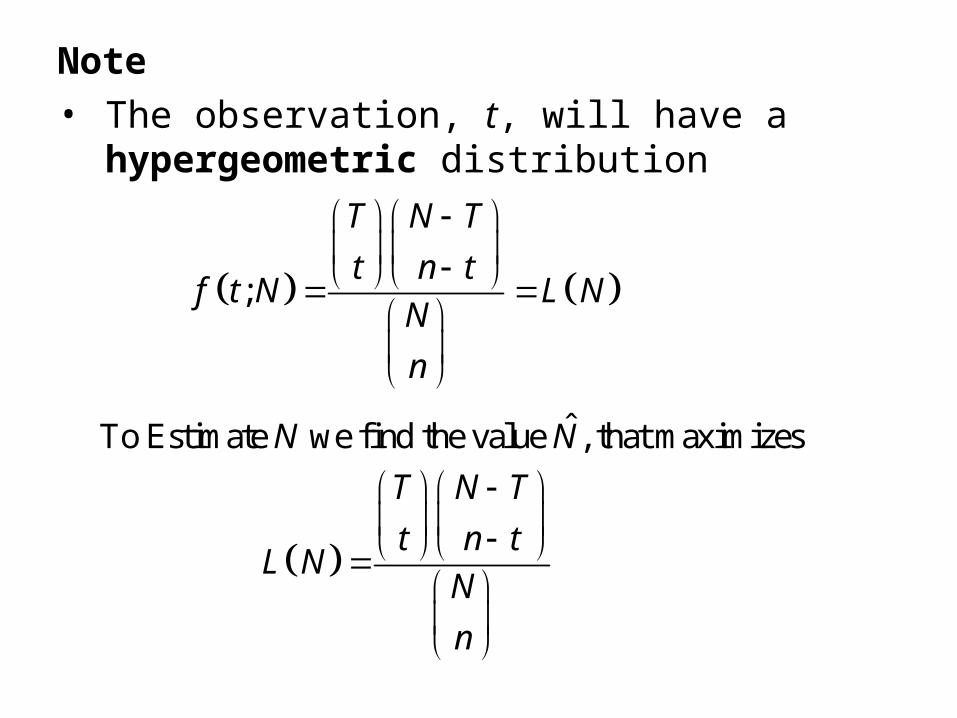
Note• The observation, t, will have a hypergeometric
distribution
;
T N T
t n tf t N L N
N
n
ˆTo Estimate we find the value , that maximizesN N
T N T
t n tL N
N
n

To determine when
T N T
t n tL N
N
n
1
L N
L N
is maximized compute and determine when the ratio
is greater than 1 and less than 1.
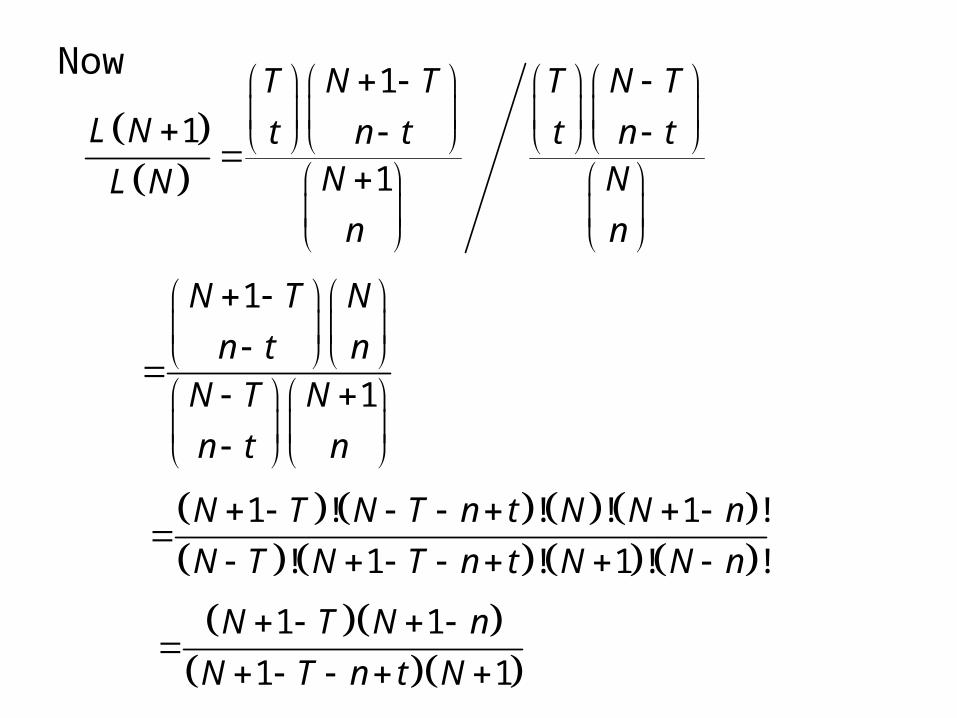
Now
1
1
1
T N T T N T
L N t n t t n tN NL N
n n
1
1
N T N
n t n
N T N
n t n
1 ! ! ! 1 !
! 1 ! 1 ! !
N T N T n t N N n
N T N T n t N N n
1 1
1 1
N T N n
N T n t N
Now
11
L N
L N
1 11
1 1
N T N n
N T n t N
if
1 1 1 1N T N n N T n t N or
21 ( ) 1N n T N nT
21 1N t n T N
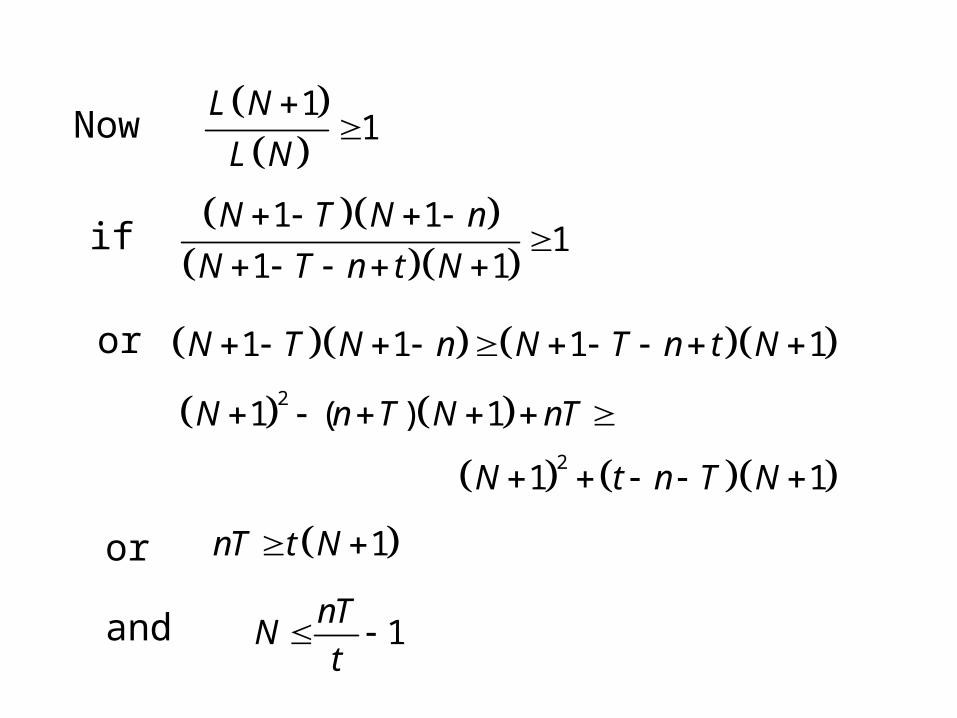
1nT t N or
1nT
Nt
and
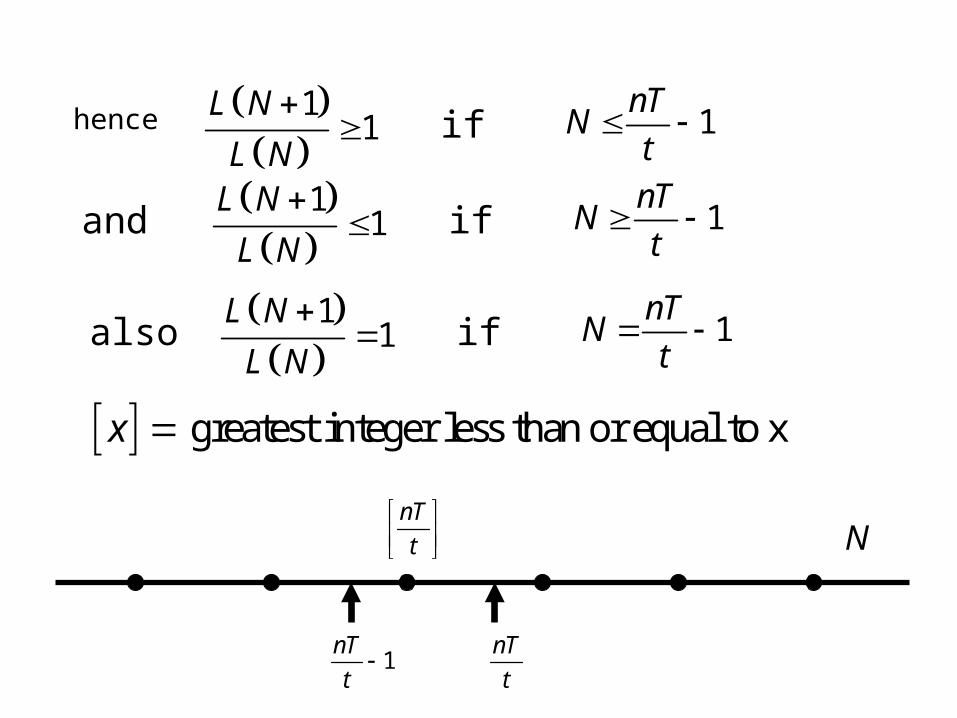
hence
11
L N
L N
1
nTN
t if
and
11
L N
L N
1
nTN
t if
also
11
L N
L N
1
nTN
t if
1nT
t
nT
t
nT
t N
greatest integer less than or equal to xx

Thus ˆ nTN
t
greatest integer less than or equal to nT
t
ˆ ˆIf is an integer then 1 or nT nT nT
N Nt t t