Embed Size (px)
Citation preview
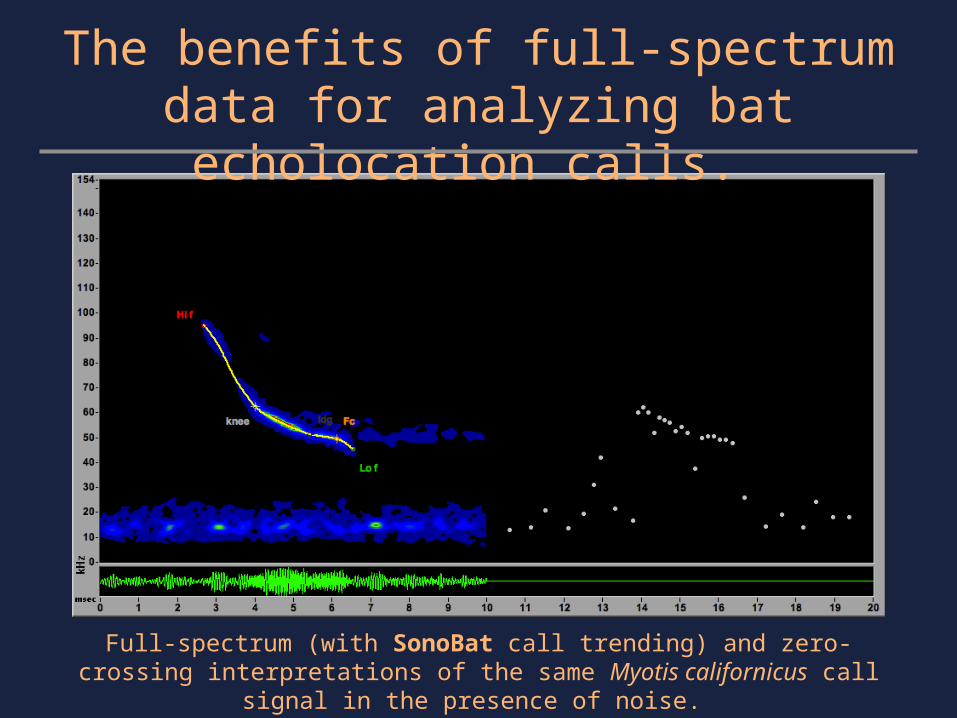
The benefits of full-spectrum data for analyzing bat echolocation calls.
Full-spectrum (with SonoBat call trending) and zero-crossing interpretations of the same Myotis californicus call signal in the presence of noise.
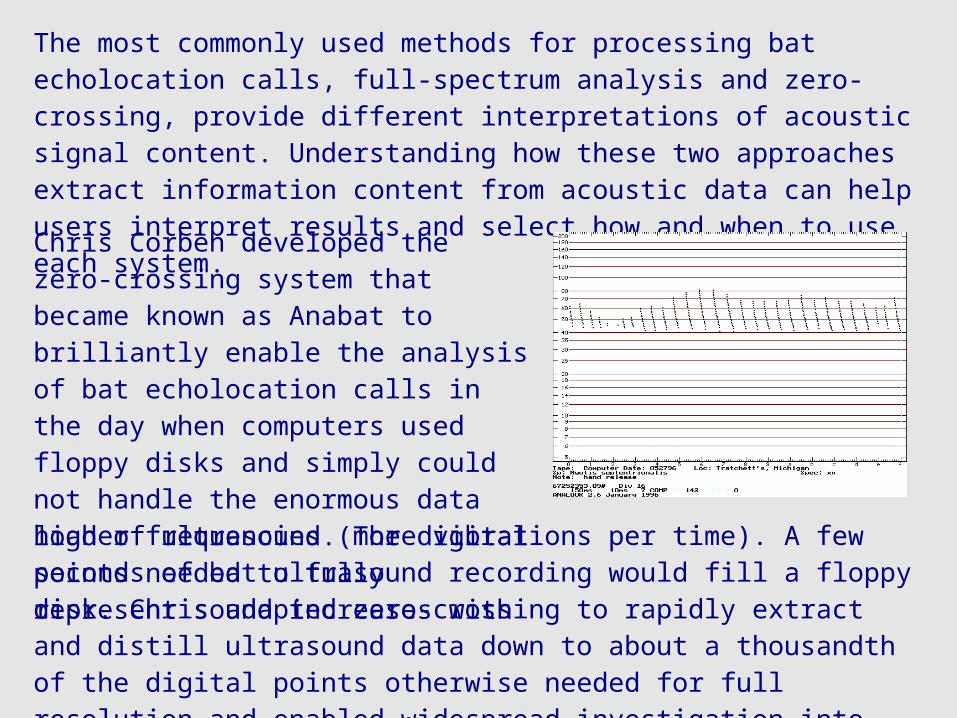
The most commonly used methods for processing bat echolocation calls, full-spectrum analysis and zero-crossing, provide different interpretations of acoustic signal content. Understanding how these two approaches extract information content from acoustic data can help users interpret results and select how and when to use each system.
Chris Corben developed the zero-crossing system that became known as Anabat to brilliantly enable the analysis of bat echolocation calls in the day when computers used floppy disks and simply could not handle the enormous data load of ultrasound. The digital points needed to fully represent sound increases withhigher frequencies (more vibrations per time). A few seconds of bat ultrasound recording would fill a floppy disk. Chris adapted zero-crossing to rapidly extract and distill ultrasound data down to about a thousandth of the digital points otherwise needed for full resolution and enabled widespread investigation into the realm of bat echolocation.
Field investigations of bat echolocation supported by zero-crossing have
tremendously expanded our understanding of bat ecology and activity, but
have also revealed the flexibility and intraspecific variety of bat calls and the
challenges to readily identify bat species by their calls.
While zero-crossing extracts the basic time-frequency content of a signal,
full-spectrum adds the dimension of amplitude changes within bat calls, and
in contrast to zero-crossing that only retains the dominant frequency at any
time, full-spectrum data retains simultaneous multiple frequency content of
a signal at any time to interpret the full acoustic soundscape.
Indeed, the time-amplitude information from full-spectrum data does
enhance species discrimination. But perhaps the greater benefit of full-
spectrum data comes from the higher quality and higher resolution time-
frequency analysis it provides compared with that from zero-crossing and
this further enhances confident species identification. In addition, the full
soundscape information from full-spectrum provides metrics for quality
control essential for automated analysis.
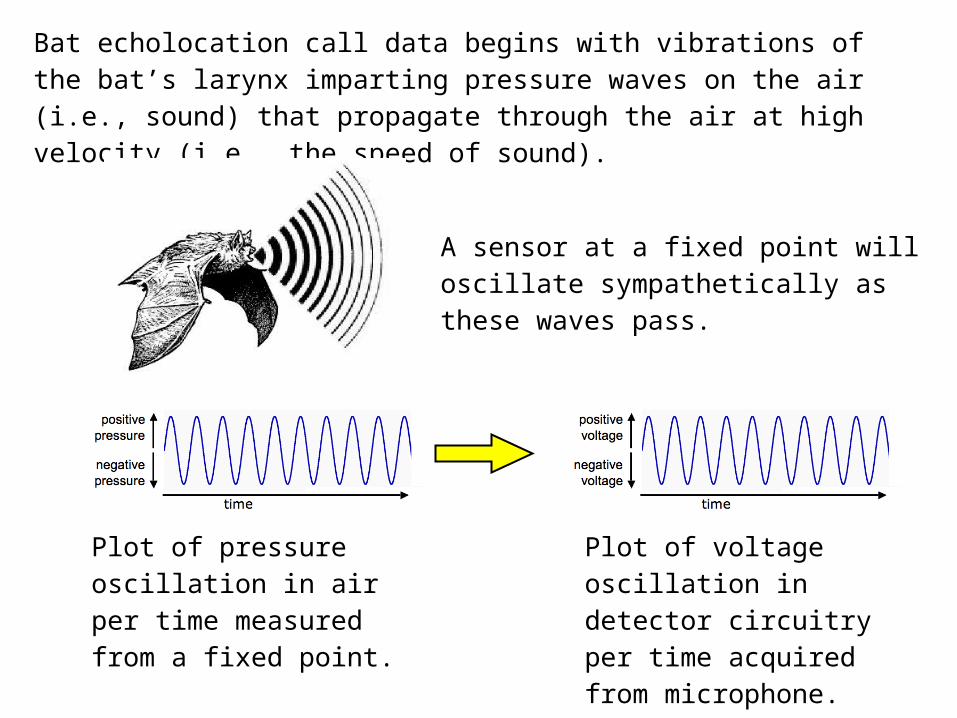
Bat echolocation call data begins with vibrations of the bat’s larynx imparting pressure waves on the air (i.e., sound) that propagate through the air at high velocity (i.e., the speed of sound).
Plot of pressure oscillation in air per time measured from a fixed point.
A sensor at a fixed point will oscillate sympathetically as these waves pass.
Plot of voltage oscillation in detector circuitry per time acquired from microphone.
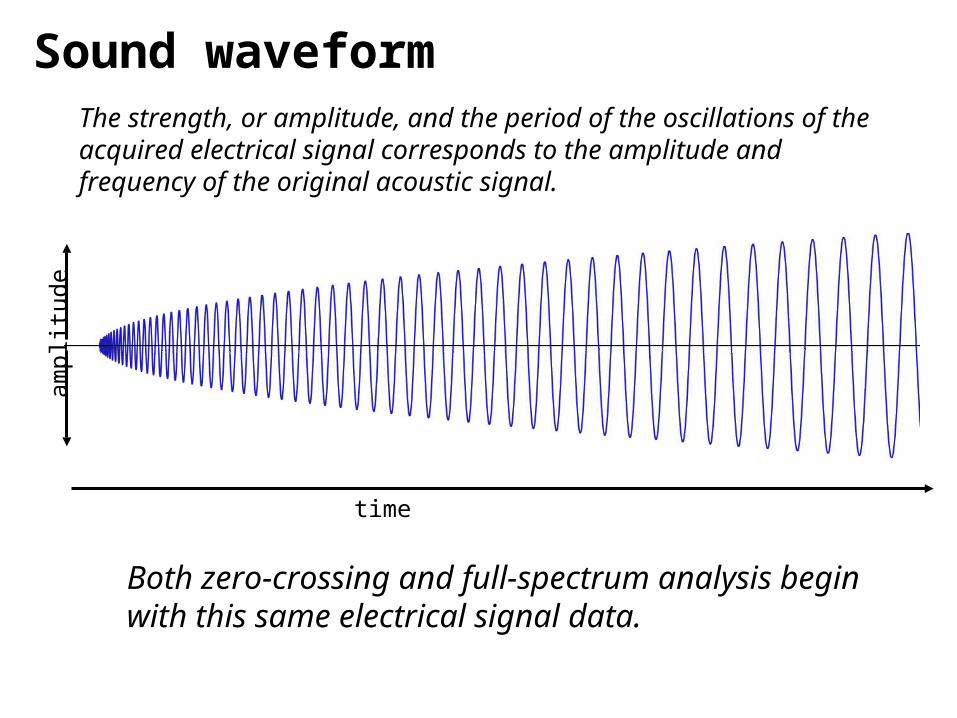
Sound waveform
time
am
plit
ude
The strength, or amplitude, and the period of the oscillations of the acquired electrical signal corresponds to the amplitude and frequency of the original acoustic signal.
Both zero-crossing and full-spectrum analysis begin with this same electrical signal data.
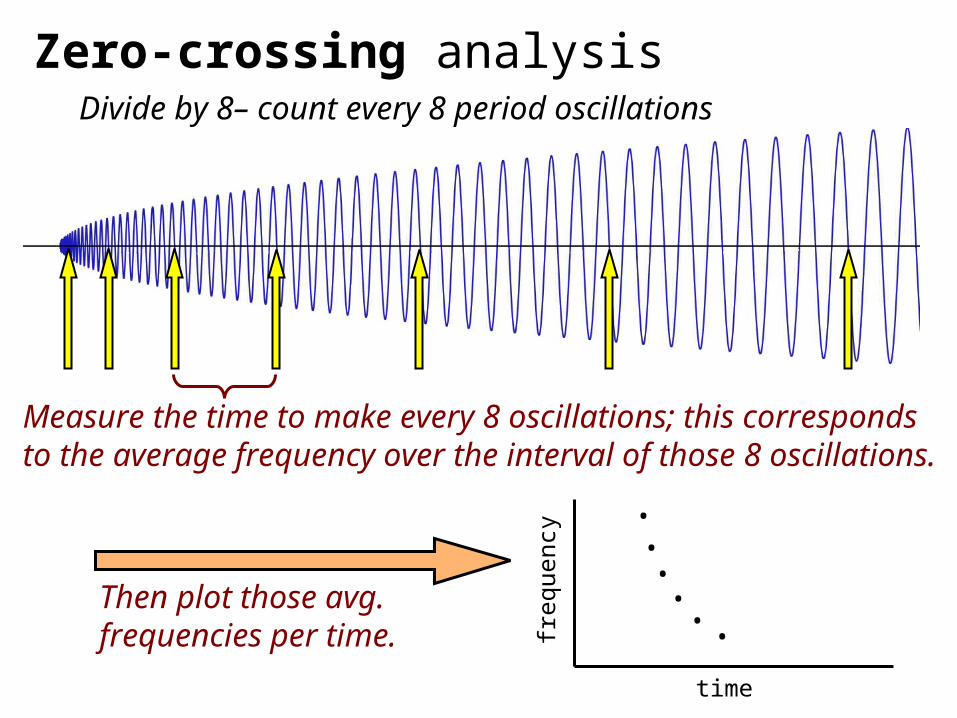
Zero-crossing analysisDivide by 8– count every 8 period oscillations
Measure the time to make every 8 oscillations; this corresponds to the average frequency over the interval of those 8 oscillations. .
... . .frequ
ency
time
Then plot those avg. frequencies per time.
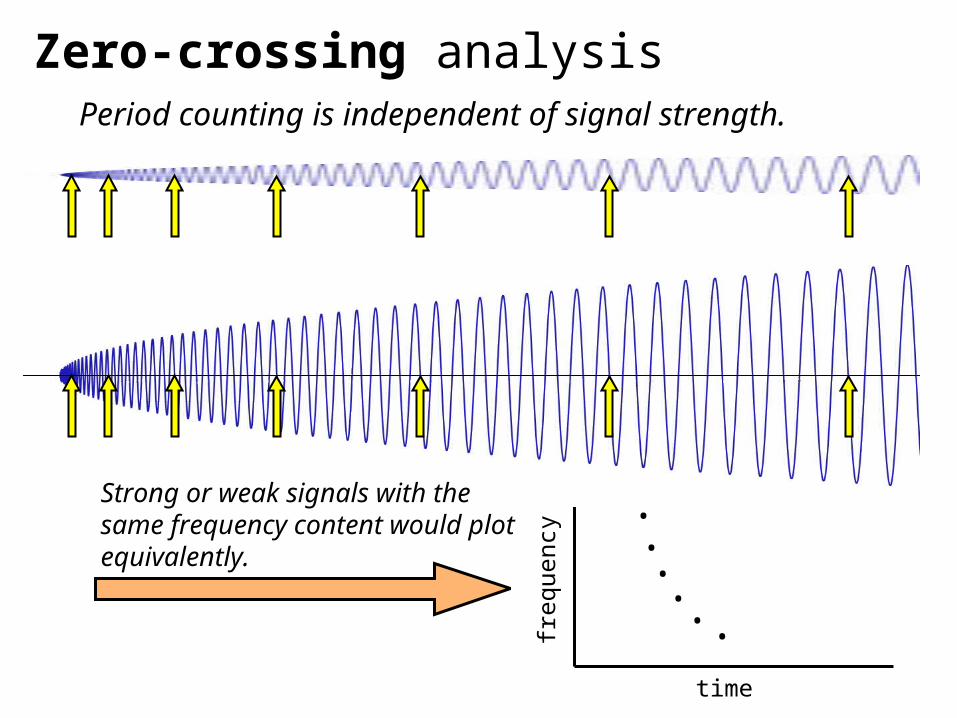
Period counting is independent of signal strength.
frequ
ency
time
.... . .
Zero-crossing analysis
Strong or weak signals with the same frequency content would plot equivalently.
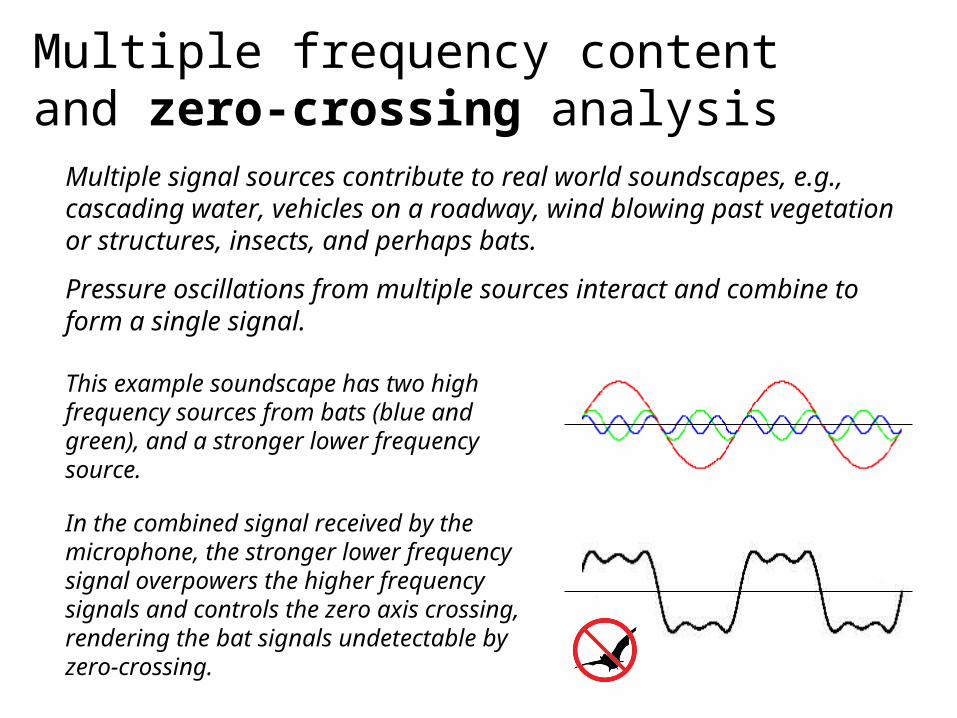
Multiple frequency content and zero-crossing analysis
Multiple signal sources contribute to real world soundscapes, e.g., cascading water, vehicles on a roadway, wind blowing past vegetation or structures, insects, and perhaps bats.
Pressure oscillations from multiple sources interact and combine to form a single signal.
This example soundscape has two high frequency sources from bats (blue and green), and a stronger lower frequency source.
In the combined signal received by the microphone, the stronger lower frequency signal overpowers the higher frequency signals and controls the zero axis crossing, rendering the bat signals undetectable by zero-crossing.
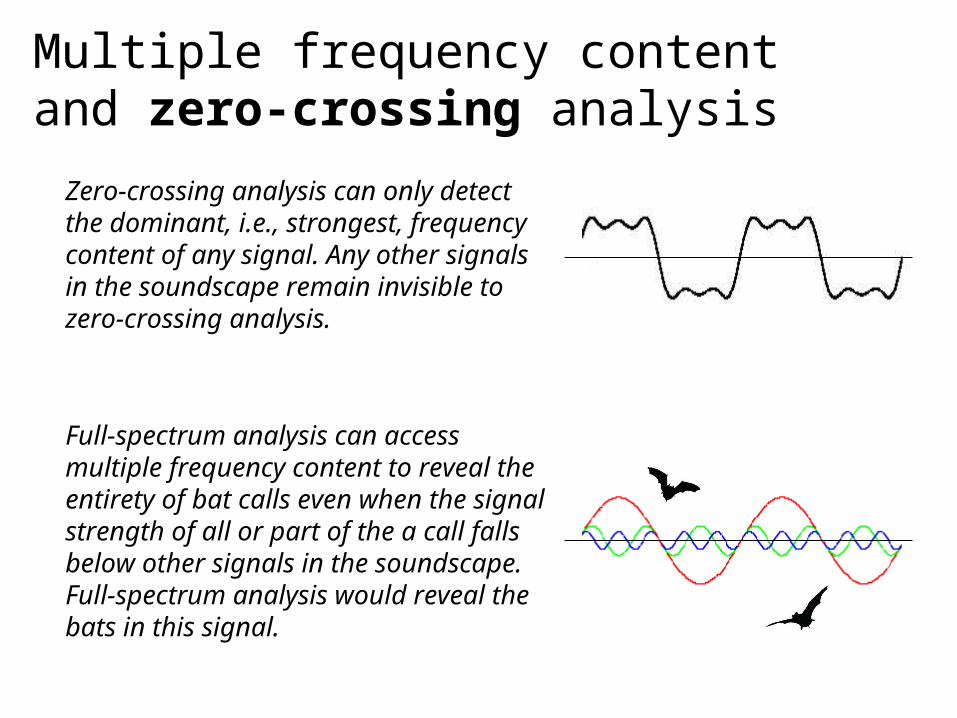
Multiple frequency content and zero-crossing analysis
Zero-crossing analysis can only detect the dominant, i.e., strongest, frequency content of any signal. Any other signals in the soundscape remain invisible to zero-crossing analysis.
Full-spectrum analysis can access multiple frequency content to reveal the entirety of bat calls even when the signal strength of all or part of the a call falls below other signals in the soundscape. Full-spectrum analysis would reveal the bats in this signal.
Full-spectrum analysis
time
am
plit
ude
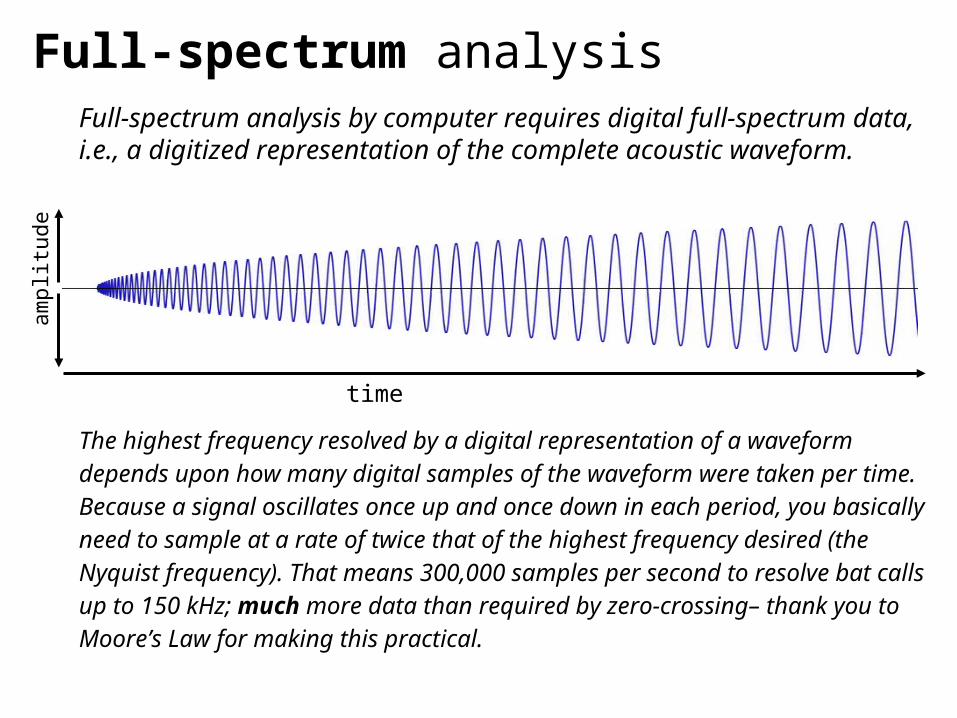
Full-spectrum analysis by computer requires digital full-spectrum data, i.e., a digitized representation of the complete acoustic waveform.
The highest frequency resolved by a digital representation of a waveform depends upon how many digital samples of the waveform were taken per time. Because a signal oscillates once up and once down in each period, you basically need to sample at a rate of twice that of the highest frequency desired (the Nyquist frequency). That means 300,000 samples per second to resolve bat calls up to 150 kHz; much more data than required by zero-crossing– thank you to Moore’s Law for making this practical.
Full-spectrum analysisam
plit
ude
time
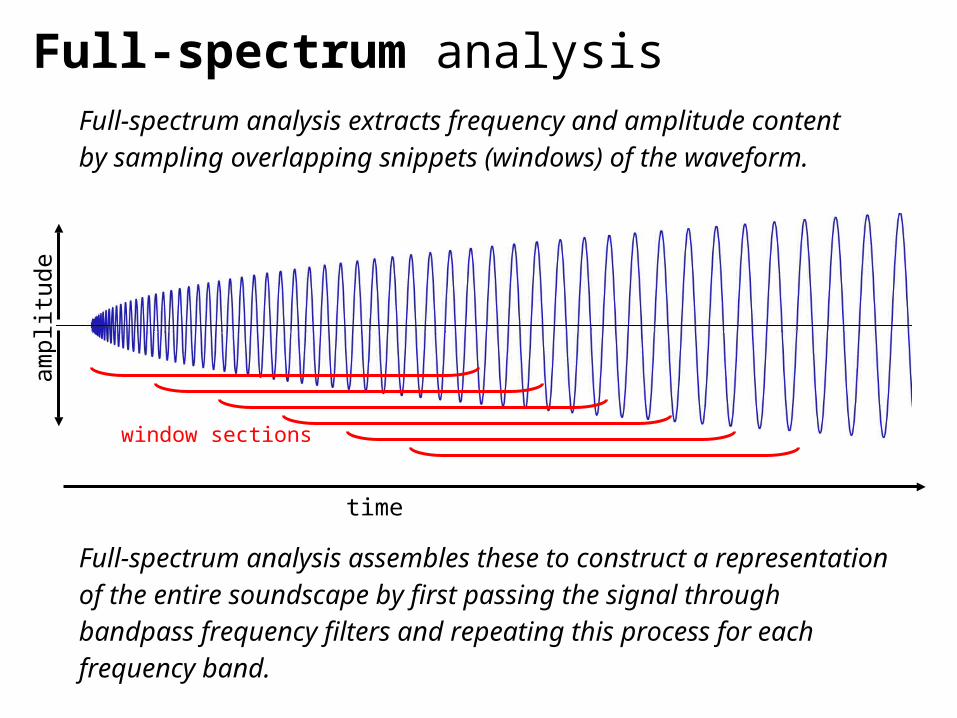
window sections
Full-spectrum analysis assembles these to construct a representation of the entire soundscape by first passing the signal through bandpass frequency filters and repeating this process for each frequency band.
Full-spectrum analysis extracts frequency and amplitude content by sampling overlapping snippets (windows) of the waveform.
Full-spectrum analysis
freq
uen
cy b
and
time
am
plit
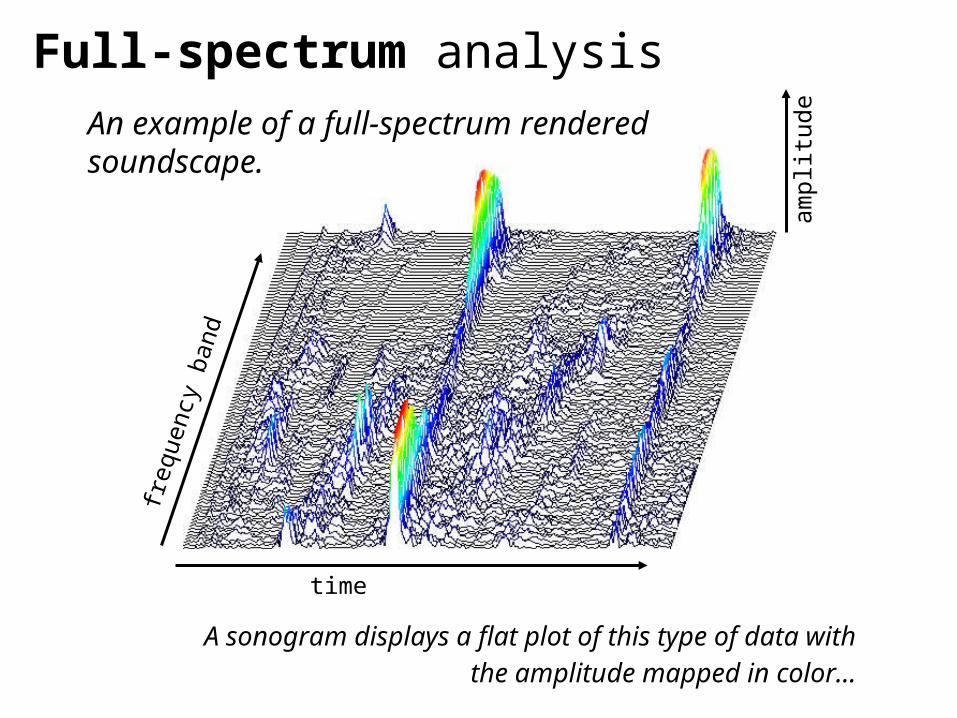
udeAn example of a full-spectrum
rendered soundscape.
A sonogram displays a flat plot of this type of data with the amplitude mapped in color…
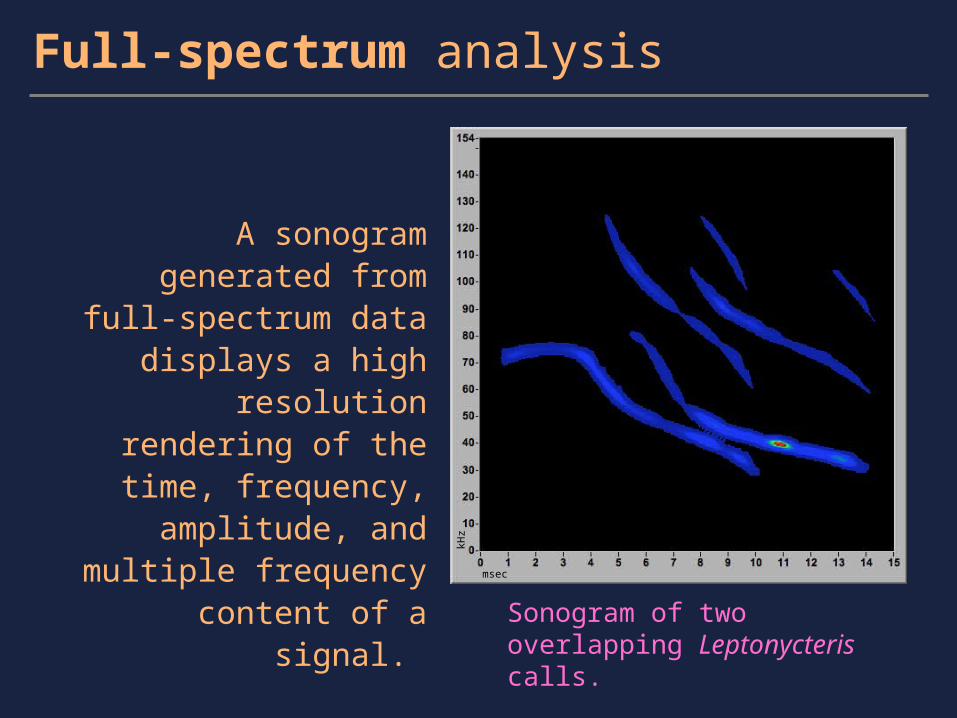
Sonogram of two overlapping Leptonycteris calls.
A sonogram generated from full-spectrum data
displays a high resolution rendering of the time,
frequency, amplitude, and multiple frequency content
of a signal.
Full-spectrum analysis
msec
kHz
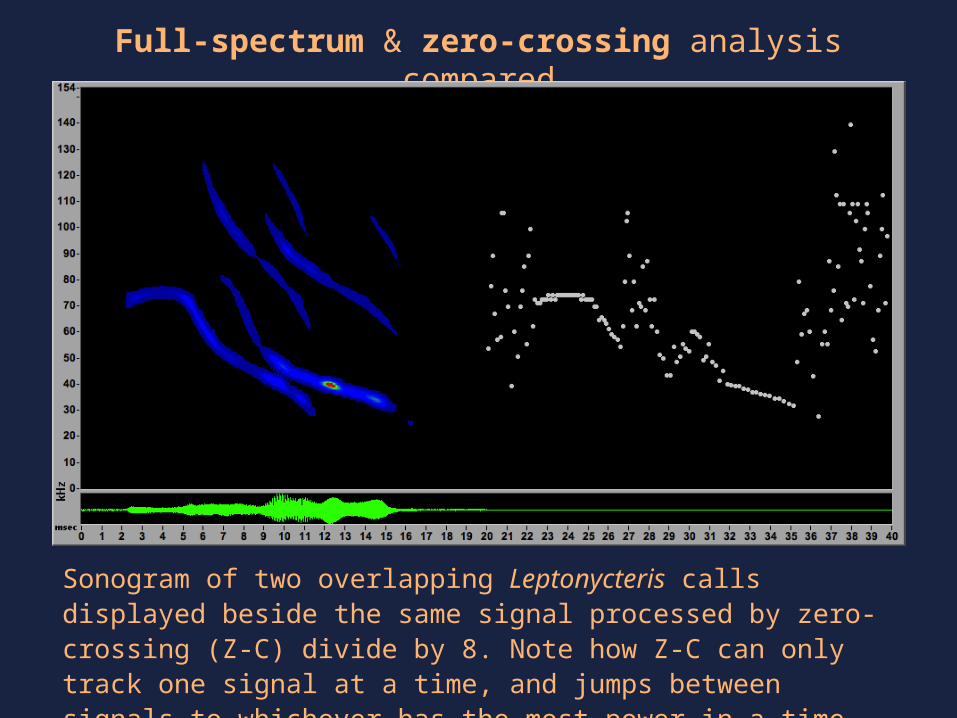
Sonogram of two overlapping Leptonycteris calls displayed beside the same signal processed by zero-crossing (Z-C) divide by 8. Note how Z-C can only track one signal at a time, and jumps between signals to whichever has the most power in a time interval.
Full-spectrum & zero-crossing analysis compared
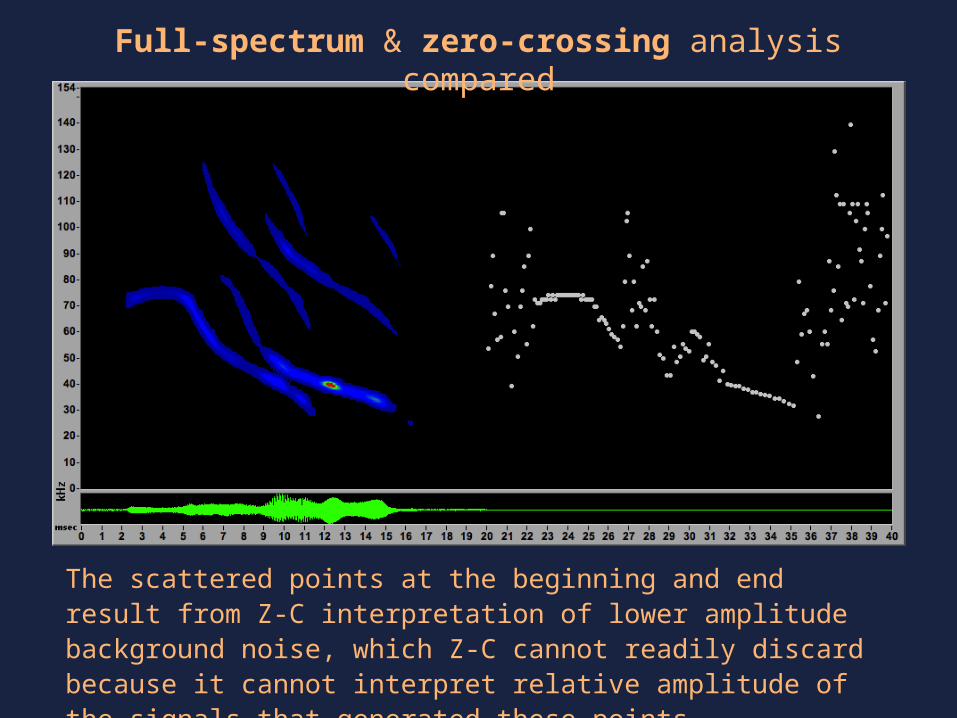
The scattered points at the beginning and end result from Z-C interpretation of lower amplitude background noise, which Z-C cannot readily discard because it cannot interpret relative amplitude of the signals that generated these points.
Full-spectrum & zero-crossing analysis compared
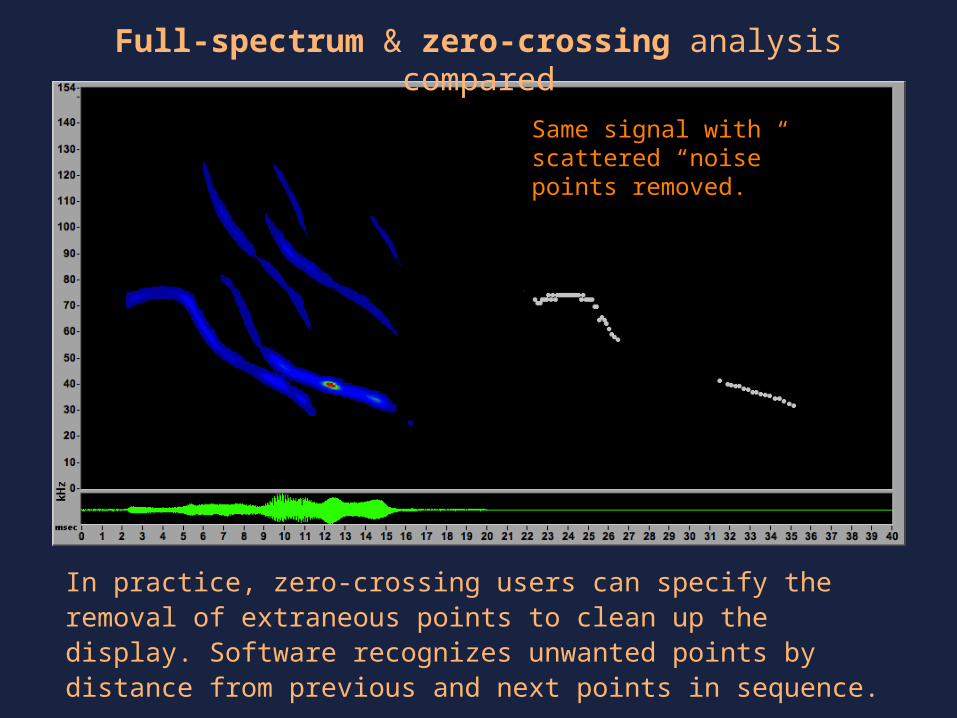
In practice, zero-crossing users can specify the removal of extraneous points to clean up the display. Software recognizes unwanted points by distance from previous and next points in sequence.
Full-spectrum & zero-crossing analysis compared
Same signal with scattered “noise” points removed.
Full-spectrum & zero-crossing analysis compared
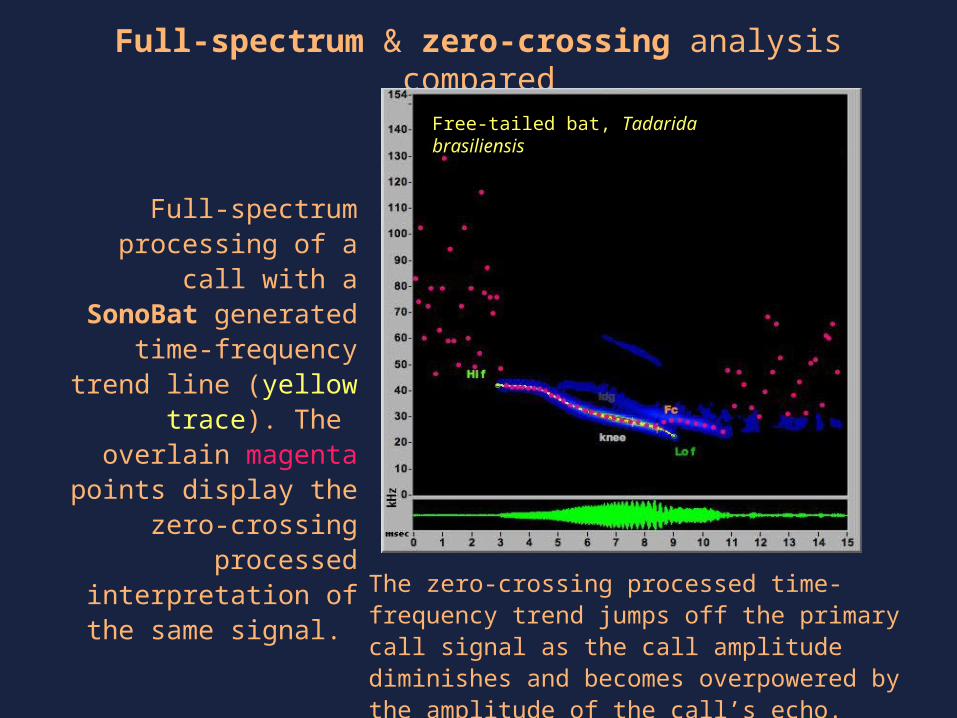
The zero-crossing processed time-frequency trend jumps off the primary call signal as the call amplitude diminishes and becomes overpowered by the amplitude of the call’s echo.
Full-spectrum processing of a call with a SonoBat
generated time-frequency trend line (yellow trace). The
overlain magenta points display the zero-crossing processed interpretation
of the same signal.
Free-tailed bat, Tadarida brasiliensis
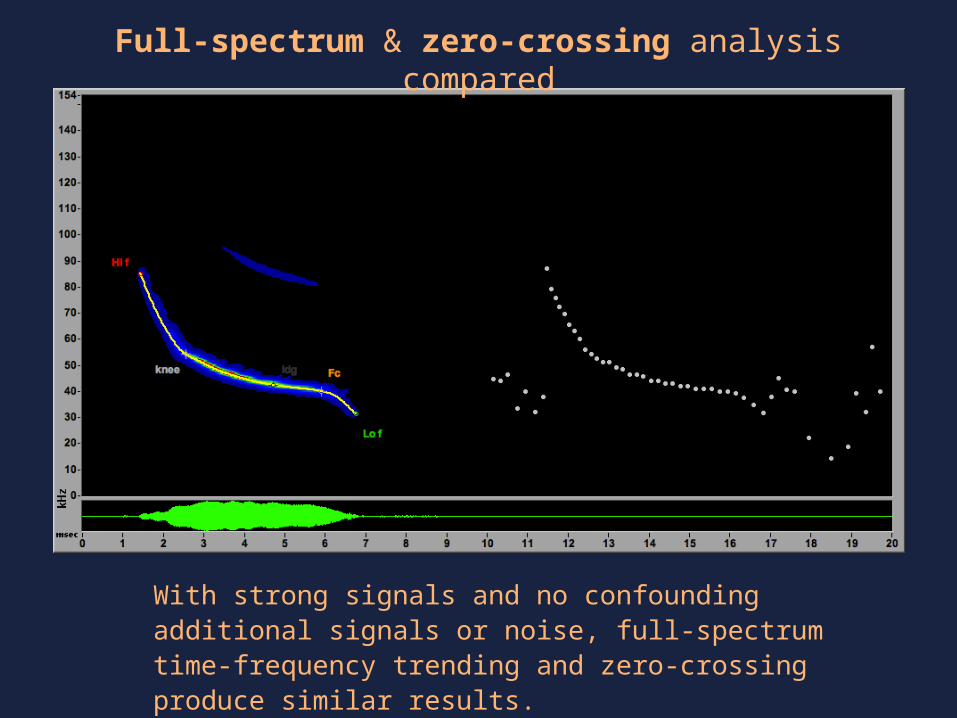
With strong signals and no confounding additional signals or noise, full-spectrum time-frequency trending and zero-crossing produce similar results.
Full-spectrum & zero-crossing analysis compared
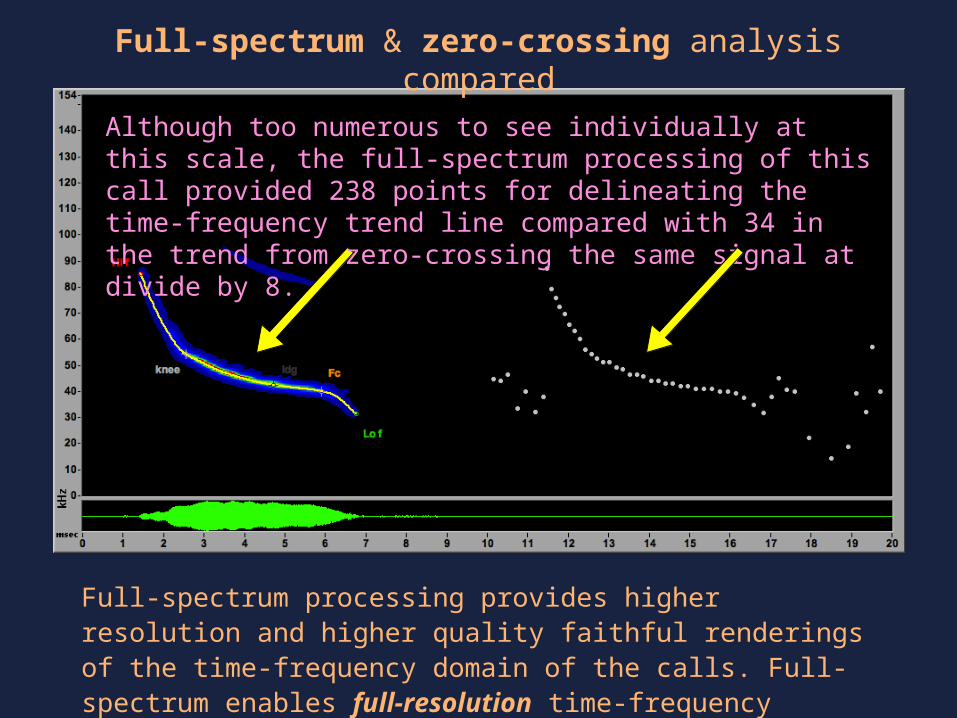
Full-spectrum processing provides higher resolution and higher quality faithful renderings of the time-frequency domain of the calls. Full-spectrum enables full-resolution time-frequency trends.
Although too numerous to see individually at this scale, the full-spectrum processing of this call provided 238 points for delineating the time-frequency trend line compared with 34 in the trend from zero-crossing the same signal at divide by 8.
Full-spectrum & zero-crossing analysis compared
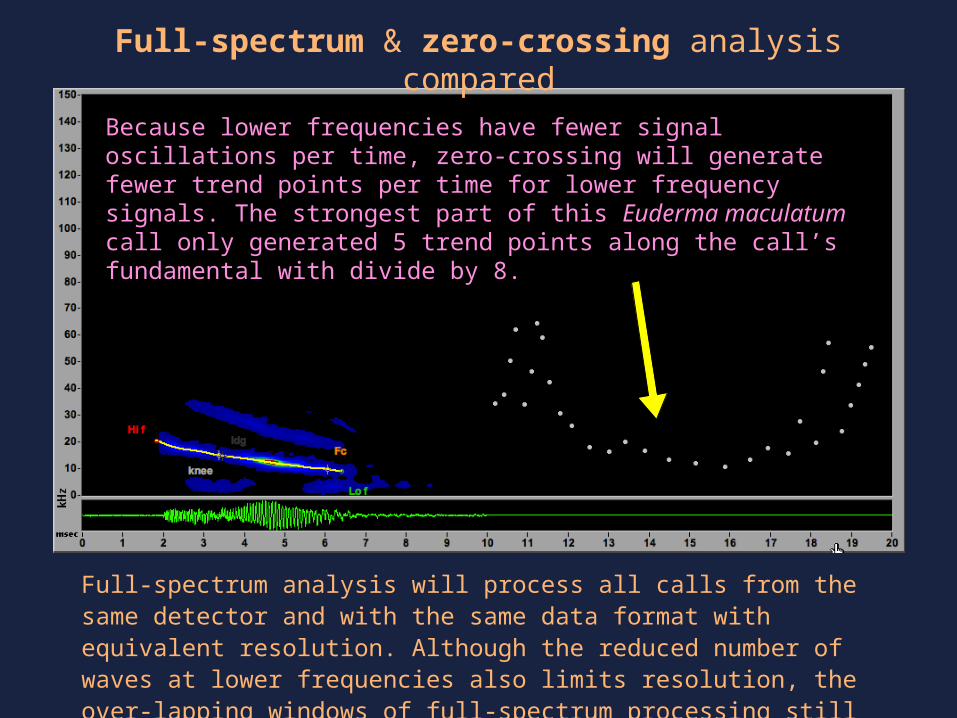
Full-spectrum analysis will process all calls from the same detector and with the same data format with equivalent resolution. Although the reduced number of waves at lower frequencies also limits resolution, the over-lapping windows of full-spectrum processing still provides more trend pts.
Because lower frequencies have fewer signal oscillations per time, zero-crossing will generate fewer trend points per time for lower frequency signals. The strongest part of this Euderma maculatum call only generated 5 trend points along the call’s fundamental with divide by 8.
Full-spectrum & zero-crossing analysis compared
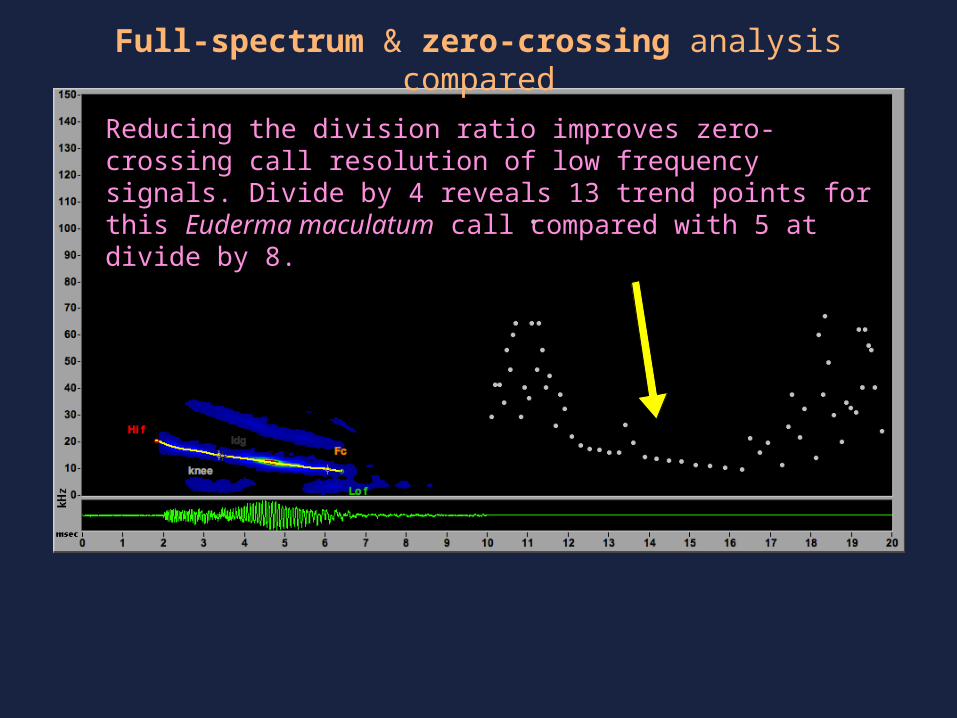
Reducing the division ratio improves zero-crossing call resolution of low frequency signals. Divide by 4 reveals 13 trend points for this Euderma maculatum call compared with 5 at divide by 8.
Full-spectrum & zero-crossing analysis compared
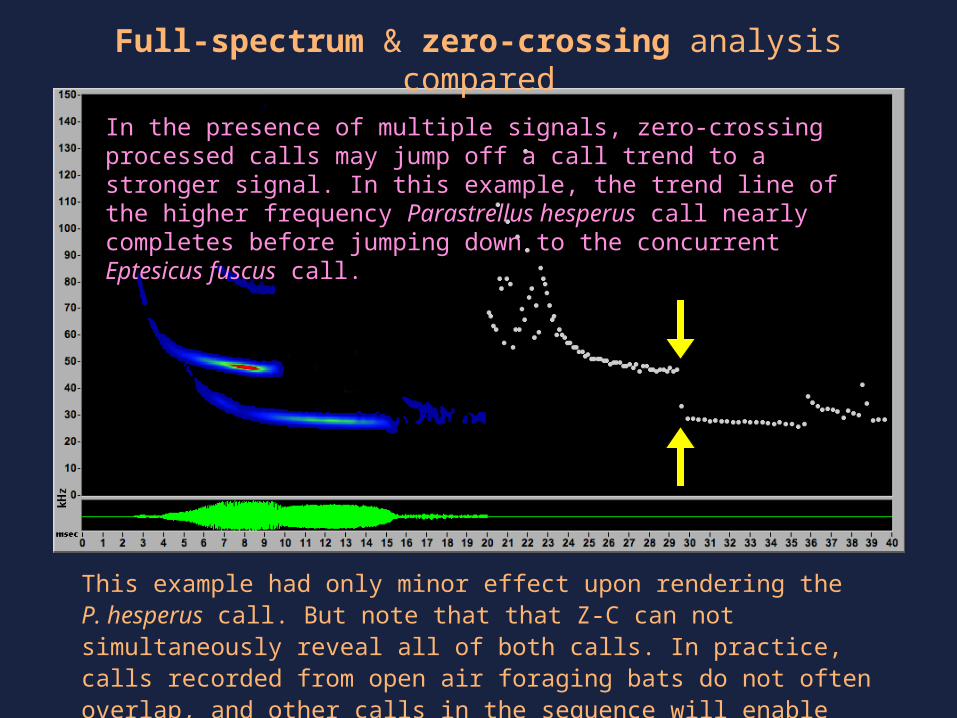
This example had only minor effect upon rendering the P. hesperus call. But note that that Z-C can not simultaneously reveal all of both calls. In practice, calls recorded from open air foraging bats do not often overlap, and other calls in the sequence will enable interpretation.
In the presence of multiple signals, zero-crossing processed calls may jump off a call trend to a stronger signal. In this example, the trend line of the higher frequency Parastrellus hesperus call nearly completes before jumping down to the concurrent Eptesicus fuscus call.
Full-spectrum & zero-crossing analysis compared
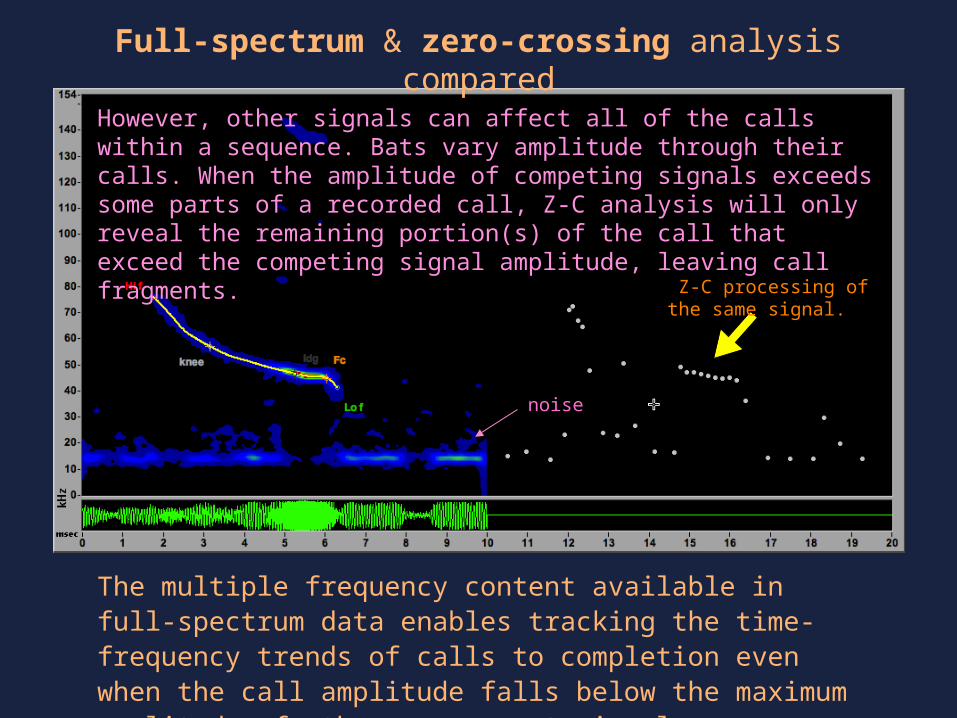
The multiple frequency content available in full-spectrum data enables tracking the time-frequency trends of calls to completion even when the call amplitude falls below the maximum amplitude of other concurrent signals.
However, other signals can affect all of the calls within a sequence. Bats vary amplitude through their calls. When the amplitude of competing signals exceeds some parts of a recorded call, Z-C analysis will only reveal the remaining portion(s) of the call that exceed the competing signal amplitude, leaving call fragments.
Full-spectrum & zero-crossing analysis compared
Z-C processing of the same signal.
noise
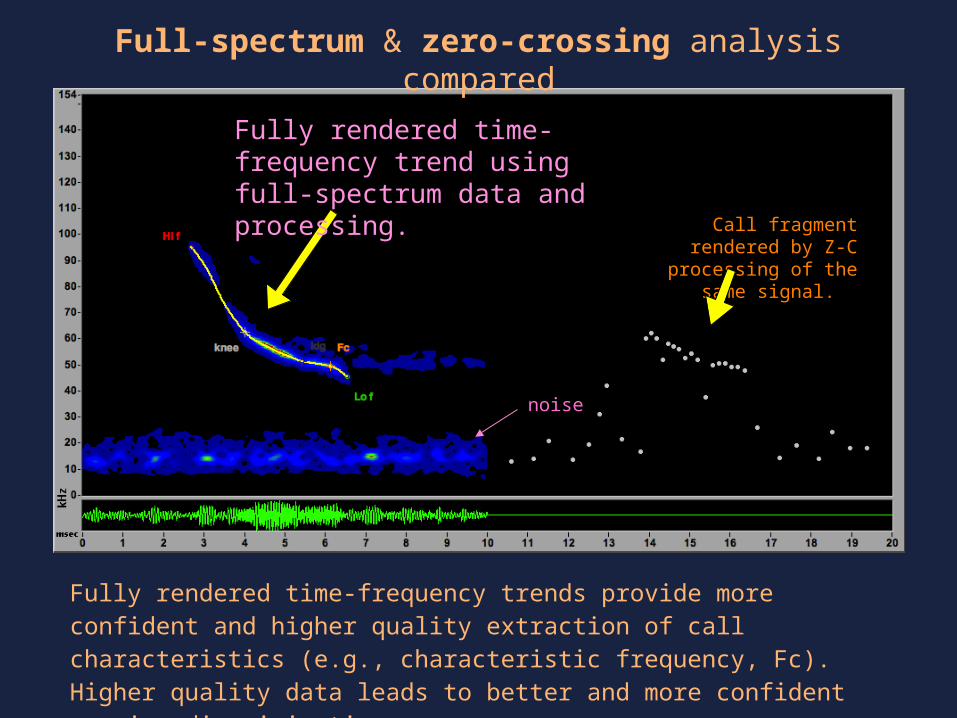
Fully rendered time-frequency trend using full-spectrum data and processing.
Call fragment rendered by Z-C processing of the
same signal.
Fully rendered time-frequency trends provide more confident and higher quality extraction of call characteristics (e.g., characteristic frequency, Fc). Higher quality data leads to better and more confident species discrimination.
Full-spectrum & zero-crossing analysis compared
noise
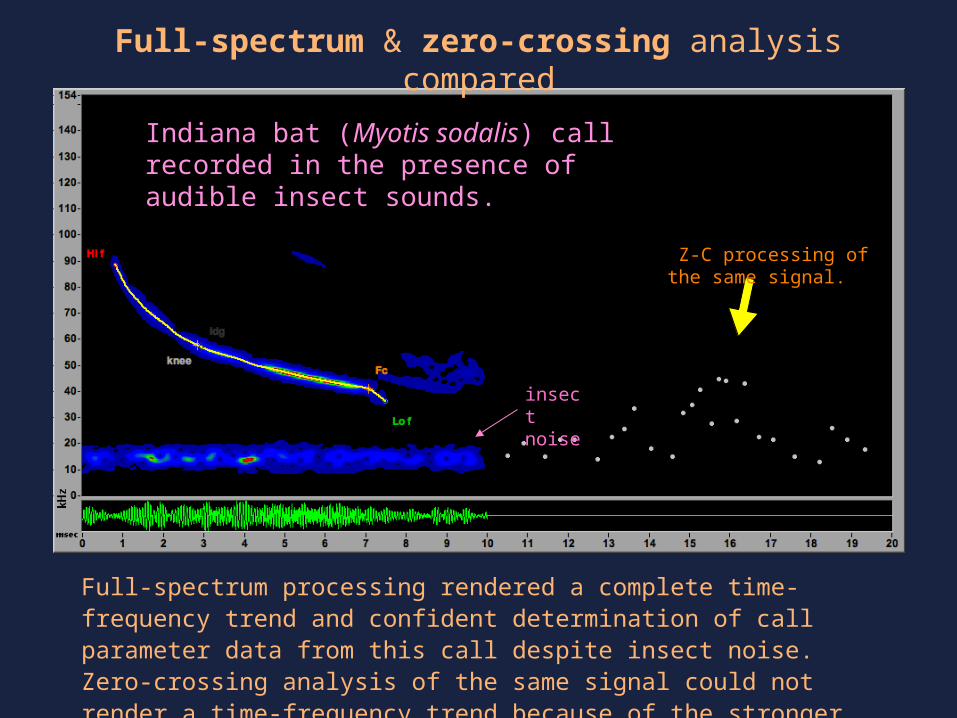
Full-spectrum processing rendered a complete time-frequency trend and confident determination of call parameter data from this call despite insect noise. Zero-crossing analysis of the same signal could not render a time-frequency trend because of the stronger low frequency insect signal.
Indiana bat (Myotis sodalis) call recorded in the presence of audible insect sounds.
Full-spectrum & zero-crossing analysis compared
Z-C processing of the same signal.
insect noise
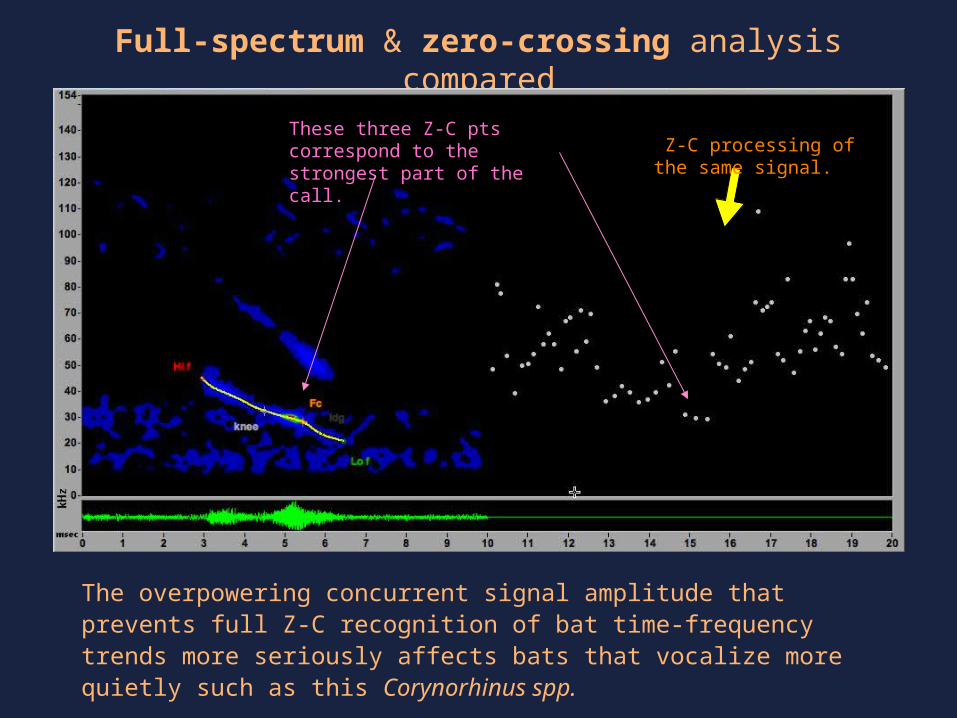
Full-spectrum & zero-crossing analysis compared
The overpowering concurrent signal amplitude that prevents full Z-C recognition of bat time-frequency trends more seriously affects bats that vocalize more quietly such as this Corynorhinus spp.
Z-C processing of the same signal.
These three Z-C pts correspond to the strongest part of the call.
Full-spectrum & zero-crossing analysis compared
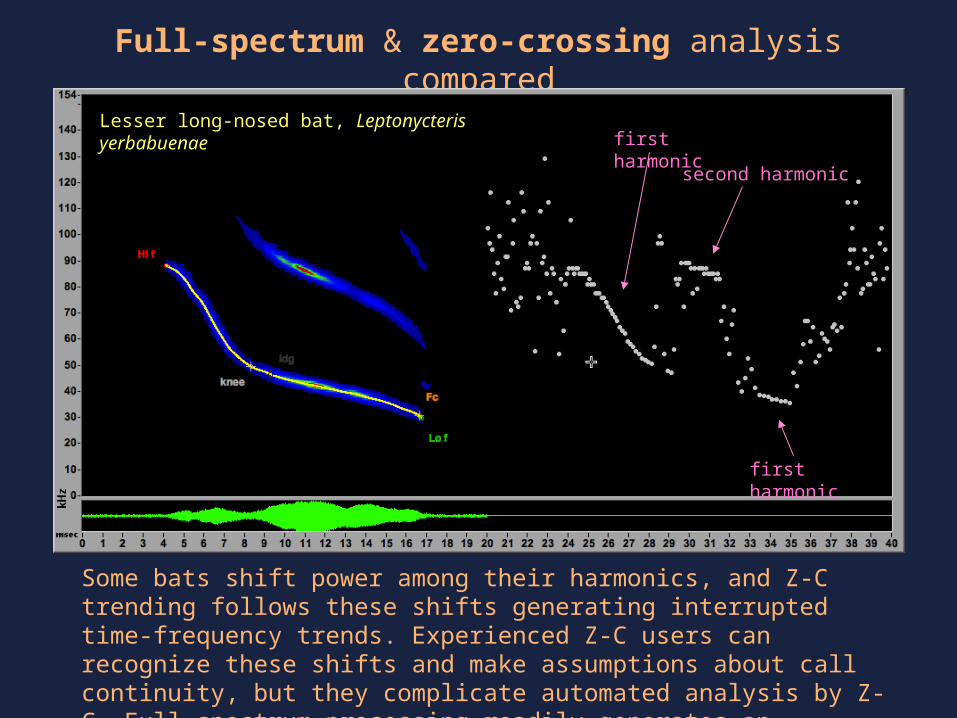
Some bats shift power among their harmonics, and Z-C trending follows these shifts generating interrupted time-frequency trends. Experienced Z-C users can recognize these shifts and make assumptions about call continuity, but they complicate automated analysis by Z-C. Full-spectrum processing readily generates an uninterrupted trend with such data.
Lesser long-nosed bat, Leptonycteris yerbabuenae first harmonic
second harmonic
first harmonic
Full-spectrum & zero-crossing analysis compared
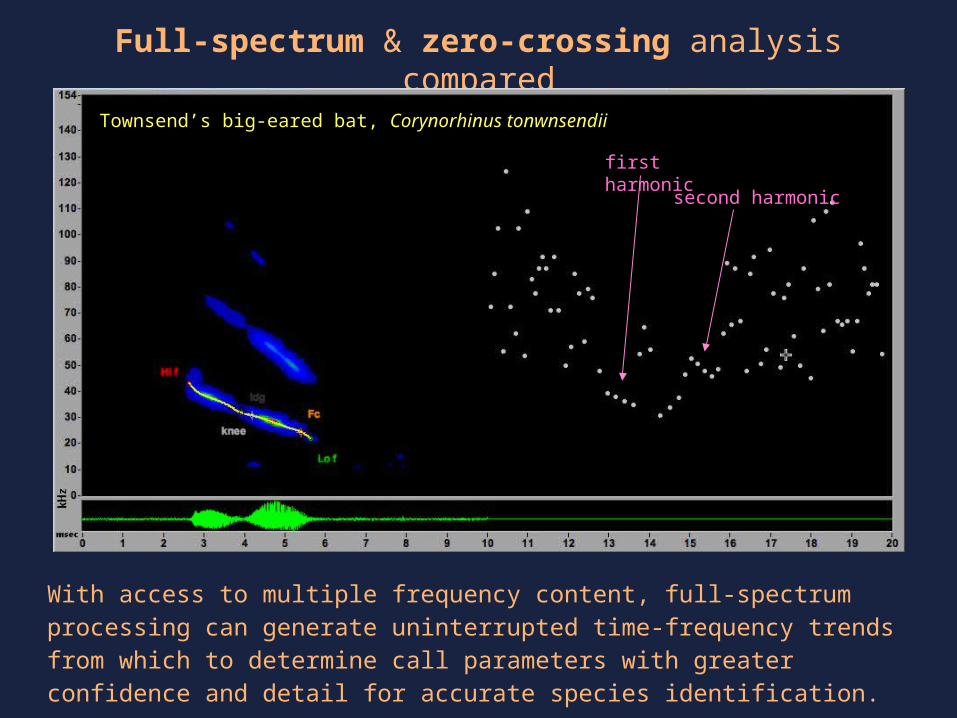
With access to multiple frequency content, full-spectrum processing can generate uninterrupted time-frequency trends from which to determine call parameters with greater confidence and detail for accurate species identification.
Townsend’s big-eared bat, Corynorhinus tonwnsendii
first harmonic
second harmonic
Full-spectrum & zero-crossing analysis compared
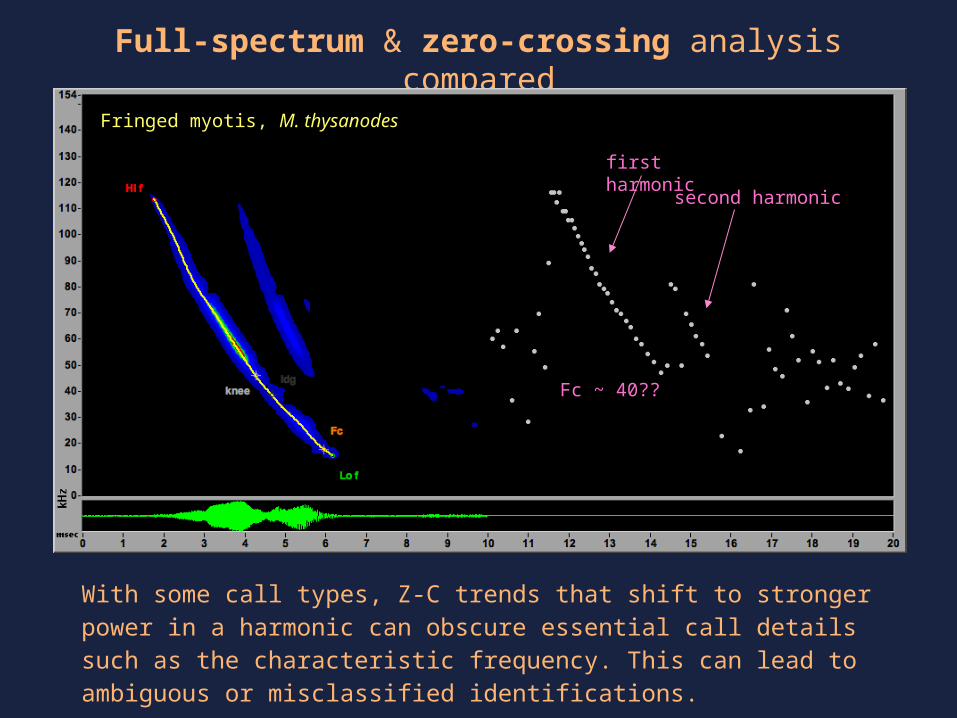
With some call types, Z-C trends that shift to stronger power in a harmonic can obscure essential call details such as the characteristic frequency. This can lead to ambiguous or misclassified identifications.
Fringed myotis, M. thysanodes
first harmonic
second harmonic
Fc ~ 40??
Full-spectrum & zero-crossing analysis compared
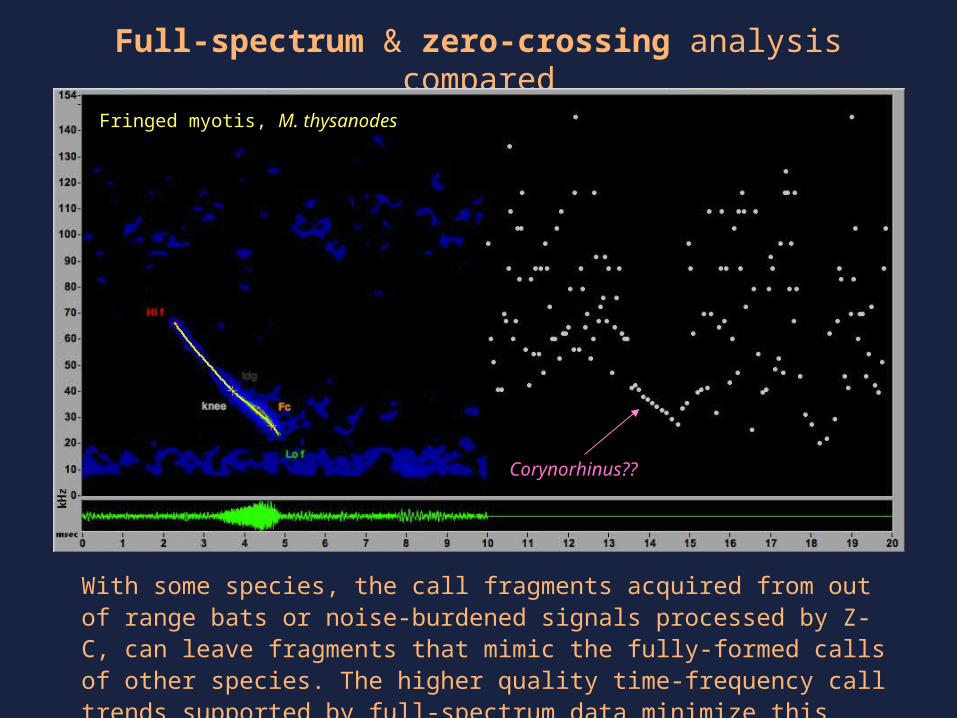
With some species, the call fragments acquired from out of range bats or noise-burdened signals processed by Z-C, can leave fragments that mimic the fully-formed calls of other species. The higher quality time-frequency call trends supported by full-spectrum data minimize this source of error.
Fringed myotis, M. thysanodes
Corynorhinus??
Full-spectrum & zero-crossing analysis compared
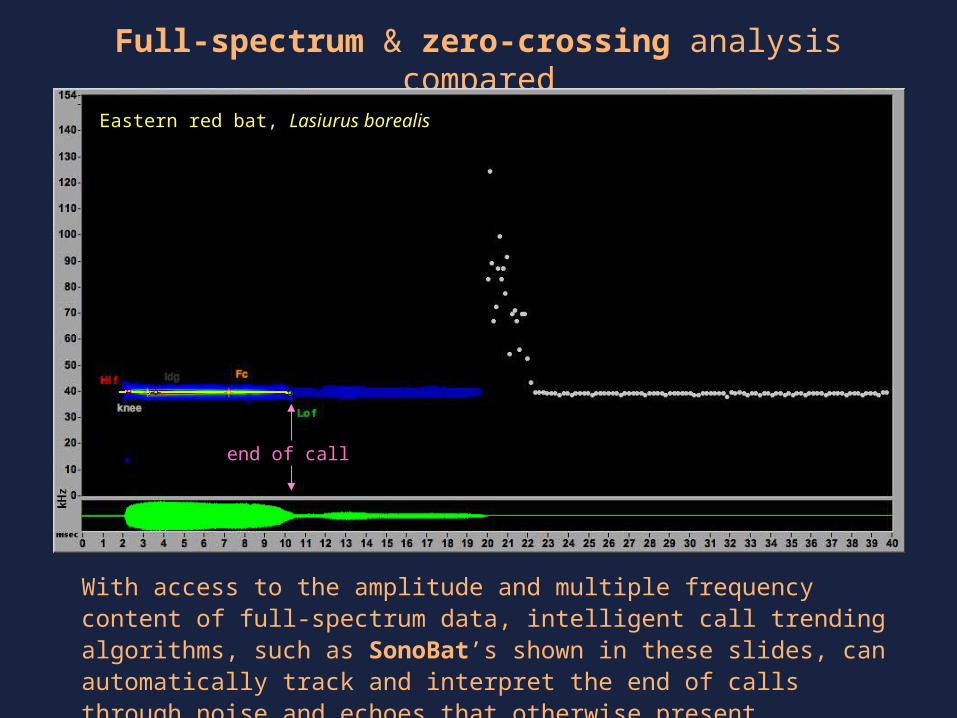
With access to the amplitude and multiple frequency content of full-spectrum data, intelligent call trending algorithms, such as SonoBat’s shown in these slides, can automatically track and interpret the end of calls through noise and echoes that otherwise present ambiguous conditions for Z-C.
end of call
Eastern red bat, Lasiurus borealis
Full-spectrum & zero-crossing analysis compared
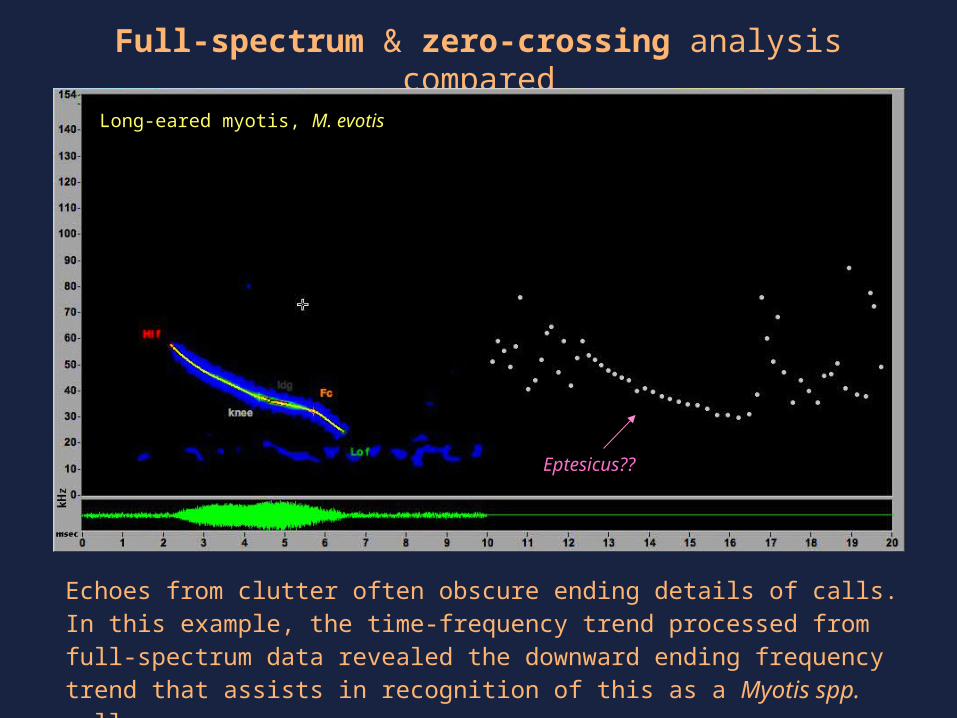
Echoes from clutter often obscure ending details of calls. In this example, the time-frequency trend processed from full-spectrum data revealed the downward ending frequency trend that assists in recognition of this as a Myotis spp. call.
Long-eared myotis, M. evotis
Eptesicus??
Full-spectrum & zero-crossing analysis compared
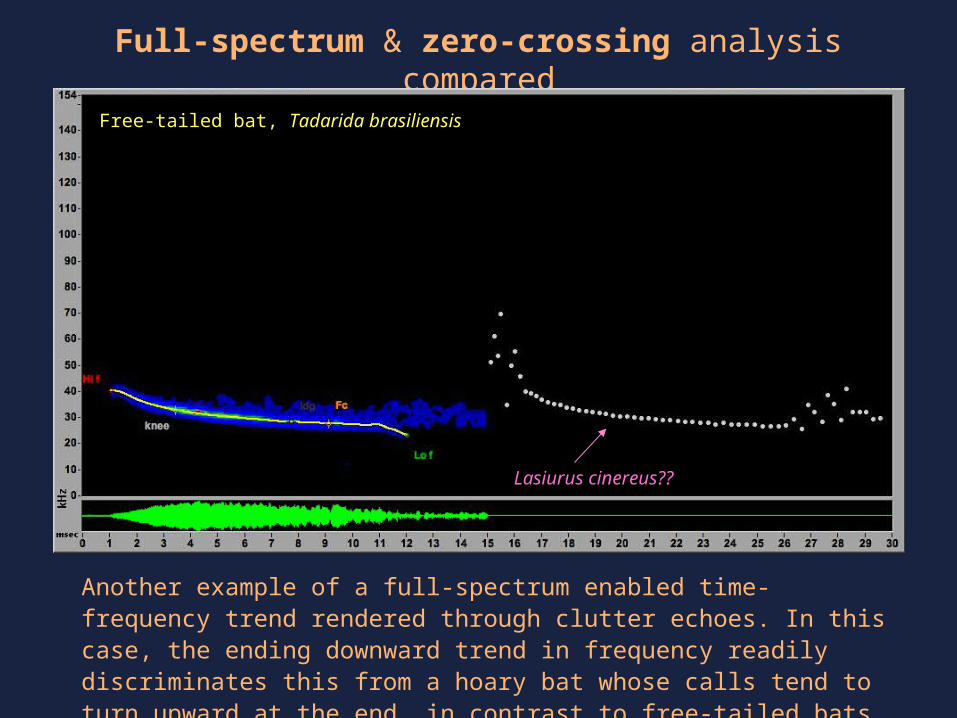
Another example of a full-spectrum enabled time-frequency trend rendered through clutter echoes. In this case, the ending downward trend in frequency readily discriminates this from a hoary bat whose calls tend to turn upward at the end, in contrast to free-tailed bats that tend to turn downward.
Free-tailed bat, Tadarida brasiliensis
Lasiurus cinereus??
Full-spectrum & zero-crossing analysis compared
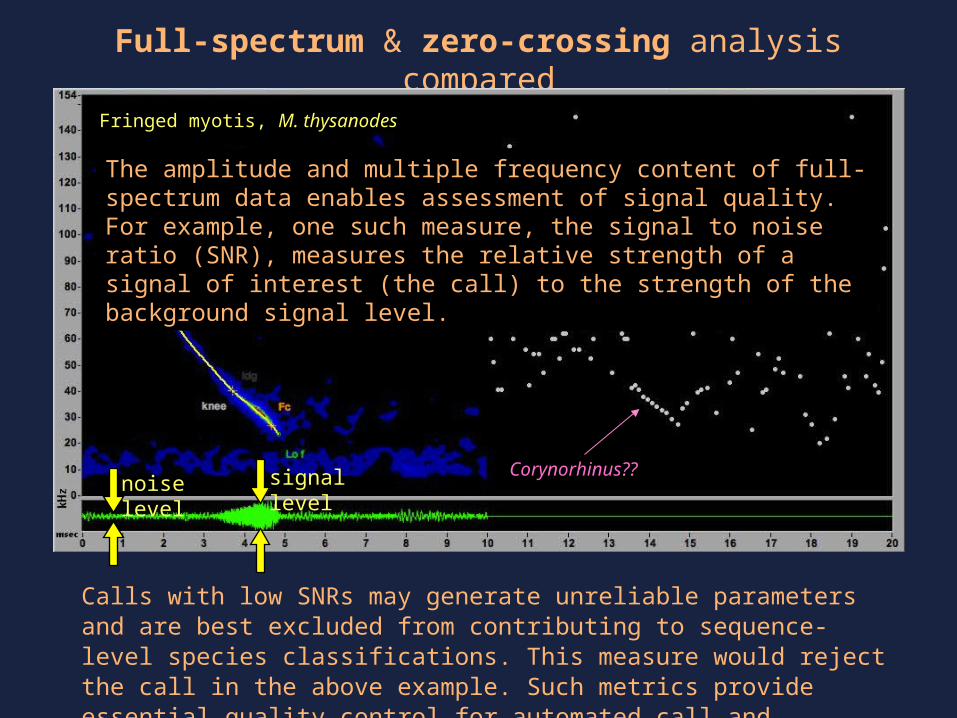
Calls with low SNRs may generate unreliable parameters and are best excluded from contributing to sequence-level species classifications. This measure would reject the call in the above example. Such metrics provide essential quality control for automated call and sequence classification.
Fringed myotis, M. thysanodes
Corynorhinus??signal levelnoise level
The amplitude and multiple frequency content of full-spectrum data enables assessment of signal quality. For example, one such measure, the signal to noise ratio (SNR), measures the relative strength of a signal of interest (the call) to the strength of the background signal level.
Full-spectrum & zero-crossing analysis compared
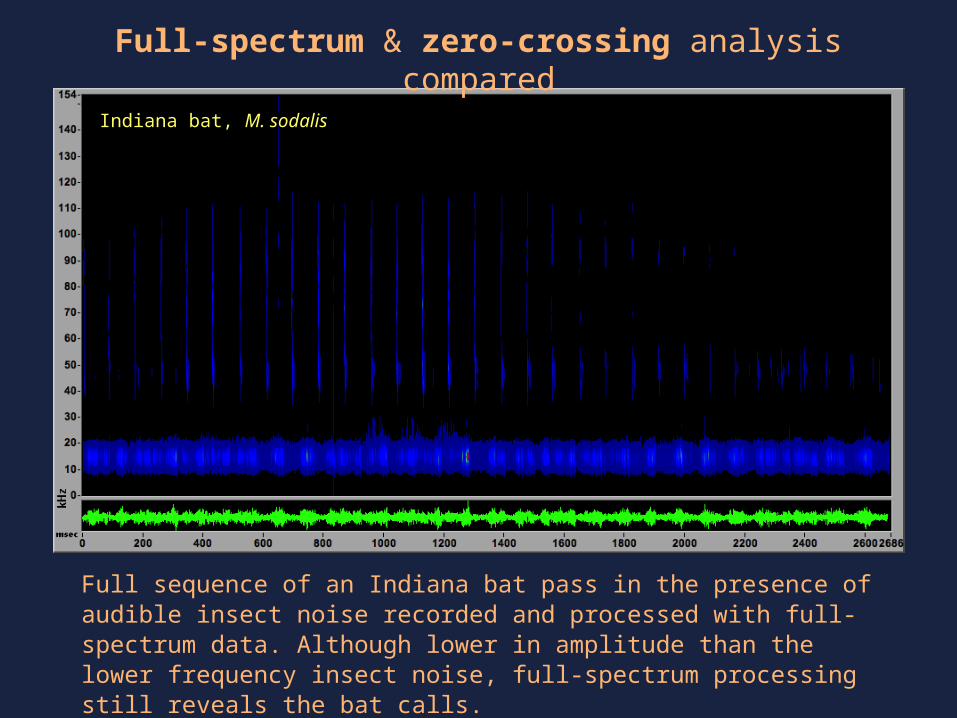
Full sequence of an Indiana bat pass in the presence of audible insect noise recorded and processed with full-spectrum data. Although lower in amplitude than the lower frequency insect noise, full-spectrum processing still reveals the bat calls.
Indiana bat, M. sodalis
Full-spectrum & zero-crossing analysis compared
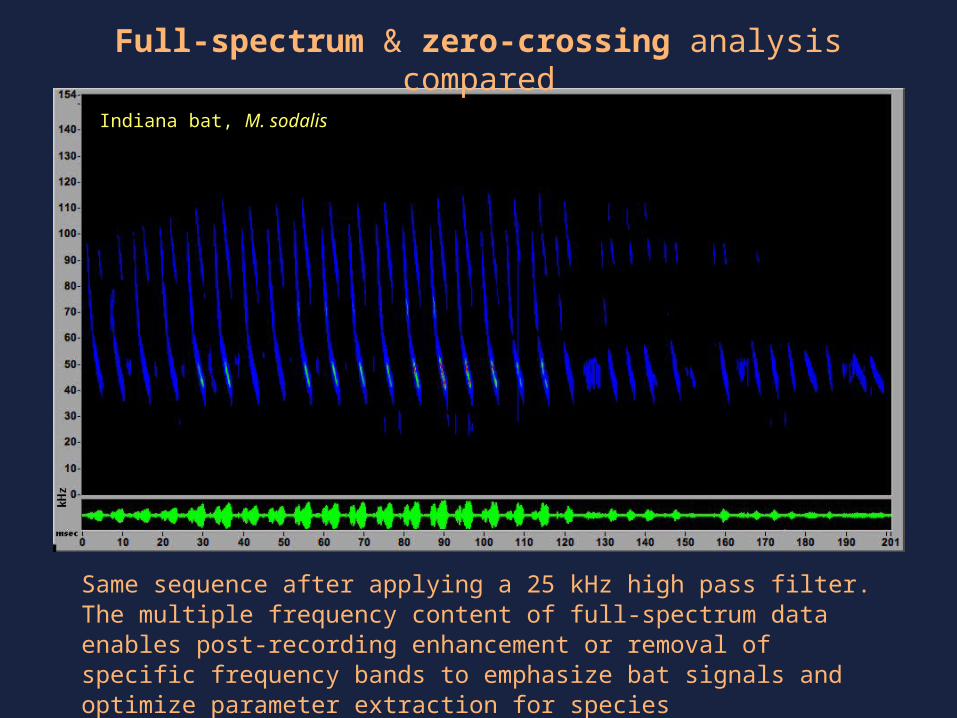
Indiana bat, M. sodalis
Same sequence after applying a 25 kHz high pass filter. The multiple frequency content of full-spectrum data enables post-recording enhancement or removal of specific frequency bands to emphasize bat signals and optimize parameter extraction for species identification.
Full-spectrum & zero-crossing analysis compared
Indiana bat, M. sodalis
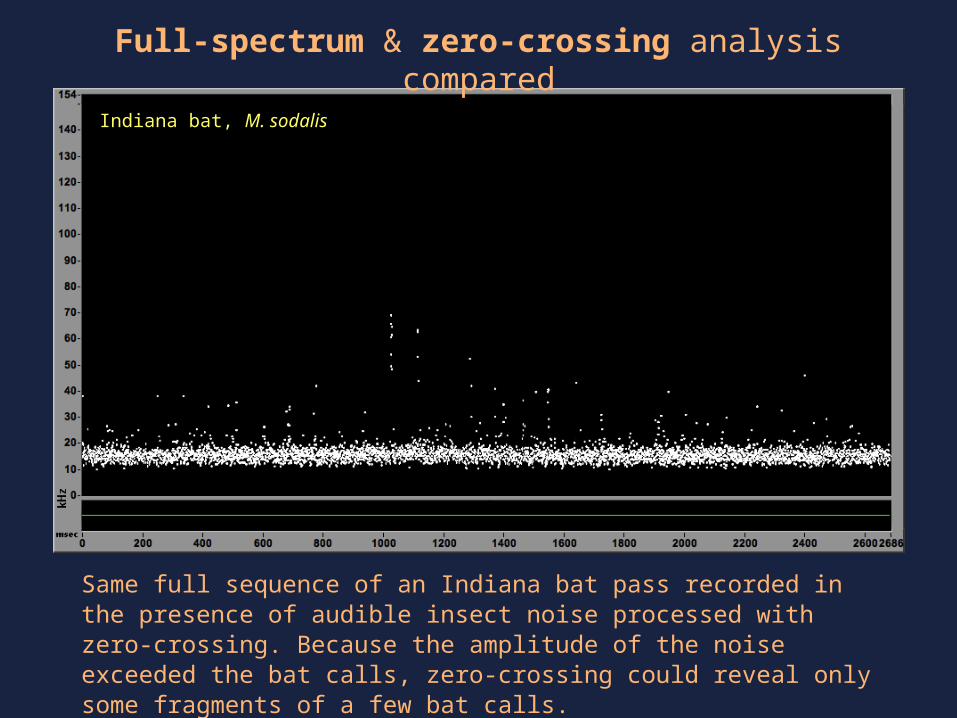
Same full sequence of an Indiana bat pass recorded in the presence of audible insect noise processed with zero-crossing. Because the amplitude of the noise exceeded the bat calls, zero-crossing could reveal only some fragments of a few bat calls.
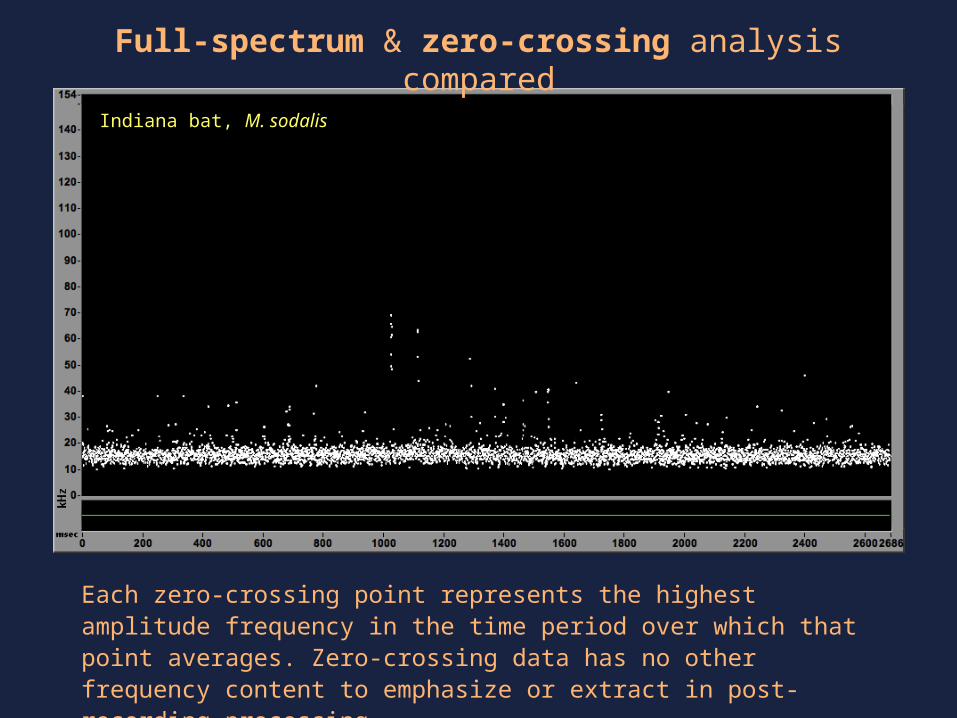
Full-spectrum & zero-crossing analysis compared
Each zero-crossing point represents the highest amplitude frequency in the time period over which that point averages. Zero-crossing data has no other frequency content to emphasize or extract in post-recording processing.
Indiana bat, M. sodalis
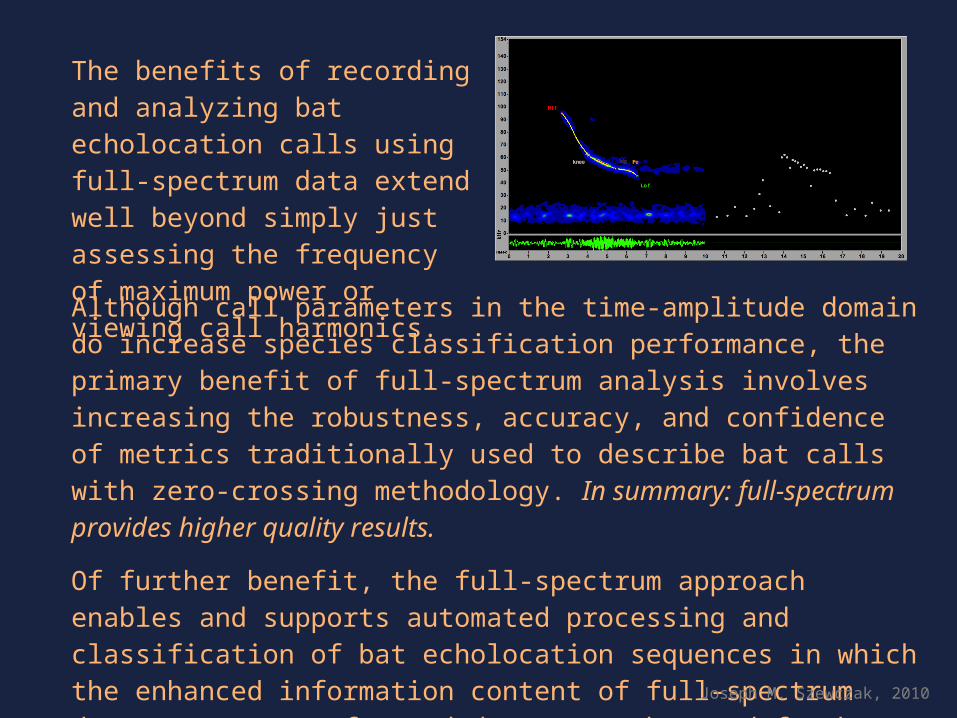
The benefits of recording and analyzing bat echolocation calls using full-spectrum data extend well beyond simply just assessing the frequency of maximum power or viewing call harmonics.
Although call parameters in the time-amplitude domain do increase species classification performance, the primary benefit of full-spectrum analysis involves increasing the robustness, accuracy, and confidence of metrics traditionally used to describe bat calls with zero-crossing methodology. In summary: full-spectrum provides higher quality results.
Of further benefit, the full-spectrum approach enables and supports automated processing and classification of bat echolocation sequences in which the enhanced information content of full-spectrum data compensates for and decreases the need for human attention and artistry in the interpretation of less information-rich data.
Joseph M. Szewczak, 2010