Embed Size (px)
Citation preview
Buildings 2021 11 2 httpsdoiorg103390buildings11010002 wwwmdpicomjournalbuildings
Article
The Behaviour of Fresh Concrete with Varying Coarse Aggregate Content at the Concrete-Steel Wall Interface Audrė Rugytė 1 Mindaugas Daukšys 1 Svajūnas Juočiūnas 1 and Ruben Paul Borg 2
1 Faculty of Civil Engineering and Architecture Kaunas University of Technology 44249 Kaunas Lithuania raudregmailcom (AR) svajunasjuociunasktult (SJ)
2 Faculty for the Built Enviroment University of Malta MSD 2080 Msida Malta rubenpborgumedumt Correspondence mindaugasdauksysktult
Abstract The interaction between concrete and steel occurs during concrete mixing and finishing processes during filling of concrete moulds formwork composite columns and during pumping of concrete mixtures More experimental investigation is required to predict variations in interface friction as a result of the composition of the lubrication layer which depends on the composition of concrete This study provides experimental results to allow for a better understanding of friction at concrete-steel interface with changes in the coarse aggregate (CA) content in the aggregate mixture (AM) Friction tests on fresh concrete have been carried out using the BTRHEOM tribometer (Nantes France) and the interface parameters were calculated on the basis of the interface friction between the concrete and the steel wall through the ADRHEO software The roughness parameters were measured along the length of the rotary steel cylinder of the tribometer In addition the roughness of new and modified metal form-lining in steel composite columns was also measured Variations in the CA content in the AM in the 42 to 52 range had minimal effects on the yield stress of the interface The viscous constant of the interface as measured with a tribometer decreased when the roughness parameter Rt values of the rotary cylinder wall which refer to the absolute vertical distance between the maximum profile peak height and the maximum profile valley depth along the sampling length were in the 1710 to 2873 μm range The roughness profile peaksrsquo asperity recorded was higher for the worn metal form-lining and for the steel composite columns with the inner surface covered in rust when compared to the rotary cylinder roughness profile The hypothesis is based on the principle that a sufficient lubrication layer with the required thickness of fine mortar is created at the interface between the concrete and the metal form-lining or steel composite column wall when the CA content in the AM varies in the range from 42 to 52 and the wall roughness parameters (Rt) of these elements varies in the 1500 to 3000 μm range
Keywords coarse aggregate content lubrication layer tribometer yield stress of the interface viscous constant of the interface steel surface roughness
1 Introduction Friction at the fresh concretesteel interface plays an important role during various
stages of construction processes These include concrete mixing and finishing filling concrete moulds formwork and composite columns and pumping of concrete mixtures where concrete moves relatively to the surface of the wall It is important to investigate the relationship between the concrete mix design and the steel wall parameters in order to reduce variations in friction at the concrete-steel interface The composition of the lubrication layer at the interface varies with the composition of the concrete mix in particular with changes in the coarse aggregate (CA) content in the aggregate mixture (AM)
In the case of pumped concrete fresh concrete moves through the pipe by sliding over a lubrication layer consisting of a fine mortar close to the pipe wall [1ndash4] The
Citation Audrė Rugytė Dauk M
Svajūnas Juočiūnas Borg RP The
Behaviour of Fresh Concrete with
Varying Coarse Aggregate Content
at the Concrete-Steel Wall Interface
Buildings 2021 11 2
httpsdoiorg103390buildings110
10002
Received 14 October 2020
Accepted 19 December 2020
Published 22 December 2020
Publisherrsquos Note MDPI stays
neutral with regard to jurisdictional
claims in published maps and
institutional affiliations
Copyright copy 2020 by the authors
Licensee MDPI Basel Switzerland
This article is an open access article
distributed under the terms and
conditions of the Creative Commons
Attribution (CC BY) license
(httpcreativecommonsorglicenses
by40)
Buildings 2021 11 2 2 of 18
flowability of fresh concrete during the pumping process depends on the properties of the fine mortar layer particularly its yield stress (Pa) and the viscous constant (Pamiddotsm) Eckardstein [5] provides several practical guidelines on how to reduce or predict problems which occur in the lubrication layer during the pumping of concrete mixtures through pipes The properties of the boundary or lubrication layer can be determined when the contribution of concrete shearing to the rotational velocity is known According to Feys et al [6] it is important to determine the rheological properties of a concrete mixture through rheological tests together with the tribological test In addition the choice of the rheometer used in the determination of rheological properties can influence the results obtained with the tribometer The properties of the boundary or lubrication layer and the roughness of the pipe wallrsquos inner surface have a significant effect on the concrete sliding through the pipes [7] The concrete mix design can impact the properties of the lubricant layer produced between concrete and the pipe
The friction at the concrete-steel interface plays an important role and has an effect on the pumpability of the concrete mixture For a better understanding of concrete behaviour at the concretewall interface various types of ldquotribometersrdquo have been developed in the last decade The tribometer is an instrument that measures tribological parameters between two surfaces in contact Tribometers can be divided into three categories [8] according to the principle of operation equipment which can provide the pumping process while the fresh concrete slides through a pipe equipment (so-called rectilinear movement tribometer) which presses fresh concrete samples against a moving steel plate surface and measures the tangential force equipment which works on the rotary movement principle while concrete is sheared between two coaxial cylinders The Sliding Pipe Rheometer is also applied to estimate the mixture pumpability Secrieru et al [9] determined the correlation between the concrete mixture Bingham model parameters and slippage resistance parameters related to pumpability using the Sliding Pipe Rheometer (SLIPER)
Various authors [10ndash13] used the rectilinear movement tribometer and investigated the impact of different parameters on the concretesteel plate friction coefficient The parameters are as follows the roughness of the steel plate surface the sliding velocity of concrete mixture sample against the steel plate the pressure value the kind and amount of the release agent at the concretesteel wall interface It was concluded that due to the release agent composition it is possible to reduce friction at the concretesteel interface During the pouring of concrete demoulding oils have an effect on the friction stress which depends on the contact pressure and the sliding velocity of concrete With an increase in the water to cement ratio WC interface friction is reduced significantly together with a decrease in the corresponding viscous constant The addition of superplasticiser in concrete increases the concrete slump which reduces the interface friction and the corresponding viscous constant [14] Djelal [15] reported that the movement of particles in clay-water mixtures depends on the interrelation between the clay particle size and the steel plate roughness amplitude The measured steel surface value Ra describes the c roughness class Machined steel surfaces with different roughness classes have different friction features and the surface structure is often closely related to the friction [16]
The behaviour of fresh concrete on the formwork surface depends on the concrete mix proportions the chemical admixtures used ambient air temperature during casting casting rate of concrete and the height of formwork used on the construction site [111718] Libessart et al [18] reported that the level of friction at the fresh concreteformwork surface directly depends on roughness parameters of the formwork used It was concluded that fines in concrete mixtures have an impact on the lubrication or fine mortar layer close to the formwork surface Some authors [1719] noticed that the formwork lateral pressure is influenced by concrete mix proportions placing temperature of the concrete mixture the chemical admixtures type and amount used ambient air temperature casting rate of concrete and friction at the interface between the fresh concrete and formwork used on the construction site Kwon et al [17] proposed a
Buildings 2021 11 2 3 of 18
prediction model which includes the effect of wall friction formwork flexibility and external temperature in order to predict variations in formwork pressure over time Formworks made from different surface materials have different impacts on the lateral pressure of concrete [20] Watering of timber formwork surfaces before pouring the concrete mixture has an effect not only on changes to the watercement ratio but also on the friction at the interface between timber formwork and the fresh concrete
Various studies have shown that the interface friction between concrete and steel occurs at various stages of the construction processes In addition friction can be determined by the thickness and the rheology of the lubrication layer formed at the interface between the concrete and steel the roughness of the steel surface has an influence on the friction of the lubrication layer at the interface Various tribometers are used to determine the relationship between the concrete composition parameters and the interface friction Friction exerted by concrete on metal surfaces plays an important role during placing operations especially when the surface of the formwork is not covered by demoulding oils to reduce the interface friction at the concrete-steel interface This is also the case of steel composite columns with different surface roughness parameters The surface irregularities of steel composite columns are created through machining In the case of steel composite columns the relationship between the concrete composition parameters and the interface friction of the steel needs to be determined The objective of the research presented in this article is to analyse the effects of coarse aggregate (CA) content in the aggregate mixture (AM) and variations in the composition of the lubrication layer on the friction at the concrete-steel wall interface
2 Materials and Methods Portland cement CEM I 425 R sourced from JSC ldquoAkmenės cementasrdquo in Lithuania
was used as binder satisfying the requirements set out in LST EN 197-1 [21] The physical properties of the cement were as follows specific surface area by Blaine apparatus 410 m2kg particle density 3050 kgm3 dry bulk density 1210 kgm3 and water demand for standard consistency by Vicat 265
The fine aggregates used in the research consisted of sand sourced from ldquoKvesurdquo quarry (JSC ldquoKvesų karjerasrdquo Lithuania) with sizes as follows 0ndash1 mm and 0ndash4 mm The physical properties of the sands were as follows dry bulk density 1521 kgm3 and 1711 kgm3 specific gravity of both at about 266 water absorption 056 and 050 respectively Sand of size 0ndash1 mm with fineness modulus of 23 was defined as fine sand and sand of size 0ndash4 mm with fineness modulus of 32 was defined as coarse sand
Gravel of size 4ndash16 mm and with dry bulk density 1457 kgm3 specific gravity 267 and water absorption 139 was used as coarse aggregate The flakiness index of the gravel of size 4ndash16 mm was 4 This index describes the percentage by weight of aggregate particles whose least dimension is less than 06 of their mean dimensions Aggregate particles with a nearly spherical shape and a smooth surface texture were used in this research The granulometric properties of the aggregate used were determined in accordance to the standard LST EN 12620 [22] and presented in Table 1
Buildings 2021 11 2 4 of 18
Table 1 Sieve analysis data of the aggregates
Sieve Size mm Passing ()
Sand in Fracture 0ndash1 mm
Sand in Fracture 0ndash4 mm
Gravel in Fracture 4ndash16 mm
315 - - 1000 160 - - 930 80 - 1000 254 40 1000 975 04 20 999 877 00 10 981 719 00
0500 925 560 00 0250 280 174 00 0125 32 46 00
0 00 00 00
Glenium SKY 628 supplied by BASF Constructions Chemicals (Spa Italia) based on polycarboxylic ether polymers was used as plasticising admixture The superplasticiser consists in a yellow liquid with a density of 106 kgL and 10 of superplasticiser by weight of cement was added to the concrete
In the research 6 different concrete mix compositions were considered For each mixture composition two samples were made and tested The concrete mix designs with an amount of material (kg) per cu m of concrete are presented in Table 2
Table 2 Composition and technological properties of tested mixture series
Marking
The Amount of Materials per cu m of Concrete Mixture (kg) Technological Properties
Content of CA ()
Portland Cement
Gravel Fraction
416
Sand Fraction
04
Sand Fraction
01 Water Super-
Plasticizer
Slump Value (mm)
Density (kgm3)
Air Content
() CM22 22 330 417 986 492 178 33 30 2180 79 CM32 32 330 607 860 429 178 33 50 2160 79 CM37 37 330 702 797 397 178 33 160 2340 39 CM42 42 330 796 733 366 178 33 170 2290 59 CM47 47 330 891 671 334 178 33 190 2380 21 CM52 52 330 986 607 303 178 33 230 2400 16
The content of CA is calculated as a percentage of the total aggregate mixture (AM) by mass The water to cement ratio (WC) and plasticising admixture content were constant in all the concrete mixtures The mixes are based on a constant plasticizing admixture dosage rather than a constant slump The innovation in the research refers to the effect of total aggregate mixture on the tribological parameters when the CA content is increased and fine aggregate (FA) content is decreased All mix compositions were prepared using a sand fraction 01 with an increase in the specific surface of fine aggregate in order to retain the mix cohesion With an AM based on gravel fraction 416 (uncrushed aggregate) content above 52 and sand fraction 04 and 01 content below 48 the concrete mixture lost cohesion and started to bleed
The particle size distribution of the final aggregate mixtures (AM) for all the six mixture series analysed with the CA content in the AM changing from 22 to 52 are presented in Figure 1
Concrete was mixed in accordance to LST EN 206 [23] using dry materials The concrete mixtures were prepared in the laboratory using a forced type Pemat Mischtechnik GmbH (Freisbach Germany) The process of mixing was divided in two stages First the Portland cement fine and coarse aggregates and 23 of the water were
Buildings 2021 11 2 5 of 18
mixed for about 2 min At a second stage the remaining amount of water was added and the fresh concrete was mixed for 1 min
The slump of fresh concrete was determined in accordance to the standard LST EN 12350-2 [24] the density of the fresh concrete in accordance to LST EN 12350-6 [25] and air content of the compacted fresh concrete in accordance to LST EN 12350-7 [26]
Figure 1 The final aggregate mixture (AM) granulometric composition when the CA content in the AM changes from 22 to 52
The rheological behaviour of ordinary concrete can be described with reference to the Bingham model fluids and with reference to the main rheological propertiesndashyield stress (τ0) and viscosity (η) [82728] The Bingham model is described in Equation (1)
120591120591 = 1205911205910 + 120578120578 ∙ 120574120574 (1)
Here τmdashthe shear stress of concrete Pa τ0mdashthe yield stress of concrete Pa ηmdashthe viscosity of concrete Pamiddots and γmdashthe share rate 1s
The technological properties of the concrete mixture are related to its rheological properties and therefore it is easier to establish the yield stress of the concrete from its slump and density The yield stress of concrete mixtures was evaluated using Equation (2) and was also adopted by other authors in their research [29ndash32]
1205911205910 =000815 ∙ 120588120588119898119898
049830 minus 119878119878119878119878 minus 0001724 minus 0024
2 (2)
Here 120588120588119898119898 density of the concrete mixture kgm3 SLmdashthe slump of the concrete mixture cm
The plastic viscosity of the concrete mixture was evaluated using Equation (3) which was also adopted by other authors in their research [28293132]
120578120578 = 120578120578119908119908 ∙ 119890119890119890119890119890119890 119886119886119888119888 ∙ 120588120588119908119908
120588120588119908119908 ∙119882119882119862119862 ∙ 120588120588119888119888 minus 119887119887119888119888 ∙ 120588120588119908119908
+1198861198861198911198911198911198911minus120593120593119888119888119888119888minus120593120593119890119890119888119888minus
119882119882120588120588119908119908
minus 119862119862120588120588119888119888
1 minus 120593120593119888119888119891119891 minus 119887119887119891119891119891119891 1 minus 120593120593119888119888119891119891 minus 120593120593119890119890119891119891 minus119882119882120588120588119908119908
minus 119862119862120588120588119888119888
+119886119886119888119888119891119891 + 120593120593119888119888119891119891
1 minus 119887119887119888119888119891119891 minus 120593120593119888119888119891119891 ∙ 119870119870119891119891119886119886119898119898 (3)
Here ηwmdashthe viscosity of water Pas φeamdashthe amount of entrapped air in fresh concrete W Cmdashthe content of water and cement in concrete mixture (the amount of materials per m3) kg ρw ρcmdashthe densities value of water and cement kgm3 φcamdashthe volume concentration of gravel (416 fraction) in concrete mixture ac afa acmdashthe form of cement sand (01 and 04 fraction) and gravel (416 fraction) particles describing factors (ac = 26
Buildings 2021 11 2 6 of 18
afa = 25 aca = 26) according to their angularity bc bfa bcamdashthe density distribution of cement (bc = 1287) sand of size 0ndash1 mm (bfa = 1193 divide 1226) sand of size 0-4 mm (bfa = 1236 divide 1212) and gravel of size 416 mm (bca = 1236) describing factors in cement paste mortar and concrete mixture respectively The coefficient of correction Kadm describes the influence of the admixture on the plastic viscosity of the concrete mixture The coefficient was calculated as a ratio of cement paste viscosity values obtained without and with admixtures For superplastisicer based on polycarboxylic ether polymers it was equal to 0085
In this study the relationship between the interface parameters and the interface friction was analysed using the BTRHEOM tribometer (Figure 2) Several authors have validated this kind of tribometer through their research [33ndash36] A fifteen-litre concrete sample is placed in the hollow cylindrical container and is sheared between two coaxial cylinders The internal cylinder is rotated at different speeds
Ω
Figure 2 Principal working scheme of BTRHEOM tribometer
The behaviour of the concrete-steel wall interface is described through the following model in Equation (4) [11]
120591120591 = 1205911205910119894119894 + 120578120578119894119894 ∙ 119881119881 (4)
where τmdashthe shear stress of the interface Pa τ0imdashthe yield stress of the interface Pa ηimdashthe viscous constant of the interface Pamiddotsm and Vmdashthe relative velocity of slip ms
The raw output of the test appears as a torquendashrotation speed diagram Two scenarios can be assessed a) the sample is kept still during the test and shearing is localised at the concrete-steel interface b) the rotation velocity is high enough so that a part of the concrete begins to be sheared An equation linking the torque and the rotation speed corresponds to each of these scenarios These rheological properties refer to the concrete type for the scenario which are obtained at the time of testing The tribological parameters (the yield stress and the viscous constant of the interface) were calculated from the raw experimental data (torquendashrotation speed diagram) using ADRHEO software The tribometer used has the following characteristics fixed tank with an internal diameter of 350 mm and 200 mm height rotary cylinder with 150 mm diameter and 200 mm height mass of the device 79 kg precision of measured data yield stress of the interface about plusmn18 and viscous constant of the interface about plusmn7 (with a confidence level of 95 for the two parameters)
The surface roughness parameters of the rotary steel cylinder steel column formworks and steel composite columns were determined using a roughness gauge the Tesa Rugosurf 20 The Rugosurf software displays surface roughness profile bearing area
Buildings 2021 11 2 7 of 18
curve (Abbott) and the basic parameters of roughness arithmetical mean height value (Ra) which indicates the average of the absolute value along the sampling length root mean square deviation value (Rq) which indicates the root mean square along the sampling length maximum height value (Rt) of the profile which indicates the absolute vertical distance between the maximum profile peak height and the maximum profile valley depth along the sampling length mean height value (Rc) of profile elements which indicates the average value of the height of the curved element along the sampling length Surface roughness measurement methods include the linear roughness measurement which consists of a measurement of a single line on the sample surface The main component of the equipment is a measuring tip with a diamond needle (with a tip radius of 5 μm) This needle is held in contact with the tested surface and pulled in one direction registering all irregularities of the tested surface through a vertical movement with respect to the test surface The maximum vertical movement distance is 400 μm and the surface irregularity recording resolution is 0001 μm A single measurement length is 125 mm (25 mm times 5) Surface roughness was determined in accordance to LST EN ISO 4287 [37]
3 Results and Discussion 31 Effect of Coarse Aggregate Content on Concrete-Steel Wall Interface
The technological properties of the tested concrete mixture series are presented in Table 2 We can see that with the change of CA content (gravel 4ndash16 mm) from 22 to 52 the slump value of the fresh concrete mixtures increased from 30 to 230 mm the air content in fresh concrete mixtures decreased from 79 to 16 and the density values of fresh concrete increased from 2180 to 2400 kgm3 While the CA content in the AM increased the content of sand decreased accordingly
With an increase in the CA content and decreasing fine aggregate (FAmdashsand fraction 04 and 01) content in the AM the surface area of the aggregate particles decreases This means that to coat the surface of the aggregate less cement paste is needed and as a result the workability of the concrete mixture increases due to the extra cement paste in the mix The extra content of cement paste increases the slump of the concrete mixtures The entrapped air content in fresh concrete and density of fresh concrete mixtures depend on the distribution density and surface area of the solid particles in the concrete mixtures [38] By increasing the CA content in the constant AM volume the air content in the cement paste decreases This has an effect on the increment of air content and on the reduction in density of the tested concrete mixture series
The measurement of the interface friction between the concrete and the rotary steel cylinder using the tribometer allows for the determination of the interface parameters Before testing of the concrete-steel wall interface parameters using the BTRHEOM tribometer input data are required for the rheological properties of the fresh concrete mixtures The yield stress and viscosity of the mixtures were determined with reference to equations Equations (2) and (3) Results are given in Table 3
Changes in the CA content in the AM affect the yield stress and viscosity of the fresh concrete When the content of gravel fraction 416 in the AM increases from 22 to 52 (the FA content decreases from 78 to 48) the yield stress and the viscosity of the mixture decrease Therefore the water and cement paste content requirements for concrete change due to changes in the specific surface of the CA Water and cement quantities during concrete preparation are constant Due to the reduced surface area of FA particles CA particles require less paste to reach a given consistency When less cement paste is required to fill the space between CA particles the extra cement paste reduces the friction between aggregates Particles with a nearly spherical shape and a smooth surface texture contribute to less friction between the coarse aggregate and result in a more workable concrete as reported by Kurokawa et al [39] It means that these factors contribute towards a decrease in the yield stress and viscosity (Table 3) Hu and Wang [40] have
Buildings 2021 11 2 8 of 18
shown that larger size aggregate generally results in concrete with lower yield stress and viscosity
Table 3 Rheological and tribological properties for tested concrete mixtures series
Marking
Calculated Input Data Output Data from the Tribometer
First Series Second Series
Yield Stress (Pa)
Viscosity (Pas)
Coefficient of
Correlation (r)
Yield Stress of
the Interface
(Pa)
Viscous Constant
of the Interface (Pasm)
Coefficient of
Correlation (r)
Yield Stress of
the Interface
(Pa)
Viscous Constant of the Interface (Pasm)
CM22 727 5484 09951 28 44 09994 26 41 CM32 621 847 09976 19 45 09969 21 43 CM37 520 300 09923 28 34 09794 30 28 CM42 476 346 09969 28 38 09904 29 32 CM47 350 200 09950 25 28 09708 35 18 CM52 292 214 09960 25 24 09951 29 18
The calculated rheological properties were used as input data for the determination of the interface friction using tribometer Figure 3 presents the evolution of the torques with the rotational speed while the CA content in the AM changes from 22 to 52 The curves represent the data of the series with a higher correlation coefficient value through linear regression analysis (Table 3) With the increase in rotation speeds the torques corresponding to different content of CA in the AM increases linearly The decrease in the slopes of the torque-speed curves (from 21deg to 7deg) demonstrate that the interface friction decreases when the CA content in the AM increases This allows for an improvement of the properties of the lubrication layer at the concrete-steel interface The interface friction corresponding to the CA content in AM of 52 is the lowest when compared to those of the other tested concrete mix compositions
(a) (b)
Figure 3 Evolution of the torque with the rotation speed while the CA content in the AM changes from 22 to 52 (a) partial shearing of the concrete (b) shearing was localised at the concrete steel interface
During the testing stage two scenarios were observed with respect to the shearing zone (Figure 4) a) the rotation velocity was high enough resulting in partial shearing of the concrete mix with 22 CA content in the AM b) the concrete mix sample with a CA content in the AM of 32ndash52 was kept still during the test and shearing was localised at
Buildings 2021 11 2 9 of 18
the concrete-steel interface Due to partial shearing of the concrete (Figure 4a) the concrete mix with the CA content in the AM of 22 does not have an impact on lubrication layer and was not used any further for comparisons
(a) (b)
Figure 4 The scenarios observed during testing (a) partial shearing of concrete (b) shearing was localised at the concrete steel interface
The yield stress and the viscous constant of the interface values from the torques-rotation speed diagram were calculated using the ADRHEO software during testing Results are presented in Table 3 and Figure 5 The yield stress and viscous constant of the interface describe properties of the lubrication layer When concrete is being tested using the tribometer the lubrication layer is formed at the interface between the concrete mix and the rotary cylinder wall The flow of fresh concrete close to the wall depends on the lubrication layer properties and the wall surface roughness parameters The relationship between the yield stress of the interface and the yield stress of concrete when the CA content in the AM changes from 32 to 52 is presented in Figure 4 It can be noted that changes in the CA content in the AM from 32 to 52 have minimal effects on the yield stress of the interface while the yield stress of concrete is decreasing significantly
Figure 5 Relationship between the yield stress of the interface and the yield stress when the CA content in the AM changes from 32 to 52
Variations in the yield stress of the interface with respect to the fresh concrete slump are presented in Figure 6 Results show that the increase in the CA content in the AM from
Buildings 2021 11 2 10 of 18
32 to 52 results in an increase in concrete slump and has minimal effect on the yield stress of the interface
Figure 6 Relationship between yield stress of the interface and the yield stress when consistency in the slump changes from 50 to 230 mm
Figure 5 shows that in the curve there is a point at 42 of CA content in the AM with the yield stress of the interface values decreasing on either side The yield stress of the interface increases slightly with an increase in the CA content in AM from 32 to 42 until this point is reached After that the yield stress of the interface decreases slightly with an increase in the CA content in AM from 42 to 52 Figure 6 shows there is also a point at 170 mm (Table 2) the slump value when the CA content in the AM is about 42 for which the yield stress of the interface values decreases on either side It can be noted that changes in the CA content in the AM from 32 to 52 are not sufficient to contribute significantly on the yield stress of the interface
The relationship between the viscous constant of the interface and the viscosity of concrete when the CA content in the AM changes from 32 to 52 is presented in Figure 7 It can be noted that an increase in CA content in the AM from 32 to 52 slightly decreases the viscous constant of the interface and significantly decreases the viscosity of fresh concrete
Figure 7 Relationship between the viscous constant of the interface and the viscosity of concrete when the CA content in the AM changes from 32 to 52
Buildings 2021 11 2 11 of 18
The decrease in the viscous constant with increase in the CA content can be associated with the decrease in the fineness of the FA and increase in extra content of cement paste which is necessary to cover sand particles The decrease in the specific surface of FA at a constant water content in the concrete mixture should increase the rheologically effective water [41] The increase in cement paste content and rheologically effective water reduces friction between the nearly spherical shaped and smooth surface textured aggregate particles (gravel fraction 416) and also reduces the viscous constant of the lubrication layer During the concrete mixture preparation the superplasticiser used allows the finest particles of the mixture to deflocculate and reduce the viscosity of concrete mixture This modification also has an impact on a reduction in the viscous constant of the interface In other words the growth of a ratio of cement paste volume to total aggregate volume including fine and coarse aggregate results in a decrease in viscous constant of the lubrication layer which is formed at the interface between the concrete and the wall of the rotary cylinder This means that the same effect results also in the lubrication layer which is formed at the interface between the concrete and the wall of steel form-lining or steel composite columns Choi et al [42] concluded that the particle shape of concrete constituents ie gravel and sand significantly influences the rheological properties of the lubrication layer as well as the concrete itself
The influence of CA content in the AM on the concrete-steel wall interface parameters using the tribometer showed that changes of the CA content in the AM from 42 to 52 had minimal effects on the yield stress of the interface and resulted in a decrease in the viscous constant of the interface while slump values varied in the range from 170 to 230 mm It means that the CA content in the AM from 42 to 52 is practical to reduce interface friction at the steel-concrete interface due to variations in the composition of the lubrication layer
32 Effect of Surface Roughness Parameters on ConcretendashSteel Wall Interface The surface roughness analysis of the rotary cylinder is required in order to
investigate the interface friction between the concrete and the wall of the cylinder A portable roughness gauge Tesa Rugosurf 20 was used for the measurement of roughness along the length of the rotary steel cylinder of the tribometer In addition measurements were performed at three different locations by rotating the cylinder at 120 degrees The arithmetical mean height value (Ra) of the vertical deviation from the mean line through the profile varied in the range from 236 to 297 μm and the distance between the highest asperities and the lowest valleys (Rt) through the profile varied in the range from 1710 to 2874 μm It can be noted that the profile is homogeneous The basic roughness parameters and roughness profiles are presented in Table 4 with respect to three measurements
In order to compare the known roughness parameters of the rotary cylinder to the roughness parameters of the chosen metal form-lining and steel composite column additional measurements were performed Worn metal form-lining and new metal form-lining were analysed in order to understand the effect of the friction process on the evolution of surface roughness The metal form-lining is used as column formwork in construction The surface irregularities of the worn metal form-lining are formed by the concrete mixture friction process at the concrete-steel wall interface The mentioned surface irregularities depend on the number of repeated uses of the metal form-linings for concrete on construction sites The wearing of metal form-lining was due to friction when casting the concrete to outdoor storage to transporting to lifting to cleaning Samples of formwork were provided by the supplier of formwork and scaffolding in Lithuania UAB ldquoPeri Lietuvardquo The measurement of formwork surface roughness parameters of the new and worn metal form-lining were performed at KTU laboratory Cold welded steel tubes having different diameters and inner surface roughness were analysed The surface irregularities of the steel tubes are created through machining and sandblasting process Measurements of composite steel column surface roughness parameters were performed
Buildings 2021 11 2 12 of 18
at the steel construction plant UAB bdquoPeikko Lietuvaldquo as presented in Figure 8 and the measured steel surface roughness parameters are presented in Table 4
(a) (b)
(c) (d)
(e) (f)
(g)
Figure 8 Measurement of roughness rotary steel cylinder (a) new metal form-lining (b) used metal form-lining (c) steel composite column No1 (d) steel composite column No2 (e) steel composite column No3 (f) steel composite column No4 (g)
Buildings 2021 11 2 13 of 18
Table 4 Measured steel surface roughness parameters
The basic Parameters of Roughness Roughness Profile Rotary Steel Cylinder
New Metal Form-Lining
Worn Metal Form-Lining
Steel Composite Column No1
Steel Composite Column No2
Buildings 2021 11 2 14 of 18
Steel Composite Column No3
Steel Composite Column No4
The roughness profiles and basic roughness parameters of new and worn metal form-lining and of different types of composite columns (No1ndashNo4) are presented in Table 4 When comparing the results of metal form-lining surface roughness it is noted that the Rt values of the used metal form-lining varied in the range from 2460 to 4498 μm and are higher than the Rt values (from 473 to 1880 μm) recorded for new metal form-lining while the Rt values of the rotary cylinder wall varied in the range from 1710 to 2874 μm When comparing the results of the steel composite columnsrsquo surface roughness it is noted that Ra values ranging from 088 to 857 μm and Rt values ranging from 1195 to 5335 μm were determined As expected asperities peaks of the obtained roughness profile (Rt) are higher for the worn metal form-lining and for the steel columns with inner surface which was in part covered in rust (steel composite column No 3) Kubiak and Mathia [43] concluded that initial surface roughness can have significant influence on friction and wear processes in tribological contacts under fretting conditions The degradation of material during the friction process rapidly changes the roughness in tribological contact After an initial period of rapid degradation the condition of the interface will stabilise
Buildings 2021 11 2 15 of 18
and the increase in roughness is much slower [44] The wall wearing process depends on such parameters as production flow rate entrained solid rate in the production fluid fluid properties flow regime solid particle properties particle geometry and wall material of the equipment and geometry of the equipment [45]
The influence of CA content in the AM on the concrete-steel wall interface parameters using the tribometer when roughness Rt values of the steel rotary cylinder varied in the range from 1710 to 2874 μm showed that changes of the CA content in the AM from 42 to 52 had minimal effects on the yield stress of the interface and resulted in a decrease in the viscous constant of the interface The comparison of surface roughness between steel rotary cylinder metal form-lining and different types of steel composite columns showed that the maximum profile peak height and the maximum profile valley depth along the sampling length (Rt) values varied in approximately the same rangendash1500 to 3000 μm except for the worn metal form-lining and the steel tubes with inner surface which were in part covered in rust where the determined Rt values are higher It can be noted that the CA content in AM and the wall roughness result in a decrease in the interface friction for the tested concrete mixtures The hypothesis is based on the principle that a sufficient lubrication layer can be created with the required thickness of fine mortar at the interface between the concrete and the metal form-lining or steel composite column walls when the CA content in the AM varies in the range from 42 to 52 and the wall roughness parameters (Rt) of these elements varies in the range from 1500 to 3000 μm This is especially relevant for the metal form-lining or steel composite columns when formworks are filled using concrete on site The concrete moves through the steel surface of such elements by flowing over a lubrication layer of fine mortar which forms close to the wall of the relevant element Surface roughness can influence the level of concrete friction on the surface of the metal form-lining or the composite column requiring further assessment Due to the roughness of the relevant element surfaces the contact between two solids ie concrete mix constituents and the steel wall takes place first on asperity peaks The Rt value of the profile indicates the absolute vertical distance between the maximum profile peak height and the maximum profile valley depth along the sampling length It is important to know the value of parameter Rt for determining whether the constituent concrete grains are in fact capable of lodging inside the slight asperities [46] When the concrete mix constituents or grains lodge in the slight asperities the friction at the concrete-steel interface changes With the increase in the CA content there is a decrease in FA in AM Due to a lack of FA particles in the AM there is a decrease in the specific surface of the FA and a lower content of cement paste is needed to coat the coarse aggregate particles The extra content of cement paste should have a positive effect on the reduction in interface friction between concrete and the steel wall with cement paste particles lodging inside the slight asperities Such grains are mainly found in cement and fine sand It was noticed that the worn metal form-lining and the steel composite column with the inner surface that was in part covered in rust have higher Rt values This means that in such conditions not only cement paste particles but also fine sand particles can be lodging inside the asperities
When proportioning concrete mixes and determining the mix composition the rheological and tribological parameters can be controlled Due to the growth of the ratio of cement paste volume to total aggregate volume including fine and coarse aggregate and the rheologically effective amount of water the required values of the lubrication layer which are necessary for effective decrease of interface friction in the case of different surface conditions can be determined On the basis of the research results the hypothesis is based on the principle that a sufficient lubrication layer will be created with the required thickness of fine mortar at the interface between the concrete and the wall of metal form-lining or steel composite column when the CA content in the AM varies in the range from 42 and 52 and the wall roughness parameters (Rt) of these elements varied in the range from 1500 to 3000 μm It allows for the prediction of the interface friction variation
Buildings 2021 11 2 16 of 18
through the changes in the lubrication layer composition with variation in concrete mix proportions
4 Conclusions According to the results of this experimental investigation various key observations
can be made with reference to the influence of CA content on the concrete-steel wall interface parameters using the tribometer The following main conclusions were drawn
1 Changes of the CA content in the AM from 42 to 52 had minimal effect on the yield stress of the interface and a decrease in the viscous constant of the interface as measured with a tribometer when Rt values of the rotary cylinder wall were in the range from 1710 to 2874 μm Changes of the CA content in the AM from 42 to 52 decrease the viscosity of concrete while the yield stress of concrete decreased significantly as calculated with the chosen equations
2 The comparison of surface roughness between steel rotary cylinder metal form-lining and different types of steel composite columns showed that the maximum profile peak height and the maximum profile valley depth along the sampling length (Rt) values varied in the approximately the same range from 1500 to 3000 μm except for worn metal form-lining and the steel tubes with inner surface which was in part covered in rust where the Rt values determined were higher The value of parameter Rt allows for the determination of whether the constituent concrete grains such as cement particle and fine sand particle are in fact capable of lodging inside the asperities and therefore reducing interface friction at the concrete-steel interface
3 On the basis of the research results the hypothesis is based on the principle that a sufficient lubrication layer can be created with the required thickness of fine mortar at the interface between the concrete and the metal form-lining or steel composite column wall when the CA content in the AM varies in the range from 42 to 52 and the wall roughness parameters (Rt) of these elements varies in the range from 1500 to 3000 μm It allows the prediction of the interface friction variation with changes in the lubrication layer as a result of variations in the concrete mix composition
This research based on an experimental investigation provides for an understanding of interface friction at the concrete-steel walls with variations in the coarse aggregate (CA) content in the aggregate mixture (AM) in concrete mixes
Author Contributions Conceptualization AR and MD methodology AR MD and SJ software SJ validation SJ formal analysis RPB investigation AR MD and SJ resources AR and MD data curation MD and RPB writingmdashoriginal draft preparation AR and MD writingmdashreview and editing MD and RPB visualization AR and SJ supervision MD All authors have read and agreed to the published version of the manuscript
Funding This research received no external funding
Institutional Review Board Statement ldquoNot applicablerdquo for studies not involving humans or animals
Informed Consent Statement ldquoNot applicablerdquo for studies not involving humans
Data Availability Statement Data is contained within the article or supplementary material
Acknowledgments The authors would like to express their gratitude to JSC Peikko Lietuvaldquo and JSC Peri Lietuvaldquo for their technical support
Conflicts of Interest The authors declare no conflict of interest
References 1 Tattersall GH Banfill PFG The Rheology of Fresh Concrete San Francisco USA 1983 p 356 2 Bartos P Fresh Concrete Properties and Tests AmsterdamUK 1992 305 p
Buildings 2021 11 2 17 of 18
3 Kaplan D Pompage des Betons Etudes des recherches des laboratoires des Ponts et Chausseacutees Paris France 2001 p 227 httpswwwifsttarfrfileadminuser_uploadeditionslcpcERLPCERLPC-OA-LCPC-OA36pdf (accessed on 18 October 2016)
4 Secrieru E Khodor J Schroumlfl C Mechtcherine V Formation of lubricating layer and flow type during pumping of cement-based materials Constr Build Mater 2018 178 507ndash517 doi101016jconbuildmat201805118
5 Eckardstein KEV Pumping Concrete and Concrete PumpsmdashA Concrete Placing Manual Schwing Herne Germany 1983 p 133
6 Feys D Khayat KH Perez-Schell A Khatib R Development of a tribometer to characterize lubrication layer properties of self-consolidating concrete Cem Concr Comp 2014 54 40ndash52 doi101016jcemconcomp201405008
7 Secrieru E Fataei SH Schroumlfl CH Mechtcherine V Study on concrete pumpability combining different laboratory tools and linkage to rheology Constr Build Mater 2017 144 451ndash461 doi101016jconbuildmat201703199
8 Ngo TT Kadri EH Bennacer R Cussigh F Use of tribometer to estimate interface friction and concrete boundary layer composition during the fluid concrete pumping Constr Build Mater 2010 24 1253ndash1261 doi101016jconbuildmat200912010
9 Secrieru E Mechtcherine V Schroumlfl C Borin D Rheological characterisation and prediction of pumpability of strainhardening cement-based-composites (SHCC) with and without addition of superabsorbent polymers (SAP) at various temperatures Constr Build Mater 2016 112 581ndash594 doi101016jconbuildmat201602161
10 Vanhove Y Djelal C Magnin A A device for studying fresh concrete friction Cem Concr Aggr 2004 26 35ndash41 doi101520CCA11897
11 Djelal C Vanhove Y Magnin A Tribological behaviour of self compacting concrete Cem Concr Res 2004 34 821ndash828 doi101016jcemconres200309013
12 Djelal C De Caro P Libessart L Dubois I Comprehension of demoulding mechanisms at the formworkoilconcrete interface Mater Struct 2008 41 571ndash581 doi101617s11527-007-9268-3
13 Bouharoun S De Caro P Dubois I Djelal C Vanhove Y Effects of a superplasticizer on the properties of the concreteoilformwork interface Constr Build Mater 2013 47 1137ndash1144 doi101016jconbuildmat201305029
14 Ngo TT Kadri EH Cussigh F Bennacer R Duval R Practical Tribometer to Estimate Pumpability of Fresh Concrete J Asian Arch Buil Eng 2010 1 229ndash236
15 Djelal C Designing and testing of tribometer for the study of friction of a concentrated clay-water mixture against a metallic surface Mater Struct 2001 34 51ndash58 doi101016jconbuildmat2020119384
16 Ivkovic B Djurdjanovic M Stamenkovic D The Influence of the contact surface roughnesos on the static friction coefficient Tribol Indus 2000 22 41ndash44
17 Kwon SH Phung QT Park HY Kim JH Shah SP Effect of wall friction on variation of formwork pressure over time in self-consolidating concrete Cem Concr Res 2011 41 90ndash101 doi101016jcemconres201009009
18 Libessart L De Caro P Djelal C Dubois I Correlation between adhesion energy of release agents on the formwork and demoulding performances Constr Build Mater 2015 76 130ndash139 doi101016jconbuildmat201411061
19 Graubner CA Boska E Motzko C Proske T Dehn F Formwork pressure induced by highly flowable concretes ndash design approach and transfer into practice Struct Concr 2012 13 51ndash60 doi101002suco201100012
20 Arslan M Simsek O Subasi S Effects of formwork surface materials on concrete lateral pressure Constr Build Mater 2005 19 319ndash325 doi101016jconbuildmat200407007
21 LST EN 197-12000 Cement-Part 1 Composition Specifications and Conformity Criteria for Common Cements CEN (European Committee for Standardization) Brussels Belgium 2000
22 LST EN 126202003+A12008 Aggregates for Concrete CEN (European Committee for Standardization) Brussels Belgium 2008 23 LST EN 2062013+A12017 Concrete-Specification Performance Production and Conformity CEN (European Committee for
Standardization) Brussels Belgium 2017 24 LST EN 12350-22019 Testing Fresh Concrete Part 2 Slump-Test CEN (European Committee for Standardization) Brussels
Belgium 2019 25 LST EN 12350-62019 Testing Fresh Concrete Part 6 Density CEN (European Committee for Standardization) Brussels Belgium
2019 26 LST EN 12350-72019 Testing Fresh Concrete Part 7 Air ContentmdashPressure Methods CEN (European Committee for
Standardization) Brussels Belgium 2019 27 De Larrard F Sedran T Mixture-proportioning of high performance concrete Cem Concr Res 2002 32 1699ndash1704
doi101016S0008-8846(02)00861-X 28 Ngo TT Kadri EH Cussigh F Bennacer R Relationships between concrete composition and boundary layer composition
to optimise concrete pumpability Eur J Environ Civ Eng 2012 16 157ndash177 doi101080196481892012666910
Buildings 2021 11 2 18 of 18
29 Skripkiūnas G Optimization of Concrete Macrostructure According to Technological and Performance Properties and Raw Material Resources PhD Thesis Kaunas University of Technology Kaunas Lithuania 1993
30 Skripkiūnas G Properties and Structure of Construction Conglomerates Vitae Litera Kaunas Lithuania 2007 p 225 31 Klovas A Daukšys M The Influence of Admixtures on the Technological Properties of Fresh Concrete Mixture Mater Scien
2015 21 595ndash600 doi105755j01ms2145170 32 Daukšys M Klovas A Calculation of plastic viscosity of concrete mixture using the modified empirical formula IOP Conf
Ser Mater Sci Eng 2018 442 1ndash10 doi1010881757-899X4421012018 33 Klovas A The Influence of Concrete Mixture`s Rheological Properties on Formed Monolithic Concrete Surface Quality and Its
Evaluation PhD Thesis Kaunas University of Technology Kaunas Lithuania 2016 34 Hu C Rheacuteology des bEacutetons Fluides PhD Thesis Ecole Nationale des Ponts et Chausseacutees Paris France 1995 Available online
httpspastelarchives-ouvertesfrtel-00523283 (accessed on 8 October 2020) 35 Hu C De Larrard F The rheology of fresh high-peformance concrete Cem Concr Res 1996 26 283ndash294 doi1010160008-
8846(95)00213-8 36 Kaplan D Sedran T De Larrard F Vachon M Marchese G Forecasting Pumping Parameters In Proceedings of the 2nd
International RILEM Symposium on Self-Compacting Concrete Sanjo Tokyo on 23-25 October 2001 pp 555ndash564 37 LST EN ISO 42872007A12009 Geometrical Product Specifications (GPS)mdashSurface Texture Profile Method ndash Terms Definitions and
Surface Texture Parameters CEN (European Committee for Standardization) Brussels Belgium 2009 38 Daukšys M Skripkiūnas G Testing of rheological properties of concrete mixtures using a special vibroviscometer J Mater
Civ Eng 2018 30 1ndash8 doi101061(ASCE)MT1943-55330002281 39 Kurokawa Y Tanigawa Y Mori H Nishinosono K Analytical study on effect of volume fraction of coarse aggregate on
Binghamrsquos constants of fresh concrete T Jpn Concr I 1996 18 37ndash44 40 Hu J Wang K Effect of coarse aggregate characteristics on concrete rheology Constr Build Mater 2011 25 1196ndash1204
doi101016jconbuildmat201009035 41 Secrierua E Cotardo D Mechtcherine V Lohaus L Schroumlfl C Begemann C Changes in concrete properties during
pumping and formation of lubricating material under pressure Cem Concr Res 2018 108 129ndash139 doi101016jcemconres201803018
42 Choi MS Kim YJ Kwon SH Prediction on pipe flow of pumped concrete based on shear-induced particle migration Cem Concr Res 2013 52 216ndash224 doi101016jcemconres201307004
43 Kubiak KJ Mathia TG Influence of roughness on contact interface in fretting under dry and boundary lubricated sliding regimes Wear 2009 267 315ndash321 doi101016jwear200902011
44 Kubiak KJ Bigerelle M Mathia TG Dubois A Dubar L Dynamic Evolution of Interface Roughness During Friction and Wear Processes Scanning 2014 36 30ndash38 doi101002sca21082
45 Chen X McLaury BS Shirazi SA Effects of applying a stochastic rebound model in erosion prediction of elbows and plugged tee Available online httpsasmedigitalcollectionasmeorgFEDSMproceedings-abstractFEDSM200236169247296539 (accessed on 5 October 2020)
46 Vanhove Y Djelal C Friction mechanisms of fresh concrete under pressure I J Civ Eng Tech 2013 4 67ndash81
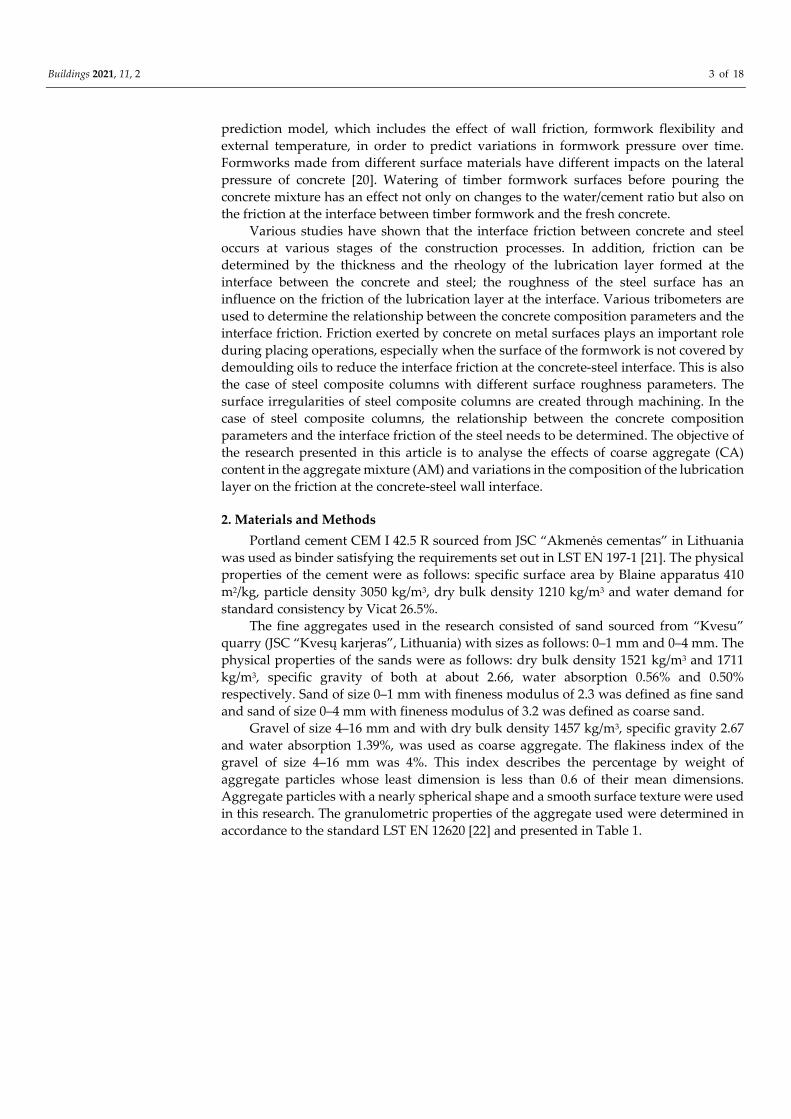
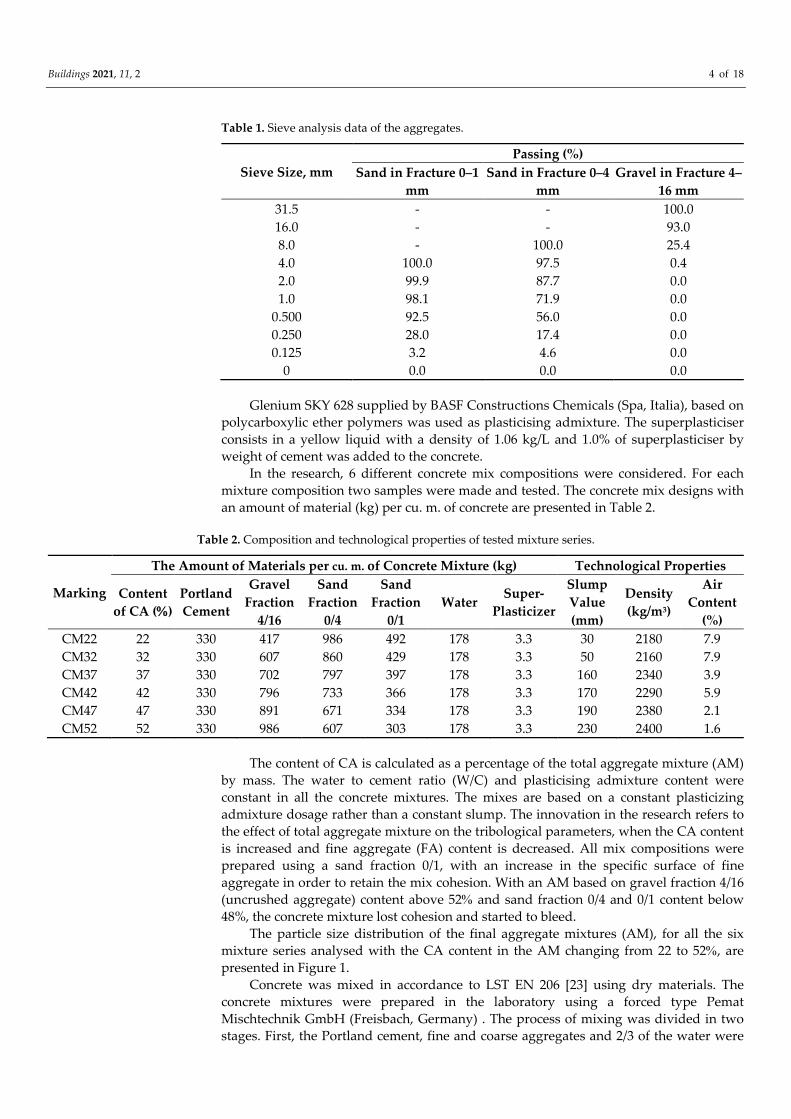
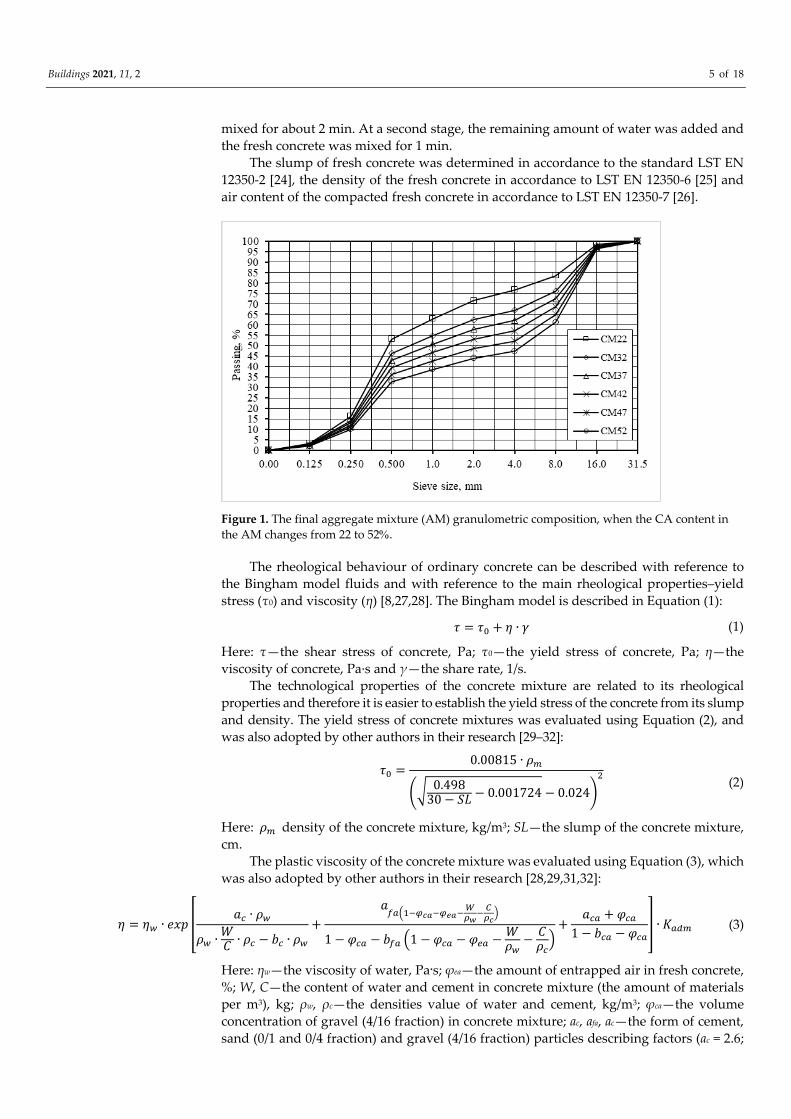
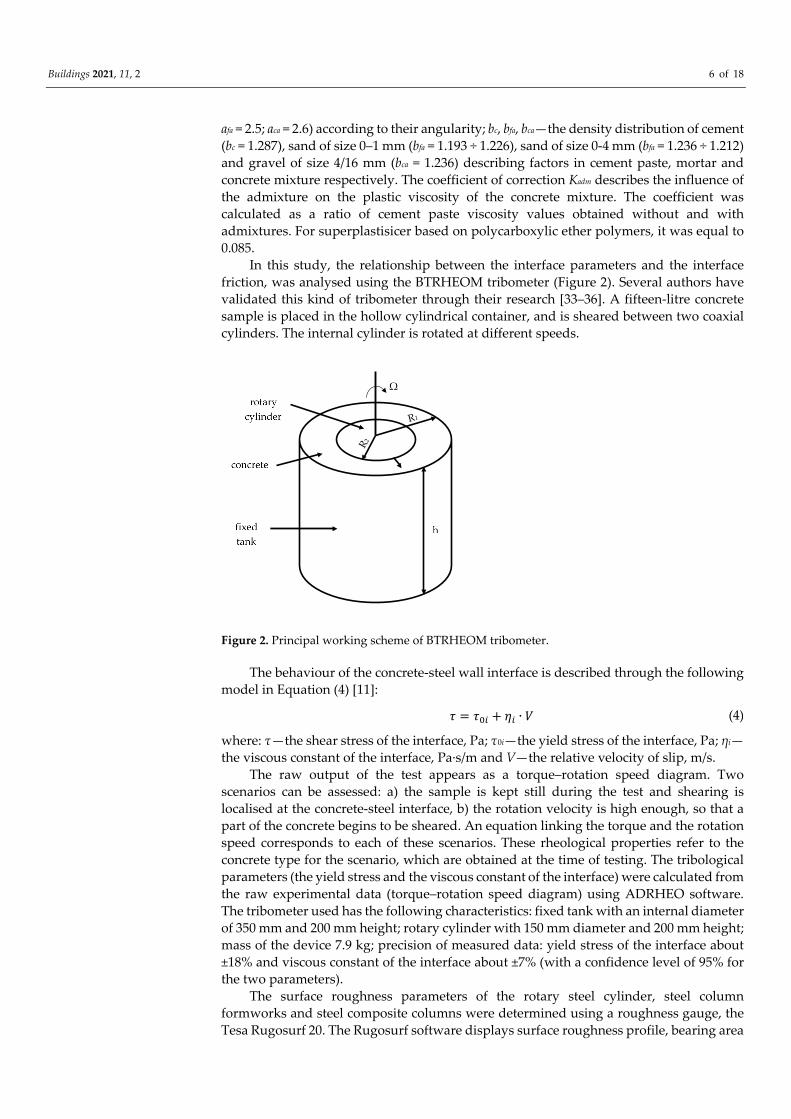
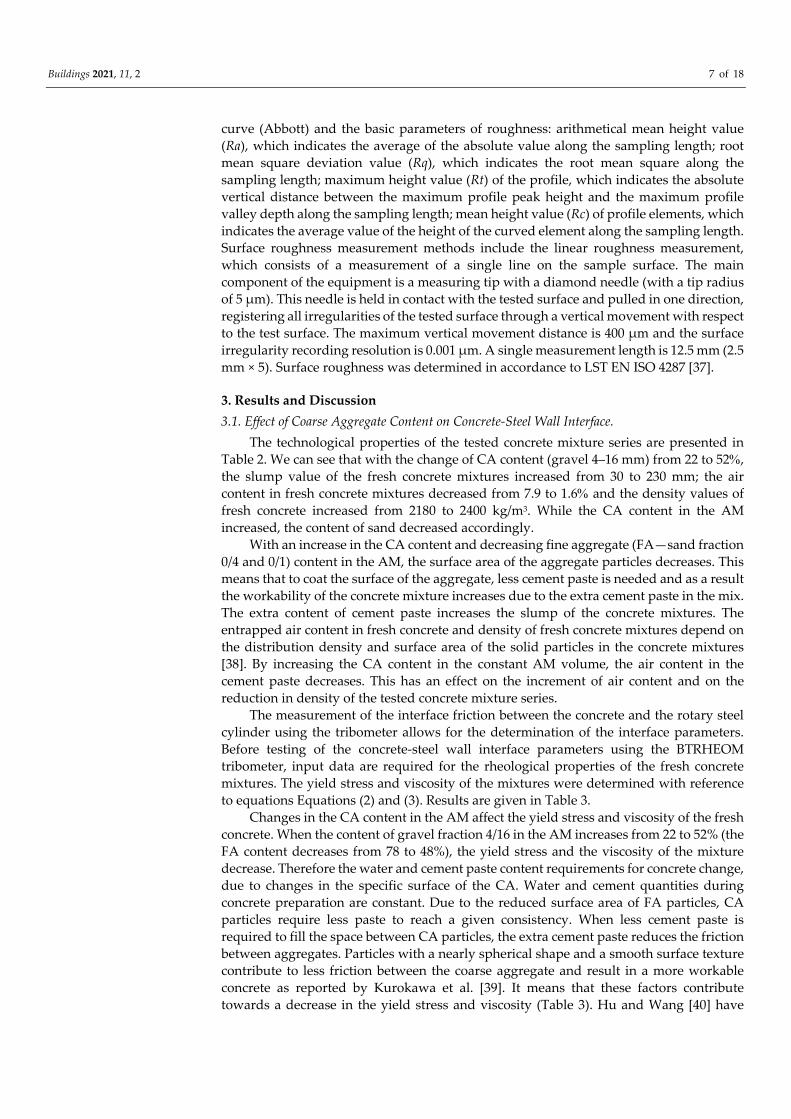
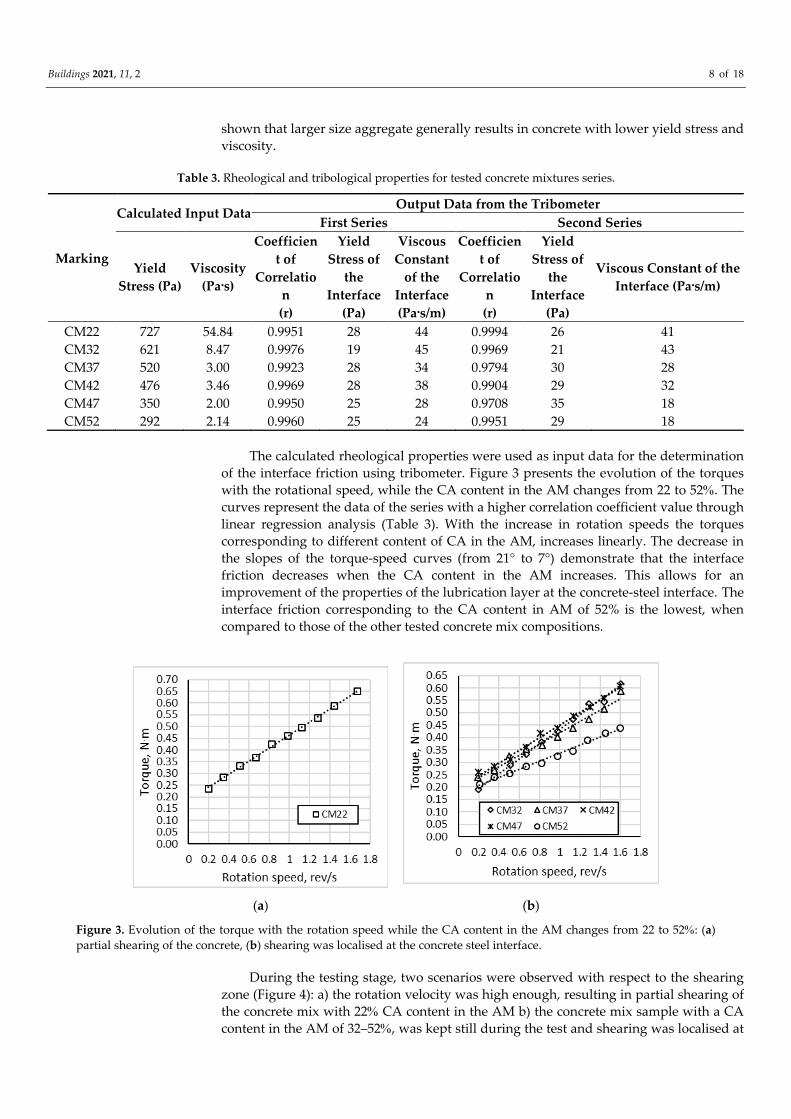
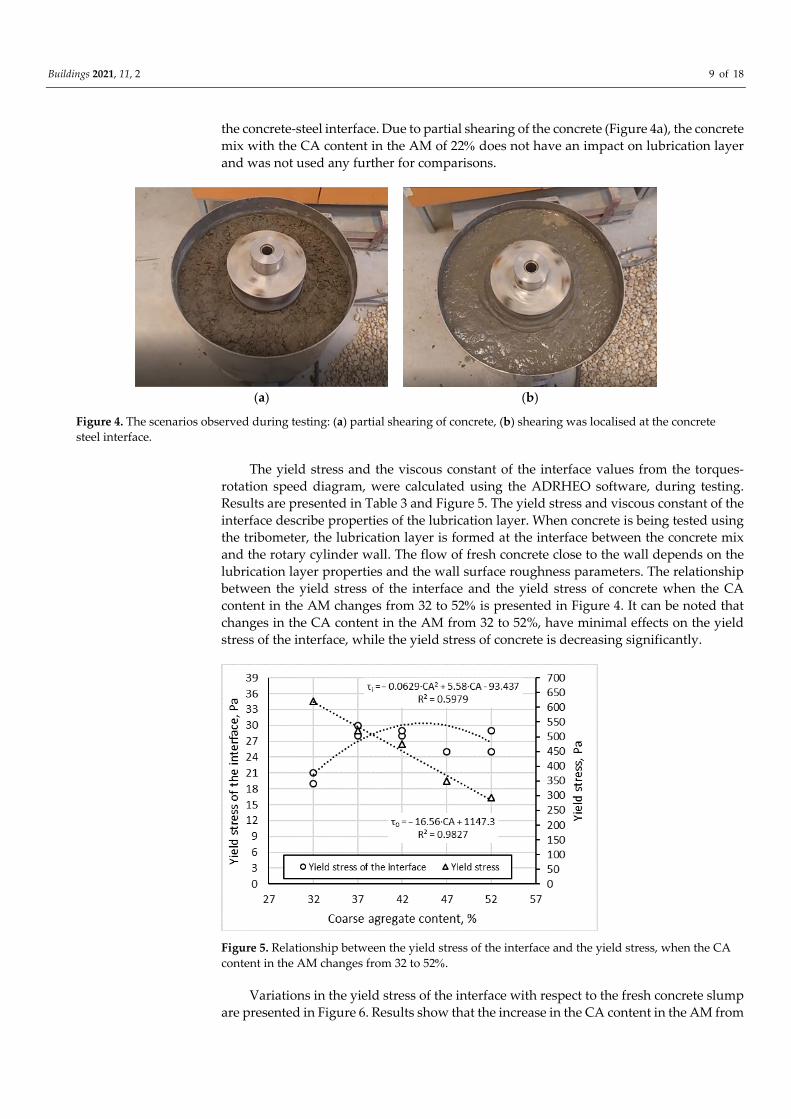
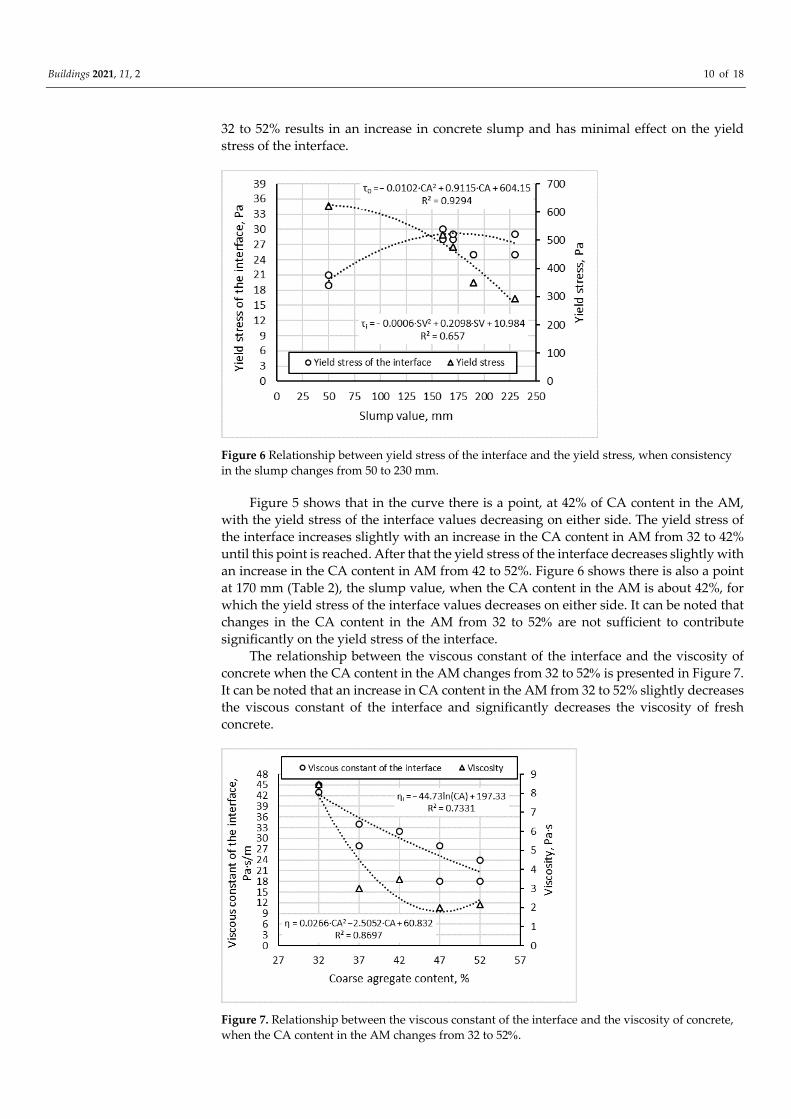
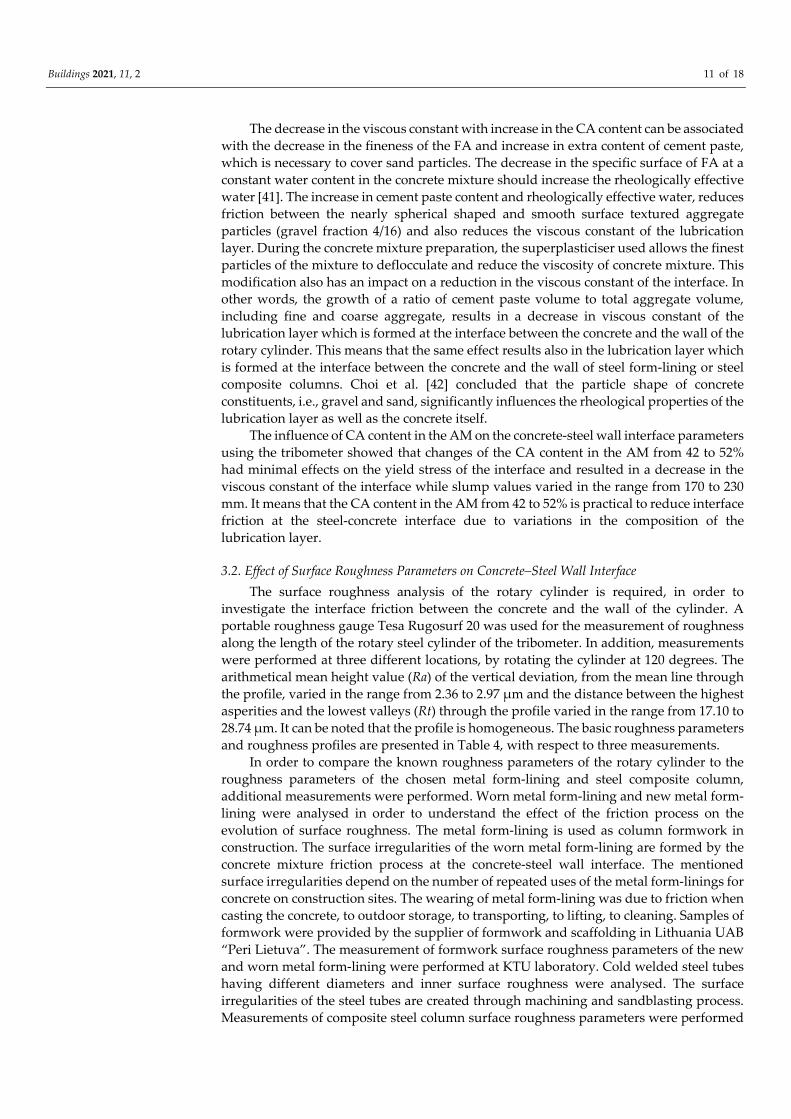
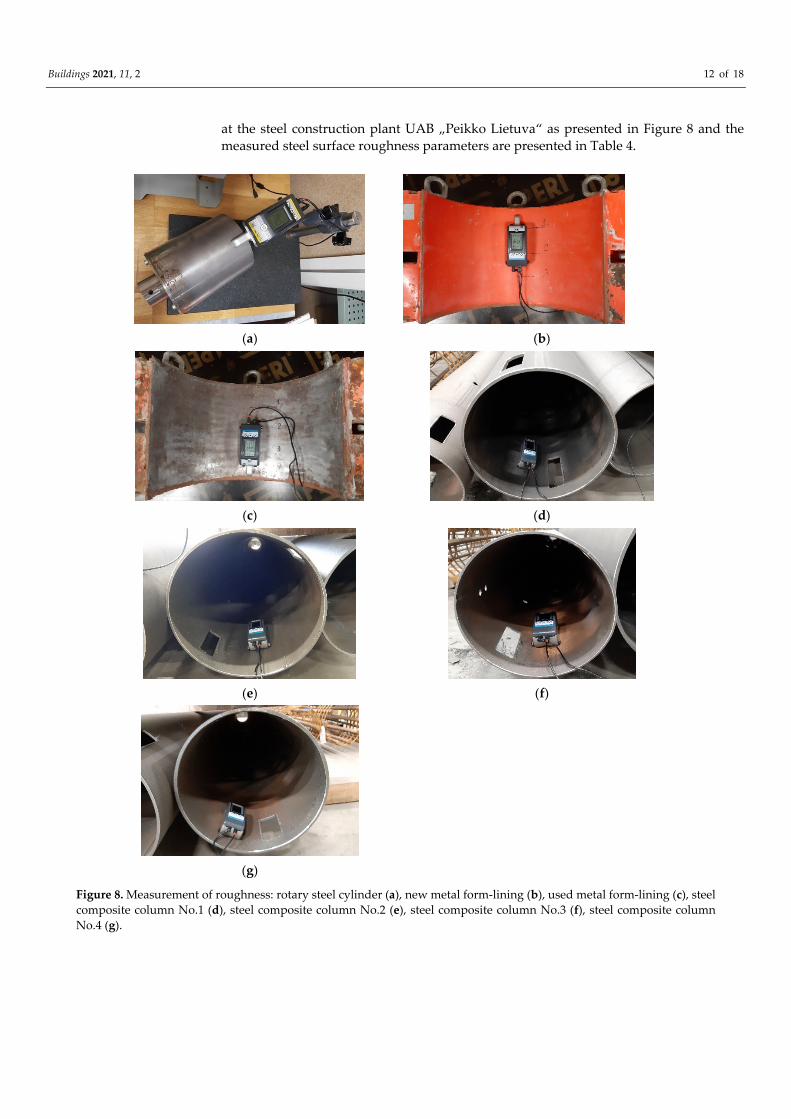
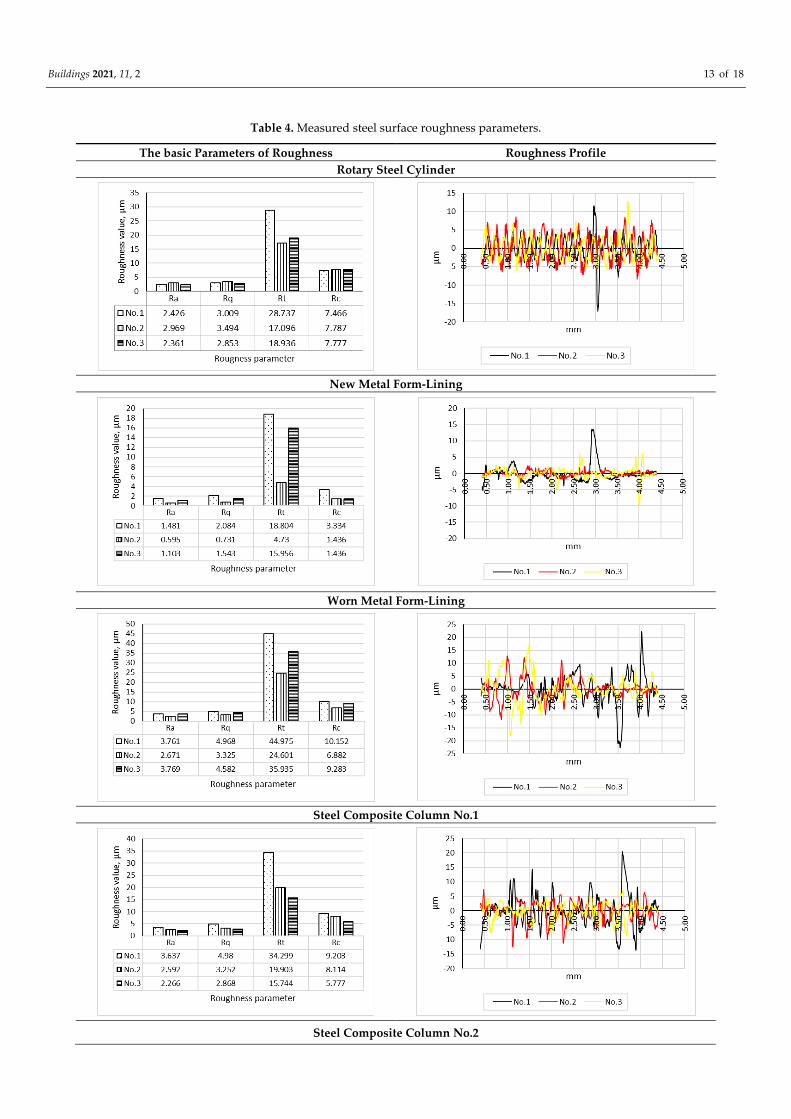
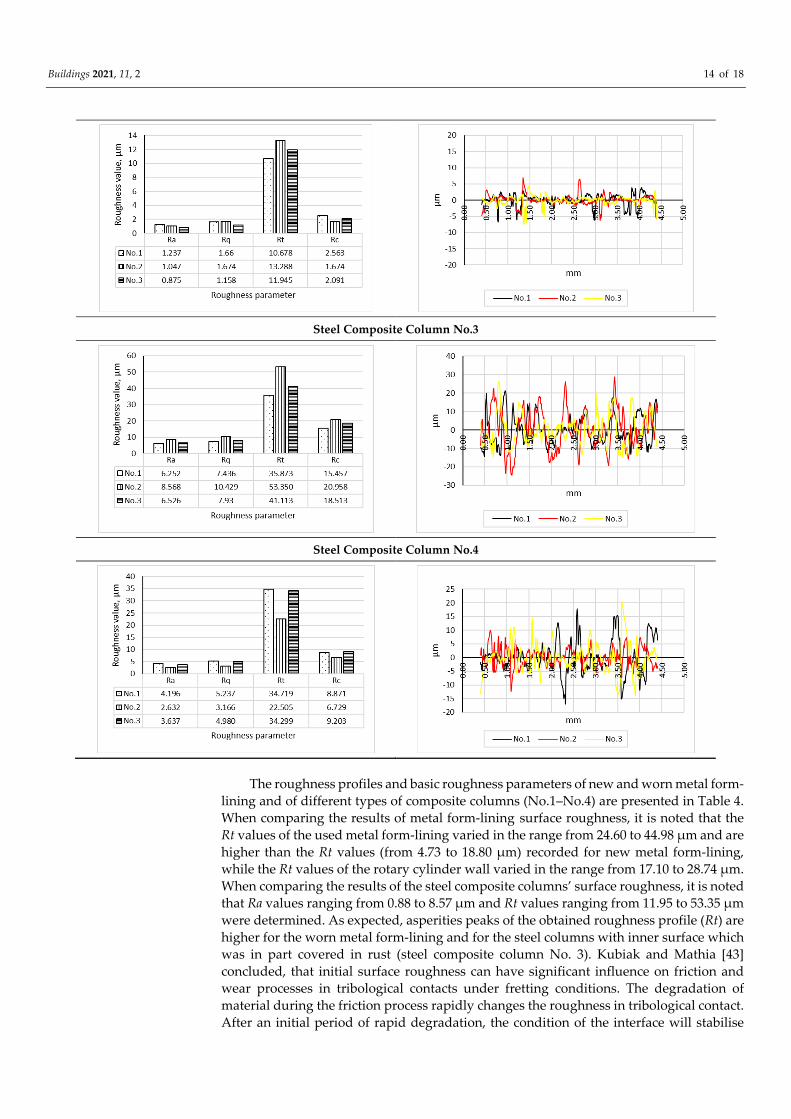
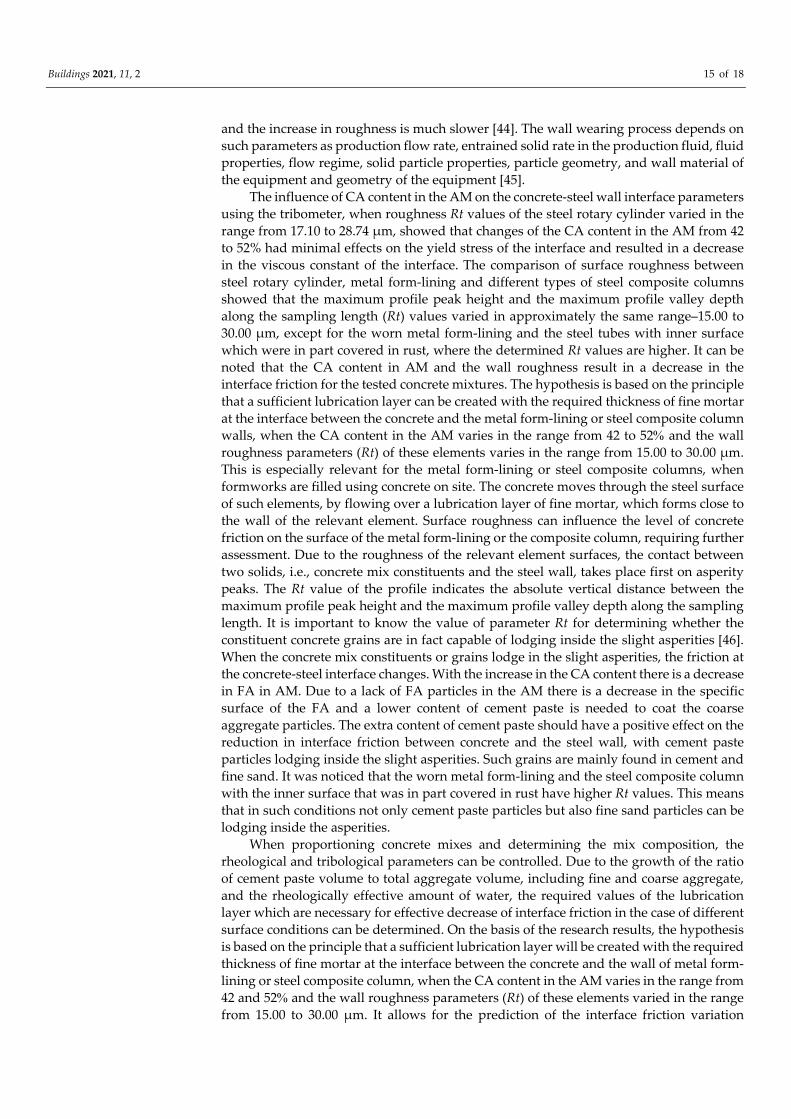
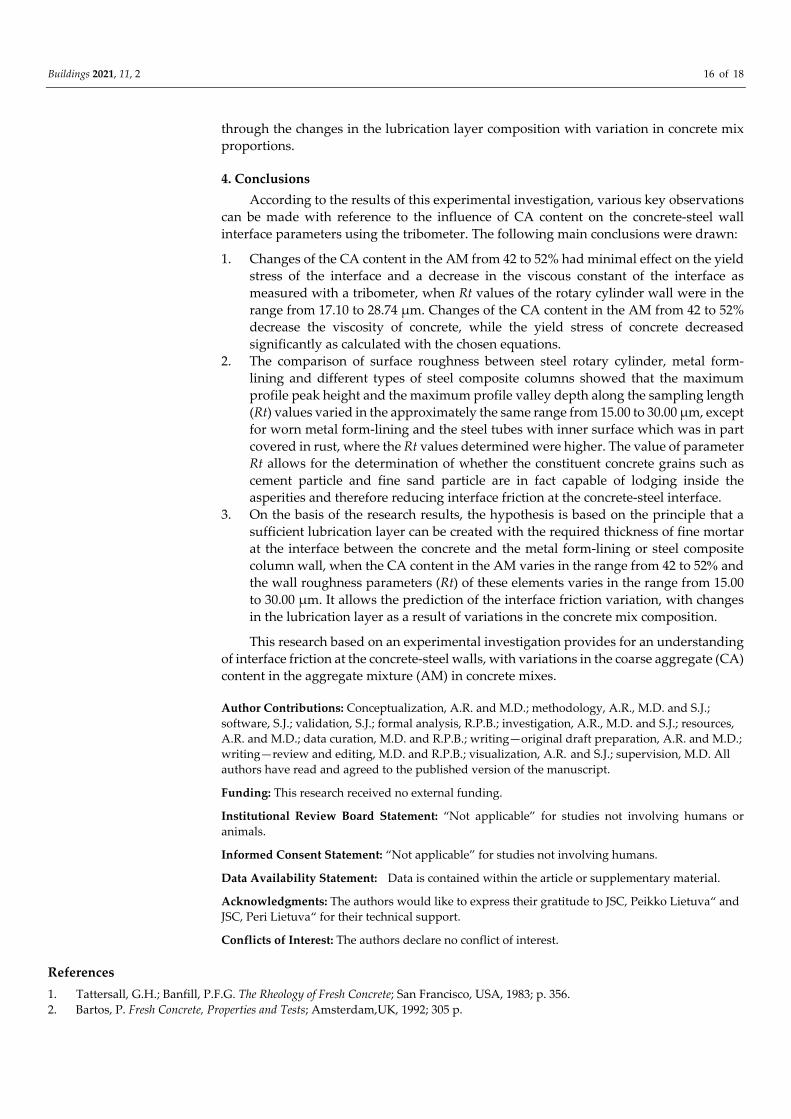