Embed Size (px)
Citation preview

Thomas J. BensonGlenn Research Center, Cleveland, Ohio
Carol A. GalicaStinger Ghaffarian Technologies, Inc., Cleveland, Ohio
Anthony J. VilaVanderbilt University, Nashville, Tennessee
The Beginner’s Guide to Wind TunnelsWith TunnelSim and TunnelSys
NASA/TM—2010-216822
October 2010
AIAA–2010–0080
https://ntrs.nasa.gov/search.jsp?R=20100039310 2018-06-29T02:23:51+00:00Z

NASA STI Program . . . in Profi le
Since its founding, NASA has been dedicated to the advancement of aeronautics and space science. The NASA Scientifi c and Technical Information (STI) program plays a key part in helping NASA maintain this important role.
The NASA STI Program operates under the auspices of the Agency Chief Information Offi cer. It collects, organizes, provides for archiving, and disseminates NASA’s STI. The NASA STI program provides access to the NASA Aeronautics and Space Database and its public interface, the NASA Technical Reports Server, thus providing one of the largest collections of aeronautical and space science STI in the world. Results are published in both non-NASA channels and by NASA in the NASA STI Report Series, which includes the following report types: • TECHNICAL PUBLICATION. Reports of
completed research or a major signifi cant phase of research that present the results of NASA programs and include extensive data or theoretical analysis. Includes compilations of signifi cant scientifi c and technical data and information deemed to be of continuing reference value. NASA counterpart of peer-reviewed formal professional papers but has less stringent limitations on manuscript length and extent of graphic presentations.
• TECHNICAL MEMORANDUM. Scientifi c
and technical fi ndings that are preliminary or of specialized interest, e.g., quick release reports, working papers, and bibliographies that contain minimal annotation. Does not contain extensive analysis.
• CONTRACTOR REPORT. Scientifi c and
technical fi ndings by NASA-sponsored contractors and grantees.
• CONFERENCE PUBLICATION. Collected papers from scientifi c and technical conferences, symposia, seminars, or other meetings sponsored or cosponsored by NASA.
• SPECIAL PUBLICATION. Scientifi c,
technical, or historical information from NASA programs, projects, and missions, often concerned with subjects having substantial public interest.
• TECHNICAL TRANSLATION. English-
language translations of foreign scientifi c and technical material pertinent to NASA’s mission.
Specialized services also include creating custom thesauri, building customized databases, organizing and publishing research results.
For more information about the NASA STI program, see the following:
• Access the NASA STI program home page at http://www.sti.nasa.gov
• E-mail your question via the Internet to help@
sti.nasa.gov • Fax your question to the NASA STI Help Desk
at 443–757–5803 • Telephone the NASA STI Help Desk at 443–757–5802 • Write to:
NASA Center for AeroSpace Information (CASI) 7115 Standard Drive Hanover, MD 21076–1320

Thomas J. BensonGlenn Research Center, Cleveland, Ohio
Carol A. GalicaStinger Ghaffarian Technologies, Inc., Cleveland, Ohio
Anthony J. VilaVanderbilt University, Nashville, Tennessee
The Beginner’s Guide to Wind TunnelsWith TunnelSim and TunnelSys
NASA/TM—2010-216822
October 2010
AIAA–2010–0080
National Aeronautics andSpace Administration
Glenn Research CenterCleveland, Ohio 44135
Prepared for the48th Aerospace Sciences Meetingsponsored by the American Institute of Aeronautics and AstronauticsOrlando, Florida, January 4–7, 2010

Acknowledgments
The Beginner’s Guide to Wind Tunnels, TunnelSim, and TunnelSys are products of the NASA Glenn Educational Programs Offi ce and are supported by NASA Headquarters. All of this information is in the public domain and is made available at the
NASA Glenn education Web site: http://www.grc.nasa.gov/WWW/K-12/airplane.
Available from
NASA Center for Aerospace Information7115 Standard DriveHanover, MD 21076–1320
National Technical Information Service5301 Shawnee Road
Alexandria, VA 22312
Available electronically at http://gltrs.grc.nasa.gov
Trade names and trademarks are used in this report for identifi cation only. Their usage does not constitute an offi cial endorsement, either expressed or implied, by the National Aeronautics and
Space Administration.
Level of Review: This material has been technically reviewed by technical management.

NASA/TM—2010-216822 1
The Beginner’s Guide to Wind Tunnels With TunnelSim and TunnelSys
Thomas J. Benson
National Aeronautics and Space Administration Glenn Research Center Cleveland, Ohio 44135
Carol A. Galica
Stinger Ghaffarian Technologies, Inc. Cleveland, Ohio 44135
Anthony J. Vila
Vanderbilt University Nashville, Tennessee 37240
Abstract
The Beginner’s Guide to Wind Tunnels is a Web-based, on-line textbook that explains and demonstrates the history, physics, and mathematics involved with wind tunnels and wind tunnel testing. The Web site contains several interactive computer programs to demonstrate scientific principles. TunnelSim is an interactive, educational computer program that demonstrates basic wind tunnel design and operation. TunnelSim is a Java (Sun Microsystems Inc.) applet that solves the continuity and Bernoulli equations to determine the velocity and pressure throughout a tunnel design. TunnelSys is a group of Java applications that mimic wind tunnel testing techniques. Using TunnelSys, a team of students designs, tests, and post-processes the data for a virtual, low speed, and aircraft wing.
Introduction
The development of personal computers and the Internet presents new methods for students to learn mathematics and physics. The Web requires the use of a browser program that retrieves information from anywhere in the world and displays the information on the monitor screen. Special computer software like Java has been developed that can execute programs (or applets) within the browser. The input to and output from these programs is principally graphical and visual. Since vision is the most perceptive sense used in education, applets are particularly well suited for education. Educational applets can provide a student with a simulated desktop laboratory that can be used to develop a feel and an understanding of math and physics. Although the Web is currently used primarily for news, business and advertisement, engineers and scientists are beginning to develop software for the Web that can be used in education. For example, Reed and Afjeh, Reference 1, have developed a turbine engine design and analysis package, and Devenport and Shetz, Reference 2, have developed several aeronautical software packages that execute on the Web. Martindale, Reference 3, currently lists over 23,000 calculator programs, covering a wide range of engineering disciplines that are available on the Web. Most of these programs are intended for practicing engineers, but some of them are finding their way into undergraduate education.
A team at the NASA Glenn Research Center has been investigating the use of the Internet for educational purposes. The studies have lead to the development of a large Web site called the Beginner’s Guide to Aeronautics (BGA). The BGA is a Web-based textbook that includes interactive programs to demonstrate science, technology, engineering, and mathematics using airplanes, jet engines, model rockets, kites, and compressible, and hypersonic aerodynamics. The BGA is divided into several sections with each section built around an interactive software program. The Beginner’s Guide to Propulsion (BGP) section provides the math and physics background information for EngineSim, Reference 4.
NASA/TM—2010-216822 2
EngineSim is a Java applet that calculates the thrust and fuel usage of a jet engine by performing a Brayton cycle thermodynamic analysis as described by Hill and Peterson, Reference 5, and Mattingly, Reference 6. EngineSim allows the student to vary all of the parameters involved in the thermodynamic analysis of a turbojet, turbofan, or ramjet engine and estimates the weight of the engine based on engine size and the component materials. The BGP is intended for students and teachers who desire a more thorough understanding of propulsion physics. Similarly, FoilSim and the Beginner’s Guide to Aerodynamics section, Reference 7, were built for students to explore the fundamentals of airfoils and the generation of lift and drag.
The current paper presents information on a new section of the BGA that deals with wind tunnels. The science and mathematics are described in a new Beginner’s Guide to Wind Tunnels (BGT) and there are several new applets and applications that allow students to learn the basics of wind tunnel design and testing techniques. TunnelSim allows the students to design a wind tunnel by changing the geometry and flow conditions in the tunnel. TunnelSys explores the process of wind tunnel testing from the design of tunnel models, through the actual testing, post-processing, and model modification. Additional background information is provided by nearly one hundred hyperlinked Web pages covering such topics as wind tunnel force balances, instrumentation, and flow visualization techniques. In the same way that the Web-based BGP was able to provide the technical information from the classical propulsion textbook of Mattingly and Hill and Petersen, it is hoped that the BGT will provide much of the technical information from the classical wind tunnel textbooks of Pope, References 8 and 9.
Nomenclature
A Area p static pressure u velocity gas density
Beginner’s Guide to Wind Tunnels
The Beginner’s Guide to Wind Tunnels (BGT) provides teachers and students with the basic science, technology, engineering and mathematics (STEM) that is used in wind tunnels. The BGT is a Web-based textbook with pages that utilize the power of the Internet. Each page includes many linked references to other pieces of information, sophisticated computer graphics and animations, and interactive applets to demonstrate math and physics principles. The Web site includes galleries of pictures of wind tunnels and their application, Microsoft PowerPoint (Microsoft Corporation) presentations about wind tunnels that have been developed by NASA scientists, and copies of NASA publications on wind tunnels that the user can download or read on-line. Construction plans for several student wind tunnels are also available at the Web site.
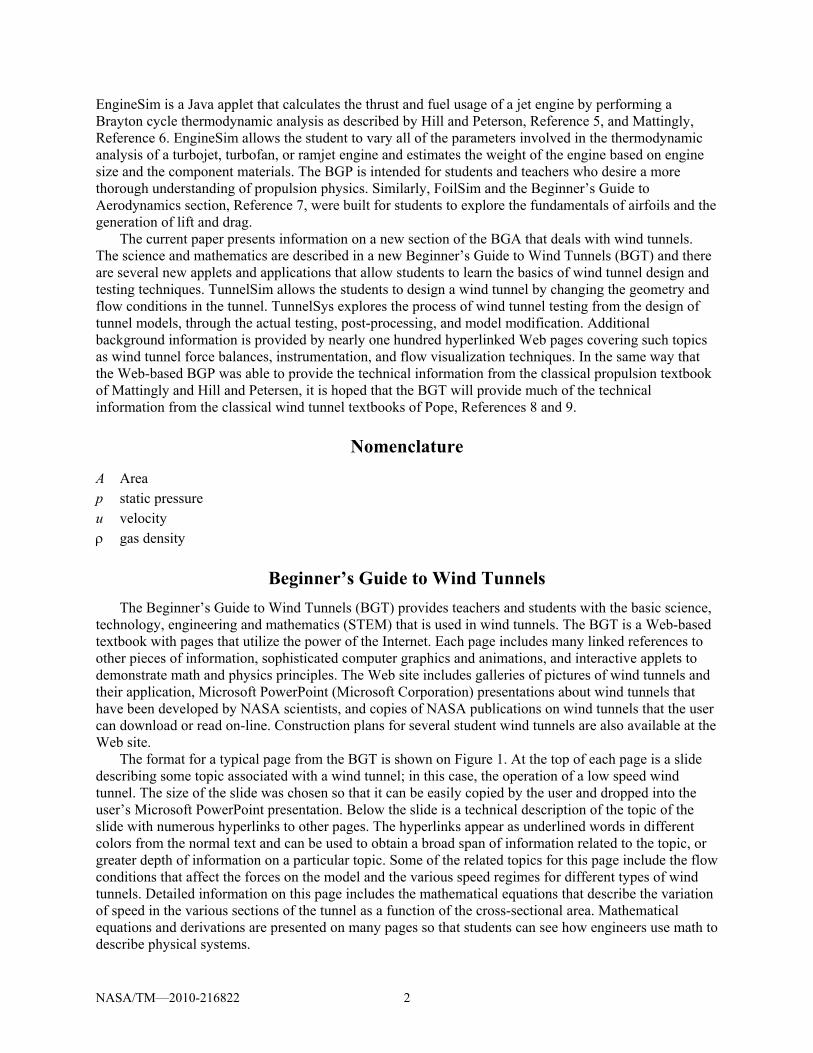
The format for a typical page from the BGT is shown on Figure 1. At the top of each page is a slide describing some topic associated with a wind tunnel; in this case, the operation of a low speed wind tunnel. The size of the slide was chosen so that it can be easily copied by the user and dropped into the user’s Microsoft PowerPoint presentation. Below the slide is a technical description of the topic of the slide with numerous hyperlinks to other pages. The hyperlinks appear as underlined words in different colors from the normal text and can be used to obtain a broad span of information related to the topic, or greater depth of information on a particular topic. Some of the related topics for this page include the flow conditions that affect the forces on the model and the various speed regimes for different types of wind tunnels. Detailed information on this page includes the mathematical equations that describe the variation of speed in the various sections of the tunnel as a function of the cross-sectional area. Mathematical equations and derivations are presented on many pages so that students can see how engineers use math to describe physical systems.

NASA/TM—2010-216822 3
Figure 1.—Typical beginner’s guide Web page.
Figure 2.—Bottom of typical Web page for beginner’s guide. At the bottom of every Web page there are navigation buttons, as shown in Figure 2. The activities
buttons are linked to problems that were generated by teachers at summer workshops hosted at NASA Glenn. The “Wind Tunnel Index” button links to a list of all the pages at the BGT. Figure 3 shows the current status of the index page.

NASA/TM—2010-216822 4
Figure 3.—Partial index of the BGT.

NASA/TM—2010-216822 5
From the index page, a user can move to any other page at the site by clicking on the name of the page. With the index page, the user is never more than two clicks from any other page at the Web site. The index currently lists nearly one hundred individual pages covering a range of topics including the history of wind tunnels, wind tunnel design and operation, test techniques, instrumentation, types of tunnels, an extensive section on the Wright Brothers’ 1901 tunnel, plans for building several wind tunnels, and the fundamental mathematics and aeronautical science pertaining to wind tunnels. The BGT is a “living document” that is constantly being updated to include new features suggested by the users of the Web site. The BGT includes Java applet programs on as many pages as possible to allow users to learn through interaction. The following sections of the paper will discuss two of the major programs available at the BGT.
TunnelSim
TunnelSim is a Java applet that allows students to study and design their own low-speed wind tunnel. There are two distinct versions of the software; one for an open return tunnel, and the other for a closed return tunnel. Figure 4 shows a picture of the open return version of TunnelSim as it appears in the browser. The display is divided into five sections. At the upper right are several buttons and a drop down menu. The red “Reset” button returns the program to the default conditions. Calculations and input may be performed in either Imperial (English) units or metric units by using the menu button. A row of buttons describes the components of the wind tunnel; the bellmouth, the test section, and the diffuser. The buttons are used to reveal input panels for each component with the current selected panel indicated by the yellow-colored button. At the middle right, the selected input panel is displayed. Each component has a distinct input panel with its own design variables for input. Input variables include flow parameters, such
Figure 4.—TunnelSim open return version.

NASA/TM—2010-216822 6
as the pressure, velocity, and airflow, and geometric parameters that define the shape of the component. The student changes the value of an input variable by using the computer mouse to move the sliders, or the computer keyboard to type into the input boxes next to the sliders. On some input panels a drop-menu is used to select an option. As the value of an input variable is changed, the program instantly calculates the values of the flow variables in all of the components of the tunnel as well as the performance variables in the test section and graphically displays the results. At the bottom right, the flow conditions through the test section are displayed, including the Mach number, Reynolds number, velocity, pressure, and diffuser angle. The diffuser angle is the half angle formed by the change in height from the test section exit to the diffuser exit divided by the length of the diffuser. When applicable, warning flags are also displayed at the lower right as discussed below. At the lower left is the output for the various flow variables through the tunnel. The display includes a bar graph and a numerical value for the flow variable at each cross-section indicated on the schematic. The user selects the variable to display by using the buttons located above the graph; the velocity is shown in this figure. At the upper left, the geometry of the wind tunnel is shown. Views from the top and side of the tunnel are indicated on the display. The user can move the display within the window by using the computer mouse and resize the display by using the green slider at the left. As the user changes geometry input variables, the output geometry changes and the flow variable bar graphs are changed. Eight cross-sections are noted on the geometry display corresponding to the locations of the output bar graphs.
The analysis used in TunnelSim assumes low speed flow and neglects the effects of fluid viscosity. The flow is assumed to be one-dimensional with a constant density (incompressible). The conservation of mass, or continuity, equation specifies that
u A = constant
where is the density of the flow, u is the velocity, and A is the cross-sectional area. The value of the constant is determined at some selected cross-section and remains constant throughout the tunnel. For the one-dimensional flow through the tunnel, Bernoulli’s equation can be used to relate the velocity and density to the local static pressure, p, in the tunnel:
p + ½ u2 = constant
Since the density is assumed constant through the tunnel, the continuity equation reduces to:
u1 A1 = u2 A2
where the subscripts 1 and 2 represent different locations in the tunnel. As the student changes geometry input variables, the program calculates the change in the local cross-sectional area and the resulting change in velocity and pressure.
There are certain combinations of input variables that violate the assumptions used in the analysis. If a speed of 300 mph occurs anywhere in the tunnel, the density in the tunnel would not be constant because of compressibility effects. If the program detects a high velocity in the tunnel, a red flashing warning is displayed at the lower right of the screen to warn the student that compressibility effects are present. If the diffusion angle from the test section to the exit exceeds 7, another warning is flashed to warn about possible flow separation in the diffuser. The analysis does not include viscosity, so it cannot predict boundary layer development or separation. But experience has shown that a diffusion angle of 7 or greater often results in boundary layer separation in diffuser ducts.

NASA/TM—2010-216822 7
TunnelSys
TunnelSys is a series of three Java application programs that simulate the systems engineering process of wind tunnel analysis. The separate programs allow students to design a wind tunnel model, test that model in a simulated tunnel, and post-process the data generated during the test to develop performance plots for the design. The individual TunnelSys programs communicate with each other via data files. Because Java does not allow the reading or writing of files from an applet, the programs of TunnelSys are written as Java applications and must be compiled and executed on a personal computer without access to the Internet. Because Java is platform-independent, any operating system may be used on the computer. The user must download and install the Java Development Kit (JDK) on the computer before compiling the programs. The source codes for Tunnelsys are provided for download at the BGT. An applet version of each program with an on-line user’s manual is provided so students can learn how the programs operate without saving data files. Each of the applications of TunnelSys writes an output file which can be printed by the student as a record of their calculations.
The TunnelSys design program is shown in Figure 5. The design engineer must design a wing model that will be wind tunnel tested to determine the lift of the design. At the upper left is a computer generated picture of the wing model design. Below the picture are a series of input boxes and sliders that allow the design engineer to change the camber, span, and chord of the model. As the input parameters are changed, the wing drawing is also changed. Output boxes at the bottom of the figure provide information on the wing area and aspect ratio, while engineering drawings of the wing are shown at the right. When the design engineer has completed the design, the blue “Save Data” button is pressed and a form appears on the screen to allow the design engineer to create and save a data file on the computer. The data file can contain several different wing designs that can be wind tunnel tested by another student. Output from the design program is used as input to a wind tunnel simulator.
Figure 5.—TunnelSys design program.

NASA/TM—2010-216822 8
The wind tunnel simulator is shown in Figure 6. At the upper left is an animated picture of the model in the wind tunnel. On the computer screen, the blue and white particles flow past the model and separate from the upper surface should the angle of attack become too great. The test engineer sets the speed in the tunnel, the angle of attack of the wing, and the static pressure by using the sliders and input boxes located below the wing graphic. The test engineer selects the wing model for testing by pressing the yellow “Load Models” button. A browser screen appears that allows the test engineer to select the data file generated by the design engineer. At the bottom right the test engineer selects the particular model in the file for testing and the geometric parameters associated with the wing design are shown in the boxes at the lower right. As air flows over the model, the diagnostic plot of the static pressure variation around the airfoil section of the wing is shown at the upper right. Below the plot is a control panel for a diagnostic probe that can be moved through the test section of the tunnel. The probe location is given by the tip of the L-shaped white line in the graphics window at the left. The probe can display the local value of the velocity or pressure or can inject “smoke” into the tunnel for flow diagnostics. Below the probe control panel on the right, the program displays the calculated value of the lift of the wing. To record the output from a wind tunnel test, the test engineer uses the blue buttons in the middle of the program at the left. There are three types of tests that can be conducted: varying the speed while holding the angle of attack and pressure constant; varying the angle of attack while holding the speed and pressure constant; varying the pressure while holding the speed and angle of attack constant. When the test engineer selects the type of test, a screen appears to select a name and location for the output data file containing the results. The test engineer then presses the black “Begin Test” button and changes the selected variable using the slider or input box. Data is recorded by pushing the blue “Take Data Point” button and then a new value of the variable is selected. This process is repeated until the “End Test” button is pushed. Output boxes record the test number and point number as the output is generated. The test engineer may perform additional tests and store the results in the same output file. The output file from the test program is used as input for the data reduction program.
Figure 6.—TunnelSys wind tunnel test program.

NASA/TM—2010-216822 9
The data reduction program is shown in Figure 7. The data analysis engineer begins by selecting the data for analysis by clicking on the “Load Data” button. A browser appears and the analysis engineer selects the data file generated by the test engineer. Since a single file may contain multiple tests, the analysis engineer enters the test number and clicks on the “Open Test” button. The number of data points and the type of test is noted by the program and a plot of the data is displayed at the upper left. The analysis engineer may rescale the plot by using the buttons on the graphics panel. The analysis engineer may also select a different plot display by using the blue buttons on the left. At the upper right of the program is an additional display window. The analysis engineer may select to compare the plot at the left with other test plots in the window at the upper right, or the engineer can display a “movie” of a previous test point, as shown in the figure. The selection is made with the “Display” menu located below the right window. Details of the selected test point are given in the output boxes at the right.
With the information generated by the analysis engineer, the lift performance of the wing design has been determined. The team engineers (design engineer, test engineer, and analysis engineer) must now determine if the process should be repeated to produce a better wing design or whether to proceed to flight test of the design. When used in a design class, the team should probably include a “program manager” to keep the team members on schedule and to determine when the design is finished. As currently configured, TunnelSys can only determine the lift of the wing design. Future versions of the program will also include the drag of the wing.
Figure 7.—TunnelSys data reduction program.
NASA/TM—2010-216822 10
Conclusions
High speed personal computers coupled with the Internet, interactive operating systems, and computer graphics provide many opportunities for new techniques to learn science, technology, engineering and mathematics. This paper has presented two new products that use interactive flow simulators and a Web-based textbook. The subject of wind tunnel design is used to introduce the ideas of functions, graphing, physical units, test techniques, and flow measurement and visualization. A guiding principal in the development of the BGT, TunnelSim and TunnelSyS is to do more than just present answers to problems; it is to involve student in the learning process by having them work with the package to achieve a result. When using TunnelSim, as the design parameters are changed, the output panels show the variation in conditions throughout the tunnel, the change in the configuration of the tunnel, and the change in test section performance. With control of the input conditions, the student learns how a wind tunnel operates and performs. More importantly, students see how graphs are used to present data, and develop a feel for the physical concepts of velocity, pressure, density, and the units used to describe them.
TunnelSys has been developed to introduce a team of students to the systems engineering aspects of wind tunnel testing. Each student is responsible for their own part of the wind tunnel testing process; design of a model, testing of the model, and post-processing the data from the test. Communication between the team members and a project manager is important for the success of the project. With the TunnelSys computer programs, students can practice the process without the expense of actually building and testing a physical model.
References
1. Reed, J.A., and Afjeh, A.A., “A JAVA Simulator for Teaching Gas Turbine Operation,” AIAA Paper 97-0850, 1997.
2. Devenport, W.J. and Shetz, J.A., “Boundary Layer Codes for Students in Java,” ASME 1998 Fluids Engineering Summer Meeting, June 21–25, Washington, D.C., 1998.
3. Martindale, J., Calculators On-Line Center, http://www.martindalecenter.com/ Calculators4_1_Aero.html, hosted by University of California, 2009.
4. Benson, T.J., “EngineSim and the Beginner’s Guide to Propulsion,” ASME 2001 Fluids Summer Meeting, ASME Paper FEDSM2001-18228, 2001.
5. Hill, P.G., and Peterson, C.R., Mechanics and Thermodynamics of Propulsion, Addison-Wesley Publishing Co., Reading, MA, 1965.
6. Mattingly, J.D., Elements of Gas Turbine Propulsion, McGraw-Hill, Inc., New York, NY, 1996. 7. Benson, T.J., “Using Computers in Fluids Engineering Education,” ASME 1998 Fluids Engineering
Summer Meeting, ASME Paper FEDSM98-5135, 1998. 8. Pope, A., and Rae W.H., Low-Speed Wind Tunnel Testing, John Wiley and Sons, New York, NY,
1984. 9. Pope, A., and Goin K.L., High-Speed Wind Tunnel Testing, Krieger Publishing, Malabar, FL, 1965.

REPORT DOCUMENTATION PAGE Form Approved
OMB No. 0704-0188 The public reporting burden for this collection of information is estimated to average 1 hour per response, including the time for reviewing instructions, searching existing data sources, gathering and maintaining the data needed, and completing and reviewing the collection of information. Send comments regarding this burden estimate or any other aspect of this collection of information, including suggestions for reducing this burden, to Department of Defense, Washington Headquarters Services, Directorate for Information Operations and Reports (0704-0188), 1215 Jefferson Davis Highway, Suite 1204, Arlington, VA 22202-4302. Respondents should be aware that notwithstanding any other provision of law, no person shall be subject to any penalty for failing to comply with a collection of information if it does not display a currently valid OMB control number. PLEASE DO NOT RETURN YOUR FORM TO THE ABOVE ADDRESS.
1. REPORT DATE (DD-MM-YYYY) 01-10-2010
2. REPORT TYPE Technical Memorandum
3. DATES COVERED (From - To)
4. TITLE AND SUBTITLE The Beginner’s Guide to Wind Tunnels With TunnelSim and TunnelSys
5a. CONTRACT NUMBER
5b. GRANT NUMBER
5c. PROGRAM ELEMENT NUMBER
6. AUTHOR(S) Benson, Thomas, J.; Galica, Carol, A.; Vila, Anthony, J.
5d. PROJECT NUMBER
5e. TASK NUMBER
5f. WORK UNIT NUMBER WBS 561581.02.02.03.03
7. PERFORMING ORGANIZATION NAME(S) AND ADDRESS(ES) National Aeronautics and Space Administration John H. Glenn Research Center at Lewis Field Cleveland, Ohio 44135-3191
8. PERFORMING ORGANIZATION REPORT NUMBER E-17451
9. SPONSORING/MONITORING AGENCY NAME(S) AND ADDRESS(ES) National Aeronautics and Space Administration Washington, DC 20546-0001
10. SPONSORING/MONITOR'S ACRONYM(S) NASA
11. SPONSORING/MONITORING REPORT NUMBER NASA/TM-2010-216822
12. DISTRIBUTION/AVAILABILITY STATEMENT Unclassified-Unlimited Subject Categories: 01, 61, and 99 Available electronically at http://gltrs.grc.nasa.gov This publication is available from the NASA Center for AeroSpace Information, 443-757-5802
13. SUPPLEMENTARY NOTES
14. ABSTRACT The Beginner’s Guide to Wind Tunnels is a Web-based, on-line textbook that explains and demonstrates the history, physics, and mathematics involved with wind tunnels and wind tunnel testing. The Web site contains several interactive computer programs to demonstrate scientific principles. TunnelSim is an interactive, educational computer program that demonstrates basic wind tunnel design and operation. TunnelSim is a Java (Sun Microsystems Inc.) applet that solves the continuity and Bernoulli equations to determine the velocity and pressure throughout a tunnel design. TunnelSys is a group of Java applications that mimic wind tunnel testing techniques. Using TunnelSys, a team of students designs, tests, and post-processes the data for a virtual, low speed, and aircraft wing. 15. SUBJECT TERMS Aeronautics; Mathematical and Computer Sciences; General
16. SECURITY CLASSIFICATION OF: 17. LIMITATION OF ABSTRACT UU
18. NUMBER OF PAGES
16
19a. NAME OF RESPONSIBLE PERSON STI Help Desk (email:[email protected])
a. REPORT U
b. ABSTRACT U
c. THIS PAGE U
19b. TELEPHONE NUMBER (include area code) 443-757-5802
Standard Form 298 (Rev. 8-98)Prescribed by ANSI Std. Z39-18