Embed Size (px)
Citation preview

The beauty of our business
2009 Annual Report
ABouT SAlly BeAuTy HolDingS, inC.Sally Beauty Holdings, Inc. (NYSE: SBH) is an international specialty retailer and distributor of professional beauty supplies with revenues of more than $2.6 billion annually.
Through the Sally Beauty Supply and Beauty Systems Group businesses, the Company sells and distributes through over 3,900 stores, including approximately 187 franchised units, throughout the United States, the United Kingdom, Belgium, Chile, France, Canada, Puerto Rico, Mexico, Ireland, Spain and Germany.
Sally Beauty Supply stores offer more than 6,000 products for hair, skin, and nails through professional lines. Sally Beauty Supply stores are open to the retail customer and professional stylists.
Beauty Systems Group stores, branded as CosmoProf, Schoeneman Beauty Supply or Armstrong McCall stores, along with its outside sales consultants, sell up to 9,800 professionally branded products, which are targeted exclusively for professional and salon use and resale to their customers.
For more information about Sally Beauty Holdings, Inc., please visit sallybeauty.com
opeRATing SegmenTS(as of September 30, 2009)
Sally Beauty Supply (retail and professional stores)
2,923 stores worldwide
2,521 stores U.S., Canada, Mexico
402 stores in UK, Belgium, France, Ireland, Spain, Germany, and Chile
• Annual sales of $1.7 billion
• Average store size 1,700 sq. ft., 90% selling space
• Sales mix approximately 30% professional and 70% retail
• Comprehensive professional product assortment—5,400 to 7,700 SKUs
• Strategic focus is to expand store base organically & through acquisitions
Beauty Systems Group
(professional stores and sales force)
829 company-operated/162 franchised stores
1,022 distributor sales consultants
• Annual sales of $941 million
• Average store size 2,700 sq. ft.
• Sells to salon and salon professionals
• Diversified mix of professional beauty products not available in retail
• Strategic focus is to expand North American store base & improve profitability
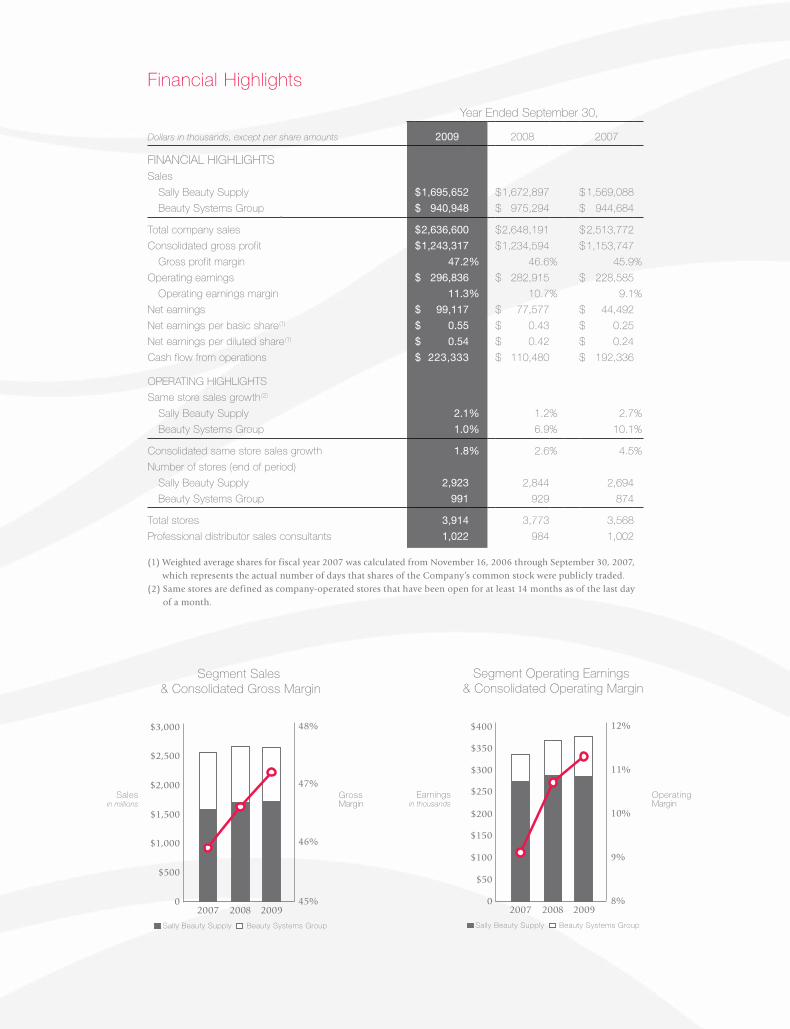
Year Ended September 30,
Dollars in thousands, except per share amounts 2009 2008 2007
Financial highlightSSales
Sally Beauty Supply $ 1,695,652 $ 1,672,897 $ 1,569,088
Beauty Systems group $ 940,948 $ 975,294 $ 944,684
total company sales $ 2,636,600 $ 2,648,191 $ 2,513,772
consolidated gross profit $ 1,243,317 $ 1,234,594 $ 1,153,747
gross profit margin 47.2% 46.6% 45.9%
Operating earnings $ 296,836 $ 282,915 $ 228,585
Operating earnings margin 11.3% 10.7% 9.1%
net earnings $ 99,117 $ 77,577 $ 44,492
net earnings per basic share(1) $ 0.55 $ 0.43 $ 0.25
net earnings per diluted share(1) $ 0.54 $ 0.42 $ 0.24
cash flow from operations $ 223,333 $ 110,480 $ 192,336
OpErating highlightS
Same store sales growth(2)
Sally Beauty Supply 2.1% 1.2% 2.7%
Beauty Systems group 1.0% 6.9% 10.1%
consolidated same store sales growth 1.8% 2.6% 4.5%
number of stores (end of period)
Sally Beauty Supply 2,923 2,844 2,694
Beauty Systems group 991 929 874
total stores 3,914 3,773 3,568
professional distributor sales consultants 1,022 984 1,002
(1) Weighted average shares for fiscal year 2007 was calculated from November 16, 2006 through September 30, 2007, which represents the actual number of days that shares of the Company’s common stock were publicly traded.
(2) Same stores are defined as company-operated stores that have been open for at least 14 months as of the last day of a month.
Financial highlights
0
500
1000
1500
2000
2500
3000
45
46
47
48
0
50
100
150
200
250
300
350
400
8
9
10
11
12
48%$3,000
$2,500
$1,500
46%$1,000
$500
2007 2008 2009
47%$2,000
0 45%
Segment Sales & Consolidated Gross Margin
Salesin millions
Earningsin thousands
Sally Beauty Supply Beauty Systems Group
GrossMargin
Sally Beauty Supply Beauty Systems Group
12%$400
$300
$350
$200
$250
10%
$100
$150
9%
$50
2007 2008 2009
11%
0 8%
Segment Operating Earnings & Consolidated Operating Margin
OperatingMargin
0
500
1000
1500
2000
2500
3000
45
46
47
48
0
50
100
150
200
250
300
350
400
8
9
10
11
12
48%$3,000
$2,500
$1,500
46%$1,000
$500
2007 2008 2009
47%$2,000
0 45%
Segment Sales & Consolidated Gross Margin
Salesin millions
Earningsin thousands
Sally Beauty Supply Beauty Systems Group
GrossMargin
Sally Beauty Supply Beauty Systems Group
12%$400
$300
$350
$200
$250
10%
$100
$150
9%
$50
2007 2008 2009
11%
0 8%
Segment Operating Earnings & Consolidated Operating Margin
OperatingMargin

I am pleased to report that in fiscal 2009 our company
delivered very good results and stayed on course strategi-
cally. We succeeded in a year when difficult economic
conditions created challenges for many; and that is the
beauty of our business.
Our consolidated net sales were slightly down by 40
basis points to $2.64 billion, dampened by unfavorable
foreign currency exchange of 3.2% of sales. Consolidated
same store sales remained positive all year and grew
1.8%. Gross profit margin expanded 60 basis points to
reach 47.2% and net earnings finished the year up 28%.
We generated over $223 million in net operating cash
which allowed us to prudently reinvest in the business
and reduce our long-term debt. Our solid performance in
fiscal 2009 highlights the recession-resistant nature of
our business.
continued growthWe continue to deliver on our growth strategy. In 2009,
we grew our total company store count by 3.7% adding
141 stores and ended the year with 3,914 stores world-
wide. Store growth from acquisitions was 1.7% and
organic growth represented 2.0%. Earlier in the year we
lowered our organic growth projections in recognition of
uncertainty in the global economy. In hindsight we may
have been too conservative, given that our business
remained stable through the worst of the economic cri-
sis, which is consistent with our history. In fiscal year
2010, we believe we can return to our historical organic
store growth rate of 4% to 5% per year.
On the acquisition front, our Sally Beauty segment laid
the groundwork for new growth opportunities in South
America by entering this marketplace through our acqui-
sition of InterSalon, located in Santiago, Chile. Beauty
Systems Group (BSG) made its entrance into Puerto Rico
through its acquisition of Belleza Concepts International.
BSG’s acquisition of Pennsylvania-based Schoeneman
Beauty Supply, Inc. extended our distribution reach in
Pennsylvania, Southern New Jersey, Northern Delaware
and West Virginia.
As of fiscal year-end, the Sally Beauty segment now has
404 international stores located in the United Kingdom,
Belgium, France, Ireland, Spain, Germany and Chile. We
expect to grow faster on a percentage basis outside of the
United States, and are focusing on Europe and South
America. In the BSG business, we intend to stay the
course and expand both organically and through acqui-
sitions to increase our footprint in existing North
American geographies and new territories.
Sally Beauty SupplyNet sales at our Sally Beauty segment grew 1.4% which
includes the impact from unfavorable foreign currency
exchange of $64 million, or 3.8% of sales. Sales growth
was driven by same store sales growth of 2.1% and
growth from new stores and acquisitions of 3.4%. Gross
margin expanded by 50 basis points. However, operating
margin declined by 40 basis points, as Sally’s operating
profits were negatively impacted by underperformance
in the U.K. Although the weak economy in the U.K. had
Dear Stockholders:
World’s largest
an impact on our business, we launched operational
improvement initiatives such as optimizing our mer-
chandising strategy, implementing assisted replenish-
ment, and rationalizing our stores and warehouses. We
made progress towards these initiatives during the course
of the year and expect significant improvement on both
the top and bottom line in the U.K. in fiscal year 2010.
On the marketing side for Sally Beauty, we continue to
realize positive trends from our customer acquisition
strategy. The average sale for a Beauty Club Card cus-
tomer is consistently higher than the average for a non-
card customer. Beauty Club memberships are up over
30% from a year ago and contributed to our growth in
store traffic.
Beauty Systems groupAt our Beauty Systems Group we intensified our focus
on reducing costs and streamlining the business. As a
result of these efforts BSG boosted operating margin by
140 basis points to reach 9.7% of sales. Also contributing
to margin improvement was an $8 million savings result-
ing from our warehouse optimization project, which was
completed in fiscal 2008. We anticipate additional sav-
ings in fiscal 2010 of $2 million to $4 million. Net sales
at BSG were $941 million, down 3.5% in part due to
the unfavorable foreign currency exchange impact of
$22 million, or 2.2% of sales. We experienced some soft-
ness in the franchise and sales consultant businesses,
representing 1.3% and 2.0% of sales, respectively. BSG’s
gross profit margin was 38.7%, a 10 basis point improve-
ment over last year.
going ForwardIn summary, we performed well in fiscal 2009 despite
the difficult recessionary environment. We remain confi-
dent our Company is well positioned to execute against
our strategy and deliver long-term growth.
Our strategic initiatives remain unchanged:
• To grow our store base 4% to 5% and, when appro-
priate, make strategic and synergistic acquisitions;
• To improve margins and increase profitability;
• To continue to de-lever our balance sheet;
• And lastly, to direct our resources to the greatest
potential for long-term growth, profitability and
shareholder return.
As always, we are grateful for your continued support of
Sally Beauty Holdings.
gary g. WinterhalterPresident and Chief Executive Officer
distributor of professional beauty supplies
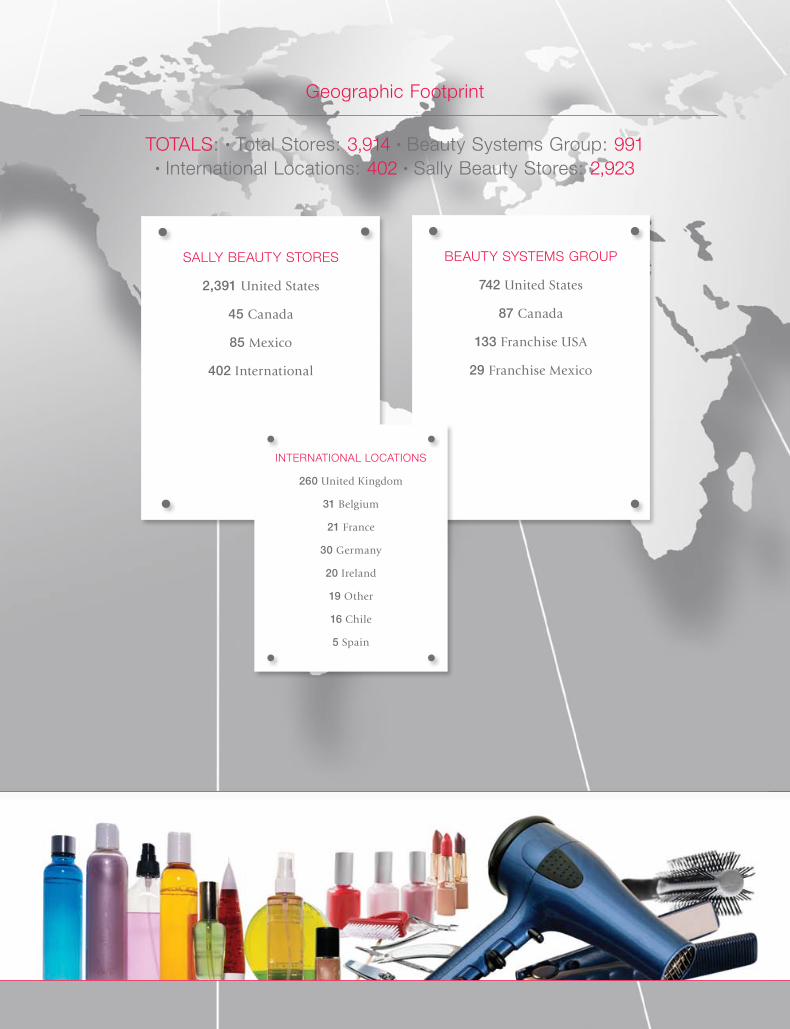
ToTals: • Total stores: 3,914 • Beauty systems Group: 991 • International locations: 402 • sally Beauty stores: 2,923
Geographic Footprint
BeauTy sysTems Group
742 United States
87 Canada
133 Franchise USA
29 Franchise Mexico
sally BeauTy sTores
2,391 United States
45 Canada
85 Mexico
402 International
InTernaTIonal locaTIons
260 United Kingdom
31 Belgium
21 France
30 Germany
20 Ireland
19 Other
16 Chile
5 Spain

2009 Form 10-K
UNITED STATESSECURITIES AND EXCHANGE COMMISSION
Washington, D.C. 20549
FORM 10-K� ANNUAL REPORT PURSUANT TO SECTION 13 OR 15(d) OF THE
SECURITIES EXCHANGE ACT OF 1934FOR THE FISCAL YEAR ENDED: SEPTEMBER 30, 2009
-OR-
� TRANSITION REPORT PURSUANT TO SECTION 13 OR 15(d) OF THESECURITIES EXCHANGE ACT OF 1934
For the transition period from to Commission File No. 1-33145
SALLY BEAUTY HOLDINGS, INC.(Exact name of registrant as specified in its charter)
Delaware 36-2257936(State or other jurisdiction of (I.R.S. Employer Identification No.)incorporation or organization)
3001 Colorado Boulevard 76210Denton, Texas (Zip Code)
(Address of principal executive offices)Registrant’s telephone number, including area code: (940) 898-7500
Securities registered pursuant to Section 12(b) of the Act:
Title of Each Class Name of Each Exchange on Which Registered
Common Stock, par value $.01 per share New York Stock ExchangeSecurities registered pursuant to Section 12(g) of the Act: None
Indicate by check mark if the registrant is a well-known seasoned issuer, as defined under Rule 405 of the SecuritiesAct. YES � NO �Indicate by check mark if the registrant is not required to file reports pursuant to Section 13 or Section 15(d) of theAct. YES � NO �Indicate by check mark whether the registrant (1) has filed all reports required to be filed by Section 13 or 15(d) of theSecurities Exchange Act of 1934 during the preceding 12 months (or for such shorter period that the registrant was requiredto file such reports), and (2) has been subject to such filing requirements for the past 90 days. YES � NO �Indicate by check mark whether the registrant has submitted electronically and posted on its corporate Website, if any, everyInteractive Data File required to be submitted and posted pursuant to Rule 405 of Regulation S-T during the preceding12 months (or for such shorter period that the registrant was required to submit and post such files. YES � NO �Indicate by check mark if disclosure of delinquent filers pursuant to Item 405 of Regulation S-K is not contained herein, andwill not be contained, to the best of registrant’s knowledge, in definitive proxy or information statements incorporated byreference in Part III of this Form 10-K or any amendment to this Form 10-K. �Indicate by check mark whether the registrant is a large accelerated filer, an accelerated filer, a non-accelerated filer, or asmaller reporting company. (See the definitions of ‘‘accelerated filer,’’ ‘‘large accelerated filer’’ and ‘‘smaller reportingcompany’’ in Rule 12b-2 of the Exchange Act).
Large accelerated filer � Accelerated filer � Non-accelerated filer � Smaller reporting company �(Do not check if a smaller
reporting company)
Indicate by check mark whether the registrant is a shell company (as defined in Rule 12b-2 of the Exchange Act.)YES � NO �The aggregate market value of registrant’s common stock held by non-affiliates of the registrant, based upon the closing priceof a share of the registrant’s common stock on March 31, 2009 was approximately $533,207,000. At November 17, 2009, therewere 182,313,747 shares of the registrant’s common stock outstanding.
DOCUMENTS INCORPORATED BY REFERENCEPortions of the registrant’s Proxy Statement relating to the registrant’s 2010 Annual Meeting of Stockholders areincorporated by reference into Part III of this Annual Report on Form 10-K where indicated.
TABLE OF CONTENTS
Page
PART IITEM 1. BUSINESS . . . . . . . . . . . . . . . . . . . . . . . . . . . . . . . . . . . . . . . . . . . . . . . . . . . . . . . . 1ITEM 1A. RISK FACTORS . . . . . . . . . . . . . . . . . . . . . . . . . . . . . . . . . . . . . . . . . . . . . . . . . . . . 16ITEM 1B. UNRESOLVED STAFF COMMENTS . . . . . . . . . . . . . . . . . . . . . . . . . . . . . . . . . . . . . 31ITEM 2. PROPERTIES . . . . . . . . . . . . . . . . . . . . . . . . . . . . . . . . . . . . . . . . . . . . . . . . . . . . . . 32ITEM 3. LEGAL PROCEEDINGS . . . . . . . . . . . . . . . . . . . . . . . . . . . . . . . . . . . . . . . . . . . . . . 33ITEM 4. SUBMISSION OF MATTERS TO A VOTE OF SECURITY HOLDERS . . . . . . . . . . . . . 34
PART IIITEM 5. MARKET FOR REGISTRANT’S COMMON EQUITY AND RELATED
STOCKHOLDER MATTERS . . . . . . . . . . . . . . . . . . . . . . . . . . . . . . . . . . . . . . . . . . 34ITEM 6. SELECTED FINANCIAL DATA . . . . . . . . . . . . . . . . . . . . . . . . . . . . . . . . . . . . . . . . . 36ITEM 7. MANAGEMENT’S DISCUSSION AND ANALYSIS OF FINANCIAL CONDITION AND
RESULTS OF OPERATIONS . . . . . . . . . . . . . . . . . . . . . . . . . . . . . . . . . . . . . . . . . . 38ITEM 7A. QUANTITATIVE AND QUALITATIVE DISCLOSURES ABOUT MARKET RISK . . . . . . 71ITEM 8. FINANCIAL STATEMENTS AND SUPPLEMENTARY DATA . . . . . . . . . . . . . . . . . . . . 73ITEM 9. CHANGES IN AND DISAGREEMENTS WITH ACCOUNTANTS ON ACCOUNTING
AND FINANCIAL DISCLOSURE . . . . . . . . . . . . . . . . . . . . . . . . . . . . . . . . . . . . . . 73ITEM 9A. CONTROLS AND PROCEDURES . . . . . . . . . . . . . . . . . . . . . . . . . . . . . . . . . . . . . . . 73ITEM 9B. OTHER INFORMATION . . . . . . . . . . . . . . . . . . . . . . . . . . . . . . . . . . . . . . . . . . . . . . 74
PART IIIITEM 10. DIRECTORS, EXECUTIVE OFFICERS AND CORPORATE GOVERNANCE . . . . . . . . 75ITEM 11. EXECUTIVE COMPENSATION . . . . . . . . . . . . . . . . . . . . . . . . . . . . . . . . . . . . . . . . . 75ITEM 12. SECURITY OWNERSHIP OF CERTAIN BENEFICIAL OWNERS AND
MANAGEMENT AND RELATED STOCKHOLDER MATTERS . . . . . . . . . . . . . . . . . 75ITEM 13. CERTAIN RELATIONSHIPS AND RELATED TRANSACTIONS, AND DIRECTOR
INDEPENDENCE . . . . . . . . . . . . . . . . . . . . . . . . . . . . . . . . . . . . . . . . . . . . . . . . . 75ITEM 14. PRINCIPAL ACCOUNTANT FEES AND SERVICES . . . . . . . . . . . . . . . . . . . . . . . . . . 75
PART IVITEM 15. EXHIBITS AND FINANCIAL STATEMENT SCHEDULES . . . . . . . . . . . . . . . . . . . . . . 76
i
In this Annual Report, references to ‘‘the Company,’’ ‘‘Sally Beauty,’’ ‘‘our company,’’ ‘‘we,’’ ‘‘our,’’ ‘‘ours’’and ‘‘us’’ refer to Sally Beauty Holdings, Inc. and its consolidated subsidiaries for periods after theseparation from Alberto-Culver Company (‘‘Alberto-Culver’’), and to Sally Holdings, Inc. and itsconsolidated subsidiaries for periods prior to the separation from Alberto-Culver unless otherwiseindicated or the context otherwise requires.
CAUTIONARY NOTICE REGARDING FORWARD-LOOKING STATEMENTS
Statements in this Annual Report on Form 10-K and the documents incorporated by reference hereinwhich are not purely historical facts or which depend upon future events may be forward-lookingstatements within the meaning of Section 27A of the Securities Act of 1933, as amended, and Section 21Eof the Securities Exchange Act of 1934, as amended, which we refer to as the Exchange Act. Words such as‘‘anticipate,’’ ‘‘believe,’’ ‘‘estimate,’’ ‘‘expect,’’ ‘‘intend,’’ ‘‘plan,’’ ‘‘project,’’ ‘‘target,’’ ‘‘can,’’ ‘‘could,’’ ‘‘may,’’‘‘should,’’ ‘‘will,’’ ‘‘would’’ or similar expressions may also identify such forward-looking statements.
Readers are cautioned not to place undue reliance on forward-looking statements as such statementsspeak only as of the date they were made. Any forward-looking statements involve risks and uncertaintiesthat could cause actual events or results to differ materially from the events or results described in theforward-looking statements, including, but not limited to, risks and uncertainties related to:
• the highly competitive nature of, and the increasing consolidation of, the beauty productsdistribution industry;
• anticipating changes in consumer preferences and buying trends and managing our product linesand inventory;
• potential fluctuation in our same store sales and quarterly financial performance;
• our dependence upon manufacturers who may be unwilling or unable to continue to supplyproducts to us;
• the possibility of material interruptions in the supply of beauty supply products by ourmanufacturers;
• products sold by us being found to be defective in labeling or content;
• compliance with laws and regulations or becoming subject to additional or more stringent laws andregulations;
• product diversion;
• the operational and financial performance of our Armstrong McCall, L.P. business;
• the success of our new internet-based business;
• successfully identifying acquisition candidates or successfully completing desirable acquisitions;
• integrating businesses acquired in the future;
• opening and operating new stores profitably;
• the impact of a continued downturn in the economy upon our business;
• the success of our cost control plans;
• protecting our intellectual property rights, specifically our trademarks;
• conducting business outside the United States;
• disruption in our information technology systems;
ii
• natural disasters or acts of terrorism;
• the preparedness of our accounting and other management systems to meet financial reporting andother requirements and the upgrade of our existing financial reporting system;
• being a holding company, with no operations of our own, and depending on our subsidiaries forcash;
• our substantial indebtedness;
• the possibility that we may incur substantial additional debt;
• restrictions and limitations in the agreements and instruments governing our debt;
• generating the significant amount of cash needed to service all of our debt and refinancing all or aportion of our indebtedness or obtaining additional financing;
• changes in interest rates increasing the cost of servicing our debt or increasing our interest expensedue to our interest rate swap agreements;
• the potential impact on us if the financial institutions we deal with become impaired;
• the representativeness of our historical consolidated financial information with respect to our futurefinancial position, results of operations or cash flows;
• our reliance upon Alberto-Culver for the accuracy of certain historical services and information;
• the share distribution of Alberto-Culver common stock in our separation from Alberto-Culver notconstituting a tax-free distribution;
• actions taken by certain large stockholders adversely affecting the tax-free nature of the sharedistribution of Alberto-Culver common stock;
• the voting power of our largest stockholder discouraging third party acquisitions of us at a premium;and
• the interests of our largest stockholder differing from the interests of other holders of our commonstock.
The events described in the forward-looking statements might not occur or might occur to a differentextent or at a different time than we have described. As a result, our actual results may differ materiallyfrom the results contemplated by these forward-looking statements. We assume no obligation to publiclyupdate or revise any forward-looking statements.
iii
PART I
ITEM 1. BUSINESS
Introduction
We are the largest distributor of professional beauty supplies in the U.S. based on store count. We operateprimarily through two business units, Sally Beauty Supply and Beauty Systems Group, or BSG. ThroughSally Beauty Supply and BSG (which operates stores under the CosmoProf service mark), we operated amulti-channel platform of 3,727 stores and supplied 187 franchised stores primarily in North America,South America and selected European countries, as of September 30, 2009. Within BSG, we also have oneof the largest networks of professional distributor sales consultants in North America, with approximately1,022 professional distributor sales consultants who sell directly to salons and salon professionals. As ofSeptember 30, 2009, Sally Beauty Supply had 2,898 company-operated retail stores and supplied25 franchised stores (all outside the U.S.), and BSG had 829 company-operated stores and supplied162 franchised stores. We provide our customers with a wide variety of leading third-party branded andexclusive-label professional beauty supplies, including hair care products, styling appliances, skin and nailcare products and other beauty items. Sally Beauty Supply stores target retail consumers and salonprofessionals, while BSG exclusively targets salons and salon professionals. Approximately 84%, 82% and84% of our consolidated net sales for the fiscal years ended September 30, 2009, 2008 and 2007,respectively, were in the U.S. For the year ended September 30, 2009, our consolidated net sales were$2,636.6 million.
Sally Beauty Supply began operations with a single store in New Orleans in 1964 and was acquired in 1969by our former parent company, Alberto-Culver. BSG became a subsidiary of Alberto-Culver in 1995. InNovember 2006, we separated from Alberto-Culver and became an independent company listed on theNew York Stock Exchange. We refer to our separation from Alberto-Culver and its consumer products-focused business as the Separation Transactions. Sally Beauty is a Delaware corporation formed in June2006 and became the accounting successor company to Sally Holdings upon the completion of theSeparation Transactions. When we refer to Alberto-Culver, we mean Alberto-Culver Company prior to theSeparation Transactions or the company from which we separated, which is currently a separate publiccompany.
In connection with the Separation Transactions, CDRS Acquisition LLC, or CDRS and CD&R ParallelFund VII, L.P., or the Parallel Fund, and which we refer to together with CDRS as the CDR Investors,invested an aggregate of $575.0 million in cash equity, representing ownership subsequent to theseparation of approximately 48% of the outstanding shares of our common stock on an undiluted basis.CDRS, which owned approximately 47.4% of the outstanding shares of our common stock on an undilutedbasis as of September 30, 2009, is a Delaware limited liability company organized by Clayton, Dubilier &Rice Fund VII, L.P., a private investment fund managed by Clayton, Dubilier & Rice, Inc. Also inconnection with the Separation Transactions, certain of our subsidiaries incurred approximately$1,850.0 million of indebtedness, as more fully described below. Please see ‘‘Risk Factors—Risks Relatingto Our Substantial Indebtedness’’ in Item 1A below.
Professional Beauty Supply Industry Distribution Channels
The professional beauty supply industry serves end-users through four channels: full-service/exclusivedistribution, open-line distribution, direct and mega-salon stores.
Full-Service/Exclusive
This channel exclusively serves salons and salon professionals and distributes ‘‘professional-only’’ productsfor use and resale to consumers in salons. Many brands are distributed through arrangements withsuppliers by geographic territory. BSG is a leading full-service distributor in the U.S.
1
Open-Line
This channel serves retail consumers and salon professionals through retail stores and the internet. Thischannel is served by a large number of localized retailers and distributors, with only a few having a regionalpresence and significant channel share. We believe that Sally Beauty Supply is the only open-linedistributor in the U.S. with a national network of retail stores. In addition, Sally Beauty Supply sells someof its products through its web site (www.sallybeauty.com).
Direct
This channel focuses on direct sales to salons and salon professionals by large manufacturers. This is thedominant form of distribution in Europe, but represents a small channel in the U.S. due to the highlyfragmented nature of the U.S. marketplace, which tends to make direct distribution cost prohibitive formanufacturers.
Mega-Salon Stores
In this channel, large-format salons are supplied directly by manufacturers due to their large scale.
Key Industry Trends
We operate within the large and growing U.S. professional beauty supply industry. Potential growth in theindustry is expected to be driven by increases in consumer demand for hair color, hair loss prevention andhair styling products and services, offset by lower sales of certain electrical products and/or full-servicesales during periods of economic slowdown. We believe the following key industry trends andcharacteristics will influence our business going forward:
• High level of marketplace fragmentation. The U.S. salon channel is highly fragmented with over250,000 salons. Given the fragmented and small-scale nature of the salon industry, we believe thatsalon operators will continue to depend on full-service/exclusive distributors and open-line channelsfor a majority of their beauty supply purchases.
• Growth in booth renting and frequent stocking needs. Salon professionals primarily rely onjust-in-time inventory due to capital constraints and a lack of warehouse and shelf space at salons.In addition, booth renters, who comprise a significant percentage of total U.S. salon professionals,are often responsible for purchasing their own supplies. Historically, booth renters havesignificantly increased as a percentage of total salon professionals, and we expect this trend tocontinue. Given their smaller individual purchases and relative lack of financial resources, boothrenters are likely to be dependent on frequent trips to professional beauty supply stores, like BSGand Sally Beauty Supply. These factors continue to drive demand for conveniently locatedprofessional beauty supply stores.
• Increasing use of exclusive-label products. We offer a broad range of private label and control labelproducts, which we generally refer to collectively as ‘‘exclusive-label products.’’ Private labelproducts are brands for which we own or license the trademark and, in some instances, the formula.Control label products are brands that are owned by the manufacturer, but for which we have beengranted sole distribution rights. Generally, our exclusive-label products have higher gross marginsthan the leading third-party branded products, and we believe this area offers potential growth.Please see ‘‘Risk Factors—We depend upon manufacturers who may be unable to provide productsof adequate quality or who may be unwilling to continue to supply products to us’’ in Item 1Abelow.
• Favorable demographic and consumer trends. The aging baby-boomer population is expected todrive future growth in professional beauty supply sales through an increase in the usage of haircolor and hair loss products. Additionally, continuously changing fashion-related trends that drivenew hair styles are expected to result in continued demand for hair styling products. Changes inconsumer tastes and fashion trends can impact our financial performance. Our continued success
2
depends in large part on our ability to anticipate, gauge and react in a timely and effective mannerto changes in consumer spending patterns and preferences for beauty products. We continuouslyadapt our marketing and merchandising initiatives for Sally Beauty Supply in an effort to expandour market reach or to respond to changing consumer preferences. If we are unable to anticipateand respond to trends in the marketplace for beauty products and changing consumer demands, ourbusiness could suffer.
• International growth strategies. A key element of our growth strategy depends on our ability tocapitalize on growth in the international marketplace and to grow our current level of non-U.S.operations. For example, on September 4, 2009, we acquired Distribuidora Intersalon Limitada(‘‘InterSalon’’), a leading distributor of premier beauty supply products with 16 stores located inChile and, in May of 2008, we acquired Pro-Duo, N.V., a cash and carry retailer of both professionaland retail hair products with 40 stores located mainly in Belgium, France and Spain. In addition, inFebruary of 2007, we acquired Chapelton 21 Limited, a private company based in Scotland withalmost 100 stores located in the United Kingdom, Ireland, Germany, and Spain. These acquisitionsprovided us with an initial presence in South America and furthered our expansion plans in Europe,both significant parts of Sally Beauty Supply’s international growth initiatives. We intend tocontinue to identify and evaluate non-U.S. acquisition targets. Our ability to grow our non-U.S.operations, integrate our new non-U.S. acquisitions and successfully pursue additional non-U.S.acquisitions may be affected by business, legal, regulatory and economic risks. Please see ‘‘RiskFactors—We may not be able to successfully identify acquisition candidates and complete desirableacquisitions,’’ ‘‘If we acquire any businesses in the future they could prove difficult to integrate,disrupt our business or have an adverse effect on our results of operations’’ and ‘‘Our ability toconduct business in international marketplaces may be affected by legal, regulatory and economicrisks’’ in Item 1A below.
• Continuing consolidation. There is continuing consolidation among professional beauty productdistributors and professional beauty product manufacturers. We plan to continue to examine waysin which we can benefit from this trend, including reviewing opportunities to shift business fromcompetitive distributors to the BSG network as well as seeking opportunistic, value-addedacquisitions which complement our long-term growth strategy. We believe that suppliers areincreasingly likely to focus on larger distributors and retailers with a broader scale and retailfootprint. We also believe that we are well positioned to capitalize on this trend as well asparticipate in the ongoing consolidation at the distributor/retail level. However, changes often occurin our relationships with suppliers that may materially affect the net sales and operating earnings ofour business segments. Consolidation among suppliers could exacerbate the effects of theserelationship changes and could increase pricing pressures. For example, as we announced inDecember of 2006, our largest supplier, L’Oreal, moved a material amount of revenue out of theBSG nationwide distribution network and into competitive regional distribution networks. Morerecently, L’Oreal acquired distributors competing with BSG in the southeastern and west coast ofthe U.S. and a supplier that does not currently do business with BSG. As a result, L’Oreal directlycompetes with BSG in certain geographic areas. If L’Oreal acquired other distributors or suppliersthat conduct significant business with BSG, we could lose related revenue. There can be noassurance that there will not be further loss of revenue over time by BSG (including within itsfranchise-based business) due to potential losses of additional products (both from L’Oreal andfrom other suppliers) as well as from the increased competition from L’Oreal-affiliated distributionnetworks. Please see ‘‘Risk Factors—The beauty products distribution industry is highly competitiveand is consolidating’’ and ‘‘We depend upon manufacturers who may be unable to provide productsof adequate quality or who may be unwilling to continue to supply products to us’’ in Item 1Abelow.
• Relationships with suppliers. Sally Beauty Supply/BSG and their suppliers are dependent on eachother for the distribution of beauty products. We do not manufacture the brand name or exclusive-
3
label products we sell. We purchase our products from a limited number of manufacturers. As istypical in distribution businesses, these relationships are subject to change from time to time(including the expansion or loss of distribution rights in various geographies and the addition or lossof product lines). Since we purchase products from many manufacturers on an at-will basis, undercontracts which can generally be terminated without cause upon 90 days’ notice or less or whichexpire without express rights of renewal, such manufacturers could discontinue sales to us at anytime or upon the expiration of the distribution period. Some of our contracts with manufacturersmay be terminated by such manufacturers if we fail to meet specified minimum purchaserequirements. In such cases, we do not have contractual assurances of continued supply, pricing oraccess to new products and vendors may change the terms upon which they sell. Infrequently, asupplier will seek to terminate a distribution relationship through legal action. Changes in ourrelationships with suppliers occur often and could positively or negatively impact our net sales andoperating profits. Although we focus on developing new revenue and cost management initiatives tomitigate the negative effects resulting from unfavorable changes in our supplier relationships, therecan be no assurance that our efforts will continue to completely offset the loss of these or otherdistribution rights. Please see ‘‘Risk Factors—We depend upon manufacturers who may be unableto provide products of adequate quality or who may be unwilling to continue to supply products tous’’ in Item 1A below.
We expect to continue to expand our product line offerings and to gain additional distribution rightsover time through either further negotiation with suppliers or by strategic acquisitions of existingdistributors. Although we are focused on developing new revenue and cost management initiatives,there can be no assurance that our efforts will partially or completely offset any potential loss ofdistribution rights in the future. Please see ‘‘Risk Factors—We depend upon manufacturers whomay be unable to provide products of adequate quality or who may be unwilling to continue tosupply products to us’’ in Item 1A below.
• High level of competition. Sally Beauty Supply competes with other domestic and internationalbeauty product wholesale and retail outlets, including local and regional open-line beauty supplystores, professional-only beauty supply stores, salons, mass merchandisers, drug stores andsupermarkets, as well as sellers on the internet and salons retailing hair care items. BSG competeswith other domestic and international beauty product wholesale and retail suppliers andmanufacturers selling professional beauty products directly to salons and individual salonprofessionals. We also face competition from authorized and unauthorized retailers and internetsites offering professional salon-only products. The increasing availability of unauthorizedprofessional salon products in large format retail stores such as drug stores, grocery stores andothers could also have a negative impact on our business. Please see ‘‘Risk Factors—The beautyproducts distribution industry is highly competitive and is consolidating’’ in Item 1A below.
• Economic conditions. We appeal to a wide demographic consumer profile and offer a broadselection of beauty products sold directly to retail consumers and salons and salon professionals.Historically, these factors have provided us with reduced exposure to downturns in economicconditions in the countries in which we operate. However, a continued downturn in the economy,especially for an extended period of time, could adversely impact consumer demand ofdiscretionary items such as beauty products and salon services, particularly affecting our electricalproducts category and our full-service sales business. In addition, higher freight costs resulting fromincreases in the cost of fuel, especially for an extended period of time, may impact our expenses atlevels that we cannot pass through to our customers. These factors could have a material adverseeffect on our business, financial condition and results of operations. Please see ‘‘Risk Factors—Afurther downturn in the economy may affect consumer purchases of discretionary items such asbeauty products and salon services, which could have a material adverse effect on our business,financial condition and results of operations’’ in Item 1A below.
4
• Controlling expenses. Another important aspect of our business is our ability to control costs,especially in our BSG business segment, by right-sizing the business and maximizing the efficiencyof our structure. During the past three years, we implemented a $22.0 million capital spendingprogram to consolidate warehouses and reduce administrative expenses related to BSG’sdistribution network optimization program. We estimate that this program resulted in cost savingsof approximately $8.0 million in the fiscal year 2009 and believe that annualized cost savings fromthis program could approximate $10.0 million beginning in fiscal year 2010. Please see ‘‘RiskFactors—We are not certain that our ongoing cost control plans will continue to be successful’’ inItem 1A below.
• Opening new stores. Our future growth strategy depends in part on our ability to open andprofitably operate new stores in existing and additional geographic areas. The capital requirementsto open a U.S.-based Sally Beauty Supply or BSG store, excluding inventory, average approximately$70,000 and $80,000, respectively, with the capital requirements for international stores costing lessor substantially more depending upon the marketplace. However, in response to economicconditions and to allow flexibility to capitalize on potential real estate revaluations in key locations,we have slowed our new store openings. We may not be able to open all of the new stores we plan toopen and any new stores we open may not be profitable, any of which could have a material adverseimpact on our financial condition or results of operations. Please see ‘‘Risk Factors—If we areunable to profitably open and operate new stores, our business, financial condition and results ofoperations may be adversely affected’’ in Item 1A below.
• Changes to our information technology systems. As our operations grow in both size and scope, wewill continuously need to improve and upgrade our information systems and infrastructure whilemaintaining the reliability and integrity of our systems and infrastructure. The expansion of oursystems and infrastructure will require us to commit substantial financial, operational and technicalresources in advance of any increase in the volume of our business, with no assurance that thevolume of business will increase. For example, in fiscal year 2009, we began upgrading ourdistribution information systems (in connection with our capital spending program to consolidatewarehouses, as discussed above), upgrading our AS400 iSeries servers and installing Hyperionsoftware to enhance our financial reporting system. These and any other required upgrades to ourinformation systems and information technology (or new technology), now or in the future, willrequire that our management and resources be diverted from our core business to assist incompletion of these projects. There can be no assurance that the time and resources ourmanagement will need to devote to these upgrades, service outages or delays due to the installationof any new or upgraded technology (and customer issues therewith), or the impact on the reliabilityof our data from any new or upgraded technology will not have a material adverse effect on ourfinancial reporting, business, financial condition or results of operations. Please see ‘‘Risk Factors—We may be adversely affected by any disruption in our information technology systems’’ in Item 1Abelow.
Business Segments, Geographic Area Information and Seasonality
We operate two business segments: (i) Sally Beauty Supply, an open-line and exclusive-label distributor ofprofessional beauty supplies offering professional beauty supplies to both retail consumers and salonprofessionals primarily in North America, Europe, Puerto Rico and South America, and (ii) BSG, afull-service beauty supply distributor offering professional brands directly to salons and salon professionalsthrough our own sales force and professional-only stores, many in exclusive geographical territories inNorth America. BSG operates stores under the CosmoProf service mark. BSG also franchises beautysupply outlets in the southwest portion of the U.S. and Mexico, and supplies sub-distributors in Europe.Sales of Sally Beauty Supply accounted for approximately 64%, 63% and 62%; and BSG accounted forapproximately 36%, 37% and 38% of the company’s consolidated net sales for the years endedSeptember 30, 2009, 2008 and 2007, respectively.
5
Financial information about business segments and geographic area information is incorporated herein byreference to the ‘‘Business Segments and Geographic Area Information,’’ Note 19 of the ‘‘Notes toConsolidated Financial Statements’’ in ‘‘Item 8—Financial Statements and Supplementary Data’’ of thisAnnual Report.
Neither the sales nor the product assortment for Sally Beauty Supply or BSG are generally seasonal innature.
Sally Beauty Supply
We believe Sally Beauty Supply is the largest open-line distributor of professional beauty supplies in theU.S. based on store count. As of September 30, 2009, Sally Beauty Supply operated 2,898 company-operated retail stores, 2,357 of which are located in the U.S. (with the remainder in the United Kingdomand certain other countries in Europe, Canada, Puerto Rico, Mexico and Chile), and supplied25 franchised stores (all outside the U.S.). Its stores carry an extensive selection of professional beautyproducts, ranging between 4,000 and 8,000 stock keeping units (or SKUs) of beauty products, and includesproducts for hair care, nail care, beauty sundries and small electrical appliances targeting retail consumersand salon professionals. Sally Beauty Supply stores carry leading third-party brands such as Clairol, Revlonand Conair, as well as an extensive selection of exclusive-label merchandise. We believe that Sally BeautySupply has differentiated itself from its competitors through its customer value proposition, attractivepricing, extensive selection of leading third-party branded and exclusive-label products, broad ethnicproduct selection, the product knowledge of its sales associates and convenient store locations.
Store Design and Operations
Sally Beauty Supply stores are designed to create an appealing shopping environment that embraces theretail consumer and salon professional and highlights its extensive product offering. Sally Beauty Supplystores average between 1,200 square feet and 1,700 square feet in size and are located primarily in stripshopping centers. Generally, Sally Beauty Supply stores follow a consistent format, allowing customersfamiliarity between Sally Beauty Supply locations.
Sally Beauty Supply stores are segmented into distinctive areas arranged by product type with signsallowing its customers to easily navigate through its stores. Sally Beauty Supply seeks to stimulate cross-selling and impulse buying through strategic product placement and use of the front of the store tohighlight new products and key promotional items.
Merchandise
Sally Beauty Supply stores carry a broad selection of branded and exclusive-label beauty supplies. SallyBeauty Supply manages each category by product and by SKU and uses centrally developed planoguides tomaintain a consistent merchandise presentation across its store base (primarily in the U.S. and Canada).Through its information systems, Sally Beauty Supply actively monitors each store’s performance bycategory, allowing it to maintain consistently high levels of in-stock merchandise. We believe Sally BeautySupply’s tailored merchandise strategy enables it to meet local demands and helps drive traffic in its stores.Additionally, its information systems enable it to track and automatically replenish inventory levels,generally on a weekly basis, primarily in the U.S.
Sally Beauty Supply offers a comprehensive ethnic product selection with specific appeal to African-American and Hispanic customers. Its ethnic product offerings are tailored by store based on marketdemographics and category performance. For example, sales of products targeted for the African-American marketplace represented approximately 9% of net sales in Sally Beauty Supply’s U.S. stores forfiscal year 2009. We believe the breadth of selection of ethnic products available in Sally Beauty Supplystores is unique and differentiates its stores from its competition. Sally Beauty Supply also aims to positionitself to be competitive in price, but not a discount leader.
6
Sally Beauty Supply’s pricing strategy is differentiated by customer segment. Professional salon customersare generally entitled to a price lower than that received by retail customers. However, Sally Beauty Supplydoes offer discounts to retail customers through its customer loyalty program.
Leading Third-Party Branded Products
Sally Beauty Supply offers an extensive selection of hair care products, nail care products, beauty sundriesand appliances from leading third-party brands such as Clairol, Revlon and Conair, as well as an extensiveselection of exclusive-label merchandise. We believe that carrying a broad selection of the latest premierbranded merchandise is critical to maintaining long-term relationships with our customers. Themerchandise Sally Beauty Supply carries includes products from one or more of the leading manufacturersin each category. Sally Beauty Supply’s objective is not only to carry leading brands, but also to carry a fullrange of branded and exclusive-label products within each category. As hair trends continue to evolve, weexpect to offer the changing professional beauty product assortment necessary to meet the needs of retailconsumers and salon professionals.
Exclusive-Label Products
Sally Beauty Supply offers a broad range of private label and controlled label products, which we generallyrefer to collectively as exclusive-label products, unless the context requires otherwise. Private labelproducts are brands manufactured under trademarks we own or license and in some instances we also ownthe formula. Controlled label products involve brands that are owned by the manufacturer, but for whichwe have been granted sole distribution rights. We believe exclusive-label products provide customers withan attractive alternative to higher-priced leading third-party brands. Exclusive-label products accounted forapproximately 42% of Sally Beauty Supply’s product sales in the U.S. during fiscal year 2009. Generally,the exclusive-label brands have higher gross margins than the leading third-party branded products, and webelieve this area offers continued potential growth. Sally Beauty Supply maintains exclusive-label productsin a number of categories including hair care, small electrical appliances and salon products. Sally BeautySupply actively promotes its exclusive-label brands through in-store promotions and monthly flyers. Webelieve our customers perceive these exclusive-label products to be comparable in quality and namerecognition to leading third-party branded products.
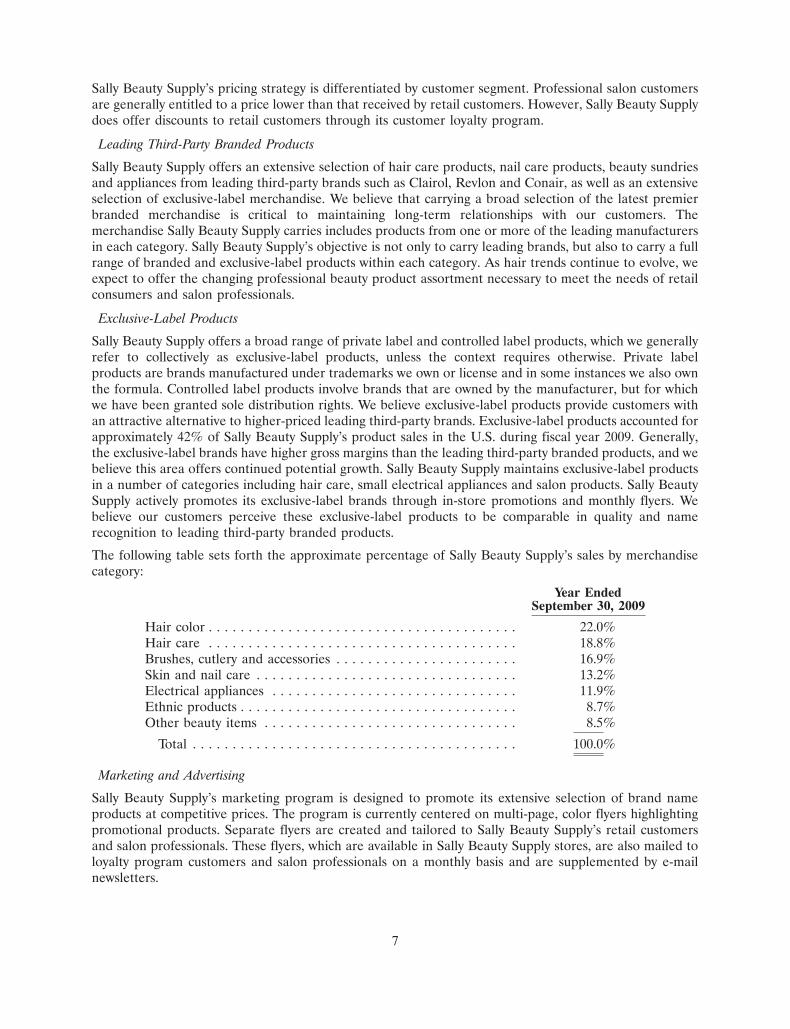
The following table sets forth the approximate percentage of Sally Beauty Supply’s sales by merchandisecategory:
Year EndedSeptember 30, 2009
Hair color . . . . . . . . . . . . . . . . . . . . . . . . . . . . . . . . . . . . . . . 22.0%Hair care . . . . . . . . . . . . . . . . . . . . . . . . . . . . . . . . . . . . . . . 18.8%Brushes, cutlery and accessories . . . . . . . . . . . . . . . . . . . . . . . 16.9%Skin and nail care . . . . . . . . . . . . . . . . . . . . . . . . . . . . . . . . . 13.2%Electrical appliances . . . . . . . . . . . . . . . . . . . . . . . . . . . . . . . 11.9%Ethnic products . . . . . . . . . . . . . . . . . . . . . . . . . . . . . . . . . . . 8.7%Other beauty items . . . . . . . . . . . . . . . . . . . . . . . . . . . . . . . . 8.5%
Total . . . . . . . . . . . . . . . . . . . . . . . . . . . . . . . . . . . . . . . . . 100.0%
Marketing and Advertising
Sally Beauty Supply’s marketing program is designed to promote its extensive selection of brand nameproducts at competitive prices. The program is currently centered on multi-page, color flyers highlightingpromotional products. Separate flyers are created and tailored to Sally Beauty Supply’s retail customersand salon professionals. These flyers, which are available in Sally Beauty Supply stores, are also mailed toloyalty program customers and salon professionals on a monthly basis and are supplemented by e-mailnewsletters.
7
We continuously adapt our marketing and merchandising initiatives for Sally Beauty Supply in an effort toexpand our market reach or to respond to changing consumer preferences.
Sally Beauty Supply’s customer loyalty and marketing programs allow Sally Beauty Supply to collectpoint-of-sale customer data and increase our understanding of customers’ needs. The Sally ‘‘Beauty Club’’is a loyalty program for customers who are not salon professionals. Beauty Club members, after paying anominal annual fee, receive a special, discounted price on almost every non-sale item. Members are alsoeligible for a special Beauty Club e-mail newsletter that contains additional savings, beauty tips, newproduct information and coupons. In addition, the ‘‘ProCard’’ is a marketing program for licensed salonprofessionals. ProCard members receive discounts on all beauty products sold at Sally Beauty Supplystores. We believe these programs are effective in developing and maintaining customer relationships.
Store Locations
Sally Beauty Supply selects geographic areas and store sites on the basis of demographic information,quality and nature of neighboring tenants, store visibility and location accessibility. Sally Beauty Supplyseeks to locate stores primarily in strip malls, which are occupied by other high traffic retailers includinggrocery stores, mass merchants and home centers.
Sally Beauty Supply balances its store expansion between new and existing marketplaces. In its existingmarketplaces, Sally Beauty Supply adds stores as necessary to provide additional coverage. In newmarketplaces, Sally Beauty Supply generally seeks to expand in geographically contiguous areas to leverageits experience. We believe that Sally Beauty Supply’s knowledge of local marketplaces is an important partof its success.
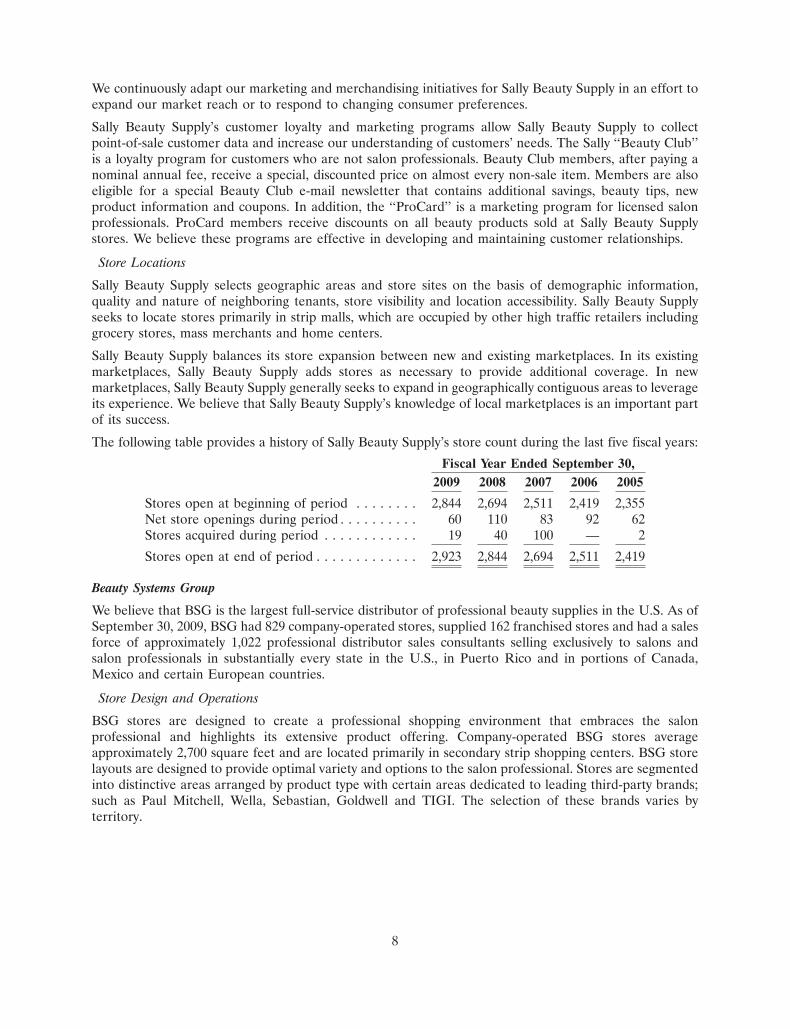
The following table provides a history of Sally Beauty Supply’s store count during the last five fiscal years:
Fiscal Year Ended September 30,2009 2008 2007 2006 2005
Stores open at beginning of period . . . . . . . . 2,844 2,694 2,511 2,419 2,355Net store openings during period . . . . . . . . . . 60 110 83 92 62Stores acquired during period . . . . . . . . . . . . 19 40 100 — 2
Stores open at end of period . . . . . . . . . . . . . 2,923 2,844 2,694 2,511 2,419
Beauty Systems Group
We believe that BSG is the largest full-service distributor of professional beauty supplies in the U.S. As ofSeptember 30, 2009, BSG had 829 company-operated stores, supplied 162 franchised stores and had a salesforce of approximately 1,022 professional distributor sales consultants selling exclusively to salons andsalon professionals in substantially every state in the U.S., in Puerto Rico and in portions of Canada,Mexico and certain European countries.
Store Design and Operations
BSG stores are designed to create a professional shopping environment that embraces the salonprofessional and highlights its extensive product offering. Company-operated BSG stores averageapproximately 2,700 square feet and are located primarily in secondary strip shopping centers. BSG storelayouts are designed to provide optimal variety and options to the salon professional. Stores are segmentedinto distinctive areas arranged by product type with certain areas dedicated to leading third-party brands;such as Paul Mitchell, Wella, Sebastian, Goldwell and TIGI. The selection of these brands varies byterritory.
8
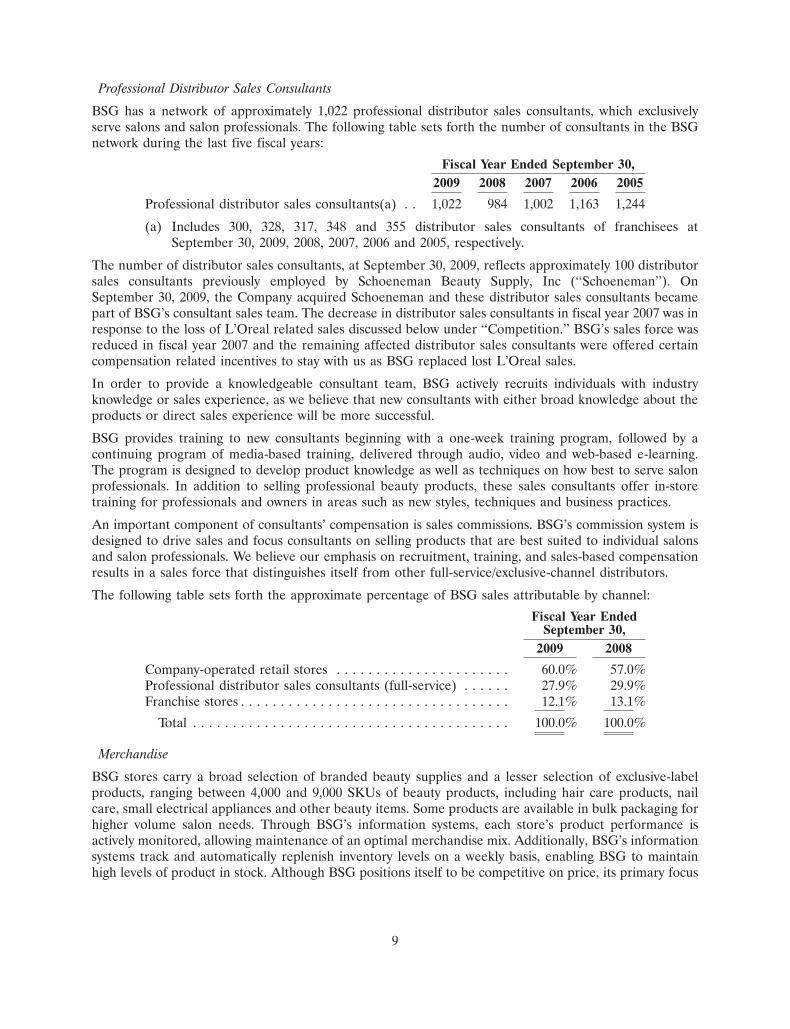
Professional Distributor Sales Consultants
BSG has a network of approximately 1,022 professional distributor sales consultants, which exclusivelyserve salons and salon professionals. The following table sets forth the number of consultants in the BSGnetwork during the last five fiscal years:
Fiscal Year Ended September 30,2009 2008 2007 2006 2005
Professional distributor sales consultants(a) . . 1,022 984 1,002 1,163 1,244
(a) Includes 300, 328, 317, 348 and 355 distributor sales consultants of franchisees atSeptember 30, 2009, 2008, 2007, 2006 and 2005, respectively.
The number of distributor sales consultants, at September 30, 2009, reflects approximately 100 distributorsales consultants previously employed by Schoeneman Beauty Supply, Inc (‘‘Schoeneman’’). OnSeptember 30, 2009, the Company acquired Schoeneman and these distributor sales consultants becamepart of BSG’s consultant sales team. The decrease in distributor sales consultants in fiscal year 2007 was inresponse to the loss of L’Oreal related sales discussed below under ‘‘Competition.’’ BSG’s sales force wasreduced in fiscal year 2007 and the remaining affected distributor sales consultants were offered certaincompensation related incentives to stay with us as BSG replaced lost L’Oreal sales.
In order to provide a knowledgeable consultant team, BSG actively recruits individuals with industryknowledge or sales experience, as we believe that new consultants with either broad knowledge about theproducts or direct sales experience will be more successful.
BSG provides training to new consultants beginning with a one-week training program, followed by acontinuing program of media-based training, delivered through audio, video and web-based e-learning.The program is designed to develop product knowledge as well as techniques on how best to serve salonprofessionals. In addition to selling professional beauty products, these sales consultants offer in-storetraining for professionals and owners in areas such as new styles, techniques and business practices.
An important component of consultants’ compensation is sales commissions. BSG’s commission system isdesigned to drive sales and focus consultants on selling products that are best suited to individual salonsand salon professionals. We believe our emphasis on recruitment, training, and sales-based compensationresults in a sales force that distinguishes itself from other full-service/exclusive-channel distributors.
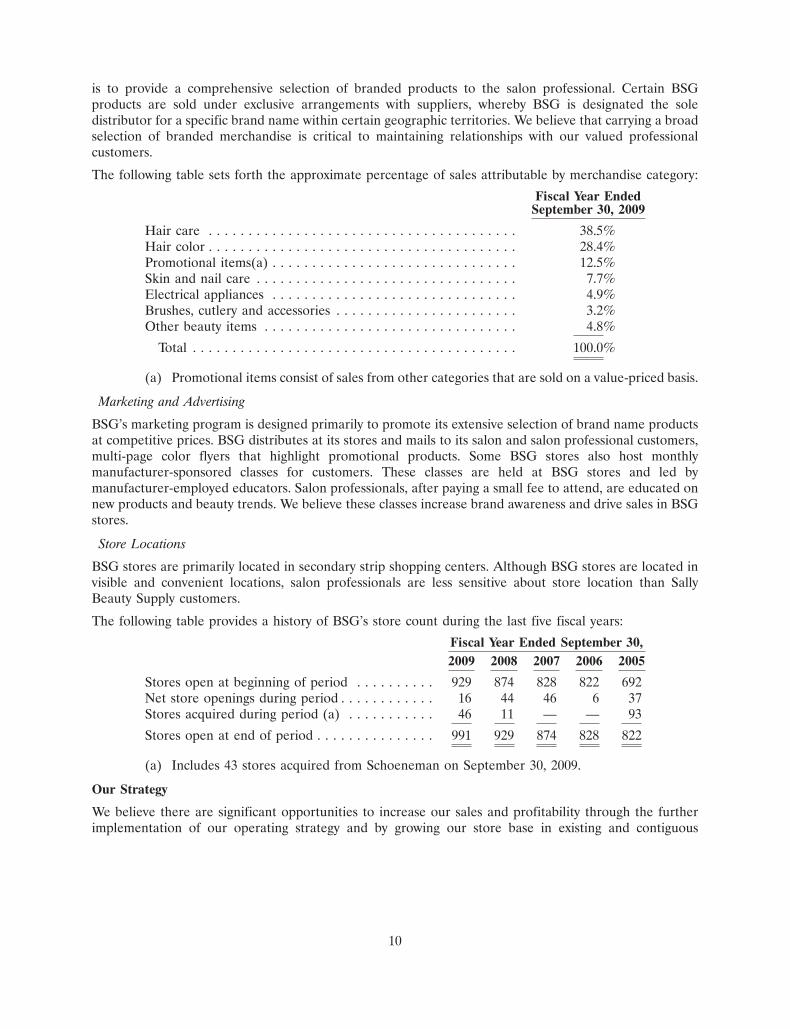
The following table sets forth the approximate percentage of BSG sales attributable by channel:
Fiscal Year EndedSeptember 30,
2009 2008
Company-operated retail stores . . . . . . . . . . . . . . . . . . . . . . 60.0% 57.0%Professional distributor sales consultants (full-service) . . . . . . 27.9% 29.9%Franchise stores . . . . . . . . . . . . . . . . . . . . . . . . . . . . . . . . . . 12.1% 13.1%
Total . . . . . . . . . . . . . . . . . . . . . . . . . . . . . . . . . . . . . . . . 100.0% 100.0%
Merchandise
BSG stores carry a broad selection of branded beauty supplies and a lesser selection of exclusive-labelproducts, ranging between 4,000 and 9,000 SKUs of beauty products, including hair care products, nailcare, small electrical appliances and other beauty items. Some products are available in bulk packaging forhigher volume salon needs. Through BSG’s information systems, each store’s product performance isactively monitored, allowing maintenance of an optimal merchandise mix. Additionally, BSG’s informationsystems track and automatically replenish inventory levels on a weekly basis, enabling BSG to maintainhigh levels of product in stock. Although BSG positions itself to be competitive on price, its primary focus
9
is to provide a comprehensive selection of branded products to the salon professional. Certain BSGproducts are sold under exclusive arrangements with suppliers, whereby BSG is designated the soledistributor for a specific brand name within certain geographic territories. We believe that carrying a broadselection of branded merchandise is critical to maintaining relationships with our valued professionalcustomers.
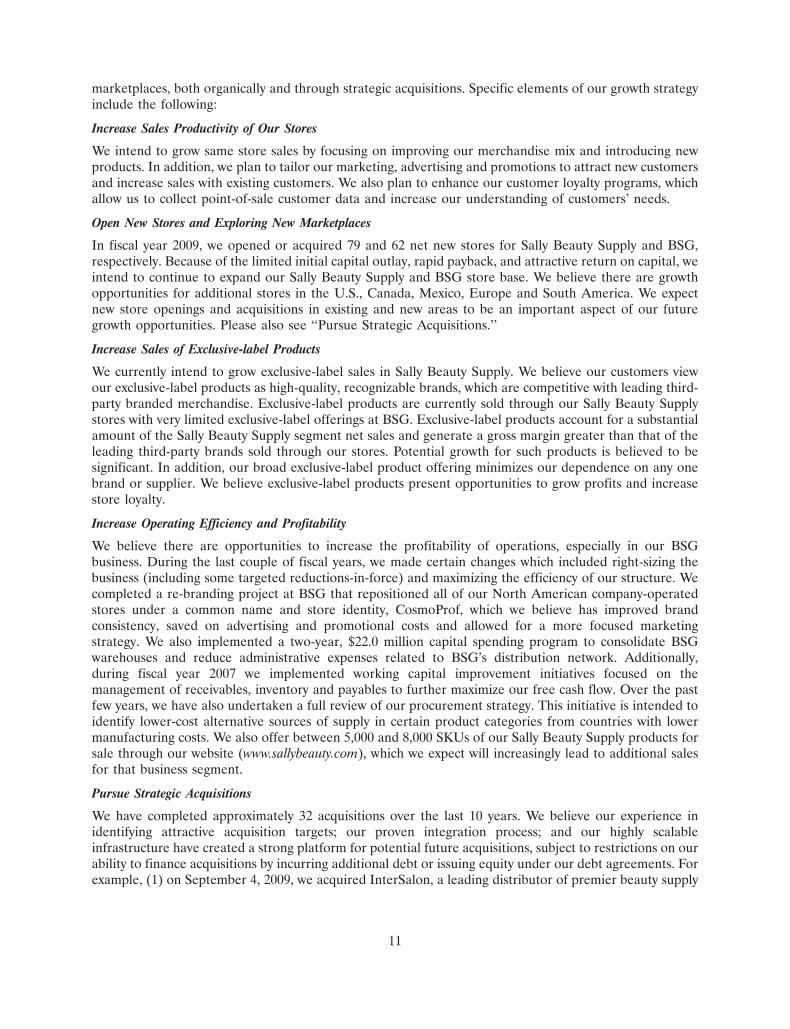
The following table sets forth the approximate percentage of sales attributable by merchandise category:
Fiscal Year EndedSeptember 30, 2009
Hair care . . . . . . . . . . . . . . . . . . . . . . . . . . . . . . . . . . . . . . . 38.5%Hair color . . . . . . . . . . . . . . . . . . . . . . . . . . . . . . . . . . . . . . . 28.4%Promotional items(a) . . . . . . . . . . . . . . . . . . . . . . . . . . . . . . . 12.5%Skin and nail care . . . . . . . . . . . . . . . . . . . . . . . . . . . . . . . . . 7.7%Electrical appliances . . . . . . . . . . . . . . . . . . . . . . . . . . . . . . . 4.9%Brushes, cutlery and accessories . . . . . . . . . . . . . . . . . . . . . . . 3.2%Other beauty items . . . . . . . . . . . . . . . . . . . . . . . . . . . . . . . . 4.8%
Total . . . . . . . . . . . . . . . . . . . . . . . . . . . . . . . . . . . . . . . . . 100.0%
(a) Promotional items consist of sales from other categories that are sold on a value-priced basis.
Marketing and Advertising
BSG’s marketing program is designed primarily to promote its extensive selection of brand name productsat competitive prices. BSG distributes at its stores and mails to its salon and salon professional customers,multi-page color flyers that highlight promotional products. Some BSG stores also host monthlymanufacturer-sponsored classes for customers. These classes are held at BSG stores and led bymanufacturer-employed educators. Salon professionals, after paying a small fee to attend, are educated onnew products and beauty trends. We believe these classes increase brand awareness and drive sales in BSGstores.
Store Locations
BSG stores are primarily located in secondary strip shopping centers. Although BSG stores are located invisible and convenient locations, salon professionals are less sensitive about store location than SallyBeauty Supply customers.
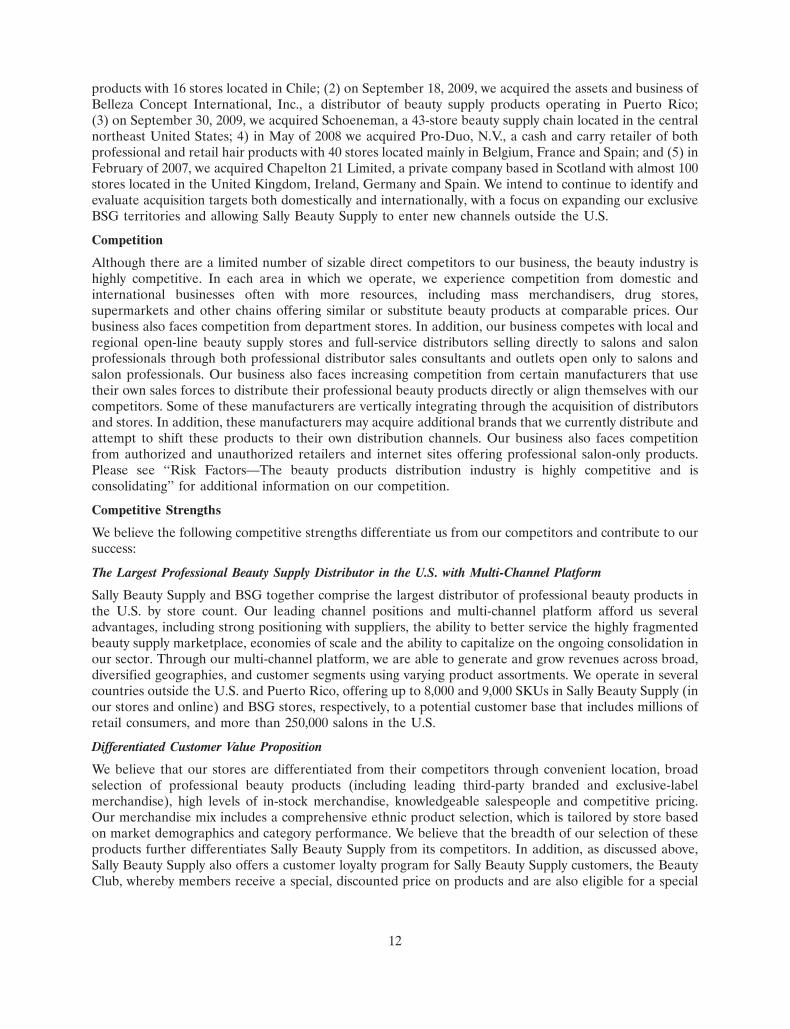
The following table provides a history of BSG’s store count during the last five fiscal years:
Fiscal Year Ended September 30,2009 2008 2007 2006 2005
Stores open at beginning of period . . . . . . . . . . 929 874 828 822 692Net store openings during period . . . . . . . . . . . . 16 44 46 6 37Stores acquired during period (a) . . . . . . . . . . . 46 11 — — 93
Stores open at end of period . . . . . . . . . . . . . . . 991 929 874 828 822
(a) Includes 43 stores acquired from Schoeneman on September 30, 2009.
Our Strategy
We believe there are significant opportunities to increase our sales and profitability through the furtherimplementation of our operating strategy and by growing our store base in existing and contiguous
10
marketplaces, both organically and through strategic acquisitions. Specific elements of our growth strategyinclude the following:
Increase Sales Productivity of Our Stores
We intend to grow same store sales by focusing on improving our merchandise mix and introducing newproducts. In addition, we plan to tailor our marketing, advertising and promotions to attract new customersand increase sales with existing customers. We also plan to enhance our customer loyalty programs, whichallow us to collect point-of-sale customer data and increase our understanding of customers’ needs.
Open New Stores and Exploring New Marketplaces
In fiscal year 2009, we opened or acquired 79 and 62 net new stores for Sally Beauty Supply and BSG,respectively. Because of the limited initial capital outlay, rapid payback, and attractive return on capital, weintend to continue to expand our Sally Beauty Supply and BSG store base. We believe there are growthopportunities for additional stores in the U.S., Canada, Mexico, Europe and South America. We expectnew store openings and acquisitions in existing and new areas to be an important aspect of our futuregrowth opportunities. Please also see ‘‘Pursue Strategic Acquisitions.’’
Increase Sales of Exclusive-label Products
We currently intend to grow exclusive-label sales in Sally Beauty Supply. We believe our customers viewour exclusive-label products as high-quality, recognizable brands, which are competitive with leading third-party branded merchandise. Exclusive-label products are currently sold through our Sally Beauty Supplystores with very limited exclusive-label offerings at BSG. Exclusive-label products account for a substantialamount of the Sally Beauty Supply segment net sales and generate a gross margin greater than that of theleading third-party brands sold through our stores. Potential growth for such products is believed to besignificant. In addition, our broad exclusive-label product offering minimizes our dependence on any onebrand or supplier. We believe exclusive-label products present opportunities to grow profits and increasestore loyalty.
Increase Operating Efficiency and Profitability
We believe there are opportunities to increase the profitability of operations, especially in our BSGbusiness. During the last couple of fiscal years, we made certain changes which included right-sizing thebusiness (including some targeted reductions-in-force) and maximizing the efficiency of our structure. Wecompleted a re-branding project at BSG that repositioned all of our North American company-operatedstores under a common name and store identity, CosmoProf, which we believe has improved brandconsistency, saved on advertising and promotional costs and allowed for a more focused marketingstrategy. We also implemented a two-year, $22.0 million capital spending program to consolidate BSGwarehouses and reduce administrative expenses related to BSG’s distribution network. Additionally,during fiscal year 2007 we implemented working capital improvement initiatives focused on themanagement of receivables, inventory and payables to further maximize our free cash flow. Over the pastfew years, we have also undertaken a full review of our procurement strategy. This initiative is intended toidentify lower-cost alternative sources of supply in certain product categories from countries with lowermanufacturing costs. We also offer between 5,000 and 8,000 SKUs of our Sally Beauty Supply products forsale through our website (www.sallybeauty.com), which we expect will increasingly lead to additional salesfor that business segment.
Pursue Strategic Acquisitions
We have completed approximately 32 acquisitions over the last 10 years. We believe our experience inidentifying attractive acquisition targets; our proven integration process; and our highly scalableinfrastructure have created a strong platform for potential future acquisitions, subject to restrictions on ourability to finance acquisitions by incurring additional debt or issuing equity under our debt agreements. Forexample, (1) on September 4, 2009, we acquired InterSalon, a leading distributor of premier beauty supply
11
products with 16 stores located in Chile; (2) on September 18, 2009, we acquired the assets and business ofBelleza Concept International, Inc., a distributor of beauty supply products operating in Puerto Rico;(3) on September 30, 2009, we acquired Schoeneman, a 43-store beauty supply chain located in the centralnortheast United States; 4) in May of 2008 we acquired Pro-Duo, N.V., a cash and carry retailer of bothprofessional and retail hair products with 40 stores located mainly in Belgium, France and Spain; and (5) inFebruary of 2007, we acquired Chapelton 21 Limited, a private company based in Scotland with almost 100stores located in the United Kingdom, Ireland, Germany and Spain. We intend to continue to identify andevaluate acquisition targets both domestically and internationally, with a focus on expanding our exclusiveBSG territories and allowing Sally Beauty Supply to enter new channels outside the U.S.
Competition
Although there are a limited number of sizable direct competitors to our business, the beauty industry ishighly competitive. In each area in which we operate, we experience competition from domestic andinternational businesses often with more resources, including mass merchandisers, drug stores,supermarkets and other chains offering similar or substitute beauty products at comparable prices. Ourbusiness also faces competition from department stores. In addition, our business competes with local andregional open-line beauty supply stores and full-service distributors selling directly to salons and salonprofessionals through both professional distributor sales consultants and outlets open only to salons andsalon professionals. Our business also faces increasing competition from certain manufacturers that usetheir own sales forces to distribute their professional beauty products directly or align themselves with ourcompetitors. Some of these manufacturers are vertically integrating through the acquisition of distributorsand stores. In addition, these manufacturers may acquire additional brands that we currently distribute andattempt to shift these products to their own distribution channels. Our business also faces competitionfrom authorized and unauthorized retailers and internet sites offering professional salon-only products.Please see ‘‘Risk Factors—The beauty products distribution industry is highly competitive and isconsolidating’’ for additional information on our competition.
Competitive Strengths
We believe the following competitive strengths differentiate us from our competitors and contribute to oursuccess:
The Largest Professional Beauty Supply Distributor in the U.S. with Multi-Channel Platform
Sally Beauty Supply and BSG together comprise the largest distributor of professional beauty products inthe U.S. by store count. Our leading channel positions and multi-channel platform afford us severaladvantages, including strong positioning with suppliers, the ability to better service the highly fragmentedbeauty supply marketplace, economies of scale and the ability to capitalize on the ongoing consolidation inour sector. Through our multi-channel platform, we are able to generate and grow revenues across broad,diversified geographies, and customer segments using varying product assortments. We operate in severalcountries outside the U.S. and Puerto Rico, offering up to 8,000 and 9,000 SKUs in Sally Beauty Supply (inour stores and online) and BSG stores, respectively, to a potential customer base that includes millions ofretail consumers, and more than 250,000 salons in the U.S.
Differentiated Customer Value Proposition
We believe that our stores are differentiated from their competitors through convenient location, broadselection of professional beauty products (including leading third-party branded and exclusive-labelmerchandise), high levels of in-stock merchandise, knowledgeable salespeople and competitive pricing.Our merchandise mix includes a comprehensive ethnic product selection, which is tailored by store basedon market demographics and category performance. We believe that the breadth of our selection of theseproducts further differentiates Sally Beauty Supply from its competitors. In addition, as discussed above,Sally Beauty Supply also offers a customer loyalty program for Sally Beauty Supply customers, the BeautyClub, whereby members receive a special, discounted price on products and are also eligible for a special
12
Beauty Club e-mail newsletter with additional promotional offerings, beauty tips and new productinformation for a nominal annual fee. We believe that our differentiated customer value proposition andstrong brands drive customer loyalty and high repeat traffic, contributing to our consistent historicalfinancial performance. Our BSG professional distributor sales consultants benefit from their customershaving access to the BSG store systems as customers have the ability to pick up the products they needbetween sales visits from professional distributor sales consultants.
Attractive Store Economics
We believe that our stores generate attractive returns on invested capital. The capital requirements to opena U.S.-based Sally Beauty Supply or BSG store, excluding inventory, average approximately $70,000 and$80,000, respectively, with the capital requirements for international stores costing less or substantiallymore depending upon the marketplace. Sally Beauty Supply stores average between 1,200 square feet and1,700 square feet and BSG stores average approximately 2,700 square feet in size. Domestically, our storesare typically located within strip shopping centers. Strong average sales per square foot combined withminimal staffing requirements, low rent expense and limited initial capital outlay typically result in positivecontribution margins within a few months, and cash payback on investment within approximately twoyears. Due to such attractive investment returns and relatively high operating profit contributions perstore, during the past five years Sally Beauty Supply and BSG have opened an aggregate of 407 and 149 netnew stores, respectively, excluding the effect of acquisitions.
Consistent Financial Performance
We have a proven track record of strong growth and consistent profitability due to superior operatingperformance, new store openings and strategic acquisitions. Over the past five fiscal years, ourconsolidated same store sales growth has been positive in each year and has averaged 2.7%, as set forth inthe following table:
Year Ended September 30,Same store sales growth(a) 2009 2008 2007 2006 2005
Sally Beauty Supply . . . . . . . . . . . . . . . . . . . . 2.1% 1.2% 2.7% 2.4% 2.4%Beauty Systems Group . . . . . . . . . . . . . . . . . . 1.0% 6.9% 10.1% 4.1% (0.6%)
Consolidated . . . . . . . . . . . . . . . . . . . . . . . . 1.8% 2.6% 4.5% 2.8% 1.8%
(a) Same stores are defined as company-operated stores that have been open for at least14 months as of the last day of a month. Our internet site has generated sales for at least14 months and, accordingly, internet-based sales are included in same store sales for fiscalyear 2009.
Experienced Management Team with a Proven Track Record
Our management team, led by President and Chief Executive Officer Gary Winterhalter, has a strongrecord of performance.
Customer Service
We strive to complement our extensive merchandise selection and innovative store design with superiorcustomer service. We actively recruit individuals with cosmetology experience because we believe that suchindividuals are more knowledgeable about the products they sell. Additionally, Sally Beauty Supply recruitsindividuals with retail experience because we believe their general retail knowledge can be leveraged in thebeauty supply industry. We believe that employees’ knowledge of the products and ability to demonstrateand explain the advantages of the products increases sales and that their prompt, knowledgeable servicefosters the confidence and loyalty of customers and differentiates our business from other professionalbeauty supply distributors.
13
We emphasize product knowledge during initial training as well as during ongoing training sessions, withprograms intended to provide new associates and managers with significant training. The trainingprograms encompass operational and product training and are designed to increase employee and storeproductivity. Store employees are also required to participate in training on an ongoing basis to keepup-to-date on products and operational practices.
Most of our stores are staffed with a store manager, and two or three full-time or part-time associates.BSG stores are generally also staffed with an assistant manager. The operations of each store aresupervised by a district manager, who reports to a territory manager. A significant number of our storemanagers and assistant managers are licensed in the cosmetology field. Additionally, in certain geographicareas in the U.S., a significant number of our store personnel, including store managers and assistantmanagers, speak Spanish as a second language. We believe that these skills enhance our store personnel’sability to serve our customers.
Relationships with Suppliers
We purchase our merchandise directly from manufacturers through supply contracts and by purchaseorders. For the fiscal year 2009, our five largest suppliers, Procter & Gamble, the Professional ProductsDivision of L’Oreal USA S/D, Inc., or L’Oreal, Conair Corporation, Shiseido Cosmetic (America) Limited,and John Paul Mitchell Systems, accounted for approximately 40% of our consolidated merchandisepurchases. Products are purchased from these and many manufacturers on an at-will basis or undercontracts which can be terminated without cause upon 90 days notice or less or expire without expressrights of renewal. Such manufacturers could discontinue sales to us at any time or upon short notice. If anyof these suppliers discontinued selling or were unable to continue selling to us, there could be a materialadverse effect on our consolidated results of operations.
As is typical in the distribution businesses, relationships with suppliers are subject to change from time totime (including the expansion or loss of distribution rights in various geographies and the addition or lossof products lines). Changes in our relationships with suppliers occur often, and could positively ornegatively impact our net sales and operating profits. Please see ‘‘Risk Factors—We depend uponmanufacturers who may be unable to provide products of adequate quality or who may be unwilling tocontinue to supply products to us.’’ However, we believe that we can be successful in mitigating negativeeffects resulting from unfavorable changes in the relationships between us and our suppliers through,among other things, the development of new or expanded supplier relationships.
Distribution
As of September 30, 2009, we operated 16 distribution centers, seven of which serviced Sally Beauty Supplyand nine of which serviced BSG. During the past three years, we implemented a capital spending programto consolidate warehouses and reduce administrative expenses related to BSG’s distribution networkoptimization program. Total capital expenditures were approximately $22.0 million and related expenseswere approximately $5.0 million for this program. We believe that annual savings from this program couldapproximate $10.0 million beginning with fiscal year 2010.
Our purchasing and distribution system is designed to minimize the delivered cost of merchandise andmaximize the level of merchandise in-stock in stores. This distribution system also allows for monitoring ofdelivery times and maintenance of appropriate inventory levels. Product deliveries are typically made toour stores on a weekly basis. Each distribution center has a quality control department that monitorsproducts received from suppliers. We utilize proprietary software systems to provide computerizedwarehouse locator and inventory support. Please see ‘‘Risk Factors—We are not certain that our ongoingcost control plans will continue to be successful.’’
Management Information Systems
Our management information systems provide order processing, accounting and management informationfor the marketing, distribution and store operations functions of our business. A significant portion of
14
these systems have been developed internally. The information gathered by the management informationsystems supports automatic replenishment of in-store inventory and provides support for product purchasedecisions. Please see ‘‘Risk Factors—We may be adversely affected by any disruption in our informationtechnology systems.’’
Employees
In our domestic and foreign operations, we had approximately 22,410 employees as of September 30, 2009;consisting of approximately 6,480 salaried, 4,930 hourly and 11,000 part-time employees. We hadapproximately 21,140 employees as of September 30, 2008; consisting of approximately 5,850 salaried,4,710 hourly and 10,580 part-time employees. Part-time employees are used to supplement schedules,particularly in North America. The number of employees at September 30, 2009, includes approximately600 persons employed by Schoeneman and approximately 100 persons employed by InterSalon.
Certain subsidiaries in Mexico have collective bargaining agreements covering warehouse and storepersonnel which expire at various times over the next several years. We believe that we have goodrelationships with our employees worldwide.
Management
For information concerning our directors and executive officers, please see ‘‘Directors and ExecutiveOfficers of the Registrant’’ in Item 10 of this Annual Report.
Regulation
We are subject to a wide variety of laws and regulations, which historically have not had a material effecton our business. For example, in the U.S., most of the products sold and the content and methods ofadvertising and marketing utilized are regulated by a host of federal agencies, including, in each case, oneor more of the following: the Food and Drug Administration, or FDA, the Federal Trade Commission, orFTC, and the Consumer Products Safety Commission. The transportation and disposal of many of ourproducts are also subject to federal regulation. State and local agencies regulate many aspects of ourbusiness. In marketplaces outside of the U.S., regulation is also comprehensive and focused upon labelingand safety issues.
Sally Beauty Supply supplies 25 and BSG supplies 162 franchised stores located in the U.S., Mexico andcertain countries in Europe. As a result of these franchisor-franchisee relationships, we are subject toregulation when offering and selling franchises in the applicable countries. The applicable laws andregulations affect our business practices, as franchisor, in a number of ways, including restrictions placedupon the offering, renewal, termination and disapproval of assignment of franchises. To date, these lawsand regulations have not had a material effect upon operations.
Trademarks and Other Intellectual Property Rights
Our trademarks, certain of which are material to our business, are registered or legally protected in theU.S., Canada and other countries throughout the world in which we operate. Our subsidiaries and we ownover 238 trademark registrations in the U.S., and 800 trademark registrations outside the U.S. We also relyupon trade secrets and know-how to develop and maintain our competitive position. We protectintellectual property rights through a variety of methods, including reliance upon trademark, patent andtrade secret laws and confidentiality agreements with many vendors, employees, consultants and otherswho have access to our proprietary information. The duration of our trademark registrations is generally10 or 15 years, depending on the country in which a mark is registered, and generally the registrations canbe renewed. The scope and duration of intellectual property protection varies by jurisdiction and byindividual product.
15
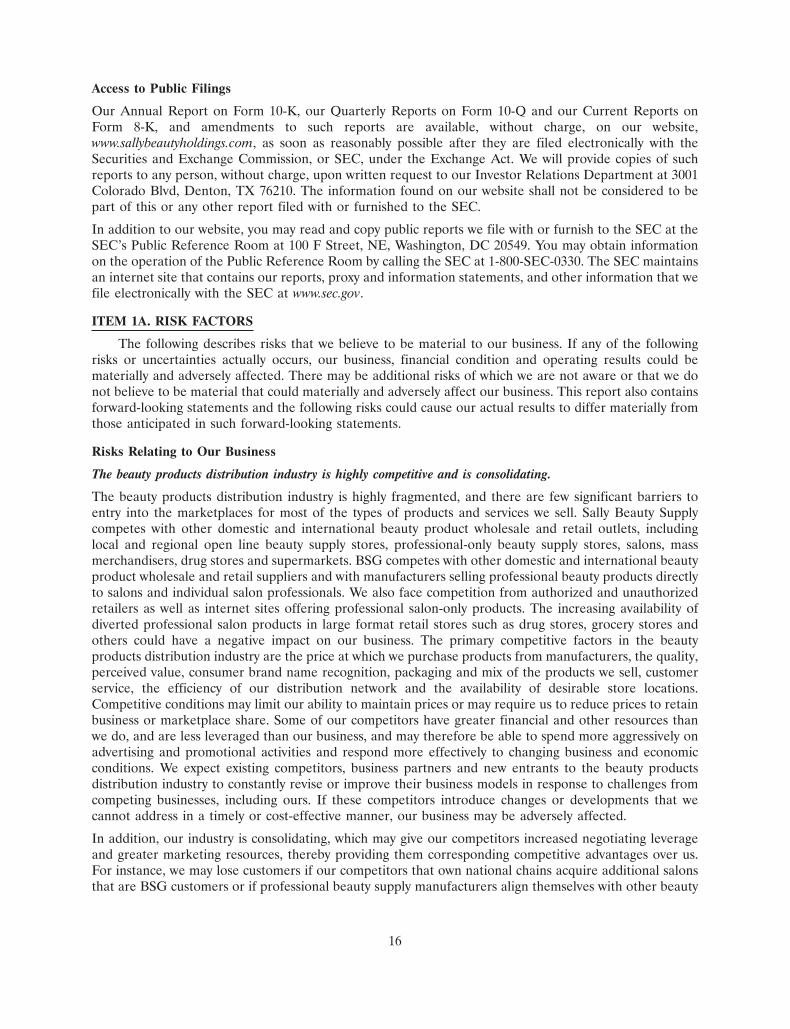
Access to Public Filings
Our Annual Report on Form 10-K, our Quarterly Reports on Form 10-Q and our Current Reports onForm 8-K, and amendments to such reports are available, without charge, on our website,www.sallybeautyholdings.com, as soon as reasonably possible after they are filed electronically with theSecurities and Exchange Commission, or SEC, under the Exchange Act. We will provide copies of suchreports to any person, without charge, upon written request to our Investor Relations Department at 3001Colorado Blvd, Denton, TX 76210. The information found on our website shall not be considered to bepart of this or any other report filed with or furnished to the SEC.
In addition to our website, you may read and copy public reports we file with or furnish to the SEC at theSEC’s Public Reference Room at 100 F Street, NE, Washington, DC 20549. You may obtain informationon the operation of the Public Reference Room by calling the SEC at 1-800-SEC-0330. The SEC maintainsan internet site that contains our reports, proxy and information statements, and other information that wefile electronically with the SEC at www.sec.gov.
ITEM 1A. RISK FACTORS
The following describes risks that we believe to be material to our business. If any of the followingrisks or uncertainties actually occurs, our business, financial condition and operating results could bematerially and adversely affected. There may be additional risks of which we are not aware or that we donot believe to be material that could materially and adversely affect our business. This report also containsforward-looking statements and the following risks could cause our actual results to differ materially fromthose anticipated in such forward-looking statements.
Risks Relating to Our Business
The beauty products distribution industry is highly competitive and is consolidating.
The beauty products distribution industry is highly fragmented, and there are few significant barriers toentry into the marketplaces for most of the types of products and services we sell. Sally Beauty Supplycompetes with other domestic and international beauty product wholesale and retail outlets, includinglocal and regional open line beauty supply stores, professional-only beauty supply stores, salons, massmerchandisers, drug stores and supermarkets. BSG competes with other domestic and international beautyproduct wholesale and retail suppliers and with manufacturers selling professional beauty products directlyto salons and individual salon professionals. We also face competition from authorized and unauthorizedretailers as well as internet sites offering professional salon-only products. The increasing availability ofdiverted professional salon products in large format retail stores such as drug stores, grocery stores andothers could have a negative impact on our business. The primary competitive factors in the beautyproducts distribution industry are the price at which we purchase products from manufacturers, the quality,perceived value, consumer brand name recognition, packaging and mix of the products we sell, customerservice, the efficiency of our distribution network and the availability of desirable store locations.Competitive conditions may limit our ability to maintain prices or may require us to reduce prices to retainbusiness or marketplace share. Some of our competitors have greater financial and other resources thanwe do, and are less leveraged than our business, and may therefore be able to spend more aggressively onadvertising and promotional activities and respond more effectively to changing business and economicconditions. We expect existing competitors, business partners and new entrants to the beauty productsdistribution industry to constantly revise or improve their business models in response to challenges fromcompeting businesses, including ours. If these competitors introduce changes or developments that wecannot address in a timely or cost-effective manner, our business may be adversely affected.
In addition, our industry is consolidating, which may give our competitors increased negotiating leverageand greater marketing resources, thereby providing them corresponding competitive advantages over us.For instance, we may lose customers if our competitors that own national chains acquire additional salonsthat are BSG customers or if professional beauty supply manufacturers align themselves with other beauty
16
product wholesale and retail suppliers who compete with BSG. For example, BSG’s largest supplier,L’Oreal, has moved a material amount of revenue out of the BSG nationwide distribution network andinto competitive regional distribution networks. L’Oreal has also acquired one supplier (that does notcurrently do business with BSG) and distributors competitive with BSG in the southeastern U.S. as well asthe west coast of the U.S. As a result, L’Oreal entered into direct competition with BSG and there can beno assurance that there will not be further revenue losses over time at BSG, due to potential losses ofadditional L’Oreal related products as well as from the increased competition from L’Oreal-affiliateddistribution networks. If L’Oreal were to acquire a supplier that conducted business with BSG, we couldlose that revenue as well. Such consolidation may increase competition from distribution channels relatedto suppliers and place more leverage in the hands of those suppliers to negotiate better margins onproducts sold in our stores.
If we are unable to compete effectively in our marketplace or if competitors divert our customers awayfrom our stores, it would adversely impact our business, financial condition and results of operations.
We may be unable to anticipate changes in consumer preferences and buying trends or manage our productlines and inventory commensurate with consumer demand.
Our success depends in part on our ability to anticipate, gauge and react in a timely manner to changes inconsumer spending patterns and preferences for beauty products. If we do not anticipate and respond totrends in the marketplace for beauty products and changing consumer demands in a timely manner, oursales may decline significantly and we may be required to mark down certain products to sell the resultingexcess inventory at prices which can be significantly lower than the normal retail or wholesale price, whichcould adversely impact our business, financial condition and results of operations. In addition, we dependon our inventory management and information technology systems in order to replenish inventories anddeliver products to store locations in response to customer demands. Any systems-related problems couldresult in difficulties satisfying the demands of customers which, in turn, could adversely affect our sales andprofitability.
We expect the aging baby boomer population to drive future growth in professional beauty supply salesthrough an increase in the use of hair color and hair loss products. Additionally, we expect continuouslychanging fashion-related trends that drive new hair styles to result in continued demand for hair stylingproducts. Changes in consumer tastes and fashion trends can have an impact on our financial performance.If we are unable to anticipate and respond to trends in the marketplace for beauty products and changingconsumer demands, our business could suffer.
Our comparable store sales and quarterly financial performance may fluctuate for a variety of reasons.
Our comparable store sales and quarterly results of operations have fluctuated in the past, and we expectthem to continue to fluctuate in the future. A variety of factors affect our comparable store sales andquarterly financial performance, including:
• changes in our merchandising strategy or mix;
• the performance of our new stores;
• the effectiveness of our inventory management;
• the timing and concentration of new store openings, including additional human resourcerequirements and related pre-opening and other start-up costs;
• levels of pre-opening expenses associated with new stores;
• a portion of a typical new store’s sales (or sales we make over the internet channel) coming fromcustomers who previously shopped at other existing stores;
• expenditures on our distribution system
17
• the earnings impact of those of our interest rate swaps which do not qualify for hedge accountingtreatment;
• the timing and effectiveness of our marketing activities, particularly our Sally Beauty Clubpromotions;
• seasonal fluctuations due to weather conditions;
• the level of sales made through our internet channel;
• actions by our existing or new competitors; and
• worldwide economic conditions and, in particular, the retail sales environment in the U.S.
Accordingly, our results for any one fiscal quarter are not necessarily indicative of the results to beexpected for any other quarter, and comparable store sales for any particular future period may decrease,which could have a material adverse effect on our business, financial condition and results of operations.
We depend upon manufacturers who may be unable to provide products of adequate quality or who may beunwilling to continue to supply products to us.
We do not manufacture the brand name or exclusive label products we sell, and instead purchase ourproducts from manufacturers and fillers. We depend on a limited number of manufacturers for asignificant percentage of the products we sell. For fiscal year 2009, our three largest suppliers wereProcter & Gamble Co., or P&G, the Professional Products Division of L’Oreal USA S/D, Inc., or L’Oreal,and John Paul Mitchell Systems. BSG’s largest supplier, L’Oreal, represented approximately 15.1% ofBSG’s total net sales in the fiscal year 2009.
In addition, since we purchase products from many manufacturers and fillers on an at-will basis undercontracts which can generally be terminated without cause upon 90 days notice or less, or which expirewithout express rights of renewal, such manufacturers and fillers could discontinue sales to us at any timeor upon the expiration of the distribution period. Some of our contracts with manufacturers may beterminated by such manufacturers if we fail to meet specified minimum purchase requirements. In suchcases, we do not have contractual assurances of continued supply, pricing or access to new products andvendors may change the terms upon which they sell. Infrequently, a supplier will seek to terminate adistribution relationship through legal action. For example, in 2009 L’Oreal filed an action which threatensa long-term distribution agreement with Armstrong McCall. Armstrong McCall is vigorously defending itsrights under the agreement. For these and other reasons, we may not be able to acquire desiredmerchandise in sufficient quantities or on acceptable terms in the future.
Changes in Sally Beauty Supply and BSG’s relationships with suppliers occur often, and could positively ornegatively impact the net sales and operating profits of both business segments. Some of our suppliers mayseek to decrease their reliance on distribution intermediaries, including full-service/exclusive and open-linedistributors like BSG and Sally Beauty Supply, by promoting their own distribution channels, as discussedabove. These suppliers may offer advantages, such as discounted prices, when their products are purchasedfrom distribution channels they control. If our access to supplier-provided products were to be diminishedrelative to our competitors or we were not able to purchase products at the same prices as our competitors,our business could be materially and adversely affected. Also, consolidation among suppliers may increasetheir negotiating leverage, thereby providing them with competitive advantages over us that may increaseour costs and reduce our revenues, adversely affecting our business, financial condition and results ofoperations.
As discussed above, L’Oreal is entering into direct competition with BSG, and there can be no assurancethat there will not be further revenue losses over time at BSG, due to potential losses of additional L’Orealrelated products as well as from the increased competition from L’Oreal-affiliated distribution networks.For example, L’Oreal could attempt to terminate our contracts to carry certain of their products in BSGstores, which brought in revenues of approximately $99.1 million in U.S. sales for the fiscal year 2009 and
18
have expiration dates at the end of 2012. Therefore, there can be no assurance that the impact of thesedevelopments will not adversely impact revenue to a greater degree than we currently expect or that ourefforts to mitigate the impact of these developments will be successful. If the impact of these developmentsis greater than we expect or our efforts to mitigate the impact of these developments are not successful,this could have a material adverse effect on our business, financial condition or results of operations.
Although we plan to mitigate the negative effects resulting from unfavorable changes in our relationshipswith suppliers, such as L’Oreal, there can be no assurance that our efforts will partially or completely offsetthe loss of these distribution rights.
Any significant interruption in the supply of beauty supply products by manufacturers of our products coulddisrupt our ability to deliver merchandise to our stores and customers in a timely manner, which could have amaterial adverse effect on our business, financial condition and results of operations.
Manufacturers and fillers of beauty supply products are subject to certain risks that could adversely impacttheir ability to provide us with their products on a timely basis, including industrial accidents,environmental events, strikes and other labor disputes, union organizing activity, disruptions in logistics orinformation systems, loss or impairment of key manufacturing sites, product quality control, safety, andlicensing requirements and other regulatory issues, as well as natural disasters and other external factorsover which neither they nor we have control. In addition, our operating results depend to some extent onthe orderly operation of our receiving and distribution processes, which depend on manufacturers’adherence to shipping schedules and our effective management of our distribution facilities and capacity.
If a material interruption of supply occurs, or a significant supplier ceases to supply us or materiallydecreases its supply to us, we may not be able to acquire products with similar quality and consumer brandname recognition as the products we currently sell or to acquire such products in sufficient quantities tomeet our customers’ demands or on favorable terms to our business, any of which could adversely impactour business, financial condition and results of operations.
If products sold by us are found to be defective in labeling or content, our credibility and that of the brandswe sell may be harmed, marketplace acceptance of our products may decrease, and we may be exposed toliability in excess of our products liability insurance coverage and manufacturer indemnities.
We do not control the production process for the brand name and exclusive label products we sell. We maynot be able to identify a defect in a product we purchase from a manufacturer or filler before we offer suchproduct for resale. In many cases, we rely on representations of manufacturers and fillers about theproducts we purchase for resale regarding whether such products have been manufactured in accordancewith applicable governmental regulations. Our sale of certain products exposes us to potential productliability claims, recalls or other regulatory or enforcement actions initiated by federal, state or foreignregulatory authorities or through private causes of action. Such claims, recalls or actions could be based onallegations that, among other things, the products sold by us are misbranded, contain contaminants,provide inadequate instructions regarding their use or misuse, or include inadequate warnings concerningflammability or interactions with other substances. Claims against us could also arise as a result of themisuse by purchasers of such products or as a result of their use in a manner different than the intendeduse. We may be required to pay for losses or injuries actually or allegedly caused by the products we selland to recall any product we sell that is alleged to be or is found to be defective.
Any actual defects or allegations of defects in products sold by us could result in adverse publicity andharm our credibility, which could adversely affect our business, financial condition and results ofoperations. Although we may have indemnification rights against the manufacturers of many of theproducts we distribute and rights as an ‘‘additional insured’’ under the manufacturer’s insurance policies, itis not certain that any individual manufacturer or insurer will be financially solvent and capable of makingpayment to any party suffering loss or injury caused by products sold by us. Further, some types of actionsand penalties, including many actions or penalties imposed by governmental agencies and punitive
19
damages awards, may not be remediable through reliance on indemnity agreements or insurance.Furthermore, potential product liability claims may exceed the amount of indemnity or insurance coverageor be excluded under the terms of an indemnity agreement or insurance policy. If we are forced to pay tosatisfy such claims, it could have an adverse effect on our business, financial condition and results ofoperations.
We could be adversely affected if we do not comply with laws and regulations or if we become subject toadditional or more stringent laws and regulations.
We are subject to a number of U.S. federal, state and local laws and regulations, as well as the laws andregulations applicable in each other marketplace in which we do business. These laws and regulationsgovern the composition, packaging, labeling and safety of the products we sell, the methods we use to sellthese products, and the methods we use to import these products. Non-compliance with applicable lawsand regulations of governmental authorities, including the FDA and similar authorities in otherjurisdictions, by us or the manufacturers of the products sold by us could result in fines, product recalls andenforcement actions or otherwise restrict our ability to market certain products, which could adverselyaffect our business, financial condition and results of operations. The laws and regulations applicable to usor manufacturers of the products sold by us may become more stringent. Continued legal compliancecould require the review and possible reformulation or relabeling of certain products, as well as thepossible removal of some products from the marketplace altogether. Legal compliance could also lead toconsiderably higher internal regulatory costs. Manufacturers may try to recover some or all of anyincreased costs of compliance by increasing the prices at which we purchase products, and we may not beable to recover some or all of such increased cost in our own prices to our customers. We are also subjectto state and local laws and regulations that affect our franchisor-franchisee relationships. Increasedcompliance costs and the loss of sales of certain products due to more stringent or new laws andregulations could adversely affect our business, financial condition and results of operations.
Laws and regulations impact our business in many areas that have no direct relation to the products wesell. For example, as a public company, we are subject to a number of laws and regulations related to theissuance and sale of our securities. Another area of intense regulation is that of the relationships we havewith our employees, including compliance with many different wage/hour and nondiscrimination relatedregulatory schemes. Violation of any of the laws or regulations governing our business and/or the assertionof individual or class-wide claims could have an adverse effect on our business, financial condition andresults of operations.
Product diversion could have an adverse impact on our revenues.
The majority of the products that BSG sells, including those sold by our Armstrong McCall franchisees, aremeant to be used exclusively by salons and individual salon professionals or are meant to be soldexclusively by the purchasers, such as salons, to their retail consumers. However, despite our efforts toprevent diversion, incidents of product diversion occur, whereby our products are sold by these purchasers(and possibly by other bulk purchasers such as franchisees) to wholesalers and general merchandiseretailers. These retailers, in turn, sell such products to consumers. The diverted product may be old,tainted or damaged and sold through unapproved outlets, all of which could diminish the value of theparticular brand. Diversion may result in lower net sales for BSG should consumers choose to purchasediverted products from retailers rather than purchasing from our customers, or choose other productsaltogether because of the perceived loss of brand prestige.
Product diversion is generally prohibited under our supplier contracts, and we may be under a contractualobligation to stop selling to salons, salon professionals and other bulk purchasers who engage in productdiversion. If we fail to stop diversion as required (including any known diversion of products sold throughour Armstrong McCall franchisees or by BSG), our supplier contracts could be adversely affected or eventerminated. In addition, our investigation and enforcement of our anti-diversion policies may result inreduced sales to our customer base, thereby decreasing our revenues and profitability.
20
BSG’s financial results are affected by the financial results of BSG’s franchised-based business (ArmstrongMcCall).
BSG receives revenue from products purchased by Armstrong McCall franchisees. Accordingly, a portionof BSG’s financial results is to an extent dependent upon the operational and financial success of thesefranchisees, including their implementation of BSG’s strategic plans. If sales trends or economic conditionsworsen for Armstrong McCall’s franchisees, their financial results may worsen. Additionally, if ArmstrongMcCall franchisees fail to renew their franchise agreements, or if Armstrong McCall fails to meet itsobligations under its franchise agreements or vendor distribution agreements or is required to restructureits franchise agreements in connection with such renewal, it could result in decreased revenues for BSG orlegal issues with our franchisees or vendors.
Our new Internet-based business may be unsuccessful or may cause internal channel conflict.
We offer many of our beauty products for sale through our website (www.sallybeauty.com). Therefore, weencounter risks and difficulties frequently experienced in internet-based businesses, including risks relatedto our ability to attract and retain customers on a cost-effective basis and our ability to operate, support,expand and develop our internet operations, our websites, and our software and other related operationalsystems. In addition, our internet-based business may conflict with the success of our Sally Beauty Supplystores. For example, our internet-based business may compete with our Sally Beauty Supply stores for thesame customers. Although we believe that our participation in both internet-based and store-based sales isa distinct advantage for us due to synergies and the potential for new customers, customer conflictsbetween these offerings could create issues that have the potential to adversely affect our results ofoperations. For example, such conflict could cause some of our current or potential internet customers toconsider competing distributors of beauty products. These events could have an adverse effect on ourbusiness, financial condition and results of operations.
We may not be able to successfully identify acquisition candidates or successfully complete desirableacquisitions.
In the past several years, we have completed several significant acquisitions. We intend to continue topursue additional acquisitions in the future. Our business has in the past actively reviewed acquisitionprospects that would complement our existing lines of business, increase the size and geographic scope ofour operations or otherwise offer growth and operating efficiency opportunities. There can be noassurance that we will be able to identify suitable acquisition candidates.
If suitable candidates are identified, sufficient funds may not be available to make such acquisitions. Wecompete against many other companies, some of which are larger and have greater financial and otherresources than we do. Increased competition for acquisition candidates could result in fewer acquisitionopportunities and higher acquisition prices. In addition, we are highly leveraged and the agreementsgoverning our indebtedness contain limits on our ability to incur additional debt to pay for acquisitions.Additionally, the amount of equity that we can issue to make acquisitions or raise additional capital will beseverely limited. We may be unable to finance acquisitions that would increase our growth or improve ourfinancial and competitive position. To the extent that debt financing is available to finance acquisitions, ournet indebtedness could be increased as a result of any acquisitions.
If we acquire any businesses in the future, they could prove difficult to integrate, disrupt our business or havean adverse effect on our results of operations.
Any acquisitions that we do make may be difficult to integrate profitably into our business and may entailnumerous risks, including:
• difficulties in assimilating acquired operations, stores or products, including the loss of keyemployees from acquired businesses;
21
• difficulties and costs associated with integrating and evaluating the distribution or informationsystems and/or internal control systems of acquired businesses;
• expenses associated with the amortization of identifiable intangible assets;
• problems retaining key technical, operational and administrative personnel;
• diversion of management’s attention from our core business, including loss of management focus onmarketplace developments;
• complying with foreign regulatory requirements, including multi-jurisdictional competition rules;
• enforcement of intellectual property rights in some foreign countries;
• adverse effects on existing business relationships with suppliers and customers, including thepotential loss of suppliers of the acquired businesses;
• operating inefficiencies and negative impact on profitability;
• entering geographic areas or channels in which we have limited or no prior experience; and
• those related to general economic and political conditions, including legal and other barriers tocross-border investment in general, or by U.S. companies in particular.
In addition, during the acquisition process, we may fail or be unable to discover some of the liabilities ofbusinesses that we acquire. These liabilities may result from a prior owner’s noncompliance with applicablelaws and regulations. Acquired businesses may also not perform as we expect or we may not be able toobtain the financial improvements in acquired businesses that we expect.
If we are unable to profitably open and operate new stores, our business, financial condition and results ofoperations may be adversely affected.
Our future growth strategy depends in part on our ability to open and profitably operate new stores inexisting and additional geographic areas. The capital requirements to open a U.S.-based Sally BeautySupply or BSG store, excluding inventory, average approximately $70,000 and $80,000, respectively, withthe capital requirements for international stores costing less or substantially more depending upon themarketplace. Despite these relatively-low per-store opening costs, we may not be able to open all of thenew stores we plan to open and any new stores we open may not be profitable, either of which could have amaterial adverse impact on our financial condition or results of operations. There are several factors thatcould affect our ability to open and profitably operate new stores, including:
• the inability to identify and acquire suitable sites or to negotiate acceptable leases for such sites;
• proximity to existing stores that may reduce new stores’ sales or the sales of existing stores;
• difficulties in adapting our distribution and other operational and management systems to anexpanded network of stores;
• the potential inability to obtain adequate financing to fund expansion because of our high leverageand limitations on our ability to issue equity under our credit agreements, among other things;
• increased (and sometimes unanticipated) costs associated with opening stores in new internationallocations;
• difficulties in obtaining any needed governmental and third-party consents, permits and licensesneeded to operate additional stores; and
• potential limitations on capital expenditures which may be included in financing documents that weenter into.
22
A further downturn in the economy may affect consumer purchases of discretionary items such as beautyproducts and salon services, which could have a material adverse effect on our business, financial conditionand results of operations.
Our results of operations may be materially affected by conditions in the global capital markets and theeconomy generally, both in the U.S. and elsewhere around the world. The stress experienced by globalcapital markets that began in the second half of 2007 continued and substantially increased during 2008and 2009. Concerns over inflation, energy costs, geopolitical issues, the availability and cost of credit, theU.S. mortgage market and a declining real estate market in the U.S. have contributed to increasedvolatility and diminished expectations for the economy. We appeal to a wide demographic consumerprofile and offer a broad selection of beauty products sold directly to retail consumers and salons and salonprofessionals. Continued uncertainty in the economy could adversely impact consumer purchases ofdiscretionary items such as beauty products and salon services, particularly in our electrical productscategory and in our professional sales business. Factors that could affect consumers’ willingness to makesuch discretionary purchases include general business conditions, levels of employment, interest rates andtax rates, the availability of consumer credit, and consumer confidence in future economic conditions. Inthe event of a further or protracted economic downturn, consumer spending habits could be adverselyaffected, and we could experience lower than expected net sales. In addition, a reduction in traffic to, orthe closing of, the other destination retailers in the shopping areas where our stores are located couldsignificantly reduce our sales and leave us with unsold inventory. The economic downturn could alsoadversely affect our vendors which we rely on to supply the products that we sell. The occurrence of any ofthese events could have a material adverse effect on our business, financial condition and results ofoperations.
We are not certain that our ongoing cost control plans will continue to be successful.
Our business strategy depends, to a substantial degree, on continuing to control or reduce operatingexpenses. In furtherance of this strategy, we have engaged in ongoing activities to reduce or control costs.These activities include maximizing the efficiency of our structure, including through the implementationof a capital spending program in fiscal years 2007 through 2009 to consolidate BSG warehouses and reduceadministrative expenses related to BSG’s distribution network optimization program. We cannot assureyou that our efforts will result in the increased profitability, cost savings or other benefits that we expect,which could have a material adverse effect on our business, financial condition and results of operations.
If we are unable to protect our intellectual property rights, specifically our trademarks and service marks, ourability to compete could be negatively impacted.
The success of our business depends to a certain extent upon the value associated with our intellectualproperty rights. We own certain trademark and service mark rights used in connection with our businessincluding, but not limited to, ‘‘Sally,’’ ‘‘Sally Beauty,’’ ‘‘Sally Beauty Supply,’’ ‘‘Sally Pro Preferred Card,’’‘‘Sally Beauty Club Card, ‘‘ ‘‘BSG,’’ ‘‘CosmoProf,’’ ‘‘Proclub,’’ ‘‘Armstrong McCall,’’ ‘‘ion,’’ ‘‘Beyond theZone,’’ and ‘‘Salon Services.’’ We protect our intellectual property rights through a variety of methods,including, but not limited to, applying and obtaining trademarks in the U.S., Canada and other countriesthroughout the world in which our business operates. We also rely on trade secret laws, in addition toconfidentiality agreements with vendors, employees, consultants, and others who have access to ourproprietary information. While we intend to vigorously protect our trademarks against infringement, wemay not be successful in doing so. In addition, the laws of certain foreign countries may not protect ourintellectual property rights to the same extent as the laws of the U.S. The costs required to protect ourintellectual property rights and trademarks are expected to continue to be substantial.
23
Our ability to conduct business in international marketplaces may be affected by legal, regulatory andeconomic risks.
Our ability to capitalize on growth in new international marketplaces and to grow or maintain our currentlevel of operations in our existing international marketplaces is subject to risks associated with ourinternational operations. These risks include: unexpected changes in regulatory requirements; tradebarriers to some international marketplaces; economic and foreign currency fluctuations in specificmarketplaces; potential difficulties in enforcing contracts, protecting assets, including intellectual property,and collecting receivables in certain foreign jurisdictions; potential tax liabilities associated withrepatriating funds from foreign operations; and difficulties and costs of staffing, managing and accountingfor foreign operations.
We may be adversely affected by any disruption in our information technology systems.
Our operations are dependent upon our information technology systems, which encompass all of ourmajor business functions. We rely upon such information technology systems to manage and replenishinventory, to fill and ship customer orders on a timely basis, to coordinate our sales activities across all ofour products and services and to coordinate our administrative activities. A substantial disruption in ourinformation technology systems for any prolonged time period (arising from, for example, system capacitylimits from unexpected increases in our volume of business, outages or delays in our service) could result indelays in receiving inventory and supplies or filling customer orders and adversely affect our customerservice and relationships. Our systems might be damaged or interrupted by natural or man-made events orby computer viruses, physical or electronic break-ins and similar disruptions affecting the global internet.There can be no assurance that such delays, problems, or costs will not have a material adverse effect onour financial condition and results of operations.
As our operations grow in both size and scope, we will continuously need to improve and upgrade oursystems and infrastructure while maintaining the reliability and integrity of our systems and infrastructure.The expansion of our systems and infrastructure will require us to commit substantial financial, operationaland technical resources before the volume of our business increases, with no assurance that the volume ofbusiness will increase. In particular, we have upgraded our financial reporting system and are currentlyupgrading our distribution systems and implementing a new point-of-sale system for tracking customersales. These and any other required upgrades to our systems and information technology, or newtechnology, now and in the future, will require that our management and resources be diverted from ourcore business to assist in compliance with those requirements. Since our systems are proprietary, ouroptions are limited in seeking third-party help with the operation and upgrade of these systems. There canbe no assurance that the time and resources our management will need to devote to these upgrades,service outages or delays due to the installation of any new or upgraded technology (and customer issuestherewith), or the impact on the reliability of our data from any new or upgraded technology will not havea material adverse effect on our business, financial condition or results of operations.
The occurrence of one or more natural disasters or acts of terrorism could adversely affect our operations andfinancial performance.
The occurrence of one or more natural disasters or acts of terrorism could result in physical damage to oneor more of our properties, the temporary closure of stores or distribution centers, the temporary lack of anadequate work force in an area, the temporary or long-term disruption in the supply of products (or asubstantial increase in the cost of those products) from some domestic or foreign suppliers, the temporarydisruption in the delivery of goods to our distribution centers (or a substantial increase in the cost of thosedeliveries), the temporary reduction in the availability of products in our stores, and/or the temporaryreduction in visits to stores by customers.
If one or more natural disasters or acts of terrorism were to impact our business, we could, among otherthings, incur significantly higher costs and longer lead times associated with distributing products to stores.
24
Furthermore, insurance costs associated with our business may rise significantly in the event of a largescale natural disaster or act of terrorism.
Our accounting and other management systems, controls and resources may not be adequately prepared tomeet the financial reporting and other requirements to which we are subject.
As an independent, publicly-traded company, we are directly subject to reporting and other obligationsunder the Exchange Act. These reporting and other obligations place significant demands on themanagement and administrative and operational resources, including accounting resources, of us and oursubsidiaries. As a public company, we incur significant legal, accounting, and other expenses. Under theSEC rules and regulations, as well as those of the New York Stock Exchange, we have significantcompliance costs.
In addition, as a public company we are subject to rules adopted by the SEC pursuant to Section 404 of theSarbanes-Oxley Act of 2002, which require us to include in our Annual Report on Form 10-K ourmanagement’s report on, and assessment of, the effectiveness of our internal controls over financialreporting. Furthermore, our independent registered public accounting firm must attest to and report onthe effectiveness of such internal controls. If we fail to properly assess and/or achieve and maintain theadequacy of our internal controls, there is a risk that we will not comply with all of the requirementsimposed by Section 404. Moreover, effective internal controls are necessary to help prevent financial fraud.Any of these possible outcomes could result in an adverse reaction in the financial marketplace due to aloss of investor confidence in the reliability of our financial statements, which ultimately could harm ourbusiness and could negatively impact the market price of our securities.
To comply with these requirements, we and our subsidiaries are continuously upgrading our systems,including information technology, and implementing additional financial and management controls,reporting systems and procedures. These and any other required upgrades to our financial andmanagement controls, reporting systems, information technology and procedures under the financialreporting requirements and other rules that apply to reporting companies, now and in the future, willrequire that our management and resources be diverted from our core business to assist in compliance withthose requirements. There can be no assurance that the time and resources our management will need todevote to these upgrades, service outages or delays due to the installation of upgrades, or the impact onthe reliability of our data from these upgrades will not have a material adverse effect on our business,financial condition or results of operations.
We are a holding company with no operations of our own, and we depend on our subsidiaries for cash.
We are a holding company and do not have any material assets or operations other than ownership ofequity interests of our subsidiaries. Our operations are conducted almost entirely through our subsidiaries,and our ability to generate cash to meet our obligations or to pay dividends is highly dependent on theearnings of, and receipt of funds from, our subsidiaries through dividends or intercompany loans. Theability of our subsidiaries to generate sufficient cash flow from operations to allow us and them to makescheduled payments on our obligations will depend on their future financial performance, which will beaffected by a range of economic, competitive and business factors, many of which are outside of ourcontrol. We cannot assure you that the cash flow and earnings of our operating subsidiaries will beadequate for our subsidiaries to service their debt obligations. If our subsidiaries do not generate sufficientcash flow from operations to satisfy their obligations we may have to undertake alternative financing plans,such as refinancing or restructuring their debt, selling assets, reducing or delaying capital investments orseeking to raise additional capital. We cannot assure you that any such alternative refinancing would bepossible, that any assets could be sold, or, if sold, of the timing of the sales and the amount of proceedsrealized from those sales, that additional financing could be obtained on acceptable terms, if at all, or thatadditional financing would be permitted under the terms of our various debt instruments then in effect.Our inability to generate sufficient cash flow to satisfy our obligations, or to refinance our obligations on
25
commercially reasonable terms, would have an adverse effect on our business, financial condition andresults of operations.
Furthermore, we and our subsidiaries may incur substantial additional indebtedness in the future that mayseverely restrict or prohibit our subsidiaries from making distributions, paying dividends or making loans tous.
Risks Relating to Our Substantial Indebtedness
We have substantial debt and may incur substantial additional debt, which could adversely affect our financialhealth, our ability to obtain financing in the future and our ability to react to changes in our business.
In connection with the Separation Transactions, certain of our subsidiaries, including Sally Holdings LLC,which we refer to as Sally Holdings, incurred approximately $1,850.0 million in debt. As of September 30,2009, we had an aggregate principal amount of approximately $1,677.5 million, including capital leaseobligations, of outstanding debt, and a total debt to equity ratio of �2.73:1.00.
Our substantial debt could have important consequences to you. For example, it could:
• make it more difficult for us to satisfy our obligations to our lenders, resulting in possible defaultson and acceleration of such indebtedness;
• limit our ability to obtain additional financing or raise even a small amount of equity capital forworking capital, capital expenditures, acquisitions, debt service requirements or general corporatepurposes;
• require us to dedicate a substantial portion of our cash flow from operations to the payment ofprincipal and interest on our indebtedness, thereby reducing the availability of such cash flows tofund working capital, capital expenditures and other general corporate purposes;
• restrict the ability of our subsidiaries to pay dividends or otherwise transfer assets to us, which couldlimit our ability to conduct repurchases of our own equity securities or pay dividends to ourstockholders, thereby limiting our ability to enhance stockholder value through such transactions;
• increase our vulnerability to general adverse economic and industry conditions, including interestrate fluctuations because a portion of our borrowings are at variable rates of interest, includingborrowings under our senior secured term loan facilities and our asset-backed senior secured loanfacility, which we refer to collectively as the senior secured credit facilities;
• place us at a competitive disadvantage compared to our competitors with proportionately less debtor comparable debt at more favorable interest rates and that, as a result, may be better positionedto withstand economic downturns;
• limit our ability to refinance indebtedness or cause the associated costs of such refinancing toincrease; and
• limit our flexibility to adjust to changing market conditions and ability to withstand competitivepressures, or prevent us from carrying out capital spending that is necessary or important to ourgrowth strategy and efforts to improve operating margins or our business.
Any of the foregoing impacts of our substantial indebtedness could have a material adverse effect on ourbusiness, financial condition and results of operations.
Despite our current indebtedness levels, we and our subsidiaries may be able to incur substantially more debt,including secured debt, which could further exacerbate the risks associated with our substantial indebtedness.
We and our subsidiaries may incur substantial additional indebtedness in the future. The terms of theinstruments governing our indebtedness do not fully prohibit us or our subsidiaries from doing so. As ofSeptember 30, 2009, our senior credit facilities provided us commitments for additional borrowings of upto approximately $325.6 million under the asset-backed senior secured loan (or ABL) facility, subject to
26
borrowing base limitations. If new debt is added to our current debt levels, the related risks that we facewould increase, and we may not be able to meet all our debt obligations. In addition, the agreementsgoverning our senior credit facilities as well as the indentures governing our senior notes and seniorsubordinated notes, which we refer to collectively as the Notes, do not prevent us from incurringobligations that do not constitute indebtedness.
The agreements and instruments governing our debt contain restrictions and limitations that couldsignificantly impact our ability to operate our business.
The senior secured term loan facilities, which we refer to as the Term Loans, contain covenants that,among other things, restrict Sally Holdings and its subsidiaries’ ability to:
• dispose of assets;
• incur additional indebtedness (including guarantees of additional indebtedness);
• pay dividends, repurchase stock or make other distributions;
• make voluntary prepayments on the Notes or make amendments to the terms thereof;
• prepay certain other debt or amend specific debt agreements;
• create liens on assets;
• make investments (including joint ventures);
• make acquisitions of all of the business or assets of, or stock representing beneficial ownership of,any person;
• engage in mergers, consolidations or sales of all or substantially all of Sally Holdings’ assets;
• engage in certain transactions with affiliates; and
• permit restrictions on Sally Holdings subsidiaries’ ability to pay dividends to Sally Holdings.
The ABL facility contains covenants that, among other things, restrict Sally Holdings and its subsidiaries’ability to:
• change their line of business;
• engage in certain mergers, consolidations and transfers of all or substantially all of their assets;
• make certain dividends, stock repurchases and other distributions;
• make acquisitions of all of the business or assets of, or stock representing beneficial ownership of,any person;
• dispose of certain assets;
• make voluntary prepayments on the Notes or make amendments to the terms thereof;
• prepay certain other debt or amend specific debt agreements;
• change the fiscal year of Sally Holdings or its direct parent; and
• create or incur negative pledges.
The Term Loans contain a requirement that Sally Holdings not exceed a maximum ratio of net seniorsecured debt to consolidated EBITDA (as those terms are defined in the relevant credit agreement). Inaddition, if Sally Holdings fails to maintain a specified minimum level of borrowing capacity under theABL facility, it will then be obligated to maintain a specified fixed-charge coverage ratio. Our ability tocomply with these covenants in future periods will depend on our ongoing financial and operatingperformance, which in turn will be subject to economic conditions and to financial, market and competitivefactors, many of which are beyond our control. Our ability to comply with these covenants in future periods
27
will also depend substantially on the pricing of our products, our success at implementing cost reductioninitiatives and our ability to successfully implement our overall business strategy.
The indentures governing the Notes also contain restrictive covenants that, among other things, limit ourability and the ability of Sally Holdings and its restricted subsidiaries to:
• dispose of assets;
• incur additional indebtedness (including guarantees of additional indebtedness);
• pay dividends, repurchase stock or make other distributions;
• prepay subordinated debt;
• create liens on assets (which, in the case of the senior subordinated notes, would be limited inapplicability to liens securing pari passu or subordinated indebtedness);
• make investments (including joint ventures);
• engage in mergers, consolidations or sales of all or substantially all of Sally Holdings’ assets;
• engage in certain transactions with affiliates; and
• permit restrictions on Sally Holdings’ subsidiaries’ ability to pay dividends.
The restrictions in the indentures governing our Notes and the terms of our senior credit facilities mayprevent us from taking actions that we believe would be in the best interest of our business and may makeit difficult for us to successfully execute our business strategy or effectively compete with companies thatare not similarly restricted. We may also incur future debt obligations that might subject us to additionalrestrictive covenants that could affect our financial and operational flexibility. We cannot assure you thatour subsidiaries, who are borrowers under these agreements, will be granted waivers or amendments tothese agreements if for any reason they are unable to comply with these agreements or that we will be ableto refinance our debt on terms acceptable to us or at all.
Our ability to comply with the covenants and restrictions contained in the senior credit facilities and theindentures for the Notes may be affected by economic, financial and industry conditions beyond ourcontrol. The breach of any of these covenants or restrictions could result in a default under either thesenior credit facilities or the indentures that would permit the applicable lenders or note holders, as thecase may be, to declare all amounts outstanding thereunder to be due and payable, together with accruedand unpaid interest. If we are unable to repay debt, lenders having secured obligations, such as the lendersunder the senior credit facilities, could proceed against the collateral securing the debt. In any such case,our subsidiaries may be unable to borrow under the senior credit facilities and may not be able to repay theamounts due under the Term Loans and the Notes. This could have serious consequences to our financialcondition and results of operations and could cause us to become bankrupt or insolvent.
Our ability to generate the significant amount of cash needed to service all of our debt and our ability torefinance all or a portion of our indebtedness or obtain additional financing depend on many factors beyondour control.
Our ability to make scheduled payments on, or to refinance our obligations under, our debt will depend onour financial and operating performance, which, in turn, will be subject to prevailing economic andcompetitive conditions and to the financial and business factors, many of which may be beyond our control,described under ‘‘—Risks Relating to Our Business’’ above.
If our cash flow and capital resources are insufficient to fund our debt service obligations, we may beforced to reduce or delay capital expenditures, sell assets, seek to obtain additional equity capital orrestructure our debt. In the future, our cash flow and capital resources may not be sufficient for paymentsof interest on and principal of our debt, and such alternative measures may not be successful and may notpermit us to meet our scheduled debt service obligations.
28
We cannot assure you that we will be able to refinance any of our indebtedness or obtain additionalfinancing, particularly because of our high levels of debt and the debt incurrence restrictions imposed bythe agreements governing our debt, as well as prevailing market conditions. In the absence of suchoperating results and resources, we could face substantial liquidity problems and might be required todispose of material assets or operations to meet our debt service and other obligations. Our senior creditfacilities and the indentures governing the Notes restrict our ability to dispose of assets and use theproceeds from any such dispositions. We cannot assure you we will be able to consummate those sales, or ifwe do, what the timing of the sales will be or whether the proceeds that we realize will be adequate to meetdebt service obligations when due.
An increase in interest rates would increase the cost of servicing our debt and could reduce our profitability.
A significant portion of our outstanding debt, including under our senior credit facilities, bears interest atvariable rates. As a result, an increase in interest rates, whether because of an increase in market interestrates or a decrease in our creditworthiness, would increase the cost of servicing our debt and couldmaterially reduce our profitability and cash flows. The impact of such an increase would be moresignificant for us than it would be for some other companies because of our substantial debt.
The impairment of other financial institutions could adversely affect us.
We have exposure to different counterparties with regard to our interest rate swaps. These transactionsexpose us to credit risk in the event of default of our counterparty. We also have exposure to financialinstitutions used as depositories of our corporate cash balances. If our counterparties and financialinstitutions become impaired or insolvent, this could have serious consequences to our financial conditionand results of operations.
Risks Relating to Our Separation from Alberto-Culver and Relating To Our Largest Stockholder
We rely upon Alberto-Culver for the accuracy of certain historical services and information.
We sometimes rely upon Alberto-Culver for the accuracy and/or completeness of certain historical servicesand information provided to us when we were part of that company. For example, as the successor entity toAlberto-Culver after the separation, we rely upon the prior-year federal income tax returns of Alberto-Culver and accounting methods established therein, for certain calculations that affect our U.S. federalincome tax liability. We also rely upon Alberto-Culver for historical information related to our insuranceprograms and other benefits. There can be no assurance that our reliance upon the accuracy orcompleteness of historical information or services previously provided by them will not have an adverseimpact on our business, financial condition and results of operations.
If the share distribution of Alberto-Culver common stock in the transactions separating us from Alberto-Culver did not constitute a tax-free distribution under Section 355 of the Internal Revenue Code of 1986, asamended, or the Code, or if we became liable for additional taxes owed by Alberto-Culver, then we may beresponsible for payment of significant U.S. federal income taxes.
The following discussion describes the risk that the share distribution of Alberto-Culver common stock inthe Separation Transactions may have triggered significant tax liabilities for us, which could result in amaterial adverse effect on us. In connection with the share distribution of Alberto-Culver common stock inthe separation, we received (i) a private letter ruling from the Internal Revenue Service, or IRS, and (ii) anopinion of Sidley Austin LLP, counsel to Alberto-Culver, in each case, to the effect that the transactionsqualify as a reorganization under Section 368(a)(1)(D) of the Code and a distribution eligible fornon-recognition under Sections 355(a) and 361(c) of the Code. The private letter ruling and the opinion ofcounsel were based, in part, on assumptions and representations as to factual matters made by, amongothers, Alberto-Culver, us and representatives of Mrs. Carol L. Bernick, Mr. Leonard H. Lavin and certainof our other stockholders to whom we refer as the Lavin family stockholders, as requested by the IRS orcounsel, which, if incorrect, could jeopardize the conclusions reached by the IRS and counsel. The private
29
letter ruling also did not address certain material legal issues that could affect its conclusions, and reservedthe right of the IRS to raise such issues upon a subsequent audit. Opinions of counsel neither bind the IRSor any court, nor preclude the IRS from adopting a contrary position.
If the Alberto-Culver share distribution were not to qualify as a tax-free distribution under Section 355 ofthe Code, we would recognize taxable gain equal to the excess of the fair market value of the Alberto-Culver common stock distributed to our stockholders over our tax basis in such Alberto-Culver commonstock.
Even if the Alberto-Culver share distribution otherwise qualified as a tax-free distribution underSection 355 of the Code, it would result in significant U.S. federal income tax liabilities to us if there wasan acquisition of our stock or the stock of Alberto-Culver as part of a plan or series of related transactionsthat includes the Alberto-Culver share distribution and that results in an acquisition of 50% or more ofAlberto-Culver’s or our outstanding common stock.
In the event that we recognize a taxable gain in connection with the Alberto-Culver share distribution(either (i) because the Alberto-Culver share distribution did not qualify as a tax-free distribution underSection 355 of the Code or (ii) because of an acquisition by CDR Investors of 50% or more of Alberto-Culver or our outstanding common stock as part of a plan or series of related transactions that includes theAlberto-Culver share distribution), the taxable gain recognized by us would result in significant U.S.federal income tax liabilities to us. Under the Code, we would be jointly and severally liable for these taxesfor which Alberto-Culver may be required to indemnify us under the tax allocation agreement, and therecan be no assurance that Alberto-Culver would be able to fulfill its obligations under the tax allocationagreement if Alberto-Culver was determined to be responsible for these taxes thereunder.
The process for determining whether a prohibited change in control has occurred under the rules iscomplex, inherently factual and subject to interpretation of the facts and circumstances of a particular case.If Alberto-Culver did not carefully monitor its, or we did not carefully monitor our, compliance with theserules, this might inadvertently cause or permit a prohibited change in the ownership of us or of Alberto-Culver to occur, thereby triggering Alberto-Culver’s or our respective obligations to indemnify the otherpursuant to the tax allocation agreement, which would have a material adverse effect on us.
If any of the above events occur, we will be jointly and severally liable for these taxes, and there can be noassurance that Alberto-Culver would be able to fulfill its indemnification obligations to us under the taxallocation agreement if Alberto-Culver was determined to be responsible for these taxes thereunder. Inaddition, these mutual indemnity obligations could discourage or prevent a third party from making aproposal to acquire us.
Actions taken by the Lavin family stockholders or by the CDR investors could adversely affect the tax-freenature of the share distribution of Alberto-Culver common stock in connection with the transactionsseparating us from Alberto-Culver.
Sales and/or acquisitions by the Lavin family stockholders of our common stock or Alberto-Culver’scommon stock may adversely affect the tax-free nature of the share distribution of Alberto-Culver’scommon stock in the Separation Transactions. First, with certain exceptions, sales by the Lavin familystockholders of our common stock or Alberto-Culver’s common stock at any time after the SeparationTransactions might be considered evidence that the share distribution was used principally as a device forthe distribution of earnings and profits, particularly if the selling stockholder was found to have an intentto effect such sale at the time of the share distribution. If the IRS successfully asserted that the sharedistribution was used principally as such a device, the share distribution would not qualify as a tax-freedistribution, and thus would be taxable to us. Second, with certain exceptions, if any of the Lavin familystockholders had sold an amount of our common stock that it received in connection with the SeparationTransactions (or acquired additional shares of our common stock) within the two year period followingcompletion of the Alberto-Culver share distribution, and that amount of stock, if added to the commonstock that was acquired by CDR Investors were to equal or exceed 50% of our outstanding common stock,
30
as determined under the Code and applicable Treasury regulations, a deemed acquisition of control of usin connection with the Alberto-Culver share distribution would be presumed. If this presumption were notrebutted, we would be subject to significant U.S. federal income tax liabilities, which, if not reimbursed byAlberto-Culver, would have a material adverse effect on us.
The voting power of our largest stockholder may discourage third party acquisitions of us at a premium.
CDRS, our largest stockholder, owns approximately 47.4% of our outstanding common stock on anundiluted basis. Pursuant to the stockholders agreement entered into by us, the CDR Investors and theLavin family stockholders, which we refer to as the Stockholders Agreement, CDRS has designated five ofour eleven directors, as well as the Chairman of our Board of Directors, and CDRS’ rights to nominatecertain numbers of directors will continue so long as it owns specified percentages of our common stock.The CDR Investors’ ownership of our common stock may have the effect of discouraging offers to acquirecontrol of us and may preclude holders of our common stock from receiving any premium above marketprice for their shares that may otherwise be offered in connection with any attempt to acquire control ofus.
The interests of our largest stockholder may differ from the interests of other holders of our common stock.
CDRS, our largest stockholder, owns approximately 47.4% of our outstanding common stock on anundiluted basis. Pursuant to the Stockholders Agreement, CDRS has designated five of our elevendirectors and CDRS’ rights to nominate certain numbers of directors will continue so long as it ownsspecified percentages of our common stock, as discussed above. In addition, the current Chairman of ourBoard of Directors is affiliated with CDRS. The interests of CDRS may differ from those of other holdersof our common stock in material respects. For example, CDRS may have an interest in pursuingacquisitions, divestitures, financings, re-financings, stockholder dividends or other transactions that, in itsjudgment, could enhance its overall equity portfolio or the short-term value of their investment in us, eventhough such transactions might involve substantial risks to holders of our common stock. The manager ofCDRS’ ultimate parent is in the business of making investments in companies, and may from time to timein the future, acquire interests in businesses that directly or indirectly compete with certain portions of ourbusiness or are suppliers of us or our customers. Additionally, CDRS may determine that the disposition ofsome or all of its interests in us would be beneficial to it at a time when such disposition could bedetrimental to us and/or to the other holders of our common stock. Moreover, the ownership by CDRS ofapproximately 47.4% of our outstanding common stock may have the effect of discouraging offers toacquire control of us and may preclude holders of our common stock from receiving any premium abovemarket price for their shares that may otherwise be offered in connection with any attempt to acquirecontrol of us.
ITEM 1B. UNRESOLVED STAFF COMMENTS
Not applicable.
31
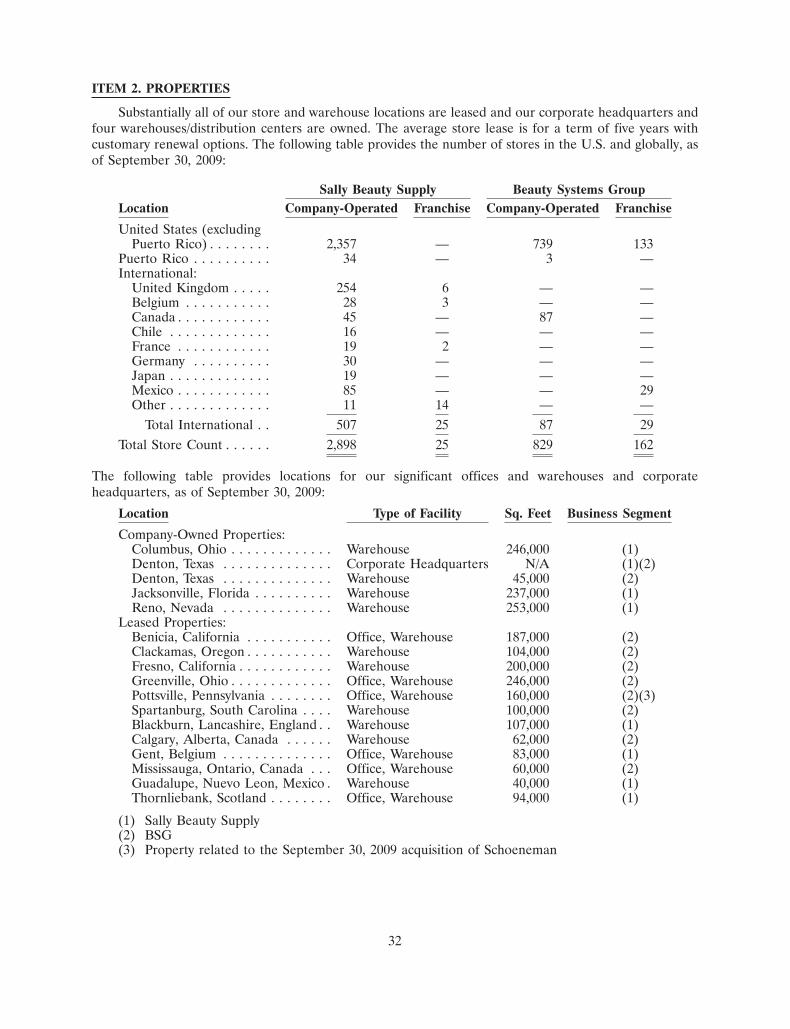
ITEM 2. PROPERTIES
Substantially all of our store and warehouse locations are leased and our corporate headquarters andfour warehouses/distribution centers are owned. The average store lease is for a term of five years withcustomary renewal options. The following table provides the number of stores in the U.S. and globally, asof September 30, 2009:
Sally Beauty Supply Beauty Systems GroupLocation Company-Operated Franchise Company-Operated Franchise
United States (excludingPuerto Rico) . . . . . . . . 2,357 — 739 133
Puerto Rico . . . . . . . . . . 34 — 3 —International:
United Kingdom . . . . . 254 6 — —Belgium . . . . . . . . . . . 28 3 — —Canada . . . . . . . . . . . . 45 — 87 —Chile . . . . . . . . . . . . . 16 — — —France . . . . . . . . . . . . 19 2 — —Germany . . . . . . . . . . 30 — — —Japan . . . . . . . . . . . . . 19 — — —Mexico . . . . . . . . . . . . 85 — — 29Other . . . . . . . . . . . . . 11 14 — —
Total International . . 507 25 87 29Total Store Count . . . . . . 2,898 25 829 162
The following table provides locations for our significant offices and warehouses and corporateheadquarters, as of September 30, 2009:
Location Type of Facility Sq. Feet Business Segment
Company-Owned Properties:Columbus, Ohio . . . . . . . . . . . . . Warehouse 246,000 (1)Denton, Texas . . . . . . . . . . . . . . Corporate Headquarters N/A (1)(2)Denton, Texas . . . . . . . . . . . . . . Warehouse 45,000 (2)Jacksonville, Florida . . . . . . . . . . Warehouse 237,000 (1)Reno, Nevada . . . . . . . . . . . . . . Warehouse 253,000 (1)
Leased Properties:Benicia, California . . . . . . . . . . . Office, Warehouse 187,000 (2)Clackamas, Oregon . . . . . . . . . . . Warehouse 104,000 (2)Fresno, California . . . . . . . . . . . . Warehouse 200,000 (2)Greenville, Ohio . . . . . . . . . . . . . Office, Warehouse 246,000 (2)Pottsville, Pennsylvania . . . . . . . . Office, Warehouse 160,000 (2)(3)Spartanburg, South Carolina . . . . Warehouse 100,000 (2)Blackburn, Lancashire, England . . Warehouse 107,000 (1)Calgary, Alberta, Canada . . . . . . Warehouse 62,000 (2)Gent, Belgium . . . . . . . . . . . . . . Office, Warehouse 83,000 (1)Mississauga, Ontario, Canada . . . Office, Warehouse 60,000 (2)Guadalupe, Nuevo Leon, Mexico . Warehouse 40,000 (1)Thornliebank, Scotland . . . . . . . . Office, Warehouse 94,000 (1)
(1) Sally Beauty Supply(2) BSG(3) Property related to the September 30, 2009 acquisition of Schoeneman
32
ITEM 3. LEGAL PROCEEDINGS
There were no material legal proceedings pending against us or our subsidiaries as of September 30,2009. We are involved in various claims and lawsuits incidental to the conduct of our business in theordinary course. We carry insurance coverage in such amounts in excess of our self-insured retention as webelieve to be reasonable under the circumstances and that may or may not cover any or all of our liabilitiesin respect of claims and lawsuits. We do not believe that the ultimate resolution of these matters will have amaterial adverse impact on our consolidated financial position, cash flows or results of operations.
We are subject to a number of U.S., federal, state and local laws and regulations, as well as the laws andregulations applicable in each other marketplace in which we do business. These laws and regulationsgovern, among other things, the composition, packaging, labeling and safety of the products we sell, themethods we use to sell these products and the methods we use to import these products. We believe thatwe are in material compliance with such laws and regulations, although no assurance can be provided thatthis will remain true going forward.
On February 25, 2008, we disclosed in a Current Report on Form 8-K that on February 21, 2008, L’Orealfiled a lawsuit in the Superior Court of the State of California in and for the County of San Diego—Central Division naming, among others, SD Hair, Ltd. and Hair of Nevada, LLC (collectively, ‘‘SD Hair’’),franchisees of our subsidiary Armstrong McCall division (‘‘AMLP’’) of our BSG business unit, asdefendants. The suit alleged, among other things, that SD Hair breached its franchise agreement withAMLP by diverting (selling) Matrix branded products to unauthorized buyers, and that L’Oreal is entitledto make claims against SD Hair under the franchise agreement as a third-party beneficiary of thatagreement. On March 24, 2008, SD Hair filed a cross-complaint in the same case naming AMLP and BSGas cross-defendants, seeking, among other things, i) declaratory relief from BSG and AMLP in the form ofa judicial finding that SD Hair is not in breach of its franchise agreement and that L’Oreal has no rights asa third-party beneficiary to SD Hair’s franchise agreement, and ii) injunctive relief in the form of a judicialorder compelling AMLP and BSG to take appropriate legal action against L’Oreal to enforce SD Hair’sclaimed rights under AMLP’s Matrix distribution agreement. We have answered the cross-complaint andthe lawsuit has been set for a jury trial in June of 2010.
On July 30, 2009, we disclosed in a Current Report on Form 8-K that L’Oreal filed a Second AmendedComplaint in connection with the previously disclosed lawsuit described above. The Second AmendedComplaint alleges, among other things, that AMLP, certain of its employees and others were involved inselling Matrix branded products to unauthorized buyers and that certain of its employees (and others)engaged in improper business transactions for personal benefit during 2005 through 2007. L’Oreal seeksmoney damages, certain injunctive relief and a declaration that L’Oreal is entitled to terminate the 1981Matrix Distributor Agreement now in effect between L’Oreal and AMLP. None of the employees involvedin the allegations are executive officers of the Company. Substantially all of these allegations were madeknown by L’Oreal to the Company prior to the filing of the Second Amended Complaint. L’Oreal alsoprovided the Company with documents allegedly supporting the allegations.
As a result of these allegations made by L’Oreal, many of which are incorporated into the SecondAmended Complaint, the Audit Committee of the Board of Directors of the Company engagedindependent special counsel to investigate whether certain employees engaged in improper businesstransactions for personal benefit. After extensive review, the Audit Committee and independent specialcounsel found insufficient evidence to support a conclusion that Company employees entered intoimproper transactions for personal benefit.
On September 8, 2009, AMLP and BSG filed a cross-complaint against L’Oreal. In the cross-complaint,AMLP and BSG allege that L’Oreal does not have a genuine interest in stopping diversion, and thatL’Oreal’s anti-diversion policies have been discriminatorily applied to AMLP and BSG. AMLP furtheralleges that L’Oreal is using diversion as a pretext to attempt to terminate the Distributor Agreement withAMLP.
33
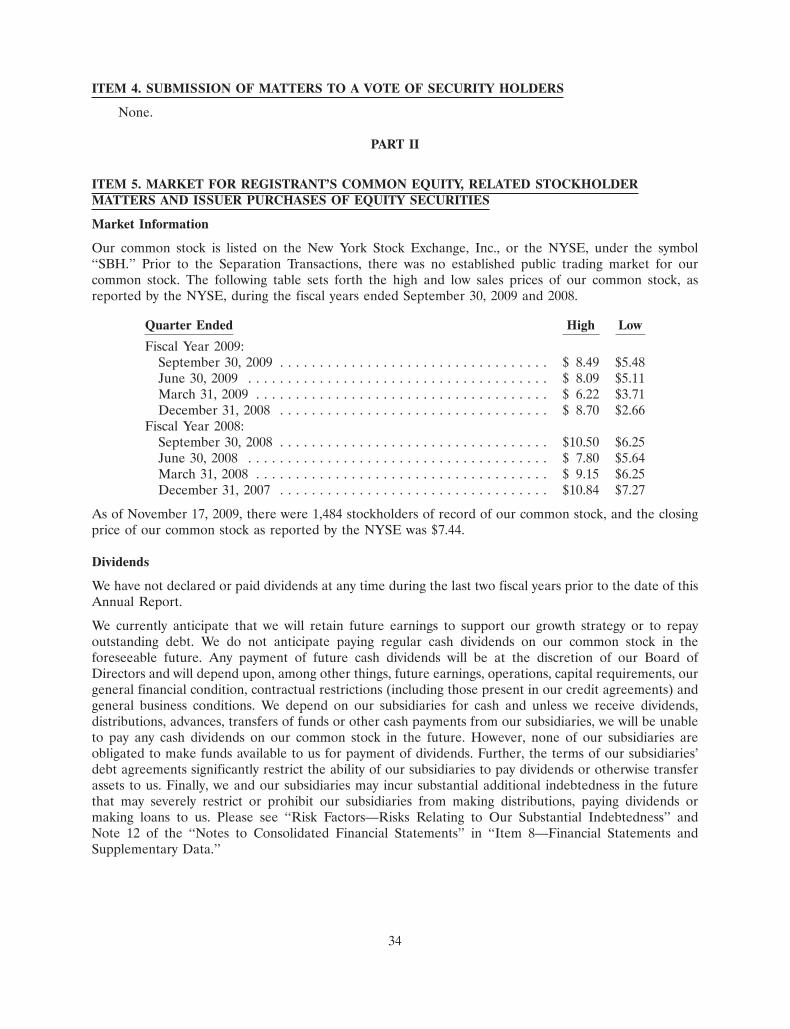
ITEM 4. SUBMISSION OF MATTERS TO A VOTE OF SECURITY HOLDERS
None.
PART II
ITEM 5. MARKET FOR REGISTRANT’S COMMON EQUITY, RELATED STOCKHOLDERMATTERS AND ISSUER PURCHASES OF EQUITY SECURITIES
Market Information
Our common stock is listed on the New York Stock Exchange, Inc., or the NYSE, under the symbol‘‘SBH.’’ Prior to the Separation Transactions, there was no established public trading market for ourcommon stock. The following table sets forth the high and low sales prices of our common stock, asreported by the NYSE, during the fiscal years ended September 30, 2009 and 2008.
Quarter Ended High Low
Fiscal Year 2009:September 30, 2009 . . . . . . . . . . . . . . . . . . . . . . . . . . . . . . . . . . $ 8.49 $5.48June 30, 2009 . . . . . . . . . . . . . . . . . . . . . . . . . . . . . . . . . . . . . . $ 8.09 $5.11March 31, 2009 . . . . . . . . . . . . . . . . . . . . . . . . . . . . . . . . . . . . . $ 6.22 $3.71December 31, 2008 . . . . . . . . . . . . . . . . . . . . . . . . . . . . . . . . . . $ 8.70 $2.66
Fiscal Year 2008:September 30, 2008 . . . . . . . . . . . . . . . . . . . . . . . . . . . . . . . . . . $10.50 $6.25June 30, 2008 . . . . . . . . . . . . . . . . . . . . . . . . . . . . . . . . . . . . . . $ 7.80 $5.64March 31, 2008 . . . . . . . . . . . . . . . . . . . . . . . . . . . . . . . . . . . . . $ 9.15 $6.25December 31, 2007 . . . . . . . . . . . . . . . . . . . . . . . . . . . . . . . . . . $10.84 $7.27
As of November 17, 2009, there were 1,484 stockholders of record of our common stock, and the closingprice of our common stock as reported by the NYSE was $7.44.
Dividends
We have not declared or paid dividends at any time during the last two fiscal years prior to the date of thisAnnual Report.
We currently anticipate that we will retain future earnings to support our growth strategy or to repayoutstanding debt. We do not anticipate paying regular cash dividends on our common stock in theforeseeable future. Any payment of future cash dividends will be at the discretion of our Board ofDirectors and will depend upon, among other things, future earnings, operations, capital requirements, ourgeneral financial condition, contractual restrictions (including those present in our credit agreements) andgeneral business conditions. We depend on our subsidiaries for cash and unless we receive dividends,distributions, advances, transfers of funds or other cash payments from our subsidiaries, we will be unableto pay any cash dividends on our common stock in the future. However, none of our subsidiaries areobligated to make funds available to us for payment of dividends. Further, the terms of our subsidiaries’debt agreements significantly restrict the ability of our subsidiaries to pay dividends or otherwise transferassets to us. Finally, we and our subsidiaries may incur substantial additional indebtedness in the futurethat may severely restrict or prohibit our subsidiaries from making distributions, paying dividends ormaking loans to us. Please see ‘‘Risk Factors—Risks Relating to Our Substantial Indebtedness’’ andNote 12 of the ‘‘Notes to Consolidated Financial Statements’’ in ‘‘Item 8—Financial Statements andSupplementary Data.’’
34
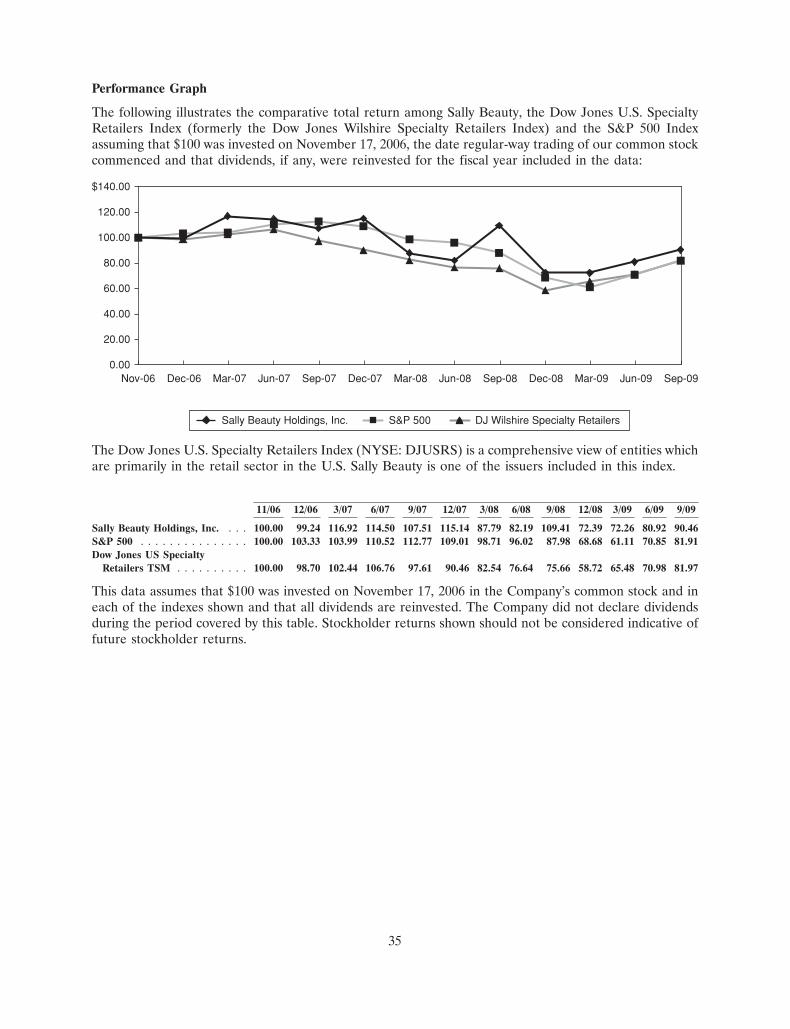
18NOV200912360033
Performance Graph
The following illustrates the comparative total return among Sally Beauty, the Dow Jones U.S. SpecialtyRetailers Index (formerly the Dow Jones Wilshire Specialty Retailers Index) and the S&P 500 Indexassuming that $100 was invested on November 17, 2006, the date regular-way trading of our common stockcommenced and that dividends, if any, were reinvested for the fiscal year included in the data:
$140.00
120.00
100.00
80.00
60.00
40.00
20.00
0.00Nov-06 Dec-06 Mar-07 Jun-07 Sep-07 Dec-07 Mar-08 Jun-08 Sep-08 Dec-08 Mar-09 Jun-09 Sep-09
Sally Beauty Holdings, Inc. S&P 500 DJ Wilshire Specialty Retailers
The Dow Jones U.S. Specialty Retailers Index (NYSE: DJUSRS) is a comprehensive view of entities whichare primarily in the retail sector in the U.S. Sally Beauty is one of the issuers included in this index.
11/06 12/06 3/07 6/07 9/07 12/07 3/08 6/08 9/08 12/08 3/09 6/09 9/09
Sally Beauty Holdings, Inc. . . . 100.00 99.24 116.92 114.50 107.51 115.14 87.79 82.19 109.41 72.39 72.26 80.92 90.46S&P 500 . . . . . . . . . . . . . . . 100.00 103.33 103.99 110.52 112.77 109.01 98.71 96.02 87.98 68.68 61.11 70.85 81.91Dow Jones US Specialty
Retailers TSM . . . . . . . . . . 100.00 98.70 102.44 106.76 97.61 90.46 82.54 76.64 75.66 58.72 65.48 70.98 81.97
This data assumes that $100 was invested on November 17, 2006 in the Company’s common stock and ineach of the indexes shown and that all dividends are reinvested. The Company did not declare dividendsduring the period covered by this table. Stockholder returns shown should not be considered indicative offuture stockholder returns.
35
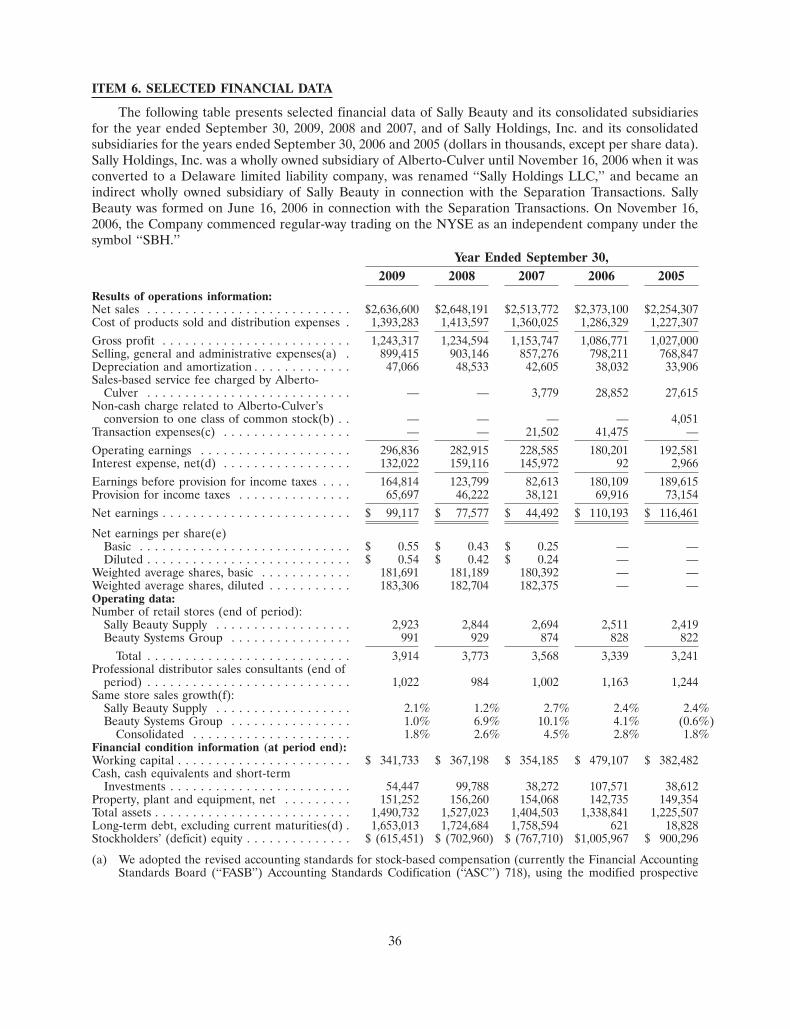
ITEM 6. SELECTED FINANCIAL DATA
The following table presents selected financial data of Sally Beauty and its consolidated subsidiariesfor the year ended September 30, 2009, 2008 and 2007, and of Sally Holdings, Inc. and its consolidatedsubsidiaries for the years ended September 30, 2006 and 2005 (dollars in thousands, except per share data).Sally Holdings, Inc. was a wholly owned subsidiary of Alberto-Culver until November 16, 2006 when it wasconverted to a Delaware limited liability company, was renamed ‘‘Sally Holdings LLC,’’ and became anindirect wholly owned subsidiary of Sally Beauty in connection with the Separation Transactions. SallyBeauty was formed on June 16, 2006 in connection with the Separation Transactions. On November 16,2006, the Company commenced regular-way trading on the NYSE as an independent company under thesymbol ‘‘SBH.’’
Year Ended September 30,2009 2008 2007 2006 2005
Results of operations information:Net sales . . . . . . . . . . . . . . . . . . . . . . . . . . . $2,636,600 $2,648,191 $2,513,772 $2,373,100 $2,254,307Cost of products sold and distribution expenses . 1,393,283 1,413,597 1,360,025 1,286,329 1,227,307
Gross profit . . . . . . . . . . . . . . . . . . . . . . . . . 1,243,317 1,234,594 1,153,747 1,086,771 1,027,000Selling, general and administrative expenses(a) . 899,415 903,146 857,276 798,211 768,847Depreciation and amortization . . . . . . . . . . . . . 47,066 48,533 42,605 38,032 33,906Sales-based service fee charged by Alberto-
Culver . . . . . . . . . . . . . . . . . . . . . . . . . . . — — 3,779 28,852 27,615Non-cash charge related to Alberto-Culver’s
conversion to one class of common stock(b) . . — — — — 4,051Transaction expenses(c) . . . . . . . . . . . . . . . . . — — 21,502 41,475 —
Operating earnings . . . . . . . . . . . . . . . . . . . . 296,836 282,915 228,585 180,201 192,581Interest expense, net(d) . . . . . . . . . . . . . . . . . 132,022 159,116 145,972 92 2,966
Earnings before provision for income taxes . . . . 164,814 123,799 82,613 180,109 189,615Provision for income taxes . . . . . . . . . . . . . . . 65,697 46,222 38,121 69,916 73,154
Net earnings . . . . . . . . . . . . . . . . . . . . . . . . . $ 99,117 $ 77,577 $ 44,492 $ 110,193 $ 116,461
Net earnings per share(e)Basic . . . . . . . . . . . . . . . . . . . . . . . . . . . . $ 0.55 $ 0.43 $ 0.25 — —Diluted . . . . . . . . . . . . . . . . . . . . . . . . . . . $ 0.54 $ 0.42 $ 0.24 — —
Weighted average shares, basic . . . . . . . . . . . . 181,691 181,189 180,392 — —Weighted average shares, diluted . . . . . . . . . . . 183,306 182,704 182,375 — —Operating data:Number of retail stores (end of period):
Sally Beauty Supply . . . . . . . . . . . . . . . . . . 2,923 2,844 2,694 2,511 2,419Beauty Systems Group . . . . . . . . . . . . . . . . 991 929 874 828 822
Total . . . . . . . . . . . . . . . . . . . . . . . . . . . 3,914 3,773 3,568 3,339 3,241Professional distributor sales consultants (end of
period) . . . . . . . . . . . . . . . . . . . . . . . . . . . 1,022 984 1,002 1,163 1,244Same store sales growth(f):
Sally Beauty Supply . . . . . . . . . . . . . . . . . . 2.1% 1.2% 2.7% 2.4% 2.4%Beauty Systems Group . . . . . . . . . . . . . . . . 1.0% 6.9% 10.1% 4.1% (0.6%)
Consolidated . . . . . . . . . . . . . . . . . . . . . 1.8% 2.6% 4.5% 2.8% 1.8%Financial condition information (at period end):Working capital . . . . . . . . . . . . . . . . . . . . . . . $ 341,733 $ 367,198 $ 354,185 $ 479,107 $ 382,482Cash, cash equivalents and short-term
Investments . . . . . . . . . . . . . . . . . . . . . . . . 54,447 99,788 38,272 107,571 38,612Property, plant and equipment, net . . . . . . . . . 151,252 156,260 154,068 142,735 149,354Total assets . . . . . . . . . . . . . . . . . . . . . . . . . . 1,490,732 1,527,023 1,404,503 1,338,841 1,225,507Long-term debt, excluding current maturities(d) . 1,653,013 1,724,684 1,758,594 621 18,828Stockholders’ (deficit) equity . . . . . . . . . . . . . . $ (615,451) $ (702,960) $ (767,710) $1,005,967 $ 900,296
(a) We adopted the revised accounting standards for stock-based compensation (currently the Financial AccountingStandards Board (‘‘FASB’’) Accounting Standards Codification (‘‘ASC’’) 718), using the modified prospective
36
method, effective October 1, 2005. Fiscal years 2009, 2008, 2007 and 2006 include share-based compensation of$8.6 million, $10.2 million, $13.1 million and $5.2 million, respectively.
(b) During fiscal year 2004, Alberto-Culver’s board of directors approved the conversion of all then-outstandingAlberto-Culver shares of Class A common stock into Class B common stock. Fiscal year 2005 includes non-cashcharges related to this conversion.
(c) Fiscal year 2007 includes one-time charges associated with the Separation Transactions. Fiscal year 2006 includesone-time charges associated with the termination of a merger agreement. Please see Note 3 of the ‘‘Notes toConsolidated Financial Statements’’ in ‘‘Item 8—Financial Statements and Supplementary Data’’ for additionalinformation about the Separation Transactions.
(d) After November 16, 2006, long-term debt primarily represents debt incurred in connection with the SeparationTransactions and interest expense related mainly to such indebtedness. Prior to the Separation Transactions,interest expense was attributable to notes payable to then-affiliates.
(e) Weighted average shares for fiscal year 2007 was calculated from November 16, 2006 through September 30,2007, which represents the actual number of days that shares of the Company’s common stock were publiclytraded. Net earnings per share were not calculated for fiscal years 2006 and 2005 since we were a wholly-ownedsubsidiary of Alberto-Culver. Please see Note 3 of the ‘‘Notes to Consolidated Financial Statements’’ in‘‘Item 8—Financial Statements and Supplementary Data’’ for additional information about the SeparationTransactions.
(f) Same stores are defined as company-operated stores that have been open for at least 14 months as of the last dayof a month. Our internet site has generated sales for at least 14 months and, accordingly, internet-based sales areincluded in same store sales for fiscal year 2009.
We have not declared or paid dividends at any time during the last two fiscal years prior to the date of thisAnnual Report. We do not anticipate paying regular cash dividends on our common stock in theforeseeable future. We currently anticipate that we will retain future earnings to support our growthstrategy or to repay outstanding debt.
37
ITEM 7. MANAGEMENT’S DISCUSSION AND ANALYSIS OF FINANCIAL CONDITION ANDRESULTS OF OPERATIONS
The following section discusses management’s view of the financial condition, results of operationsand cash flows of Sally Beauty and its consolidated subsidiaries, as of and for the fiscal years endedSeptember 30, 2009 and 2008. This section should be read in conjunction with the audited consolidatedfinancial statements of Sally Beauty and, for periods prior to the Separation Transactions, the auditedconsolidated financial statements of Sally Holdings, Inc., and the related notes included elsewhere in thisAnnual Report. This Management’s Discussion and Analysis of Financial Condition and Results ofOperations section contains forward-looking statements. Please see ‘‘Cautionary Notice RegardingForward-Looking Statements’’ for a discussion of the uncertainties, risks and assumptions associated withthese forward-looking statements that could cause results to differ materially from those reflected in suchforward-looking statements.
Highlights of the Fiscal Year Ended September 30, 2009
• Our sales from company-operated stores that have been open for at least 14 months as of the lastday of a month, which we refer to as same store sales, increased 1.8% for the fiscal year endedSeptember 30, 2009;
• Our consolidated net sales for the fiscal year ended September 30, 2009 decreased $11.6 million, or0.4%, to $2,636.6 million compared to the fiscal year ended September 30, 2008. Net sales for thefiscal year ended September 30, 2009 reflect approximately $86.0 million, or 3.2%, in negativeimpact from changes in foreign currency exchange rates;
• Our consolidated gross profit for the fiscal year ended September 30, 2009 increased $8.7 million,or 0.7%, to $1,243.3 million compared to $1,234.6 million for the fiscal year ended September 30,2008. As a percentage of net sales, gross profit increased to 47.2% for the fiscal year endedSeptember 30, 2009, compared to 46.6% for the fiscal year ended September 30, 2008;
• Our consolidated operating earnings for the fiscal year ended September 30, 2009 increased$13.9 million, or 4.9%, to $296.8 million compared to $282.9 million for the fiscal year endedSeptember 30, 2008. As a percentage of net sales, operating earnings were 11.3% for the fiscal yearended September 30, 2009, compared to 10.7% for the fiscal year ended September 30, 2008;
• During fiscal year 2009, we completed our 2-year program to consolidate warehouses and reduceadministrative expenses of the BSG segment. For the fiscal year ended September 30, 2009,unallocated corporate expenses decreased 4.6% to $70.0 million compared to $73.4 million for thefiscal year ended September 30, 2008;
• Sally Beauty Supply and BSG opened or acquired 79 and 62 net new stores, respectively, during thefiscal year ended September 30, 2009;
• On September 30, 2009, we acquired Schoeneman Beauty Supply, Inc., a 43-store beauty supplychain located in the central northeast United States, for approximately $71.0 million, subject tocertain adjustments, and on September 4, 2009, we acquired InterSalon, a leading distributor ofpremier beauty supply products with 16 stores located in Chile for approximately $6.4 million; and
• During fiscal year 2009, we made scheduled payments of $6.1 million, a mandatory repayment inthe amount of $16.7 million and optional repayments in the aggregate amount of $45.0 million onour senior term loan facilities, and repurchased $5.0 million in par value of our 10.5% seniorsubordinated notes (due in November 2016).
38
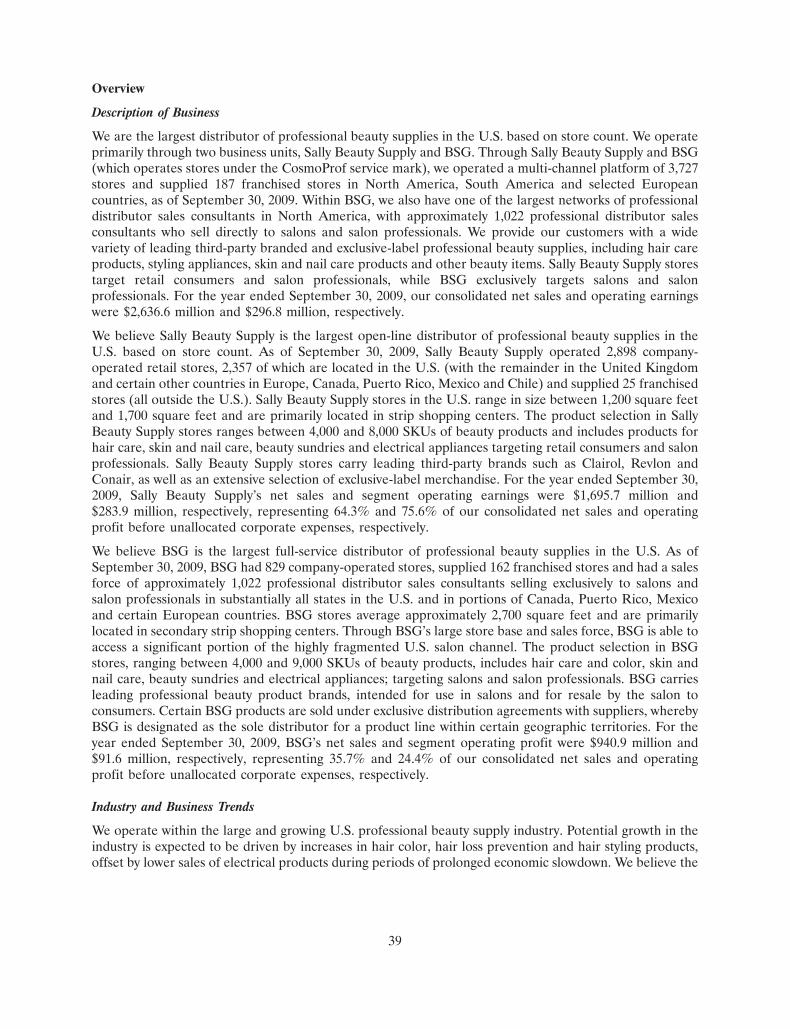
Overview
Description of Business
We are the largest distributor of professional beauty supplies in the U.S. based on store count. We operateprimarily through two business units, Sally Beauty Supply and BSG. Through Sally Beauty Supply and BSG(which operates stores under the CosmoProf service mark), we operated a multi-channel platform of 3,727stores and supplied 187 franchised stores in North America, South America and selected Europeancountries, as of September 30, 2009. Within BSG, we also have one of the largest networks of professionaldistributor sales consultants in North America, with approximately 1,022 professional distributor salesconsultants who sell directly to salons and salon professionals. We provide our customers with a widevariety of leading third-party branded and exclusive-label professional beauty supplies, including hair careproducts, styling appliances, skin and nail care products and other beauty items. Sally Beauty Supply storestarget retail consumers and salon professionals, while BSG exclusively targets salons and salonprofessionals. For the year ended September 30, 2009, our consolidated net sales and operating earningswere $2,636.6 million and $296.8 million, respectively.
We believe Sally Beauty Supply is the largest open-line distributor of professional beauty supplies in theU.S. based on store count. As of September 30, 2009, Sally Beauty Supply operated 2,898 company-operated retail stores, 2,357 of which are located in the U.S. (with the remainder in the United Kingdomand certain other countries in Europe, Canada, Puerto Rico, Mexico and Chile) and supplied 25 franchisedstores (all outside the U.S.). Sally Beauty Supply stores in the U.S. range in size between 1,200 square feetand 1,700 square feet and are primarily located in strip shopping centers. The product selection in SallyBeauty Supply stores ranges between 4,000 and 8,000 SKUs of beauty products and includes products forhair care, skin and nail care, beauty sundries and electrical appliances targeting retail consumers and salonprofessionals. Sally Beauty Supply stores carry leading third-party brands such as Clairol, Revlon andConair, as well as an extensive selection of exclusive-label merchandise. For the year ended September 30,2009, Sally Beauty Supply’s net sales and segment operating earnings were $1,695.7 million and$283.9 million, respectively, representing 64.3% and 75.6% of our consolidated net sales and operatingprofit before unallocated corporate expenses, respectively.
We believe BSG is the largest full-service distributor of professional beauty supplies in the U.S. As ofSeptember 30, 2009, BSG had 829 company-operated stores, supplied 162 franchised stores and had a salesforce of approximately 1,022 professional distributor sales consultants selling exclusively to salons andsalon professionals in substantially all states in the U.S. and in portions of Canada, Puerto Rico, Mexicoand certain European countries. BSG stores average approximately 2,700 square feet and are primarilylocated in secondary strip shopping centers. Through BSG’s large store base and sales force, BSG is able toaccess a significant portion of the highly fragmented U.S. salon channel. The product selection in BSGstores, ranging between 4,000 and 9,000 SKUs of beauty products, includes hair care and color, skin andnail care, beauty sundries and electrical appliances; targeting salons and salon professionals. BSG carriesleading professional beauty product brands, intended for use in salons and for resale by the salon toconsumers. Certain BSG products are sold under exclusive distribution agreements with suppliers, wherebyBSG is designated as the sole distributor for a product line within certain geographic territories. For theyear ended September 30, 2009, BSG’s net sales and segment operating profit were $940.9 million and$91.6 million, respectively, representing 35.7% and 24.4% of our consolidated net sales and operatingprofit before unallocated corporate expenses, respectively.
Industry and Business Trends
We operate within the large and growing U.S. professional beauty supply industry. Potential growth in theindustry is expected to be driven by increases in hair color, hair loss prevention and hair styling products,offset by lower sales of electrical products during periods of prolonged economic slowdown. We believe the
39
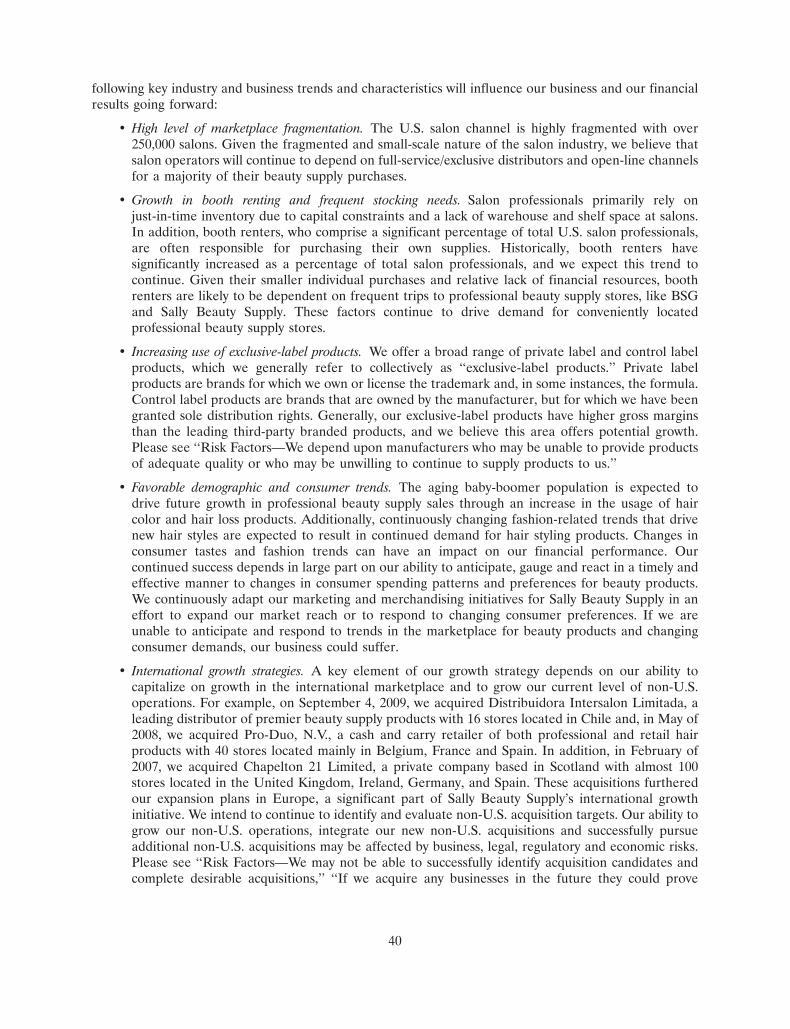
following key industry and business trends and characteristics will influence our business and our financialresults going forward:
• High level of marketplace fragmentation. The U.S. salon channel is highly fragmented with over250,000 salons. Given the fragmented and small-scale nature of the salon industry, we believe thatsalon operators will continue to depend on full-service/exclusive distributors and open-line channelsfor a majority of their beauty supply purchases.
• Growth in booth renting and frequent stocking needs. Salon professionals primarily rely onjust-in-time inventory due to capital constraints and a lack of warehouse and shelf space at salons.In addition, booth renters, who comprise a significant percentage of total U.S. salon professionals,are often responsible for purchasing their own supplies. Historically, booth renters havesignificantly increased as a percentage of total salon professionals, and we expect this trend tocontinue. Given their smaller individual purchases and relative lack of financial resources, boothrenters are likely to be dependent on frequent trips to professional beauty supply stores, like BSGand Sally Beauty Supply. These factors continue to drive demand for conveniently locatedprofessional beauty supply stores.
• Increasing use of exclusive-label products. We offer a broad range of private label and control labelproducts, which we generally refer to collectively as ‘‘exclusive-label products.’’ Private labelproducts are brands for which we own or license the trademark and, in some instances, the formula.Control label products are brands that are owned by the manufacturer, but for which we have beengranted sole distribution rights. Generally, our exclusive-label products have higher gross marginsthan the leading third-party branded products, and we believe this area offers potential growth.Please see ‘‘Risk Factors—We depend upon manufacturers who may be unable to provide productsof adequate quality or who may be unwilling to continue to supply products to us.’’
• Favorable demographic and consumer trends. The aging baby-boomer population is expected todrive future growth in professional beauty supply sales through an increase in the usage of haircolor and hair loss products. Additionally, continuously changing fashion-related trends that drivenew hair styles are expected to result in continued demand for hair styling products. Changes inconsumer tastes and fashion trends can have an impact on our financial performance. Ourcontinued success depends in large part on our ability to anticipate, gauge and react in a timely andeffective manner to changes in consumer spending patterns and preferences for beauty products.We continuously adapt our marketing and merchandising initiatives for Sally Beauty Supply in aneffort to expand our market reach or to respond to changing consumer preferences. If we areunable to anticipate and respond to trends in the marketplace for beauty products and changingconsumer demands, our business could suffer.
• International growth strategies. A key element of our growth strategy depends on our ability tocapitalize on growth in the international marketplace and to grow our current level of non-U.S.operations. For example, on September 4, 2009, we acquired Distribuidora Intersalon Limitada, aleading distributor of premier beauty supply products with 16 stores located in Chile and, in May of2008, we acquired Pro-Duo, N.V., a cash and carry retailer of both professional and retail hairproducts with 40 stores located mainly in Belgium, France and Spain. In addition, in February of2007, we acquired Chapelton 21 Limited, a private company based in Scotland with almost 100stores located in the United Kingdom, Ireland, Germany, and Spain. These acquisitions furtheredour expansion plans in Europe, a significant part of Sally Beauty Supply’s international growthinitiative. We intend to continue to identify and evaluate non-U.S. acquisition targets. Our ability togrow our non-U.S. operations, integrate our new non-U.S. acquisitions and successfully pursueadditional non-U.S. acquisitions may be affected by business, legal, regulatory and economic risks.Please see ‘‘Risk Factors—We may not be able to successfully identify acquisition candidates andcomplete desirable acquisitions,’’ ‘‘If we acquire any businesses in the future they could prove
40
difficult to integrate, disrupt our business or have an adverse effect on our results of operations’’and ‘‘Our ability to conduct business in international marketplaces may be affected by legal,regulatory and economic risks.’’
• Continuing consolidation. There is continuing consolidation among professional beauty productdistributors and professional beauty product manufacturers. We plan to continue to examine waysin which we can benefit from this trend, including reviewing opportunities to shift business fromcompetitive distributors to the BSG network as well as seeking opportunistic, value-addedacquisitions which complement our long-term growth strategy. We believe that suppliers areincreasingly likely to focus on larger distributors and retailers with a broader scale and retailfootprint. We also believe that we are well positioned to capitalize on this trend as well asparticipate in the ongoing consolidation at the distributor/retail level. However, changes often occurin our relationships with suppliers that may materially affect the net sales and operating earnings ofour business segments. Consolidation among suppliers could exacerbate the effects of theserelationship changes and could increase pricing pressures. For example, as we announced inDecember 2006, our largest supplier, L’Oreal, moved a material amount of revenue out of the BSGnationwide distribution network and into competitive regional distribution networks. More recently,L’Oreal acquired distributors competing with BSG in the southeastern and west coast of the U.S.and a supplier that does not currently do business with BSG. As a result, L’Oreal directly competeswith BSG in certain geographic areas. If L’Oreal acquired other distributors or suppliers thatconduct significant business with BSG, we could lose related revenue. There can be no assurancethat there will not be further loss of revenue over time by BSG (including within its franchise-basedbusiness) due to potential losses of additional products (both from L’Oreal and from othersuppliers) as well as from the increased competition from L’Oreal-affiliated distribution networks.Please see ‘‘Risk Factors—The beauty products distribution industry is highly competitive and isconsolidating’’ and ‘‘We depend upon manufacturers who may be unable to provide products ofadequate quality or who may be unwilling to continue to supply products to us.’’
• Relationships with suppliers. Sally Beauty Supply/BSG and their suppliers are dependent on eachother for the distribution of beauty products. We do not manufacture the brand name or exclusive-label products we sell. We purchase our products from a limited number of manufacturers. As istypical in distribution businesses, these relationships are subject to change from time to time(including the expansion or loss of distribution rights in various geographies and the addition or lossof product lines). Since we purchase products from many manufacturers on an at-will basis, undercontracts which can generally be terminated without cause upon 90 days’ notice or less or whichexpire without express rights of renewal, such manufacturers could discontinue sales to us at anytime or upon the expiration of the distribution period. Some of our contracts with manufacturersmay be terminated by such manufacturers if we fail to meet specified minimum purchaserequirements. In such cases, we do not have contractual assurances of continued supply, pricing oraccess to new products and vendors may change the terms upon which they sell. Infrequently, asupplier will seek to terminate a distribution relationship through legal action. Changes in ourrelationships with suppliers occur often and could positively or negatively impact our net sales andoperating profits. Although we focus on developing new revenue and cost management initiatives tomitigate the negative effects resulting from unfavorable changes in our supplier relationships, therecan be no assurance that our efforts will continue to completely offset the loss of these or otherdistribution rights. Please see ‘‘Risk Factors—We depend upon manufacturers who may be unableto provide products of adequate quality or who may be unwilling to continue to supply products tous.’’
We expect to continue to expand our product line offerings and to gain additional distributionrights over time through either further negotiation with suppliers or by strategic acquisitions ofexisting distributors. Although we are focused on developing new revenue and cost management
41
initiatives, there can be no assurance that our efforts will partially or completely offset any potentialloss of distribution rights in the future. Please see ‘‘Risk Factors—We depend upon manufacturerswho may be unable to provide products of adequate quality or who may be unwilling to continue tosupply products to us.’’
• High level of competition. Sally Beauty Supply competes with other domestic and internationalbeauty product wholesale and retail outlets, including local and regional open-line beauty supplystores, professional-only beauty supply stores, salons, mass merchandisers, drug stores andsupermarkets, as well as sellers on the internet and salons retailing hair care items. BSG competeswith other domestic and international beauty product wholesale and retail suppliers andmanufacturers selling professional beauty products directly to salons and individual salonprofessionals. We also face competition from authorized and unauthorized retailers and internetsites offering professional salon-only products. The increasing availability of unauthorizedprofessional salon products in large format retail stores such as drug stores, grocery stores andothers could also have a negative impact on our business. Please see ‘‘Risk Factors—The beautyproducts distribution industry is highly competitive and is consolidating.’’
• Economic conditions. We appeal to a wide demographic consumer profile and offer a broadselection of beauty products sold directly to retail consumers and salons and salon professionals.Historically, these factors have provided us with reduced exposure to downturns in economicconditions in the countries in which we operate. However, a continued downturn in the economy,especially for an extended period of time, could adversely impact consumer demand ofdiscretionary items such as beauty products and salon services, particularly affecting our electricalproducts category and our full-service sales business. In addition, higher freight costs resulting fromincreases in the cost of fuel, especially for an extended period of time, may impact our expenses atlevels that we cannot pass through to our customers. These factors could have a material adverseeffect on our business, financial condition and results of operations. Please see ‘‘Risk Factors—Afurther downturn in the economy may affect consumer purchases of discretionary items such asbeauty products and salon services, which could have a material adverse effect on our business,financial condition and results of operations.’’
• Controlling expenses. Another important aspect of our business is our ability to control costs,especially in our BSG business segment, by right-sizing the business and maximizing the efficiencyof our structure. In late fiscal year 2007, we began implementing an approximately $22.0 millioncapital spending program to consolidate warehouses and reduce administrative expenses related toBSG’s distribution network optimization program. We estimate that this program resulted in costsavings of approximately $8.0 million in the fiscal year 2009 and believe that annualized cost savingsfrom this program could approximate $10.0 million beginning in fiscal year 2010. Please see ‘‘RiskFactors—We are not certain that our ongoing cost control plans will continue to be successful.’’
• Opening new stores. Our future growth strategy depends in part on our ability to open andprofitably operate new stores in existing and additional geographic areas. The capital requirementsto open a U.S.—based Sally Beauty Supply or BSG store, excluding inventory, averageapproximately $70,000 and $80,000, respectively, with the capital requirements for internationalstores costing less or substantially more depending upon the marketplace. However, in response toeconomic conditions and to allow flexibility to capitalize on potential real estate revaluations in keylocations, we have slowed our new store openings. We may not be able to open all of the new storeswe plan to open and any new stores we open may not be profitable, any of which could have amaterial adverse impact on our financial condition or results of operations. Please see ‘‘RiskFactors—If we are unable to profitably open and operate new stores, our business, financialcondition and results of operations may be adversely affected.’’
42
• Changes to our information technology systems. As our operations grow in both size and scope, wewill continuously need to improve and upgrade our information systems and infrastructure whilemaintaining the reliability and integrity of our systems and infrastructure. The expansion of oursystems and infrastructure will require us to commit substantial financial, operational and technicalresources in advance of any increase in the volume of our business, with no assurance that thevolume of business will increase. For example, in fiscal year 2009, we began upgrading ourdistribution information systems (in connection with our capital spending program to consolidatewarehouses, as discussed above), upgrading our AS400 iSeries servers and installing Hyperionsoftware to enhance our financial reporting system. These and any other required upgrades to ourinformation systems and information technology (or new technology), now or in the future, willrequire that our management and resources be diverted from our core business to assist incompletion of these projects. There can be no assurance that the time and resources ourmanagement will need to devote to these upgrades, service outages or delays due to the installationof any new or upgraded technology (and customer issues therewith), or the impact on the reliabilityof our data from any new or upgraded technology will not have a material adverse effect on ourfinancial reporting, business, financial condition or results of operations. Please see ‘‘Risk Factors—We may be adversely affected by any disruption in our information technology systems.’’
Significant Recent Acquisitions
During the fiscal year 2009, we acquired Schoeneman Beauty Supply, Inc. (‘‘Schoeneman’’) at a cost ofapproximately $71.0 million, subject to certain adjustments, of which a significant portion was allocated togoodwill. The acquisition of Schoeneman, a 43-store beauty supply chain located in the central northeastUnited States, was on September 30, 2009 and was pursuant to a merger agreement between Schoeneman,the former stockholders of Schoeneman and a subsidiary of the Company. The Company currently expectsto realize approximately $10 million of future tax savings as a result of anticipated incrementaldepreciation and amortization tax deductions relating to the assets acquired in this transaction. Goodwillof approximately $61.0 million was recorded as a result of this acquisition. In addition, during the fiscalyear 2009, we completed several other individually immaterial acquisitions at an aggregate cost of$11.3 million. The purchase prices of all acquisitions completed during the fiscal year 2009 have beenallocated to assets acquired and liabilities assumed based on their estimated fair values at the date ofacquisition. The final valuation of the assets acquired and liabilities assumed will be completed duringfiscal year 2010. Generally, we funded these acquisitions with cash from operations.
During the fiscal year 2008, we completed several acquisitions at an aggregate cost of $53.4 million, ofwhich substantially all was allocated to intangible assets and goodwill. Generally, we funded theseacquisitions with cash from operations as well as borrowings under our ABL facility. In May of 2008, weacquired Pro-Duo, a 40-store beauty supply chain with stores mainly in Belgium, France and Spain, forA19.3 million (approximately $29.8 million plus incidental acquisition costs capitalized) subject to certainadjustments. This acquisition provided the Sally Beauty Supply segment with an expanded geographicfootprint in continental Europe and was funded with cash from operations and borrowings on oursubsidiaries’ ABL facility. We also assumed A3.0 million (approximately $4.7 million) of pre-acquisitiondebt of Pro-Duo in connection with the acquisition.
During the fiscal year 2007, we acquired Chapelton 21 Limited, which we refer to as Salon Services, aprivate company based in Scotland. This acquisition provided the Sally Beauty Supply segment a strongEuropean presence. We acquired Salon Services for an aggregate cash purchase price of approximately$57.8 million of which $30.0 million was allocated to goodwill and $17.6 million was allocated toidentifiable intangible assets. Certain of our subsidiaries financed the purchase price through a draw-downof approximately $57.0 million under our subsidiaries’ ABL facility. In addition, we extinguishedapproximately $3.9 million of pre-acquisition debt of Salon Services. Salon Services, through its direct and
43
indirect subsidiaries supplies professional hair and beauty products primarily to salon and spa operatorsand independent hair and beauty professionals in the United Kingdom, Germany, Ireland and Spain.
Our Separation from Alberto-Culver
Our business historically constituted two operating segments within the consolidated financial statementsof Alberto-Culver. On November 16, 2006, we separated from Alberto-Culver, pursuant to the InvestmentAgreement. As a result: (i) we own and operate the Sally Beauty Supply and BSG distribution businessesthat were owned and operated by Alberto-Culver prior to the Separation Transactions; (ii) at the closing ofthe Separation Transactions, the stockholders of Alberto-Culver prior thereto became the beneficialowners of approximately 52% of our outstanding common stock on an undiluted basis and the CDRInvestors, who in the aggregate invested $575.0 million in us, received an equity interest representingapproximately 48% of our outstanding common stock on an undiluted basis; and (iii) Alberto-Culvercontinued to own and operate its consumer products business. In addition, in connection with theSeparation Transactions, the Company, through subsidiaries Sally Investment Holdings LLC (‘‘SallyInvestment’’) and Sally Holdings, incurred approximately $1,850.0 million of indebtedness. See Note 12 ofthe ‘‘Notes to Consolidated Financial Statements’’ in ‘‘Item 8—Financial Statements and SupplementaryData’’ of this Annual Report.
Prior to November 16, 2006, the Company was a subsidiary of Alberto-Culver and had no share-basedcompensation plans of its own; however, certain employees of the Company had been granted stockoptions and stock awards under share-based compensation plans of Alberto-Culver. Alberto-Culvertreated the Separation Transactions as though they constituted a change in control for purposes ofAlberto-Culver’s stock options and stock awards. As a result, in accordance with the terms of these plans,all outstanding stock options and restricted shares of Alberto-Culver, including those held by ouremployees, became fully vested upon completion of the Separation Transactions. Due to the SeparationTransactions, during the fiscal year 2007, we recorded a charge of approximately $5.3 million, whichrepresents the amount of future compensation expense that would have been recognized in subsequentperiods as the stock options and restricted shares for our employees vested over the original vestingperiods. Upon completion of the Separation Transactions, all outstanding Alberto-Culver stock optionsheld by our employees became options to purchase shares of our common stock.
Credit Facilities
The Term Loans and the ABL facility are secured by substantially all of our assets, those of SallyInvestment, those of our domestic subsidiaries and, in the case of the ABL facility, those of our Canadiansubsidiaries. The Term Loans may be prepaid at our option at any time without premium or penalty. Suchfacility is subject to mandatory prepayment in an amount equal to 50% of excess cash flow (as defined inthe agreement governing the Term Loans) for any fiscal year unless a specified leverage ratio is met.Additionally, the facility is subject to mandatory prepayment in an amount equal to 100% of the proceedsof specified asset sales that are not reinvested in the business or applied to repay borrowings under theABL facility.
Our Notes are unsecured obligations of Sally Holdings and its co-issuer and are guaranteed on a seniorbasis (in the case of the senior notes) and on a senior subordinated basis (in the case of the seniorsubordinated notes) by each material domestic subsidiary of Sally Holdings (other than the co-issuer). OurNotes carry optional redemption features whereby Sally Holdings has the option to redeem the Notes onor before November 15, 2010 and November 15, 2011, respectively, at par plus a premium, plus accruedand unpaid interest and, thereafter, at par plus a premium declining ratably to par, plus accrued andunpaid interest.
44
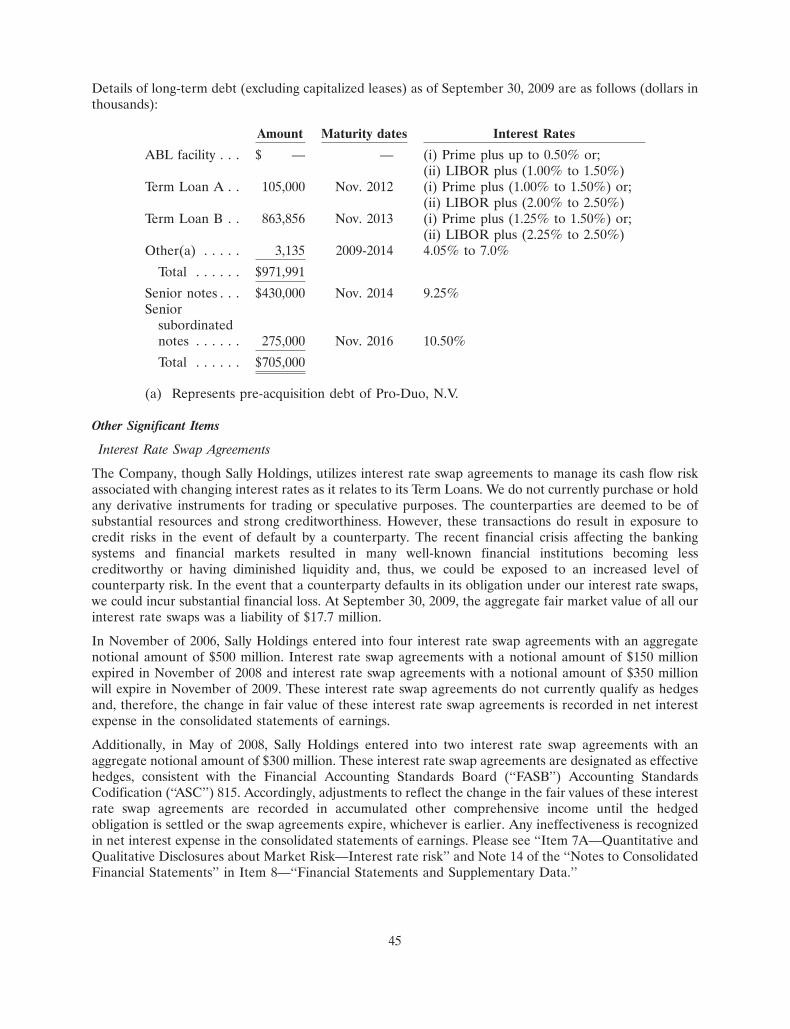
Details of long-term debt (excluding capitalized leases) as of September 30, 2009 are as follows (dollars inthousands):
Amount Maturity dates Interest Rates
ABL facility . . . $ — — (i) Prime plus up to 0.50% or;(ii) LIBOR plus (1.00% to 1.50%)
Term Loan A . . 105,000 Nov. 2012 (i) Prime plus (1.00% to 1.50%) or;(ii) LIBOR plus (2.00% to 2.50%)
Term Loan B . . 863,856 Nov. 2013 (i) Prime plus (1.25% to 1.50%) or;(ii) LIBOR plus (2.25% to 2.50%)
Other(a) . . . . . 3,135 2009-2014 4.05% to 7.0%
Total . . . . . . $971,991
Senior notes . . . $430,000 Nov. 2014 9.25%Senior
subordinatednotes . . . . . . 275,000 Nov. 2016 10.50%
Total . . . . . . $705,000
(a) Represents pre-acquisition debt of Pro-Duo, N.V.
Other Significant Items
Interest Rate Swap Agreements
The Company, though Sally Holdings, utilizes interest rate swap agreements to manage its cash flow riskassociated with changing interest rates as it relates to its Term Loans. We do not currently purchase or holdany derivative instruments for trading or speculative purposes. The counterparties are deemed to be ofsubstantial resources and strong creditworthiness. However, these transactions do result in exposure tocredit risks in the event of default by a counterparty. The recent financial crisis affecting the bankingsystems and financial markets resulted in many well-known financial institutions becoming lesscreditworthy or having diminished liquidity and, thus, we could be exposed to an increased level ofcounterparty risk. In the event that a counterparty defaults in its obligation under our interest rate swaps,we could incur substantial financial loss. At September 30, 2009, the aggregate fair market value of all ourinterest rate swaps was a liability of $17.7 million.
In November of 2006, Sally Holdings entered into four interest rate swap agreements with an aggregatenotional amount of $500 million. Interest rate swap agreements with a notional amount of $150 millionexpired in November of 2008 and interest rate swap agreements with a notional amount of $350 millionwill expire in November of 2009. These interest rate swap agreements do not currently qualify as hedgesand, therefore, the change in fair value of these interest rate swap agreements is recorded in net interestexpense in the consolidated statements of earnings.
Additionally, in May of 2008, Sally Holdings entered into two interest rate swap agreements with anaggregate notional amount of $300 million. These interest rate swap agreements are designated as effectivehedges, consistent with the Financial Accounting Standards Board (‘‘FASB’’) Accounting StandardsCodification (‘‘ASC’’) 815. Accordingly, adjustments to reflect the change in the fair values of these interestrate swap agreements are recorded in accumulated other comprehensive income until the hedgedobligation is settled or the swap agreements expire, whichever is earlier. Any ineffectiveness is recognizedin net interest expense in the consolidated statements of earnings. Please see ‘‘Item 7A—Quantitative andQualitative Disclosures about Market Risk—Interest rate risk’’ and Note 14 of the ‘‘Notes to ConsolidatedFinancial Statements’’ in Item 8—‘‘Financial Statements and Supplementary Data.’’
45
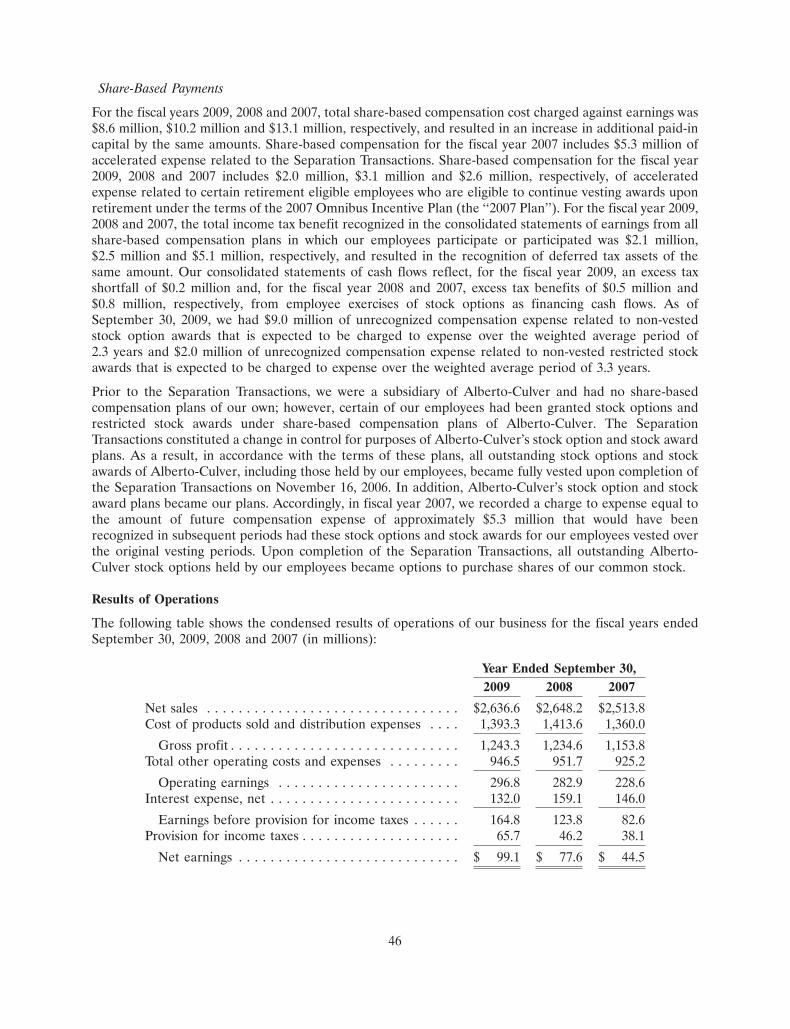
Share-Based Payments
For the fiscal years 2009, 2008 and 2007, total share-based compensation cost charged against earnings was$8.6 million, $10.2 million and $13.1 million, respectively, and resulted in an increase in additional paid-incapital by the same amounts. Share-based compensation for the fiscal year 2007 includes $5.3 million ofaccelerated expense related to the Separation Transactions. Share-based compensation for the fiscal year2009, 2008 and 2007 includes $2.0 million, $3.1 million and $2.6 million, respectively, of acceleratedexpense related to certain retirement eligible employees who are eligible to continue vesting awards uponretirement under the terms of the 2007 Omnibus Incentive Plan (the ‘‘2007 Plan’’). For the fiscal year 2009,2008 and 2007, the total income tax benefit recognized in the consolidated statements of earnings from allshare-based compensation plans in which our employees participate or participated was $2.1 million,$2.5 million and $5.1 million, respectively, and resulted in the recognition of deferred tax assets of thesame amount. Our consolidated statements of cash flows reflect, for the fiscal year 2009, an excess taxshortfall of $0.2 million and, for the fiscal year 2008 and 2007, excess tax benefits of $0.5 million and$0.8 million, respectively, from employee exercises of stock options as financing cash flows. As ofSeptember 30, 2009, we had $9.0 million of unrecognized compensation expense related to non-vestedstock option awards that is expected to be charged to expense over the weighted average period of2.3 years and $2.0 million of unrecognized compensation expense related to non-vested restricted stockawards that is expected to be charged to expense over the weighted average period of 3.3 years.
Prior to the Separation Transactions, we were a subsidiary of Alberto-Culver and had no share-basedcompensation plans of our own; however, certain of our employees had been granted stock options andrestricted stock awards under share-based compensation plans of Alberto-Culver. The SeparationTransactions constituted a change in control for purposes of Alberto-Culver’s stock option and stock awardplans. As a result, in accordance with the terms of these plans, all outstanding stock options and stockawards of Alberto-Culver, including those held by our employees, became fully vested upon completion ofthe Separation Transactions on November 16, 2006. In addition, Alberto-Culver’s stock option and stockaward plans became our plans. Accordingly, in fiscal year 2007, we recorded a charge to expense equal tothe amount of future compensation expense of approximately $5.3 million that would have beenrecognized in subsequent periods had these stock options and stock awards for our employees vested overthe original vesting periods. Upon completion of the Separation Transactions, all outstanding Alberto-Culver stock options held by our employees became options to purchase shares of our common stock.
Results of Operations
The following table shows the condensed results of operations of our business for the fiscal years endedSeptember 30, 2009, 2008 and 2007 (in millions):
Year Ended September 30,2009 2008 2007
Net sales . . . . . . . . . . . . . . . . . . . . . . . . . . . . . . . . $2,636.6 $2,648.2 $2,513.8Cost of products sold and distribution expenses . . . . 1,393.3 1,413.6 1,360.0
Gross profit . . . . . . . . . . . . . . . . . . . . . . . . . . . . . 1,243.3 1,234.6 1,153.8Total other operating costs and expenses . . . . . . . . . 946.5 951.7 925.2
Operating earnings . . . . . . . . . . . . . . . . . . . . . . . 296.8 282.9 228.6Interest expense, net . . . . . . . . . . . . . . . . . . . . . . . . 132.0 159.1 146.0
Earnings before provision for income taxes . . . . . . 164.8 123.8 82.6Provision for income taxes . . . . . . . . . . . . . . . . . . . . 65.7 46.2 38.1
Net earnings . . . . . . . . . . . . . . . . . . . . . . . . . . . . $ 99.1 $ 77.6 $ 44.5
46
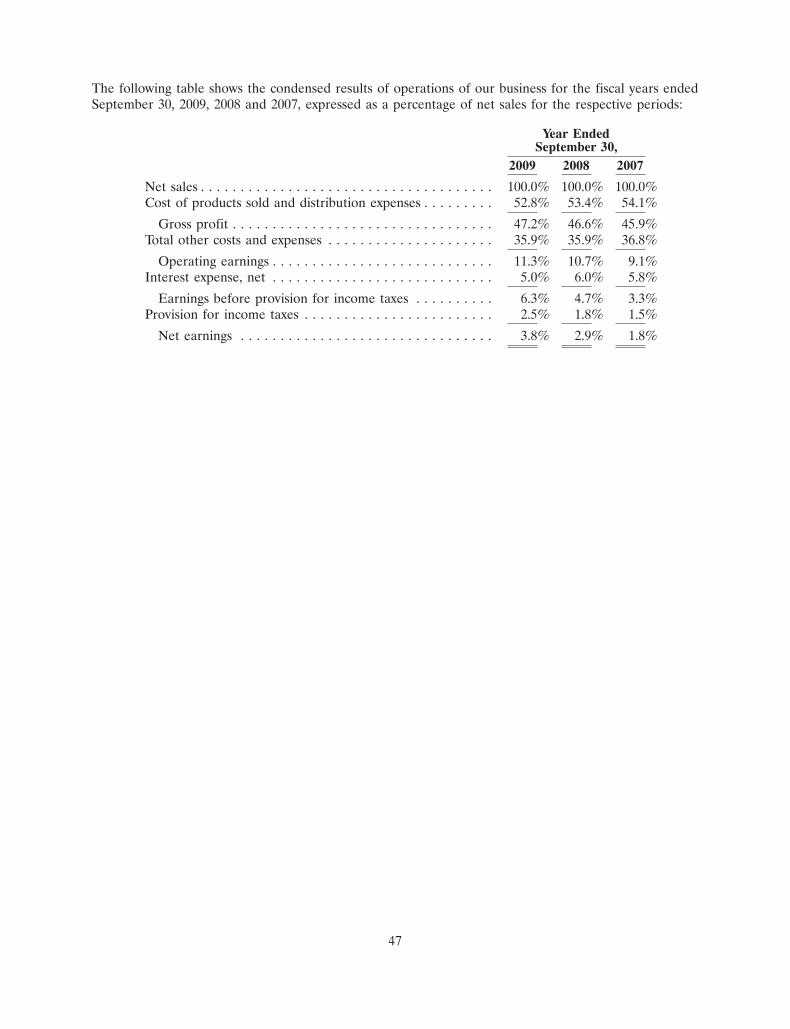
The following table shows the condensed results of operations of our business for the fiscal years endedSeptember 30, 2009, 2008 and 2007, expressed as a percentage of net sales for the respective periods:
Year EndedSeptember 30,
2009 2008 2007
Net sales . . . . . . . . . . . . . . . . . . . . . . . . . . . . . . . . . . . . . 100.0% 100.0% 100.0%Cost of products sold and distribution expenses . . . . . . . . . 52.8% 53.4% 54.1%
Gross profit . . . . . . . . . . . . . . . . . . . . . . . . . . . . . . . . . 47.2% 46.6% 45.9%Total other costs and expenses . . . . . . . . . . . . . . . . . . . . . 35.9% 35.9% 36.8%
Operating earnings . . . . . . . . . . . . . . . . . . . . . . . . . . . . 11.3% 10.7% 9.1%Interest expense, net . . . . . . . . . . . . . . . . . . . . . . . . . . . . 5.0% 6.0% 5.8%
Earnings before provision for income taxes . . . . . . . . . . 6.3% 4.7% 3.3%Provision for income taxes . . . . . . . . . . . . . . . . . . . . . . . . 2.5% 1.8% 1.5%
Net earnings . . . . . . . . . . . . . . . . . . . . . . . . . . . . . . . . 3.8% 2.9% 1.8%
47
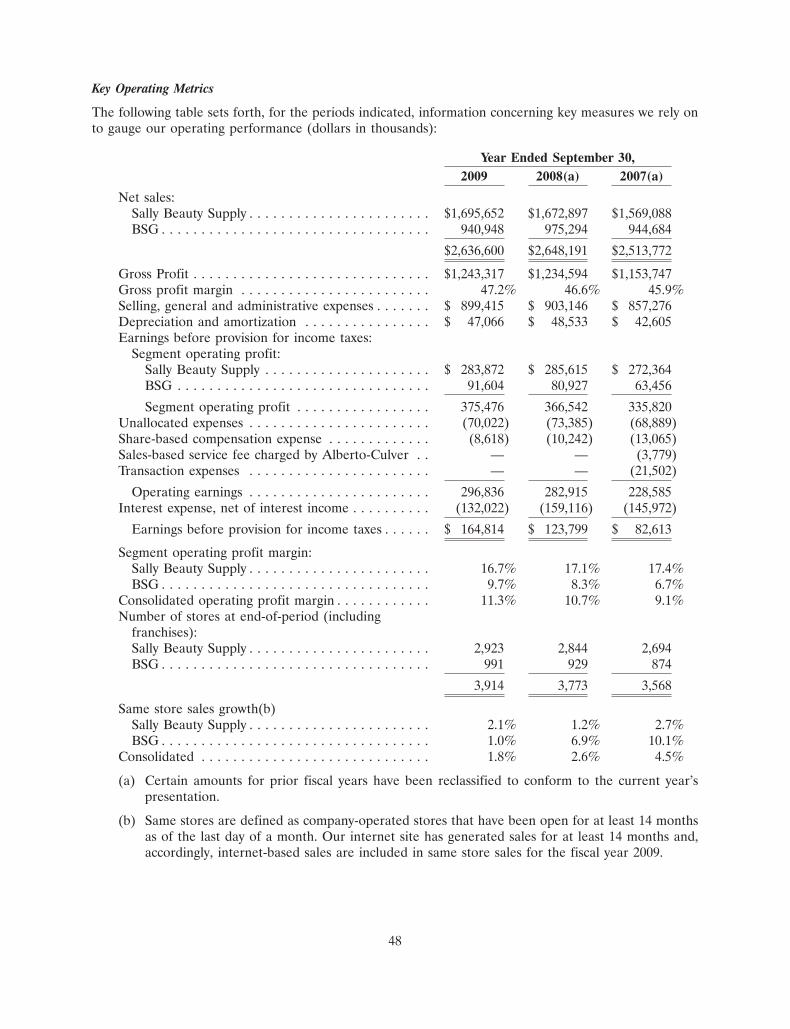
Key Operating Metrics
The following table sets forth, for the periods indicated, information concerning key measures we rely onto gauge our operating performance (dollars in thousands):
Year Ended September 30,2009 2008(a) 2007(a)
Net sales:Sally Beauty Supply . . . . . . . . . . . . . . . . . . . . . . . $1,695,652 $1,672,897 $1,569,088BSG . . . . . . . . . . . . . . . . . . . . . . . . . . . . . . . . . . 940,948 975,294 944,684
$2,636,600 $2,648,191 $2,513,772
Gross Profit . . . . . . . . . . . . . . . . . . . . . . . . . . . . . . $1,243,317 $1,234,594 $1,153,747Gross profit margin . . . . . . . . . . . . . . . . . . . . . . . . 47.2% 46.6% 45.9%Selling, general and administrative expenses . . . . . . . $ 899,415 $ 903,146 $ 857,276Depreciation and amortization . . . . . . . . . . . . . . . . $ 47,066 $ 48,533 $ 42,605Earnings before provision for income taxes:
Segment operating profit:Sally Beauty Supply . . . . . . . . . . . . . . . . . . . . . $ 283,872 $ 285,615 $ 272,364BSG . . . . . . . . . . . . . . . . . . . . . . . . . . . . . . . . 91,604 80,927 63,456
Segment operating profit . . . . . . . . . . . . . . . . . 375,476 366,542 335,820Unallocated expenses . . . . . . . . . . . . . . . . . . . . . . . (70,022) (73,385) (68,889)Share-based compensation expense . . . . . . . . . . . . . (8,618) (10,242) (13,065)Sales-based service fee charged by Alberto-Culver . . — — (3,779)Transaction expenses . . . . . . . . . . . . . . . . . . . . . . . — — (21,502)
Operating earnings . . . . . . . . . . . . . . . . . . . . . . . 296,836 282,915 228,585Interest expense, net of interest income . . . . . . . . . . (132,022) (159,116) (145,972)
Earnings before provision for income taxes . . . . . . $ 164,814 $ 123,799 $ 82,613
Segment operating profit margin:Sally Beauty Supply . . . . . . . . . . . . . . . . . . . . . . . 16.7% 17.1% 17.4%BSG . . . . . . . . . . . . . . . . . . . . . . . . . . . . . . . . . . 9.7% 8.3% 6.7%
Consolidated operating profit margin . . . . . . . . . . . . 11.3% 10.7% 9.1%Number of stores at end-of-period (including
franchises):Sally Beauty Supply . . . . . . . . . . . . . . . . . . . . . . . 2,923 2,844 2,694BSG . . . . . . . . . . . . . . . . . . . . . . . . . . . . . . . . . . 991 929 874
3,914 3,773 3,568
Same store sales growth(b)Sally Beauty Supply . . . . . . . . . . . . . . . . . . . . . . . 2.1% 1.2% 2.7%BSG . . . . . . . . . . . . . . . . . . . . . . . . . . . . . . . . . . 1.0% 6.9% 10.1%
Consolidated . . . . . . . . . . . . . . . . . . . . . . . . . . . . . 1.8% 2.6% 4.5%
(a) Certain amounts for prior fiscal years have been reclassified to conform to the current year’spresentation.
(b) Same stores are defined as company-operated stores that have been open for at least 14 monthsas of the last day of a month. Our internet site has generated sales for at least 14 months and,accordingly, internet-based sales are included in same store sales for the fiscal year 2009.
48
Description of Sales and Expenses
Net Sales. Our net sales consist primarily of the following:
• Sally Beauty Supply. Sally Beauty Supply generates net sales primarily by selling products throughits stores to both professional and retail customers. Sally Beauty Supply sells hair care, hair color,skin and nail care products, electrical appliances and other beauty related accessories. Becauseapproximately 42% of our Sally Beauty Supply product sales come from exclusive or control labelbrands, most of these same products are generally not available in most other retail stores or in ourBSG business segment. Various factors influence Sally Beauty Supply’s net sales including localcompetition, product assortment and availability, price, hours of operation and marketing andpromotional activity. Sally Beauty Supply’s product assortment and sales are generally not seasonalin nature.
• Beauty Systems Group. BSG generates net sales by selling products to salon professionals andindependent stylists through company-operated and franchised stores as well as through its networkof professional distributor sales consultants. BSG sells hair care, hair color products, skin and nailcare products, electrical appliances and other beauty related accessories. These products are notsold directly to the general public and are generally not the same products as those sold in our SallyBeauty Supply stores. Various factors influence BSG’s net sales, including product breadth andavailability, competitive activity, relationships with suppliers, new product introductions and price.BSG’s product assortment and sales are generally not seasonal in nature.
Cost of Products Sold and Distribution Expenses. Cost of products sold and distribution expenses consist ofthe cost to purchase merchandise from suppliers, less rebates and allowances, and certain overheadexpenses including purchasing costs, freight from distribution centers to stores and handling costs in thedistribution centers. Cost of products sold and distribution expenses are also affected by store inventoryshrinkage, which represents products that are lost, stolen or damaged at the store level.
Selling, General and Administrative Expenses. Selling, general and administrative expenses consistprimarily of personnel costs, commissions paid to professional distributor sales consultants, benefits,utilities, property maintenance, advertising, rent, insurance, freight and distribution expenses for deliveryto customers, administrative costs and costs associated with our corporate support center.
Sales-based Service Fee. Prior to the Separation Transactions, we were charged a sales-based service feeunder the consulting, business development and advisory services agreement between certain of oursubsidiaries and Alberto-Culver. In conjunction with the Separation Transactions, the arrangements givingrise to this fee from Alberto-Culver were terminated and the related charges have ceased. We believe thathad we been a stand-alone company, we would have not incurred a comparable expense.
Transaction Expenses. For fiscal year 2007, transaction expenses are costs associated with the SeparationTransactions and are primarily payments to Alberto-Culver pursuant to the separation agreements. Inaddition, we recognized severance costs for two executives and certain professional fees related to theSeparation Transactions.
Net Interest Expense. Net interest expense includes the amortization of deferred debt issuance costs and isstated net of interest income. Net interest expense is primarily associated with debt incurred in connectionwith the Separation Transactions.
49
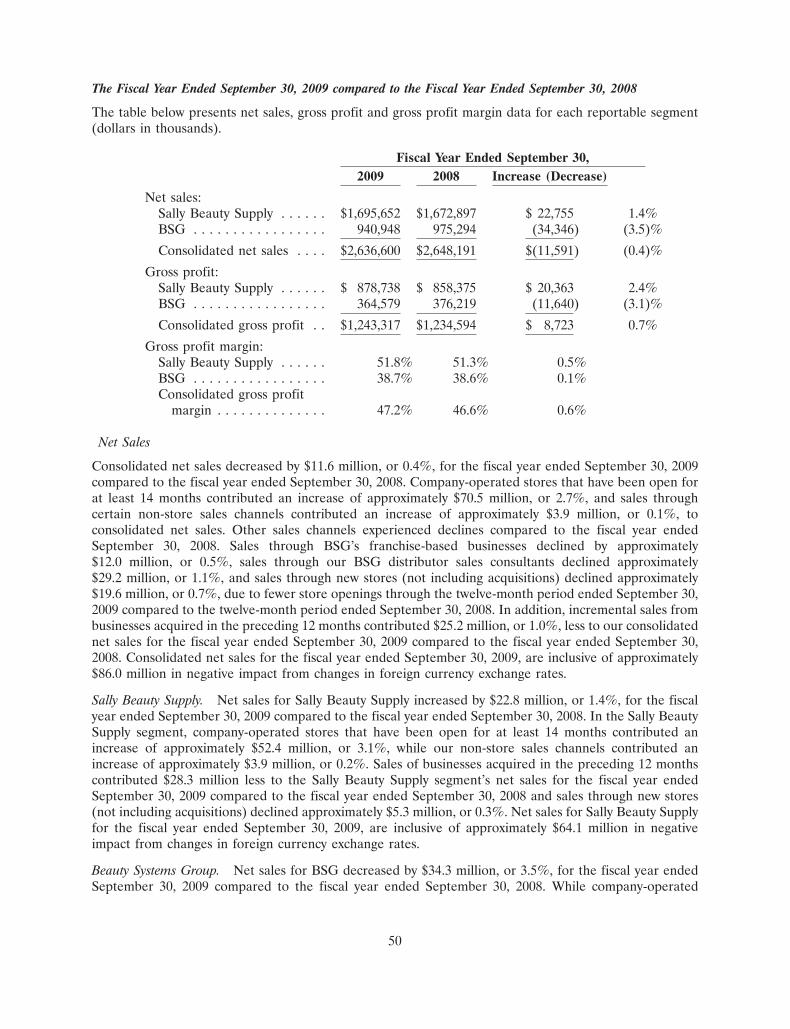
The Fiscal Year Ended September 30, 2009 compared to the Fiscal Year Ended September 30, 2008
The table below presents net sales, gross profit and gross profit margin data for each reportable segment(dollars in thousands).
Fiscal Year Ended September 30,2009 2008 Increase (Decrease)
Net sales:Sally Beauty Supply . . . . . . $1,695,652 $1,672,897 $ 22,755 1.4%BSG . . . . . . . . . . . . . . . . . 940,948 975,294 (34,346) (3.5)%
Consolidated net sales . . . . $2,636,600 $2,648,191 $(11,591) (0.4)%
Gross profit:Sally Beauty Supply . . . . . . $ 878,738 $ 858,375 $ 20,363 2.4%BSG . . . . . . . . . . . . . . . . . 364,579 376,219 (11,640) (3.1)%
Consolidated gross profit . . $1,243,317 $1,234,594 $ 8,723 0.7%
Gross profit margin:Sally Beauty Supply . . . . . . 51.8% 51.3% 0.5%BSG . . . . . . . . . . . . . . . . . 38.7% 38.6% 0.1%Consolidated gross profit
margin . . . . . . . . . . . . . . 47.2% 46.6% 0.6%
Net Sales
Consolidated net sales decreased by $11.6 million, or 0.4%, for the fiscal year ended September 30, 2009compared to the fiscal year ended September 30, 2008. Company-operated stores that have been open forat least 14 months contributed an increase of approximately $70.5 million, or 2.7%, and sales throughcertain non-store sales channels contributed an increase of approximately $3.9 million, or 0.1%, toconsolidated net sales. Other sales channels experienced declines compared to the fiscal year endedSeptember 30, 2008. Sales through BSG’s franchise-based businesses declined by approximately$12.0 million, or 0.5%, sales through our BSG distributor sales consultants declined approximately$29.2 million, or 1.1%, and sales through new stores (not including acquisitions) declined approximately$19.6 million, or 0.7%, due to fewer store openings through the twelve-month period ended September 30,2009 compared to the twelve-month period ended September 30, 2008. In addition, incremental sales frombusinesses acquired in the preceding 12 months contributed $25.2 million, or 1.0%, less to our consolidatednet sales for the fiscal year ended September 30, 2009 compared to the fiscal year ended September 30,2008. Consolidated net sales for the fiscal year ended September 30, 2009, are inclusive of approximately$86.0 million in negative impact from changes in foreign currency exchange rates.
Sally Beauty Supply. Net sales for Sally Beauty Supply increased by $22.8 million, or 1.4%, for the fiscalyear ended September 30, 2009 compared to the fiscal year ended September 30, 2008. In the Sally BeautySupply segment, company-operated stores that have been open for at least 14 months contributed anincrease of approximately $52.4 million, or 3.1%, while our non-store sales channels contributed anincrease of approximately $3.9 million, or 0.2%. Sales of businesses acquired in the preceding 12 monthscontributed $28.3 million less to the Sally Beauty Supply segment’s net sales for the fiscal year endedSeptember 30, 2009 compared to the fiscal year ended September 30, 2008 and sales through new stores(not including acquisitions) declined approximately $5.3 million, or 0.3%. Net sales for Sally Beauty Supplyfor the fiscal year ended September 30, 2009, are inclusive of approximately $64.1 million in negativeimpact from changes in foreign currency exchange rates.
Beauty Systems Group. Net sales for BSG decreased by $34.3 million, or 3.5%, for the fiscal year endedSeptember 30, 2009 compared to the fiscal year ended September 30, 2008. While company-operated
50
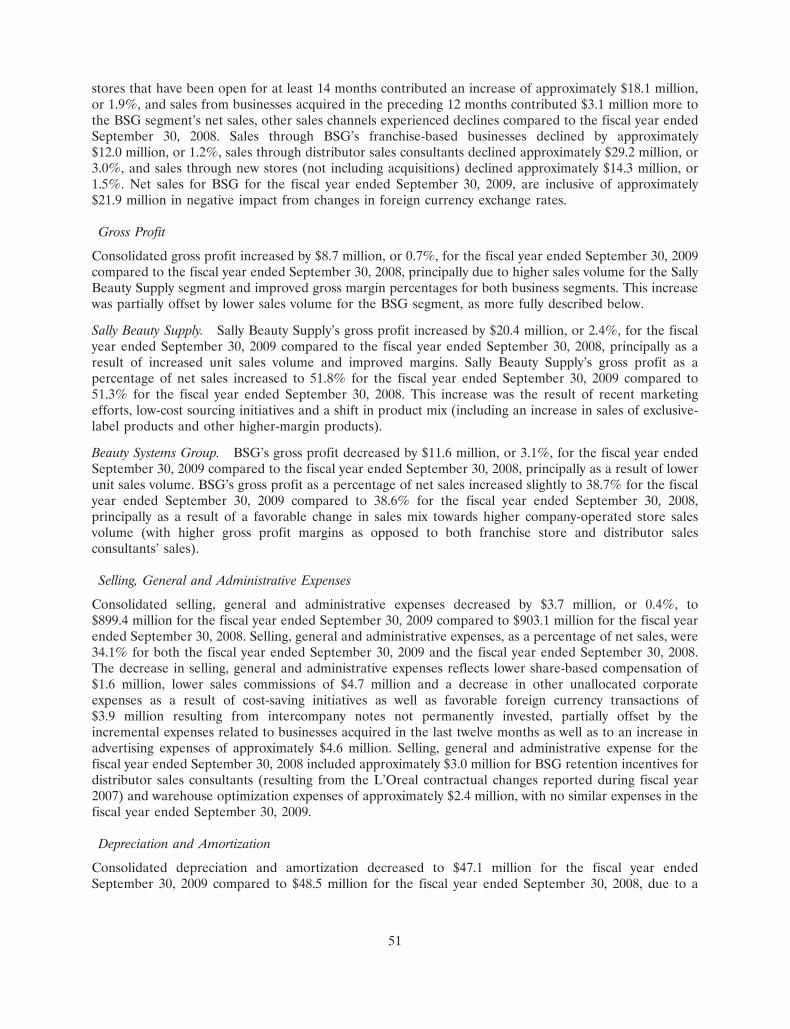
stores that have been open for at least 14 months contributed an increase of approximately $18.1 million,or 1.9%, and sales from businesses acquired in the preceding 12 months contributed $3.1 million more tothe BSG segment’s net sales, other sales channels experienced declines compared to the fiscal year endedSeptember 30, 2008. Sales through BSG’s franchise-based businesses declined by approximately$12.0 million, or 1.2%, sales through distributor sales consultants declined approximately $29.2 million, or3.0%, and sales through new stores (not including acquisitions) declined approximately $14.3 million, or1.5%. Net sales for BSG for the fiscal year ended September 30, 2009, are inclusive of approximately$21.9 million in negative impact from changes in foreign currency exchange rates.
Gross Profit
Consolidated gross profit increased by $8.7 million, or 0.7%, for the fiscal year ended September 30, 2009compared to the fiscal year ended September 30, 2008, principally due to higher sales volume for the SallyBeauty Supply segment and improved gross margin percentages for both business segments. This increasewas partially offset by lower sales volume for the BSG segment, as more fully described below.
Sally Beauty Supply. Sally Beauty Supply’s gross profit increased by $20.4 million, or 2.4%, for the fiscalyear ended September 30, 2009 compared to the fiscal year ended September 30, 2008, principally as aresult of increased unit sales volume and improved margins. Sally Beauty Supply’s gross profit as apercentage of net sales increased to 51.8% for the fiscal year ended September 30, 2009 compared to51.3% for the fiscal year ended September 30, 2008. This increase was the result of recent marketingefforts, low-cost sourcing initiatives and a shift in product mix (including an increase in sales of exclusive-label products and other higher-margin products).
Beauty Systems Group. BSG’s gross profit decreased by $11.6 million, or 3.1%, for the fiscal year endedSeptember 30, 2009 compared to the fiscal year ended September 30, 2008, principally as a result of lowerunit sales volume. BSG’s gross profit as a percentage of net sales increased slightly to 38.7% for the fiscalyear ended September 30, 2009 compared to 38.6% for the fiscal year ended September 30, 2008,principally as a result of a favorable change in sales mix towards higher company-operated store salesvolume (with higher gross profit margins as opposed to both franchise store and distributor salesconsultants’ sales).
Selling, General and Administrative Expenses
Consolidated selling, general and administrative expenses decreased by $3.7 million, or 0.4%, to$899.4 million for the fiscal year ended September 30, 2009 compared to $903.1 million for the fiscal yearended September 30, 2008. Selling, general and administrative expenses, as a percentage of net sales, were34.1% for both the fiscal year ended September 30, 2009 and the fiscal year ended September 30, 2008.The decrease in selling, general and administrative expenses reflects lower share-based compensation of$1.6 million, lower sales commissions of $4.7 million and a decrease in other unallocated corporateexpenses as a result of cost-saving initiatives as well as favorable foreign currency transactions of$3.9 million resulting from intercompany notes not permanently invested, partially offset by theincremental expenses related to businesses acquired in the last twelve months as well as to an increase inadvertising expenses of approximately $4.6 million. Selling, general and administrative expense for thefiscal year ended September 30, 2008 included approximately $3.0 million for BSG retention incentives fordistributor sales consultants (resulting from the L’Oreal contractual changes reported during fiscal year2007) and warehouse optimization expenses of approximately $2.4 million, with no similar expenses in thefiscal year ended September 30, 2009.
Depreciation and Amortization
Consolidated depreciation and amortization decreased to $47.1 million for the fiscal year endedSeptember 30, 2009 compared to $48.5 million for the fiscal year ended September 30, 2008, due to a
51
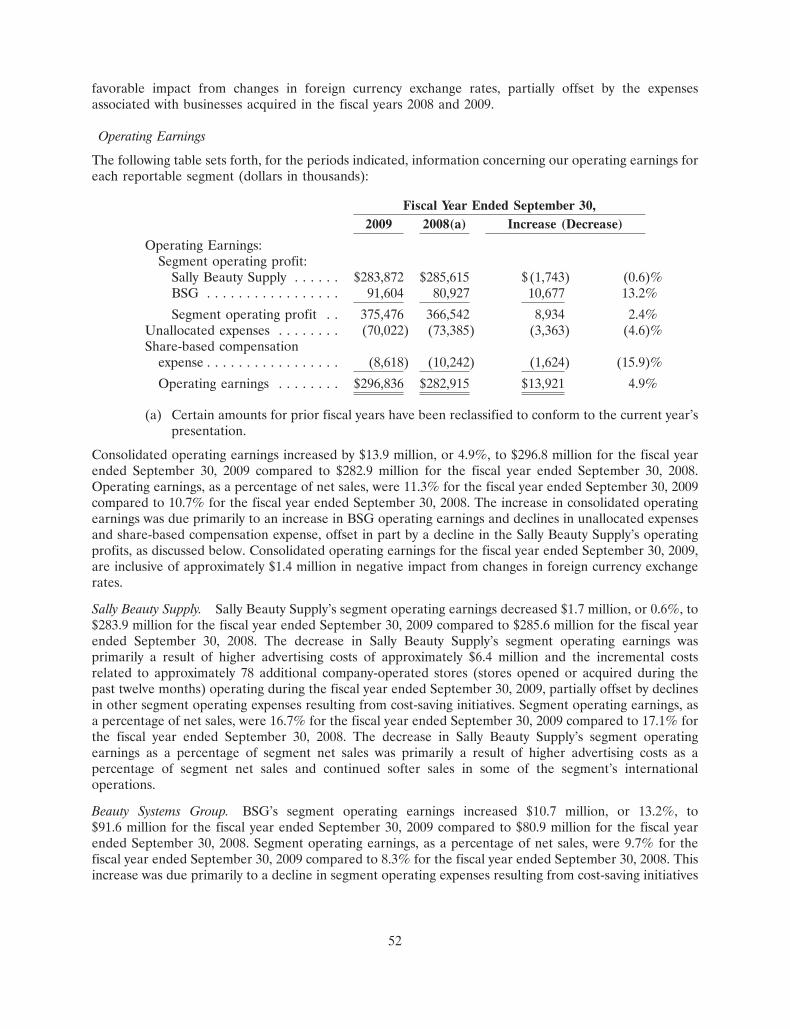
favorable impact from changes in foreign currency exchange rates, partially offset by the expensesassociated with businesses acquired in the fiscal years 2008 and 2009.
Operating Earnings
The following table sets forth, for the periods indicated, information concerning our operating earnings foreach reportable segment (dollars in thousands):
Fiscal Year Ended September 30,2009 2008(a) Increase (Decrease)
Operating Earnings:Segment operating profit:
Sally Beauty Supply . . . . . . $283,872 $285,615 $(1,743) (0.6)%BSG . . . . . . . . . . . . . . . . . 91,604 80,927 10,677 13.2%
Segment operating profit . . 375,476 366,542 8,934 2.4%Unallocated expenses . . . . . . . . (70,022) (73,385) (3,363) (4.6)%Share-based compensation
expense . . . . . . . . . . . . . . . . . (8,618) (10,242) (1,624) (15.9)%
Operating earnings . . . . . . . . $296,836 $282,915 $13,921 4.9%
(a) Certain amounts for prior fiscal years have been reclassified to conform to the current year’spresentation.
Consolidated operating earnings increased by $13.9 million, or 4.9%, to $296.8 million for the fiscal yearended September 30, 2009 compared to $282.9 million for the fiscal year ended September 30, 2008.Operating earnings, as a percentage of net sales, were 11.3% for the fiscal year ended September 30, 2009compared to 10.7% for the fiscal year ended September 30, 2008. The increase in consolidated operatingearnings was due primarily to an increase in BSG operating earnings and declines in unallocated expensesand share-based compensation expense, offset in part by a decline in the Sally Beauty Supply’s operatingprofits, as discussed below. Consolidated operating earnings for the fiscal year ended September 30, 2009,are inclusive of approximately $1.4 million in negative impact from changes in foreign currency exchangerates.
Sally Beauty Supply. Sally Beauty Supply’s segment operating earnings decreased $1.7 million, or 0.6%, to$283.9 million for the fiscal year ended September 30, 2009 compared to $285.6 million for the fiscal yearended September 30, 2008. The decrease in Sally Beauty Supply’s segment operating earnings wasprimarily a result of higher advertising costs of approximately $6.4 million and the incremental costsrelated to approximately 78 additional company-operated stores (stores opened or acquired during thepast twelve months) operating during the fiscal year ended September 30, 2009, partially offset by declinesin other segment operating expenses resulting from cost-saving initiatives. Segment operating earnings, asa percentage of net sales, were 16.7% for the fiscal year ended September 30, 2009 compared to 17.1% forthe fiscal year ended September 30, 2008. The decrease in Sally Beauty Supply’s segment operatingearnings as a percentage of segment net sales was primarily a result of higher advertising costs as apercentage of segment net sales and continued softer sales in some of the segment’s internationaloperations.
Beauty Systems Group. BSG’s segment operating earnings increased $10.7 million, or 13.2%, to$91.6 million for the fiscal year ended September 30, 2009 compared to $80.9 million for the fiscal yearended September 30, 2008. Segment operating earnings, as a percentage of net sales, were 9.7% for thefiscal year ended September 30, 2009 compared to 8.3% for the fiscal year ended September 30, 2008. Thisincrease was due primarily to a decline in segment operating expenses resulting from cost-saving initiatives
52
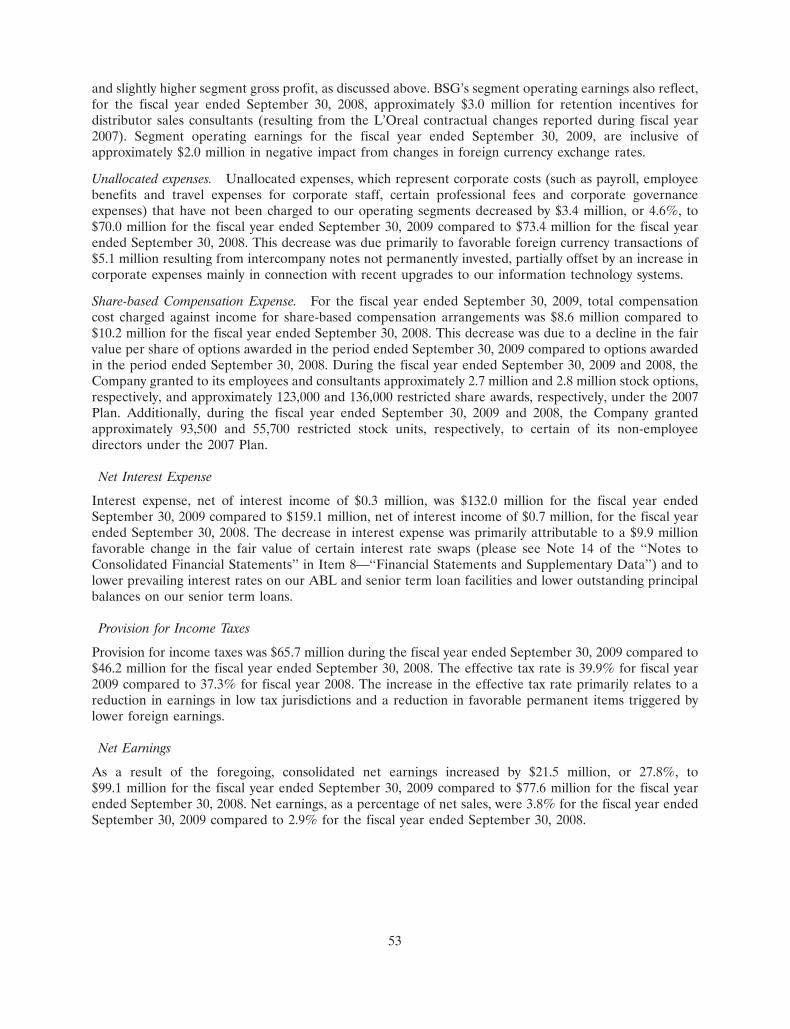
and slightly higher segment gross profit, as discussed above. BSG’s segment operating earnings also reflect,for the fiscal year ended September 30, 2008, approximately $3.0 million for retention incentives fordistributor sales consultants (resulting from the L’Oreal contractual changes reported during fiscal year2007). Segment operating earnings for the fiscal year ended September 30, 2009, are inclusive ofapproximately $2.0 million in negative impact from changes in foreign currency exchange rates.
Unallocated expenses. Unallocated expenses, which represent corporate costs (such as payroll, employeebenefits and travel expenses for corporate staff, certain professional fees and corporate governanceexpenses) that have not been charged to our operating segments decreased by $3.4 million, or 4.6%, to$70.0 million for the fiscal year ended September 30, 2009 compared to $73.4 million for the fiscal yearended September 30, 2008. This decrease was due primarily to favorable foreign currency transactions of$5.1 million resulting from intercompany notes not permanently invested, partially offset by an increase incorporate expenses mainly in connection with recent upgrades to our information technology systems.
Share-based Compensation Expense. For the fiscal year ended September 30, 2009, total compensationcost charged against income for share-based compensation arrangements was $8.6 million compared to$10.2 million for the fiscal year ended September 30, 2008. This decrease was due to a decline in the fairvalue per share of options awarded in the period ended September 30, 2009 compared to options awardedin the period ended September 30, 2008. During the fiscal year ended September 30, 2009 and 2008, theCompany granted to its employees and consultants approximately 2.7 million and 2.8 million stock options,respectively, and approximately 123,000 and 136,000 restricted share awards, respectively, under the 2007Plan. Additionally, during the fiscal year ended September 30, 2009 and 2008, the Company grantedapproximately 93,500 and 55,700 restricted stock units, respectively, to certain of its non-employeedirectors under the 2007 Plan.
Net Interest Expense
Interest expense, net of interest income of $0.3 million, was $132.0 million for the fiscal year endedSeptember 30, 2009 compared to $159.1 million, net of interest income of $0.7 million, for the fiscal yearended September 30, 2008. The decrease in interest expense was primarily attributable to a $9.9 millionfavorable change in the fair value of certain interest rate swaps (please see Note 14 of the ‘‘Notes toConsolidated Financial Statements’’ in Item 8—‘‘Financial Statements and Supplementary Data’’) and tolower prevailing interest rates on our ABL and senior term loan facilities and lower outstanding principalbalances on our senior term loans.
Provision for Income Taxes
Provision for income taxes was $65.7 million during the fiscal year ended September 30, 2009 compared to$46.2 million for the fiscal year ended September 30, 2008. The effective tax rate is 39.9% for fiscal year2009 compared to 37.3% for fiscal year 2008. The increase in the effective tax rate primarily relates to areduction in earnings in low tax jurisdictions and a reduction in favorable permanent items triggered bylower foreign earnings.
Net Earnings
As a result of the foregoing, consolidated net earnings increased by $21.5 million, or 27.8%, to$99.1 million for the fiscal year ended September 30, 2009 compared to $77.6 million for the fiscal yearended September 30, 2008. Net earnings, as a percentage of net sales, were 3.8% for the fiscal year endedSeptember 30, 2009 compared to 2.9% for the fiscal year ended September 30, 2008.
53
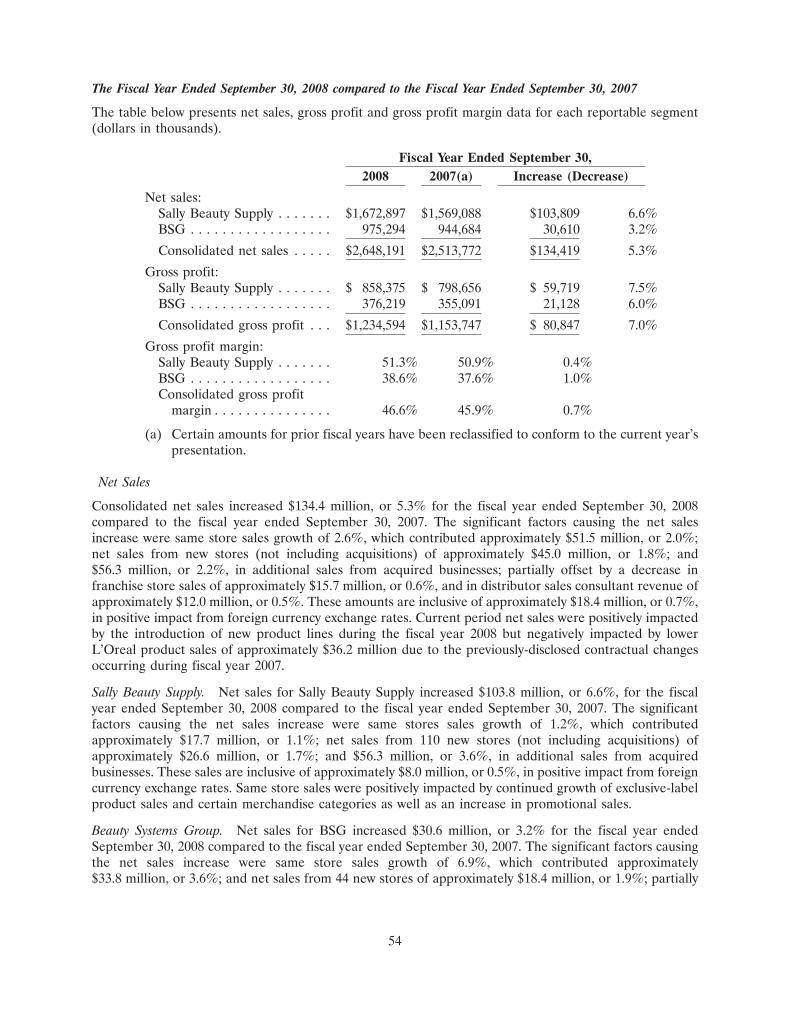
The Fiscal Year Ended September 30, 2008 compared to the Fiscal Year Ended September 30, 2007
The table below presents net sales, gross profit and gross profit margin data for each reportable segment(dollars in thousands).
Fiscal Year Ended September 30,2008 2007(a) Increase (Decrease)
Net sales:Sally Beauty Supply . . . . . . . $1,672,897 $1,569,088 $103,809 6.6%BSG . . . . . . . . . . . . . . . . . . 975,294 944,684 30,610 3.2%
Consolidated net sales . . . . . $2,648,191 $2,513,772 $134,419 5.3%
Gross profit:Sally Beauty Supply . . . . . . . $ 858,375 $ 798,656 $ 59,719 7.5%BSG . . . . . . . . . . . . . . . . . . 376,219 355,091 21,128 6.0%
Consolidated gross profit . . . $1,234,594 $1,153,747 $ 80,847 7.0%
Gross profit margin:Sally Beauty Supply . . . . . . . 51.3% 50.9% 0.4%BSG . . . . . . . . . . . . . . . . . . 38.6% 37.6% 1.0%Consolidated gross profit
margin . . . . . . . . . . . . . . . 46.6% 45.9% 0.7%
(a) Certain amounts for prior fiscal years have been reclassified to conform to the current year’spresentation.
Net Sales
Consolidated net sales increased $134.4 million, or 5.3% for the fiscal year ended September 30, 2008compared to the fiscal year ended September 30, 2007. The significant factors causing the net salesincrease were same store sales growth of 2.6%, which contributed approximately $51.5 million, or 2.0%;net sales from new stores (not including acquisitions) of approximately $45.0 million, or 1.8%; and$56.3 million, or 2.2%, in additional sales from acquired businesses; partially offset by a decrease infranchise store sales of approximately $15.7 million, or 0.6%, and in distributor sales consultant revenue ofapproximately $12.0 million, or 0.5%. These amounts are inclusive of approximately $18.4 million, or 0.7%,in positive impact from foreign currency exchange rates. Current period net sales were positively impactedby the introduction of new product lines during the fiscal year 2008 but negatively impacted by lowerL’Oreal product sales of approximately $36.2 million due to the previously-disclosed contractual changesoccurring during fiscal year 2007.
Sally Beauty Supply. Net sales for Sally Beauty Supply increased $103.8 million, or 6.6%, for the fiscalyear ended September 30, 2008 compared to the fiscal year ended September 30, 2007. The significantfactors causing the net sales increase were same stores sales growth of 1.2%, which contributedapproximately $17.7 million, or 1.1%; net sales from 110 new stores (not including acquisitions) ofapproximately $26.6 million, or 1.7%; and $56.3 million, or 3.6%, in additional sales from acquiredbusinesses. These sales are inclusive of approximately $8.0 million, or 0.5%, in positive impact from foreigncurrency exchange rates. Same store sales were positively impacted by continued growth of exclusive-labelproduct sales and certain merchandise categories as well as an increase in promotional sales.
Beauty Systems Group. Net sales for BSG increased $30.6 million, or 3.2% for the fiscal year endedSeptember 30, 2008 compared to the fiscal year ended September 30, 2007. The significant factors causingthe net sales increase were same store sales growth of 6.9%, which contributed approximately$33.8 million, or 3.6%; and net sales from 44 new stores of approximately $18.4 million, or 1.9%; partially
54
offset by a decrease in franchise sales of approximately $15.7 million, or 1.7%, and in distributor salesconsultant revenue of approximately $12.0 million, or 1.3%. These sales are inclusive of approximately$10.4 million, or 1.1%, in positive impact from foreign currency exchange rates. BSG net sales werepositively impacted by the introduction of new product lines during the fiscal year 2008 but negativelyimpacted by lower L’Oreal product sales of approximately $36.2 million due to the previously-disclosedcontractual changes during fiscal year 2007.
Gross Profit
Consolidated gross profit increased $80.8 million for the fiscal year ended September 30, 2008 ascompared to the fiscal year ended September 30, 2007, principally due to increased sales volume resultingfrom acquisitions for Sally Beauty Supply and improved gross margins in both operating segments.
Sally Beauty Supply. Sally Beauty Supply’s gross profit increased $59.7 million for the fiscal year endedSeptember 30, 2008 compared to the fiscal year ended September 30, 2007, principally as a result ofincreased unit sales volume and gross profit margin improvements across nearly all geographic areas. SallyBeauty Supply’s gross profit as a percent of net sales increased to 51.3% for the fiscal year endedSeptember 30, 2008 compared to 50.9% for the fiscal year ended September 30, 2007. This increase wasprincipally the result of a shift in product mix including an increase in sales of exclusive-label products andother higher-margin products. This increase was partially offset by an increase in promotional initiatives inthe U.S. and higher freight costs.
Beauty Systems Group. BSG’s gross profit increased $21.1 million for the fiscal year ended September 30,2008 compared to the fiscal year ended September 30, 2007. This increase was principally as a result ofincreased unit sales volume offset in part by approximately $1.7 million of warehouse optimization costs,included in cost of products sold and distribution expenses. BSG’s gross profit as a percentage of net salesincreased to 38.6% for the fiscal year ended September 30, 2008 compared to 37.6% for the fiscal yearended September 30, 2007. This increase was due primarily to margin pressure from lower-marginproducts in our franchise-based business during the fiscal year ended September 30, 2007 that was notrepeated during the fiscal year ended September 30, 2008 as well as a shift in sales mix during the fiscalyear ended September 30, 2008, towards higher company-operated store sales volume (with higher grossprofit margins as opposed to both franchise store and distributor sales consultants’ sales), as well as theintroduction of new product lines during the fiscal year 2008.
Selling, General and Administrative Expenses
Consolidated selling, general and administrative expenses increased $45.9 million to $903.1 million for thefiscal year ended September 30, 2008 compared to $857.3 million for the fiscal year ended September 30,2007. This increase was attributable principally to expenses directly associated with the increase in unitsales volume, increased expenses related to the opening of new stores and to acquired businesses. Selling,general and administrative expenses include approximately $2.4 million of warehouse optimization costsfor the fiscal year ended September 30, 2008 and approximately $3.0 million and $5.2 million of BSGretention incentives for distributor sales consultants due to the L’Oreal contractual changes reportedduring fiscal year 2007 for the fiscal year ended September 30, 2008 and 2007, respectively. Most of theretention incentives related to the L’Oreal contractual changes have been expensed during 2007 and 2008.Fiscal 2008 results also include professional fees incurred for a corporate reorganization project related tothe rationalization of our various foreign subsidiaries. Selling, general and administrative expenses, as apercentage of net sales, were 34.1% for the fiscal years ended September 30, 2008 and 2007. The expenseincreases were partially offset by a $1.0 million decrease in expenses from the inclusion in the results, forthe fiscal year ended September 30, 2007, of allocated overhead charges from Alberto-Culver prior to theSeparation Transactions. There were no comparable charges during the fiscal year ended September 30,2008.
55
Depreciation and Amortization
Consolidated depreciation and amortization increased $5.9 million to $48.5 million for fiscal year endedSeptember 30, 2008 compared to $42.6 million for the fiscal year ended September 30, 2007. The increasewas due primarily to the amortization of intangible assets associated with acquisitions and capitalexpenditures made to support unit growth of both operating segments.
Sales-based Service Fee Charged by Alberto-Culver
The sales-based service fee charged by Alberto-Culver was $3.8 million for the fiscal year endedSeptember 30, 2007. The fiscal year ended September 30, 2008 had no comparable expenses as a result ofthe cancellation of this agreement in connection with the Separation Transactions.
Transaction Expenses
We recorded $21.5 million in expenses related to the Separation Transactions for the fiscal year endedSeptember 30, 2007. These expenses were for fees allocated to us by Alberto-Culver for severancepayments to certain former officers and for other professional fees related to the Separation Transactions.We did not incur any comparable expenses related to the Separation Transactions in the fiscal year endedSeptember 30, 2008.
Operating Earnings
The following table sets forth, for the periods indicated, information concerning our operating earnings foreach reportable segment (in thousands):
Fiscal Year Ended September 30,2008(a) 2007(a) Increase (Decrease)
Operating Earnings:Segment operating profit:Sally Beauty Supply . . . . . . . $285,615 $272,364 $ 13,251 4.9%BSG . . . . . . . . . . . . . . . . . . 80,927 63,456 17,471 27.5%
Segment operating profit . . . 366,542 335,820 30,722 9.1%Unallocated expenses . . . . . . . (73,385) (68,889) 4,496 6.5%Share-based compensation
expense . . . . . . . . . . . . . . . . (10,242) (13,065) (2,823) (21.6)%Sales-based service fee charged
by Alberto-Culver . . . . . . . . — (3,779) (3,779) (100.0)%Transaction expenses . . . . . . . . — (21,502) (21,502) (100.0)%
Operating earnings . . . . . . . . $282,915 $228,585 $ 54,330 23.8%
(a) Certain amounts for prior fiscal years have been reclassified to conform to the current year’spresentation.
Consolidated operating earnings increased $54.3 million, or 23.8%, to $282.9 million for the fiscal yearended September 30, 2008 compared to $228.6 million for the fiscal year ended September 30, 2007.Operating earnings, as a percentage of net sales, were 10.7% for the fiscal year ended September 30, 2008compared to 9.1% for the fiscal year ended September 30, 2007. The increase in consolidated operatingearnings was due primarily to increased gross profit by both operating segments as well as thenon-recurrence of both $21.5 million of expenses related to the Separation Transactions and a sales-basedservice fee of $3.8 million charged by Alberto-Culver in the fiscal year ended September 30, 2007.
56
Sally Beauty Supply. Sally Beauty Supply’s segment operating earnings increased $13.3 million, or 4.9%,to $285.6 million for the fiscal year ended September 30, 2008 compared to $272.4 million for the fiscalyear ended September 30, 2007. Segment operating earnings, as a percentage of net sales, were 17.1% forthe fiscal year ended September 30, 2008 compared to 17.4% for the fiscal year ended September 30, 2007.The decrease in Sally Beauty Supply’s segment operating earnings as a percentage of net sales wasprimarily a result of higher advertising costs of approximately $3.6 million.
Beauty Systems Group. BSG’s segment operating earnings increased $17.5 million, or 27.5%, to$80.9 million for the fiscal year ended September 30, 2008 compared to $63.4 million for the fiscal yearended September 30, 2007. Segment operating earnings, as a percentage of net sales, were 8.3% for thefiscal year ended September 30, 2008 compared to 6.7% for the fiscal year ended September 30, 2007.BSG’s segment operating earnings were positively impacted by improvement in gross profit margins due tosales mix as well as a lower growth rate in selling, general and administrative expenses. In addition,operating earnings were improved from the non-recurrence of certain consulting fees and expenses relatedto the L’Oreal contractual changes incurred for the fiscal year ended September 30, 2007. Theseimprovements were offset, in part, by the operating expenses attributable to stores opened and businessesacquired as well as by warehouse optimization project expenses of $4.7 million (including depreciation) inthe fiscal year ended September 30, 2008.
Unallocated expenses. Unallocated expenses, which represent corporate costs that have not been chargedto the operating segments, increased to $73.4 million, or by approximately $4.5 million, for the year endedSeptember 30, 2008 compared to the year ended September 30, 2007. The increase was due primarily tohigher payroll related costs to provide support for the growth in segment operations.
Share-based Compensation Expense. For the fiscal year ended September 30, 2008, total compensationcost charged against income for share-based compensation arrangements was $10.2 million compared to$13.1 million for the year ended September 30, 2007. The amounts for the fiscal year 2008 included$3.1 million of accelerated expense related to certain retirement eligible employees who are eligible tocontinue vesting awards upon retirement and, for the fiscal year 2007, $5.3 million of accelerated expenserelated to the Separation Transactions and $2.6 million of accelerated expense related to certainretirement eligible employees who are eligible to continue vesting awards upon retirement.
During the years ended September 30, 2008 and 2007, the Company granted to its employees and directorsapproximately 2.8 million and 2.4 million stock options, respectively. Additionally, during fiscal years 2008and 2007, the Company granted approximately 55,700 and 55,600 restricted stock units (‘‘RSUs’’),respectively, to certain of its non-employee directors under the 2007 Plan.
Sales-based Service Fee Charged by Alberto-Culver
The sales-based service fee charged by Alberto-Culver was $3.8 million for the fiscal year endedSeptember 30, 2007. The fiscal year ended September 30, 2008 had no comparable expenses as a result ofthe cancellation of this agreement in connection with the Separation Transactions.
Transaction Expenses
We recorded $21.5 million in expenses related to the Separation Transactions for the fiscal year endedSeptember 30, 2007. These expenses were for fees allocated to us by Alberto-Culver for severancepayments to certain former officers and for other professional fees related to the Separation Transactions.We did not incur any comparable expenses related to the Separation Transactions in the fiscal year endedSeptember 30, 2008.
57
Interest Expense, net
Interest expense, net of interest income of $0.7 million, was $159.1 million for the fiscal year endedSeptember 30, 2008 compared to $146.0 million, net of interest income of $1.7 million, for the fiscal yearended September 30, 2007. The increase in interest expense was primarily attributable to the impact ofinterest associated with the debt incurred on November 16, 2006 which was outstanding for 47 less days infiscal year 2007 than in fiscal year 2008. Net interest expense also reflects non-cash expense of $4.6 millionand $3.0 million for the fiscal year ended September 30, 2008 and 2007, respectively, resulting frommarked-to-market adjustments for certain interest rate swaps, as described in Note 14 of the ‘‘Notes toConsolidated Financial Statements’’ in Item 8—‘‘Financial Statements and Supplementary Data.’’
Provision for Income Taxes
Provision for income taxes was $46.2 million during the fiscal year ended September 30, 2008 compared to$38.1 million for the fiscal year ended September 30, 2007. The effective tax rate is 37.3% for fiscal year2008 compared to 46.1% for fiscal year 2007. The reduction in the estimated annual effective tax rateprimarily relates to non-deductible costs related to the Separation Transactions included in the tax rate forthe fiscal year 2007 and the reduced impact of permanent items on higher earnings and a reduction inforeign statutory tax rates for fiscal year 2008.
Net Earnings
As a result of the foregoing, consolidated net earnings increased $33.1 million to $77.6 million for the fiscalyear ended September 30, 2008 compared to $44.5 million for the fiscal year ended September 30, 2007.Net earnings, as a percentage of net sales, were 2.9% for the fiscal year ended September 30, 2008compared to 1.8% for the fiscal year ended September 30, 2007.
Financial Condition
September 30, 2009 Compared to September 30, 2008
Working capital (current assets less current liabilities) at September 30, 2009 was $341.7 million comparedto $367.2 million at September 30, 2008, representing a decrease of $25.5 million. The ratio of currentassets to current liabilities was 1.91 to 1.00 at September 30, 2009 compared to 1.84 to 1.00 atSeptember 30, 2008. The decrease in working capital reflects an $89.7 million decrease in current assetsand a decrease of $64.3 million in current liabilities. The decrease in current assets as of September 30,2009 includes a $45.3 million decrease in cash and cash equivalents and a $38.5 million reduction ininventory levels. The decrease in current liabilities as of September 30, 2009 was primarily the result of adecrease in current maturities of long-term debt of $76.1 million partially offset by an increase of$21.6 million in accounts payable.
Cash and cash equivalents decreased by $45.3 million to $54.4 million at September 30, 2009 compared to$99.8 million at September 30, 2008 due primarily to cash used in connection with acquisitions and to repaydebt during the fiscal year ended September 30, 2009 (please see Liquidity and Capital Resources below).
Inventories decreased by $38.5 million to $559.7 million at September 30, 2009 compared to $598.2 millionat September 30, 2008 due primarily to efforts to right-size inventory levels (including through lowerpurchases by us) during the fiscal year ended September 30, 2009 in response to the current economicslowdown, and to the effect of foreign currency translation adjustments of approximately $7.3 million,partially offset by the inventories of businesses acquired in the 2009 fiscal year.
Current maturities of long-term debt decreased by $76.1 million to $24.5 million at September 30, 2009compared to $100.6 million at September 30, 2008 due primarily to the repayment of $75.0 million ofborrowings under our ABL facilities. (please see Liquidity and Capital Resources below).
58
Accounts payable increased by $21.6 million to $193.6 million at September 30, 2009 from $172.0 million atSeptember 30, 2008 due primarily to changes in the timing of payments to vendors in connection withpurchases of inventory and property plant and equipment in the ordinary course of business, and to theassumption of the accounts payable of businesses acquired in the 2009 fiscal year.
Net property and equipment decreased $5.0 million to $151.3 million at September 30, 2009 compared to$156.3 million at September 30, 2008, primarily due to current fiscal year depreciation expense and theeffect of foreign currency translation adjustments, partially offset by the net property and equipment ofbusinesses acquired in the 2009 fiscal year.
Goodwill increased $69.2 million to $494.1 million at September 30, 2009 compared to $425.0 million atSeptember 30, 2008, primarily due to acquisitions (please see Note 17 of the ‘‘Notes to ConsolidatedFinancial Statements’’ in Item 8—‘‘Financial Statements and Supplementary Data’’), partially offset by theeffect of foreign currency translation adjustments.
Intangible assets decreased $6.7 million to $78.7 million at September 30, 2009 compared to $85.4 millionat September 30, 2008, primarily due to current fiscal year amortization expense and the effect of foreigncurrency translation adjustments, partially offset by the effect of businesses acquired in the 2009 fiscal year.
Other assets decreased $4.0 million to $50.7 million at September 30, 2009 compared to $54.7 million atSeptember 30, 2008, primarily due to amortization of the costs associated with the fiscal year 2007 issuanceof debt, which are being amortized as interest expense over the term of the debt.
Long-term debt (excluding current maturities) decreased by $71.7 million to $1,653.0 million atSeptember 30, 2009 compared to $1,724.7 million at September 30, 2008 due primarily to repayments ofprincipal under our senior term loan facilities made during the fiscal year ended September 30, 2009(please see Liquidity and Capital Resources below).
Deferred income tax liabilities, net, decreased $3.7 million to $33.6 million at September 30, 2009compared to $37.3 million at September 30, 2008. This decrease was primarily due to differences betweendepreciation included for tax purposes versus depreciation included in our consolidated statements ofearnings, and the tax effect of deferred (losses) gains on certain interest rate swaps.
Stock options subject to redemption decreased $4.1 million to $1.8 million at September 30, 2009compared to $5.9 million as of September 30, 2008, primarily due to exercises, cancellations and otheradjustments in connections with these options.
Total stockholders’ deficit decreased by $87.5 million to $615.5 million at September 30, 2009, as a result ofnet earnings of $99.1 million and an increase in additional paid-in capital of $13.0 million (as describedbelow), partially offset by cumulative translation adjustments and deferred losses on interest rate swaps, asdescribed below.
Additional paid-in capital increased by $13.0 million to $635.5 million at September 30, 2009, as a result ofshare-based compensation expense and the exercise of stock options and the exercise, cancelation andadjustments of certain stock options subject to redemption.
Accumulated other comprehensive (loss) income changed by $24.6 million, to a loss of $15.9 million atSeptember 30, 2009, due to foreign currency translation adjustments of $14.4 million and deferred losseson hedged interest rate swaps of $10.2 million, net of income tax.
Liquidity and Capital Resources
We broadly define liquidity as our ability to generate sufficient cash flow from operating activities to meetour obligations and commitments. In addition, liquidity includes the ability to obtain appropriate debt andequity financing and to convert into cash those assets that are no longer required to meet existing strategicand financial objectives. Therefore, liquidity cannot be considered separately from capital resources that
59
consist of current or potentially available funds for use in achieving long-range business objectives andmeeting debt service commitments.
We are highly leveraged and a substantial portion of our liquidity needs will arise from debt service onindebtedness incurred primarily in connection with the Separation Transactions and from funding the costsof operations, working capital and capital expenditures. As a holding company, we depend on oursubsidiaries, including Sally Holdings, to distribute funds to us so that we may pay our obligations andexpenses. The ability of our subsidiaries to make such distributions will be subject to their operatingresults, cash requirements and financial condition and their compliance with covenants and financial ratiosrelated to their existing or future indebtedness, including covenants restricting Sally Holdings’ ability topay dividends to us. In addition, under Delaware law, the ability of each of Sally Holdings and itssubsidiaries to make distributions to us will be limited to the extent: (i) of its surplus, or if there is nosurplus, of its net earnings for the fiscal year in which the distribution is declared and/or the precedingfiscal year, if such subsidiary is a corporation; or (ii) the fair value of its assets exceeds its liabilities, in thecase of Sally Holdings or such subsidiary that is a limited liability company. If, as a consequence of theselimitations, we cannot receive sufficient distributions from our subsidiaries, we may not be able to meet ourobligations to fund general corporate expenses. Please see ‘‘Risk Factors—Risks Relating to OurBusiness,’’ and ‘‘—Risks Relating to Our Substantial Indebtedness.’’
We may from time to time repurchase or otherwise retire our debt (through our subsidiaries) and takeother steps to reduce our debt or otherwise improve our balance sheet. These actions may include openmarket repurchases of our notes, prepayments of our term loans or other retirements of outstanding debt.The amount of debt that may be repurchased or otherwise retired, if any, would be decided upon at thesole discretion of our Board of Directors and will depend on market conditions, trading levels of theCompany’s debt from time to time, the Company’s cash position and other considerations.
During the fiscal year ended September 30, 2009, the Company made scheduled payments in the aggregateamount of $6.1 million on its senior term loans. The senior term loan facilities may be prepaid at theoption of Sally Holdings at any time without premium or penalty and are subject to mandatory repaymentin an amount equal to 50% of excess cash flow (as defined in the agreement governing the term loanfacilities) for any fiscal year unless a specified leverage ratio is met. In January 2009, the Company made amandatory repayment on the senior term loan facilities in the amount of $16.7 million and expects to makea mandatory repayment in the amount of $22.3 million in January of 2010. Amounts paid pursuant to saidprovision may be applied, at the option of Sally Holdings, against minimum loan repayments otherwiserequired of it over the twelve-month period following any such payment under the terms of the loanagreement. During the fiscal year ended September 30, 2009, the Company also made optional repaymentsin the aggregate amount of $45.0 million on its senior term loans. In addition, in May 2009, the Companyrepurchased $5.0 million in par value of its 10.5% senior subordinated notes (due in November 2016) forapproximately $5.0 million, plus accrued interest. In connection with the mandatory and optionalrepayments made during the fiscal year ended September 30, 2009, the Company recorded losses onextinguishment of debt in the aggregate amount of $1.0 million, which are included in net interest expensein the Company’s consolidated statements of earnings.
Based upon the current level of operations and anticipated growth, we anticipate that existing cashbalances, funds expected to be generated by operations, and funds available under the ABL facility will besufficient to meet our working capital requirements and to finance anticipated capital expenditures overthe next 12 months.
There can be no assurance that our business will generate sufficient cash flows from operations, thatanticipated net sales and operating improvements will be realized, or that future borrowings will beavailable under our ABL facility in an amount sufficient to enable us to service our indebtedness or to fundour other liquidity needs. In addition, our ability to meet our debt service obligations and liquidity needsare subject to certain risks, which include, but are not limited to, increases in competitive activity, the loss
60
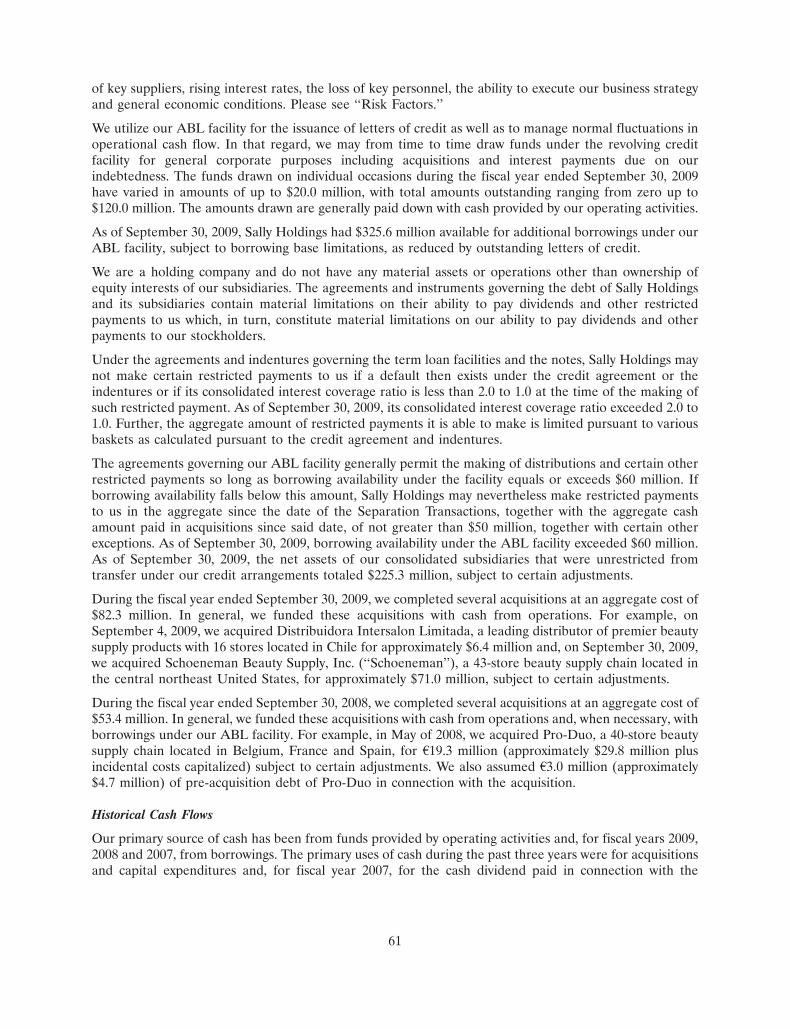
of key suppliers, rising interest rates, the loss of key personnel, the ability to execute our business strategyand general economic conditions. Please see ‘‘Risk Factors.’’
We utilize our ABL facility for the issuance of letters of credit as well as to manage normal fluctuations inoperational cash flow. In that regard, we may from time to time draw funds under the revolving creditfacility for general corporate purposes including acquisitions and interest payments due on ourindebtedness. The funds drawn on individual occasions during the fiscal year ended September 30, 2009have varied in amounts of up to $20.0 million, with total amounts outstanding ranging from zero up to$120.0 million. The amounts drawn are generally paid down with cash provided by our operating activities.
As of September 30, 2009, Sally Holdings had $325.6 million available for additional borrowings under ourABL facility, subject to borrowing base limitations, as reduced by outstanding letters of credit.
We are a holding company and do not have any material assets or operations other than ownership ofequity interests of our subsidiaries. The agreements and instruments governing the debt of Sally Holdingsand its subsidiaries contain material limitations on their ability to pay dividends and other restrictedpayments to us which, in turn, constitute material limitations on our ability to pay dividends and otherpayments to our stockholders.
Under the agreements and indentures governing the term loan facilities and the notes, Sally Holdings maynot make certain restricted payments to us if a default then exists under the credit agreement or theindentures or if its consolidated interest coverage ratio is less than 2.0 to 1.0 at the time of the making ofsuch restricted payment. As of September 30, 2009, its consolidated interest coverage ratio exceeded 2.0 to1.0. Further, the aggregate amount of restricted payments it is able to make is limited pursuant to variousbaskets as calculated pursuant to the credit agreement and indentures.
The agreements governing our ABL facility generally permit the making of distributions and certain otherrestricted payments so long as borrowing availability under the facility equals or exceeds $60 million. Ifborrowing availability falls below this amount, Sally Holdings may nevertheless make restricted paymentsto us in the aggregate since the date of the Separation Transactions, together with the aggregate cashamount paid in acquisitions since said date, of not greater than $50 million, together with certain otherexceptions. As of September 30, 2009, borrowing availability under the ABL facility exceeded $60 million.As of September 30, 2009, the net assets of our consolidated subsidiaries that were unrestricted fromtransfer under our credit arrangements totaled $225.3 million, subject to certain adjustments.
During the fiscal year ended September 30, 2009, we completed several acquisitions at an aggregate cost of$82.3 million. In general, we funded these acquisitions with cash from operations. For example, onSeptember 4, 2009, we acquired Distribuidora Intersalon Limitada, a leading distributor of premier beautysupply products with 16 stores located in Chile for approximately $6.4 million and, on September 30, 2009,we acquired Schoeneman Beauty Supply, Inc. (‘‘Schoeneman’’), a 43-store beauty supply chain located inthe central northeast United States, for approximately $71.0 million, subject to certain adjustments.
During the fiscal year ended September 30, 2008, we completed several acquisitions at an aggregate cost of$53.4 million. In general, we funded these acquisitions with cash from operations and, when necessary, withborrowings under our ABL facility. For example, in May of 2008, we acquired Pro-Duo, a 40-store beautysupply chain located in Belgium, France and Spain, for A19.3 million (approximately $29.8 million plusincidental costs capitalized) subject to certain adjustments. We also assumed A3.0 million (approximately$4.7 million) of pre-acquisition debt of Pro-Duo in connection with the acquisition.
Historical Cash Flows
Our primary source of cash has been from funds provided by operating activities and, for fiscal years 2009,2008 and 2007, from borrowings. The primary uses of cash during the past three years were for acquisitionsand capital expenditures and, for fiscal year 2007, for the cash dividend paid in connection with the
61
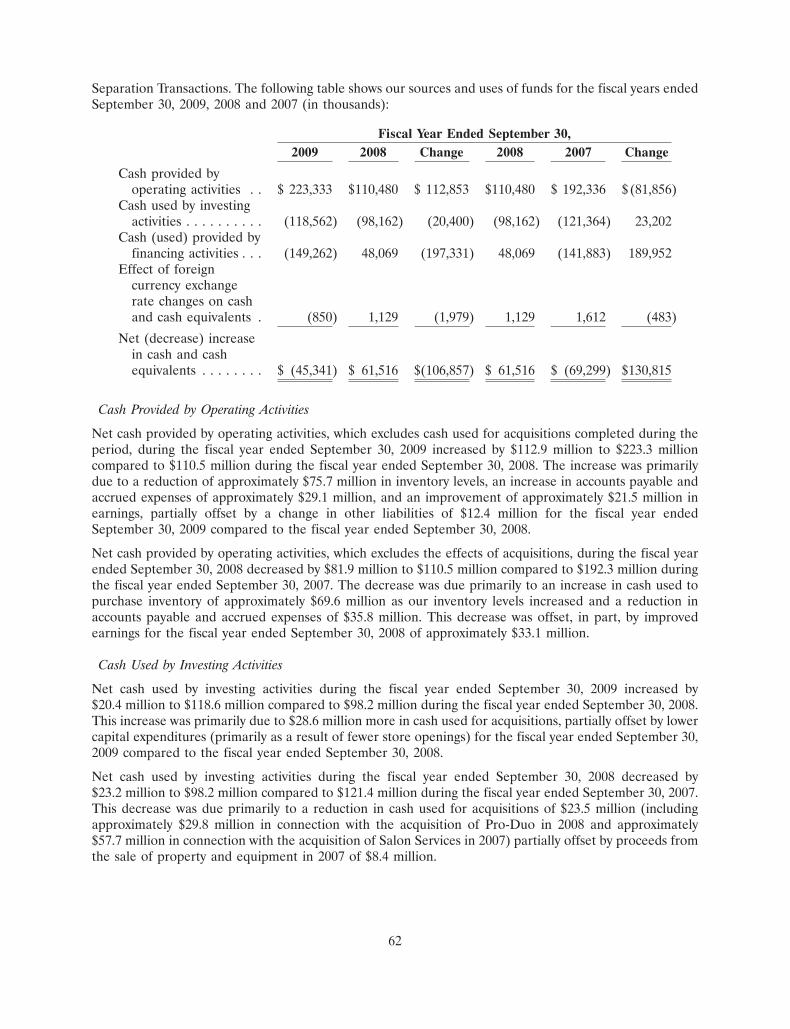
Separation Transactions. The following table shows our sources and uses of funds for the fiscal years endedSeptember 30, 2009, 2008 and 2007 (in thousands):
Fiscal Year Ended September 30,2009 2008 Change 2008 2007 Change
Cash provided byoperating activities . . $ 223,333 $110,480 $ 112,853 $110,480 $ 192,336 $(81,856)
Cash used by investingactivities . . . . . . . . . . (118,562) (98,162) (20,400) (98,162) (121,364) 23,202
Cash (used) provided byfinancing activities . . . (149,262) 48,069 (197,331) 48,069 (141,883) 189,952
Effect of foreigncurrency exchangerate changes on cashand cash equivalents . (850) 1,129 (1,979) 1,129 1,612 (483)
Net (decrease) increasein cash and cashequivalents . . . . . . . . $ (45,341) $ 61,516 $(106,857) $ 61,516 $ (69,299) $130,815
Cash Provided by Operating Activities
Net cash provided by operating activities, which excludes cash used for acquisitions completed during theperiod, during the fiscal year ended September 30, 2009 increased by $112.9 million to $223.3 millioncompared to $110.5 million during the fiscal year ended September 30, 2008. The increase was primarilydue to a reduction of approximately $75.7 million in inventory levels, an increase in accounts payable andaccrued expenses of approximately $29.1 million, and an improvement of approximately $21.5 million inearnings, partially offset by a change in other liabilities of $12.4 million for the fiscal year endedSeptember 30, 2009 compared to the fiscal year ended September 30, 2008.
Net cash provided by operating activities, which excludes the effects of acquisitions, during the fiscal yearended September 30, 2008 decreased by $81.9 million to $110.5 million compared to $192.3 million duringthe fiscal year ended September 30, 2007. The decrease was due primarily to an increase in cash used topurchase inventory of approximately $69.6 million as our inventory levels increased and a reduction inaccounts payable and accrued expenses of $35.8 million. This decrease was offset, in part, by improvedearnings for the fiscal year ended September 30, 2008 of approximately $33.1 million.
Cash Used by Investing Activities
Net cash used by investing activities during the fiscal year ended September 30, 2009 increased by$20.4 million to $118.6 million compared to $98.2 million during the fiscal year ended September 30, 2008.This increase was primarily due to $28.6 million more in cash used for acquisitions, partially offset by lowercapital expenditures (primarily as a result of fewer store openings) for the fiscal year ended September 30,2009 compared to the fiscal year ended September 30, 2008.
Net cash used by investing activities during the fiscal year ended September 30, 2008 decreased by$23.2 million to $98.2 million compared to $121.4 million during the fiscal year ended September 30, 2007.This decrease was due primarily to a reduction in cash used for acquisitions of $23.5 million (includingapproximately $29.8 million in connection with the acquisition of Pro-Duo in 2008 and approximately$57.7 million in connection with the acquisition of Salon Services in 2007) partially offset by proceeds fromthe sale of property and equipment in 2007 of $8.4 million.
62
Cash (Used) Provided by Financing Activities
Net cash (used) provided by financing activities during the fiscal year ended September 30, 2009 changedby $197.3 million to cash used of $149.3 million compared to cash provided of $48.1 million during thefiscal year ended September 30, 2008. The change was primarily due to net borrowings of $63.6 millionunder our ABL facility during the fiscal year ended September 30, 2008 compared to net repayments of$75.0 million during the fiscal year ended September 30, 2009. In addition, during the fiscal year endedSeptember 30, 2009, the Company made scheduled payments in the aggregate amount of $6.1 million, amandatory repayment in the amount of $16.7 million and optional repayments in the aggregate amount of$45.0 million on its term loan facilities and the Company repurchased $5.0 million in par value of its seniorsubordinated notes (please see Liquidity and Capital Resources above).
Net cash provided by financing activities during the fiscal year ended September 30, 2008 increased by$190.0 million to $48.1 million compared to cash used of $141.9 million during the fiscal year endedSeptember 30, 2007. The increase was due primarily to the absence, during the fiscal year endedSeptember 30, 2008, of distributions to Alberto-Culver and costs associated with the SeparationTransactions (including debt issuance costs and the special cash dividend paid) during the fiscal year endedSeptember 30, 2007. These increases were offset, in part, by the absence, during the fiscal year endedSeptember 30, 2008, of equity contributions and proceeds from the issuance of debt in connection with theSeparation Transactions during the fiscal year ended September 30, 2007.
Credit Facilities
In connection with the Separation Transactions, we, through our subsidiaries: (i) entered into the TermLoans in an aggregate amount of $1,070.0 million; (ii) issued senior notes in an aggregate amount of$430.0 million and senior subordinated notes in an aggregate amount of $280.0 million (the Notes); and(iii) entered into the $400.0 million ABL facility, subject to borrowing base limitations, of whichapproximately $70.0 million was drawn at closing, which resulted in the incurrence of aggregateindebtedness in connection with the Separation Transactions of approximately $1,850.0 million. Proceedsfrom this new debt and the $575.0 million equity investment by the CDR Investors were used to pay a$25.00 per share cash dividend to holders of record of Alberto-Culver shares as of the record date for theSeparation Transactions. Please see ‘‘Risk Factors—Risks Relating to Our Substantial Indebtedness.’’
As of September 30, 2009, there were outstanding borrowings of $968.9 million under the Term Loans, at aweighted average interest rate of 2.52%, and outstanding borrowings of $705.0 million under the Notes, ata weighted average interest rate of 9.75%. As of September 30, 2009, we had $325.6 million available foradditional borrowings under our ABL facility, subject to borrowing base limitations, as reduced byoutstanding letters of credit.
The agreements and instruments governing our debt contain restrictions and limitations that couldsignificantly impact our ability to operate our business. These restrictions and limitations relate to:
• disposal of assets • making investments (including joint ventures)
• incurrence of additional indebtedness • mergers, consolidations or sales of(including guarantees of additional subsidiaries’ assetsindebtedness) • ability of subsidiaries to pay dividends
• stock repurchase and distributions • making acquisitions of all of the business or• certain debt prepayments and modifications assets of or stock representing beneficial
ownership of, any person• liens on assets
In addition, the ABL facility contains restrictions and limitations related to: (i) changing our line ofbusiness; (ii) changing our fiscal year; and (iii) creating or incurring negative pledges.
63
The Term Loans and the ABL facility are secured by substantially all of our assets, those of SallyInvestment Holdings LLC, those of our domestic subsidiaries and, in the case of the ABL facility, those ofour Canadian subsidiaries. The Term Loans may be prepaid at our option at any time without premium orpenalty and are subject to mandatory prepayment in an amount equal to 50% of excess cash flow (asdefined in the agreement governing the Term Loans) for any fiscal year unless a specified leverage ratio ismet. Additionally, the Term Loans are subject to mandatory prepayment in an amount equal to 100% ofthe proceeds of specified asset sales that are not reinvested in the business or applied to repay borrowingsunder the ABL facility.
The Term Loans contain a covenant requiring Sally Holdings and its subsidiaries to meet certain maximumconsolidated secured leverage ratio levels, which decline over time. The consolidated secured leverageratio is a ratio of (A) net consolidated secured debt to (B) Consolidated EBITDA as defined in theagreement underlying the Term Loans. Compliance with the consolidated secured leverage ratio is testedquarterly, with a maximum ratio of 4.50 as of September 30, 2009. Failure to comply with the consolidatedsecured leverage ratio covenant under the Term Loans would result in a default under such facilities.
The ABL facility contains a covenant requiring Sally Holdings and its subsidiaries to maintain a fixed-charge coverage ratio of at least 1.0 to 1.0 in the event that availability under the ABL facility falls below$40.0 million. The fixed-charge coverage ratio is defined as the ratio of (A) EBITDA (as defined in theagreement underlying the ABL facility, or Credit Agreement EBITDA) less unfinanced capitalexpenditures to (B) fixed charges (as included in the definition of the fixed-charge coverage ratio in theagreement governing the ABL facility).
For purposes of calculating either the consolidated secured leverage ratio or the fixed-charge coverageratio, Consolidated EBITDA and Credit Agreement EBITDA are measured on a last-four-quarters basis.Accordingly, the calculation can be disproportionately affected by a particularly strong or weak quarterand may not be comparable to the measure for any previous or subsequent four-quarter period.
Failure to comply with the fixed-charge coverage ratio covenant (if and when applicable) under the ABLfacility would result in a default under such facility. A default could also result in a default under the otherfacility or facilities, as the case may be, and the Notes. Absent a waiver or an amendment from our lendersand note holders, such defaults could permit the acceleration of all indebtedness under the ABL facility,the Term Loans and the Notes, which would have a material adverse effect on our results of operations,financial position and cash flows.
Consolidated EBITDA and Credit Agreement EBITDA are not recognized measurements underaccounting principles generally accepted in the United States of America, or GAAP, and should not beconsidered as a substitute for financial performance and liquidity measures determined in accordance withGAAP, such as net earnings, operating income or operating cash flow. In addition, because othercompanies may calculate EBITDA differently, Consolidated EBITDA and Credit Agreement EBITDAlikely will not be comparable to EBITDA or similarly titled measures reported by other companies orreported by us in our quarterly earnings releases.
We believe that we are currently in compliance with the agreements and instruments governing our debt,including our financial covenants. Our ability to comply with these covenants in future periods will dependon our ongoing financial and operating performance, which in turn will be subject to economic conditionsand to financial, market and competitive factors, many of which are beyond our control. Our ability tocomply with these covenants in future periods will also depend substantially on the pricing of our products,our success at implementing cost reduction initiatives and our ability to successfully implement our overallbusiness strategy. Please see ‘‘Risk Factors—Risks Relating to Our Substantial Indebtedness.’’
64
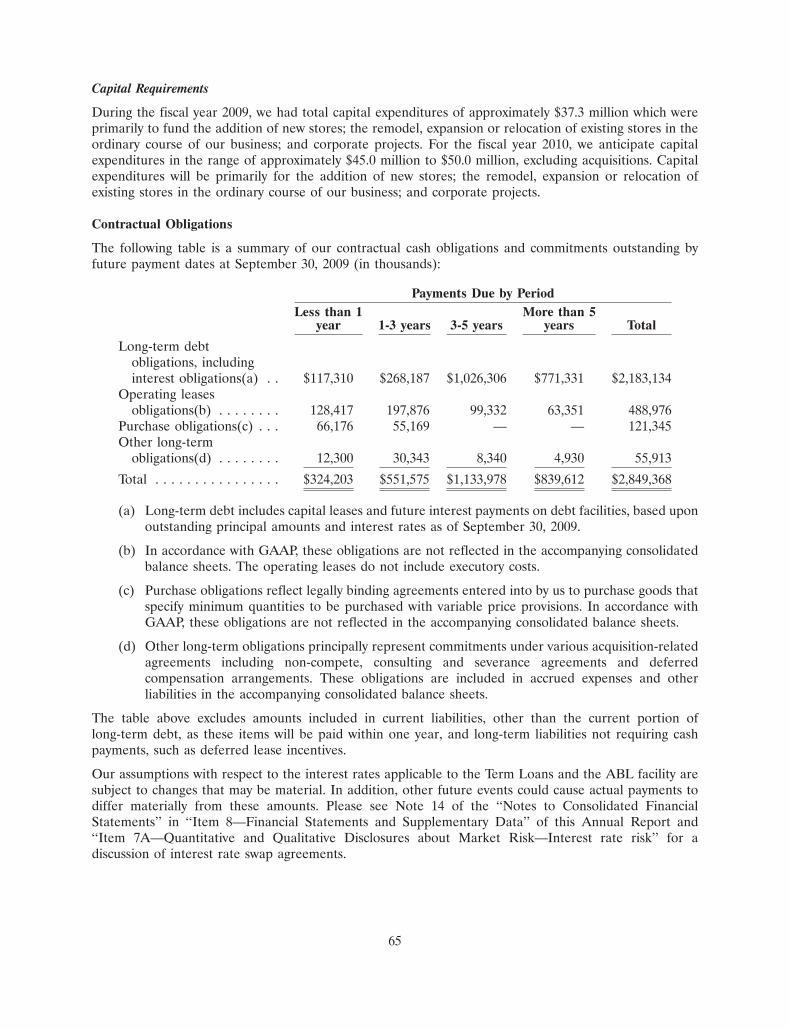
Capital Requirements
During the fiscal year 2009, we had total capital expenditures of approximately $37.3 million which wereprimarily to fund the addition of new stores; the remodel, expansion or relocation of existing stores in theordinary course of our business; and corporate projects. For the fiscal year 2010, we anticipate capitalexpenditures in the range of approximately $45.0 million to $50.0 million, excluding acquisitions. Capitalexpenditures will be primarily for the addition of new stores; the remodel, expansion or relocation ofexisting stores in the ordinary course of our business; and corporate projects.
Contractual Obligations
The following table is a summary of our contractual cash obligations and commitments outstanding byfuture payment dates at September 30, 2009 (in thousands):
Payments Due by PeriodLess than 1 More than 5
year 1-3 years 3-5 years years Total
Long-term debtobligations, includinginterest obligations(a) . . $117,310 $268,187 $1,026,306 $771,331 $2,183,134
Operating leasesobligations(b) . . . . . . . . 128,417 197,876 99,332 63,351 488,976
Purchase obligations(c) . . . 66,176 55,169 — — 121,345Other long-term
obligations(d) . . . . . . . . 12,300 30,343 8,340 4,930 55,913
Total . . . . . . . . . . . . . . . . $324,203 $551,575 $1,133,978 $839,612 $2,849,368
(a) Long-term debt includes capital leases and future interest payments on debt facilities, based uponoutstanding principal amounts and interest rates as of September 30, 2009.
(b) In accordance with GAAP, these obligations are not reflected in the accompanying consolidatedbalance sheets. The operating leases do not include executory costs.
(c) Purchase obligations reflect legally binding agreements entered into by us to purchase goods thatspecify minimum quantities to be purchased with variable price provisions. In accordance withGAAP, these obligations are not reflected in the accompanying consolidated balance sheets.
(d) Other long-term obligations principally represent commitments under various acquisition-relatedagreements including non-compete, consulting and severance agreements and deferredcompensation arrangements. These obligations are included in accrued expenses and otherliabilities in the accompanying consolidated balance sheets.
The table above excludes amounts included in current liabilities, other than the current portion oflong-term debt, as these items will be paid within one year, and long-term liabilities not requiring cashpayments, such as deferred lease incentives.
Our assumptions with respect to the interest rates applicable to the Term Loans and the ABL facility aresubject to changes that may be material. In addition, other future events could cause actual payments todiffer materially from these amounts. Please see Note 14 of the ‘‘Notes to Consolidated FinancialStatements’’ in ‘‘Item 8—Financial Statements and Supplementary Data’’ of this Annual Report and‘‘Item 7A—Quantitative and Qualitative Disclosures about Market Risk—Interest rate risk’’ for adiscussion of interest rate swap agreements.
65
The majority of our operating leases are for Sally Beauty Supply and BSG stores, which typically arelocated in strip shopping centers. The use of operating leases allows us to expand our business to newlocations without making significant up-front cash outlays for the purchase of land and buildings.
Off-Balance Sheet Financing Arrangements
At September 30, 2009 and 2008, we had no off-balance sheet financing arrangements other than operatingleases incurred in the ordinary course of business, as well as outstanding letters of credit related toinventory purchases and self insurance programs, which totaled $13.4 million and $12.1 million,respectively.
Inflation
We believe that inflation currently does not have a material effect on our results of operations.
Critical Accounting Policies and Estimates
The preparation of financial statements in conformity with GAAP requires us to make estimates andassumptions that affect the reported amounts of assets, liabilities, revenues and expenses and disclosure ofcontingent assets and liabilities in the financial statements. Actual results may differ from these estimates.We believe these estimates and assumptions are reasonable. We consider accounting policies to be criticalwhen they require us to make assumptions about matters that are highly uncertain at the time theaccounting estimate is made and when different estimates that our management reasonably could haveused have a material effect on the presentation of our financial condition, changes in financial condition orresults of operations.
Our critical accounting policies include but are not limited to the valuation of inventories, vendorconcessions, retention of risk, income taxes, long-lived assets impairment assessment and share-basedpayments.
Valuation of Inventories
When necessary, we adjust the carrying value of inventories to the lower of cost or market, including coststo sell or dispose, and for estimated inventory shrinkage. Inventories are stated at the lower of cost (first in,first out method) or market (net realizable value). Estimates of the future demand for our products, age ofthe inventory and changes in stock-keeping units are some of the key factors used by our management inassessing the net realizable value of inventories. We estimate inventory shrinkage based upon our historicalexperience. Actual results differing from these estimates could significantly affect our inventories and costof products sold and distribution expenses. Inventory shrinkage averaged approximately 1.0% ofconsolidated net sales in fiscal years 2009, 2008 and 2007. A 10% increase or decrease in our estimate ofinventory shrinkage at September 30, 2009, would impact net earnings by approximately $1.5 million, netof income tax.
Vendor Rebates and Concessions
We account for cash consideration received from vendors under ACS 605-50, Customer Payments andIncentives. This standard states that cash consideration received by a customer is presumed to be areduction of the cost of sales unless it is for an asset or service or a reimbursement of a specific,incremental, identifiable cost incurred by the customer in selling the vendor’s products. The majority ofcash consideration we receive is considered to be a reduction of the cost of sales and is allocated to cost ofproducts sold and distribution expenses as the related inventory is sold. We consider the facts andcircumstances of the various contractual agreements with vendors in order to determine the appropriateclassification of amounts received in the consolidated statements of earnings. We record cashconsideration expected to be received from vendors in other receivables. These receivables are recorded at
66
the amount we believe will be collected based on the provisions of the programs in place and are computedby estimating the point in time that we have completed our performance under the agreements and theamounts earned. These receivables could be significantly affected if actual results differ frommanagement’s expectations. A 10% increase or decrease in these receivables at September 30, 2009, wouldimpact net earnings by approximately $1.4 million, net of income tax.
Retention of Risk
Employee Health Insurance Liability
We maintain a largely self-funded program for healthcare benefits for employees who work for us on afull-time basis. We cover the majority of expenses associated with these benefits, other than payrolldeductions and out-of pocket expenses paid by the employees. Payments for healthcare benefits belowspecified amounts (currently $350,000 per individual per year and $1,000,000 per individual for a lifetimemaximum) are self-insured by us. We base our estimate of ultimate liability on trends in claim paymenthistory, historical trends in claims incurred but not yet reported, and other components such as expectedincreases in medical costs, projected premium costs and the number of plan participants. We review ourliability on a regular basis and adjust our accruals accordingly. As of September 30, 2009 and 2008, weaccrued an estimated liability relating to employee health insurance of $5.6 million and $7.1 million,respectively. Prior to the Separation Transactions, our employees were covered by healthcare plansprovided by Alberto-Culver.
Changes in facts and circumstances may lead to a change in the estimated liability due to revisions of theestimated ultimate costs of our employee healthcare benefits. Estimates of medical costs and trends inclaims are some of the key factors used by our management in determining our employee health insuranceliability. This liability could be significantly affected if actual results differ from management’sexpectations. A 10% increase or decrease in our employee health insurance liability at September 30, 2009would impact net earnings by approximately $0.3 million, net of income tax.
Workers’ Compensation Liability, General Liability and Automobile and Property Liability
We maintain a large deductible insurance plan for workers’ compensation liability, general liability andautomobile and property liability loss exposures. We base our estimates of the ultimate liability on anactuarial analysis performed by an independent third-party actuary. We review our liability on a regularbasis and adjust our accruals accordingly. As of September 30, 2009 and 2008, our balance sheet includedan estimated liability related to the deductible and retention limits of approximately $19.7 million and$16.5 million, respectively. Prior to the Separation Transactions, we were covered by the workers’compensation, general liability and automobile and property liability plans provided by Alberto-Culver.
Changes in facts and circumstances may lead to a change in the estimated liability due to revisions of theestimated ultimate costs that affect our workers’ compensation, general liability and automobile andproperty liability insurance coverage. Changes in estimates occur over time due to such factors as claimsincidence and severity of injury or damages. Our liabilities could be significantly affected if actual resultsdiffer from management’s expectations or actuarial analyses. A 10% increase or decrease in our workers’compensation liability, general liability and automobile and property liability at September 30, 2009 wouldimpact net earnings by approximately $1.2 million, net of income tax.
67
The change in the self-insurance liability was as follows (in thousands):
Year EndedSeptember 30,
2009 2008
Balance at beginning of period . . . . . . . . . . . . . . . . . . . . . . . . $ 25,415 $ 18,663Self-insurance expense . . . . . . . . . . . . . . . . . . . . . . . . . . . . . . 54,566 46,511Self-insurance liability of businesses acquired . . . . . . . . . . . . . . 214 —Payments, net of employee contributions . . . . . . . . . . . . . . . . . (53,275) (39,759)
Balance at end of period . . . . . . . . . . . . . . . . . . . . . . . . . . . . $ 26,920 $ 25,415
Income Taxes
We record tax provisions in our consolidated financial statements based on an estimation of currentincome tax liabilities. The development of these provisions requires judgments about tax issues, potentialoutcomes and timing. If we prevail in tax matters for which provisions have been established or arerequired to settle matters in excess of established provisions, our effective tax rate for a particular periodcould be significantly affected.
Deferred income taxes are recognized for the future tax consequences attributable to differences betweenthe financial statement carrying amounts of assets and liabilities and their respective tax bases. Deferredtax assets and liabilities are measured using enacted tax rates expected to apply to taxable income in theyears in which temporary differences are estimated to be recovered or settled. We believe that it is morelikely than not that our results of operations in the future will generate sufficient taxable income to realizeour deferred tax assets, net of the valuation allowance currently recorded. In the future, if we determinethat certain deferred tax assets will not be realizable, the related adjustments could significantly affect oureffective tax rate at that time. The estimated tax benefit of an uncertain tax position is recorded in ourfinancial statements only after determining a more-likely-than-not probability that the uncertain taxposition will withstand challenge, if any, from applicable taxing authorities.
Long-Lived Assets Impairment Assessment
Long-lived assets, such as property and equipment, including store equipment, and purchased intangiblessubject to depreciation or amortization, are reviewed for impairment annually, and whenever events orchanges in circumstances indicate that the carrying amount of an asset may not be recoverable.Recoverability of long-lived assets is measured by a comparison of the carrying amount of an asset toestimated future cash flows expected to be generated by the asset. If the carrying amount of an assetexceeds its estimated future cash flows, an impairment charge is recognized by the amount by which thecarrying amount of the asset exceeds the fair value of the asset. There were no significant impairments inthe current or prior fiscal years presented in the accompanying financial statements.
Share-Based Payments
We account for stock-based compensation under ASC 718. We recognize compensation expense on astraight-line basis over the vesting period or to the date a participant becomes eligible for retirement, ifearlier. For fiscal years 2009, 2008 and 2007, total compensation cost charged against income and includedin selling, general and administrative expenses for share-based compensation arrangements was$8.6 million, $10.2 million and $13.1 million, respectively.
The amount of stock option expense is determined based on the fair value of each stock option grant,which is estimated on the date of grant using the Black-Scholes option pricing model with the followingassumptions: expected life, volatility, risk-free interest rate and dividend yield. The expected life of stock
68
options represents the period of time that the stock options granted are expected to be outstanding. Weestimate the expected life based on historical exercise trends. We estimate expected volatility by using anindustry group that we belong to since it is not practicable to estimate the expected volatility due to ourlack of trading history. The risk-free interest rate is based on the zero-coupon U.S. Treasury issue at thedate of the grant for the expected life of the stock options. The dividend yield represents our anticipatedcash dividend over the expected life of the stock options. The amount of stock option expense recorded issignificantly affected by these estimates. In addition, we record stock option expense based on an estimateof the total number of stock options expected to vest, which requires us to estimate future forfeitures. Weuse historical forfeiture experience as a basis for this estimate. Actual forfeitures differing from theseestimates could significantly affect the timing of the recognition of stock option expense. We have based allthese estimates on our assumptions as of September 30, 2009. Our estimates for future periods may bebased on different assumptions and accordingly may differ.
We believe that our stock-based compensation expense is based on reasonable estimates and assumptions.However, if actual results are not consistent with our estimate or assumptions, we may be exposed tochanges in stock-based compensation expense that could be material. A 10% change in our stock basedcompensation expense for the year ended September 30, 2009 would affect earnings by approximately$0.5 million, net of income tax.
Recent Accounting Pronouncements
In June 2009, the FASB issued a new accounting standard named The FASB Accounting StandardsCodification and the Hierarchy of Generally Accepted Accounting Principles. This pronouncement, amongother things, identified the previously issued accounting standards that were considered authoritativegenerally accepted accounting principles in the U.S. and replaced all previously issued accountingpronouncements of the FASB, and its predecessor rule-making bodies, with the ASC. This standard waseffective prospectively for reporting periods ended after September 15, 2009 and, accordingly, theCompany adopted it during the fourth quarter of the fiscal year 2009. The adoption of this standard didnot have an effect on the Company’s consolidated financial position, results of operations or cash flows. Asa result of adopting this standard, the Company’s references to GAAP standards have been changed torefer to topics, subtopics, sections or subsections of the ASC, as appropriate.
In May 2009, the FASB issued ASC 855, Subsequent Events (‘‘ASC 855’’). ASC 855 establishes standards ofaccounting for and disclosure of transactions and events that occur after the balance sheet date but beforethe financial statements are issued. This accounting standard requires the disclosure, among other things,of the date through which an entity has evaluated subsequent events and whether that date is the date thefinancial statements were issued or the date the financial statements were available to be issued. Thisaccounting standard must be applied prospectively for interim and annual periods ended after June 15,2009 and, accordingly, the Company adopted its provisions effective for the quarter ended June 30, 2009.In connection therewith, the Company has evaluated all material transactions and events throughNovember 18, 2009, the last full business day before this Annual Report was filed with the SEC.
Effective on January 1, 2009, the Company adopted the amendment to ASC 815 contained inASC 815-10-65, Derivatives and Hedging, Transition (‘‘ASC 815-10-65’’). ASC 815-10-65 established, amongother things, the disclosure requirements for derivative instruments and for hedging activities. Thisstandard amended and expanded those disclosures to also require qualitative disclosures about theobjectives and strategies for using derivative instruments, quantitative disclosures about the fair value ofand gains and losses on derivative instruments and disclosures about credit-risk-related contingent featurescontained in the derivative instruments. This standard also requires companies to disclose informationabout how derivatives and related hedges are accounted for and how the hedges affect the entity’s financialposition, financial performance and cash flows, including the location and amounts of derivativeinstruments in the entity’s financial statements.
69
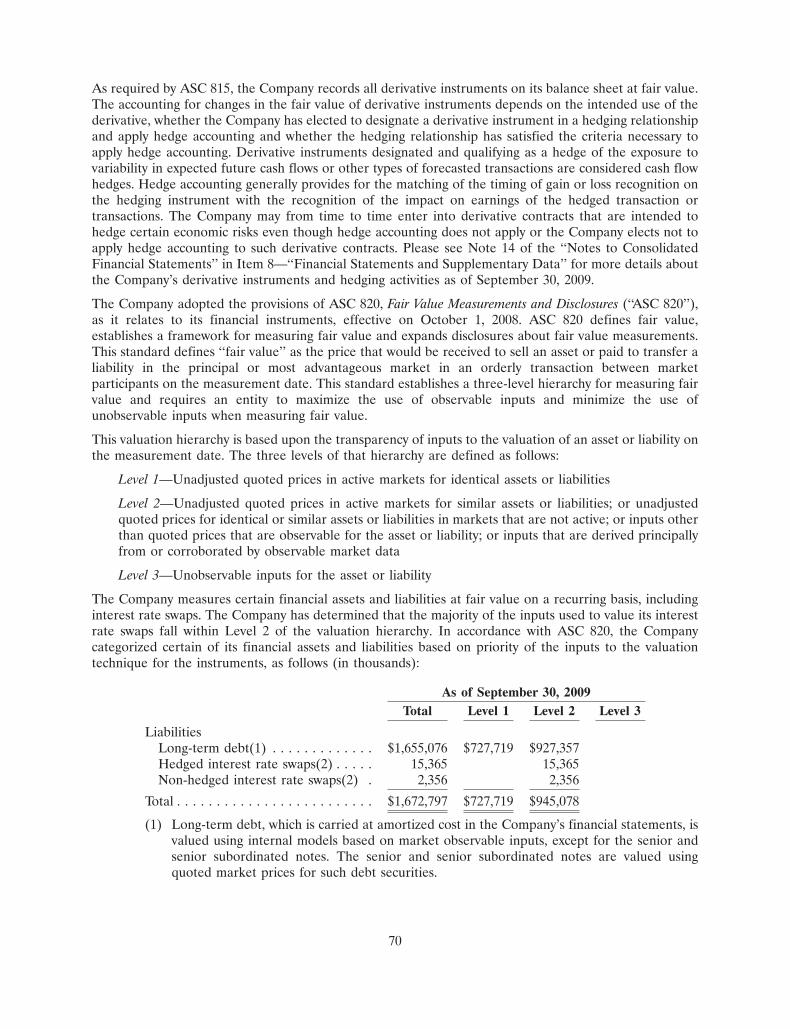
As required by ASC 815, the Company records all derivative instruments on its balance sheet at fair value.The accounting for changes in the fair value of derivative instruments depends on the intended use of thederivative, whether the Company has elected to designate a derivative instrument in a hedging relationshipand apply hedge accounting and whether the hedging relationship has satisfied the criteria necessary toapply hedge accounting. Derivative instruments designated and qualifying as a hedge of the exposure tovariability in expected future cash flows or other types of forecasted transactions are considered cash flowhedges. Hedge accounting generally provides for the matching of the timing of gain or loss recognition onthe hedging instrument with the recognition of the impact on earnings of the hedged transaction ortransactions. The Company may from time to time enter into derivative contracts that are intended tohedge certain economic risks even though hedge accounting does not apply or the Company elects not toapply hedge accounting to such derivative contracts. Please see Note 14 of the ‘‘Notes to ConsolidatedFinancial Statements’’ in Item 8—‘‘Financial Statements and Supplementary Data’’ for more details aboutthe Company’s derivative instruments and hedging activities as of September 30, 2009.
The Company adopted the provisions of ASC 820, Fair Value Measurements and Disclosures (‘‘ASC 820’’),as it relates to its financial instruments, effective on October 1, 2008. ASC 820 defines fair value,establishes a framework for measuring fair value and expands disclosures about fair value measurements.This standard defines ‘‘fair value’’ as the price that would be received to sell an asset or paid to transfer aliability in the principal or most advantageous market in an orderly transaction between marketparticipants on the measurement date. This standard establishes a three-level hierarchy for measuring fairvalue and requires an entity to maximize the use of observable inputs and minimize the use ofunobservable inputs when measuring fair value.
This valuation hierarchy is based upon the transparency of inputs to the valuation of an asset or liability onthe measurement date. The three levels of that hierarchy are defined as follows:
Level 1—Unadjusted quoted prices in active markets for identical assets or liabilities
Level 2—Unadjusted quoted prices in active markets for similar assets or liabilities; or unadjustedquoted prices for identical or similar assets or liabilities in markets that are not active; or inputs otherthan quoted prices that are observable for the asset or liability; or inputs that are derived principallyfrom or corroborated by observable market data
Level 3—Unobservable inputs for the asset or liability
The Company measures certain financial assets and liabilities at fair value on a recurring basis, includinginterest rate swaps. The Company has determined that the majority of the inputs used to value its interestrate swaps fall within Level 2 of the valuation hierarchy. In accordance with ASC 820, the Companycategorized certain of its financial assets and liabilities based on priority of the inputs to the valuationtechnique for the instruments, as follows (in thousands):
As of September 30, 2009Total Level 1 Level 2 Level 3
LiabilitiesLong-term debt(1) . . . . . . . . . . . . . $1,655,076 $727,719 $927,357Hedged interest rate swaps(2) . . . . . 15,365 15,365Non-hedged interest rate swaps(2) . 2,356 2,356
Total . . . . . . . . . . . . . . . . . . . . . . . . . $1,672,797 $727,719 $945,078
(1) Long-term debt, which is carried at amortized cost in the Company’s financial statements, isvalued using internal models based on market observable inputs, except for the senior andsenior subordinated notes. The senior and senior subordinated notes are valued usingquoted market prices for such debt securities.
70
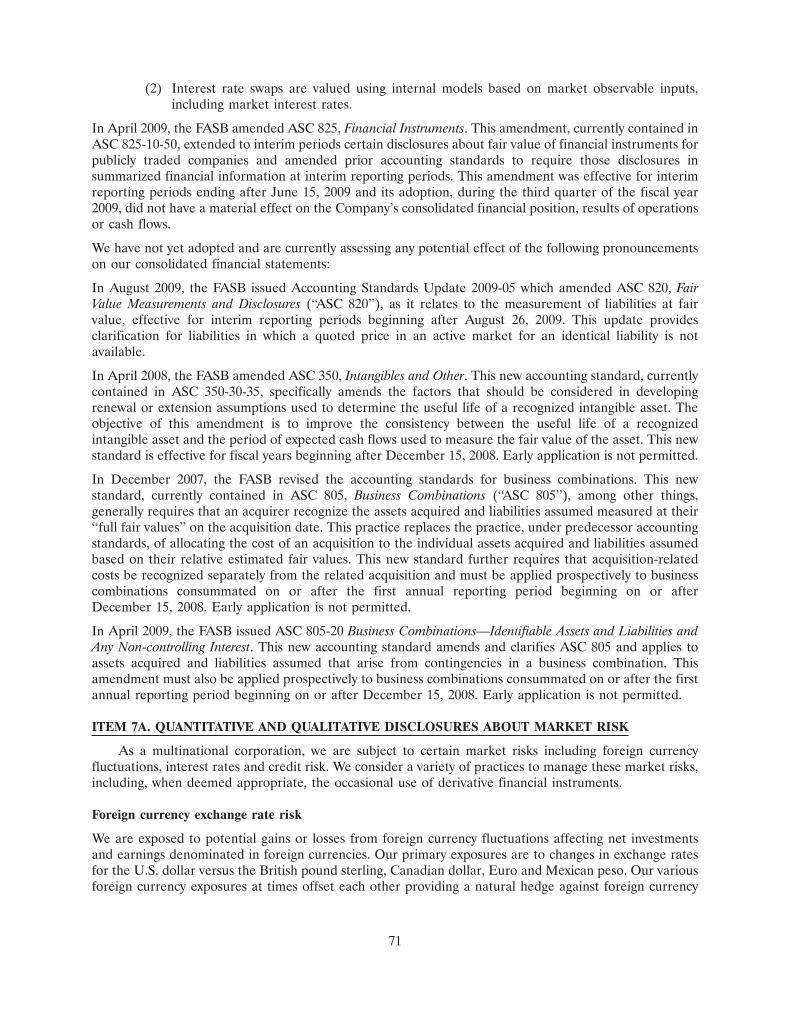
(2) Interest rate swaps are valued using internal models based on market observable inputs,including market interest rates.
In April 2009, the FASB amended ASC 825, Financial Instruments. This amendment, currently contained inASC 825-10-50, extended to interim periods certain disclosures about fair value of financial instruments forpublicly traded companies and amended prior accounting standards to require those disclosures insummarized financial information at interim reporting periods. This amendment was effective for interimreporting periods ending after June 15, 2009 and its adoption, during the third quarter of the fiscal year2009, did not have a material effect on the Company’s consolidated financial position, results of operationsor cash flows.
We have not yet adopted and are currently assessing any potential effect of the following pronouncementson our consolidated financial statements:
In August 2009, the FASB issued Accounting Standards Update 2009-05 which amended ASC 820, FairValue Measurements and Disclosures (‘‘ASC 820’’), as it relates to the measurement of liabilities at fairvalue, effective for interim reporting periods beginning after August 26, 2009. This update providesclarification for liabilities in which a quoted price in an active market for an identical liability is notavailable.
In April 2008, the FASB amended ASC 350, Intangibles and Other. This new accounting standard, currentlycontained in ASC 350-30-35, specifically amends the factors that should be considered in developingrenewal or extension assumptions used to determine the useful life of a recognized intangible asset. Theobjective of this amendment is to improve the consistency between the useful life of a recognizedintangible asset and the period of expected cash flows used to measure the fair value of the asset. This newstandard is effective for fiscal years beginning after December 15, 2008. Early application is not permitted.
In December 2007, the FASB revised the accounting standards for business combinations. This newstandard, currently contained in ASC 805, Business Combinations (‘‘ASC 805’’), among other things,generally requires that an acquirer recognize the assets acquired and liabilities assumed measured at their‘‘full fair values’’ on the acquisition date. This practice replaces the practice, under predecessor accountingstandards, of allocating the cost of an acquisition to the individual assets acquired and liabilities assumedbased on their relative estimated fair values. This new standard further requires that acquisition-relatedcosts be recognized separately from the related acquisition and must be applied prospectively to businesscombinations consummated on or after the first annual reporting period beginning on or afterDecember 15, 2008. Early application is not permitted.
In April 2009, the FASB issued ASC 805-20 Business Combinations—Identifiable Assets and Liabilities andAny Non-controlling Interest. This new accounting standard amends and clarifies ASC 805 and applies toassets acquired and liabilities assumed that arise from contingencies in a business combination. Thisamendment must also be applied prospectively to business combinations consummated on or after the firstannual reporting period beginning on or after December 15, 2008. Early application is not permitted.
ITEM 7A. QUANTITATIVE AND QUALITATIVE DISCLOSURES ABOUT MARKET RISK
As a multinational corporation, we are subject to certain market risks including foreign currencyfluctuations, interest rates and credit risk. We consider a variety of practices to manage these market risks,including, when deemed appropriate, the occasional use of derivative financial instruments.
Foreign currency exchange rate risk
We are exposed to potential gains or losses from foreign currency fluctuations affecting net investmentsand earnings denominated in foreign currencies. Our primary exposures are to changes in exchange ratesfor the U.S. dollar versus the British pound sterling, Canadian dollar, Euro and Mexican peso. Our variousforeign currency exposures at times offset each other providing a natural hedge against foreign currency
71
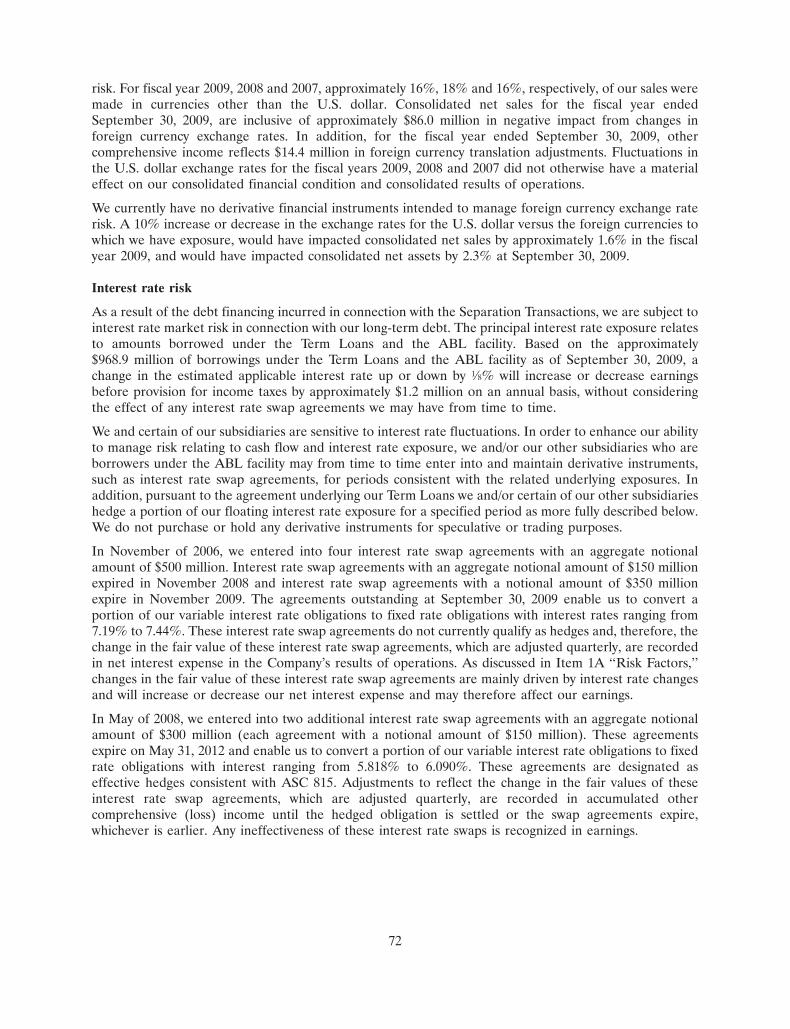
risk. For fiscal year 2009, 2008 and 2007, approximately 16%, 18% and 16%, respectively, of our sales weremade in currencies other than the U.S. dollar. Consolidated net sales for the fiscal year endedSeptember 30, 2009, are inclusive of approximately $86.0 million in negative impact from changes inforeign currency exchange rates. In addition, for the fiscal year ended September 30, 2009, othercomprehensive income reflects $14.4 million in foreign currency translation adjustments. Fluctuations inthe U.S. dollar exchange rates for the fiscal years 2009, 2008 and 2007 did not otherwise have a materialeffect on our consolidated financial condition and consolidated results of operations.
We currently have no derivative financial instruments intended to manage foreign currency exchange raterisk. A 10% increase or decrease in the exchange rates for the U.S. dollar versus the foreign currencies towhich we have exposure, would have impacted consolidated net sales by approximately 1.6% in the fiscalyear 2009, and would have impacted consolidated net assets by 2.3% at September 30, 2009.
Interest rate risk
As a result of the debt financing incurred in connection with the Separation Transactions, we are subject tointerest rate market risk in connection with our long-term debt. The principal interest rate exposure relatesto amounts borrowed under the Term Loans and the ABL facility. Based on the approximately$968.9 million of borrowings under the Term Loans and the ABL facility as of September 30, 2009, achange in the estimated applicable interest rate up or down by 1⁄8% will increase or decrease earningsbefore provision for income taxes by approximately $1.2 million on an annual basis, without consideringthe effect of any interest rate swap agreements we may have from time to time.
We and certain of our subsidiaries are sensitive to interest rate fluctuations. In order to enhance our abilityto manage risk relating to cash flow and interest rate exposure, we and/or our other subsidiaries who areborrowers under the ABL facility may from time to time enter into and maintain derivative instruments,such as interest rate swap agreements, for periods consistent with the related underlying exposures. Inaddition, pursuant to the agreement underlying our Term Loans we and/or certain of our other subsidiarieshedge a portion of our floating interest rate exposure for a specified period as more fully described below.We do not purchase or hold any derivative instruments for speculative or trading purposes.
In November of 2006, we entered into four interest rate swap agreements with an aggregate notionalamount of $500 million. Interest rate swap agreements with an aggregate notional amount of $150 millionexpired in November 2008 and interest rate swap agreements with a notional amount of $350 millionexpire in November 2009. The agreements outstanding at September 30, 2009 enable us to convert aportion of our variable interest rate obligations to fixed rate obligations with interest rates ranging from7.19% to 7.44%. These interest rate swap agreements do not currently qualify as hedges and, therefore, thechange in the fair value of these interest rate swap agreements, which are adjusted quarterly, are recordedin net interest expense in the Company’s results of operations. As discussed in Item 1A ‘‘Risk Factors,’’changes in the fair value of these interest rate swap agreements are mainly driven by interest rate changesand will increase or decrease our net interest expense and may therefore affect our earnings.
In May of 2008, we entered into two additional interest rate swap agreements with an aggregate notionalamount of $300 million (each agreement with a notional amount of $150 million). These agreementsexpire on May 31, 2012 and enable us to convert a portion of our variable interest rate obligations to fixedrate obligations with interest ranging from 5.818% to 6.090%. These agreements are designated aseffective hedges consistent with ASC 815. Adjustments to reflect the change in the fair values of theseinterest rate swap agreements, which are adjusted quarterly, are recorded in accumulated othercomprehensive (loss) income until the hedged obligation is settled or the swap agreements expire,whichever is earlier. Any ineffectiveness of these interest rate swaps is recognized in earnings.
72
Credit risk
We are exposed to credit risk on certain assets, primarily cash equivalents, short-term investments andaccounts receivable. We believe that the credit risk associated with cash equivalents and short-terminvestments, if any, is largely mitigated by our policy of investing in a diversified portfolio of securities withhigh credit ratings.
We provide credit to customers in the ordinary course of business and perform ongoing credit evaluations.We believe that our exposure to concentrations of credit risk with respect to trade receivables is largelymitigated by our broad customer base. We believe our allowance for doubtful accounts is sufficient tocover customer credit risks.
ITEM 8. FINANCIAL STATEMENTS AND SUPPLEMENTARY DATA
Please see ‘‘Index to Financial Statements’’ which is located on page 84 of this Annual Report.
ITEM 9. CHANGES IN AND DISAGREEMENTS WITH ACCOUNTANTS ON ACCOUNTING ANDFINANCIAL DISCLOSURE
None.
ITEM 9A. CONTROLS AND PROCEDURES
Background. Attached as exhibits to this Annual Report on Form 10-K are certifications of our ChiefExecutive Officer (‘‘CEO’’) and Chief Financial Officer (‘‘CFO’’), which are required in accordance withRule 13a-14 of the Exchange Act. This ‘‘Controls and Procedures’’ section includes information concerningthe controls and controls evaluation referred to in the certifications. Part II, Item 8—Financial Statementsand Supplementary Data of this Annual Report on Form 10-K sets forth the attestation report ofKPMG LLP, our independent registered public accounting firm, regarding its audit of our internal controlover financial reporting. This section should be read in conjunction with the certifications and the KPMGattestation report for a more complete understanding of the topics presented.
Controls Evaluation and Related CEO and CFO Certifications. Our management, with the participation ofour CEO and CFO, conducted an evaluation of the effectiveness of the design and operation of ourdisclosure controls and procedures as of the end of the period covered by this Annual Report. The controlsevaluation was conducted by our Disclosure Committee, comprised of senior representatives from ourfinance, accounting, internal audit, and legal departments under the supervision of our CEO and CFO.
Certifications of our CEO and our CFO, which are required in accordance with Rule 13a-14 of theExchange Act, are attached as exhibits to this Annual Report. This ‘‘Controls and Procedures’’ sectionincludes the information concerning the controls evaluation referred to in the certifications, and it shouldbe read in conjunction with the certifications for a more complete understanding of the topics presented.
Limitations on the Effectiveness of Controls. We do not expect that our disclosure controls and procedureswill prevent all errors and all fraud. A system of controls and procedures, no matter how well conceivedand operated, can provide only reasonable, not absolute, assurance that the objectives of the system aremet. Because of the limitations in all such systems, no evaluation can provide absolute assurance that allcontrol issues and instances of fraud, if any, within the Company have been detected. Furthermore, thedesign of any system of controls and procedures is based in part upon certain assumptions about thelikelihood of future events, and there can be no assurance that any design will succeed in achieving itsstated goals under all potential future conditions, regardless of how unlikely. Because of these inherentlimitations in a cost-effective system of controls and procedures, misstatements or omissions due to erroror fraud may occur and not be detected.
73
Scope of the Controls Evaluation. The evaluation of our disclosure controls and procedures included areview of their objectives and design, our implementation of the controls and procedures and the effect ofthe controls and procedures on the information generated for use in this Annual Report. In the course ofthe evaluation, we sought to identify whether we had any data errors, control problems or acts of fraud andto confirm that appropriate corrective action, including process improvements, was being undertaken ifneeded. This type of evaluation is performed on a quarterly basis so that conclusions concerning theeffectiveness of our disclosure controls and procedures can be reported in our Quarterly Reports onForm 10-Q and our Annual Reports on Form 10-K. Many of the components of our disclosure controlsand procedures are also evaluated by our internal audit department, by our legal department and bypersonnel in our finance organization. The overall goals of these various evaluation activities are tomonitor our disclosure controls and procedures on an ongoing basis, and to maintain them as dynamicsystems that change as conditions warrant.
Conclusions regarding Disclosure Controls. Based on the required evaluation of our disclosure controlsand procedures, our CEO and CFO have concluded that, as of September 30, 2009, we maintain disclosurecontrols and procedures that are effective in providing reasonable assurance that information required tobe disclosed by us in the reports that we file or submit under the Exchange Act is recorded, processed,summarized and reported within the time periods specified in the SEC’s rules and forms, and that suchinformation is accumulated and communicated to our management, including our CEO and CFO, asappropriate to allow timely decisions regarding required disclosure.
Management’s Annual Report on Internal Control over Financial Reporting.
Management of the Company, including the CEO and CFO, is responsible for establishing andmaintaining adequate internal control over financial reporting as defined in Rule 13a-15(f) under theExchange Act. Our internal control system was designed to provide reasonable assurance to managementand our Board of Directors regarding the reliability of financial reporting and the preparation of financialstatements for external purposes in accordance with generally accepted accounting principles.
All internal control systems, no matter how well designed, have inherent limitations. A system of internalcontrols may become inadequate over time because of changes in conditions or deterioration in the degreeof compliance with the policies or procedures. Therefore, even those systems determined to be effectivecan provide only reasonable assurance with respect to financial statement preparation and presentation.
Management assessed the effectiveness of our internal control over financial reporting as of September 30,2009 using the criteria set forth by the Committee of Sponsoring Organizations of the TreadwayCommission (‘‘COSO’’) in Internal Control-Integrated Framework. Based on this assessment, managementhas concluded that, as of September 30, 2009 our internal control over financial reporting was effective toprovide reasonable assurance regarding the reliability of financial reporting and the preparation offinancial statements for external purposes in accordance with generally accepted accounting principlesbased on such criteria.
Report of Independent Registered Public Accounting Firm. Please refer to KPMG’s Report of IndependentRegistered Public Accounting Firm on Internal Control over Financial Reporting on page F-1 of thefinancial statements, which begin on page 84 of this Annual Report.
Changes in Internal Control over Financial Reporting. During our last fiscal quarter, there have been nochanges in our internal control over financial reporting identified in connection with the evaluationdescribed above that have materially affected, or are reasonably likely to materially affect, our internalcontrol over financial reporting.
ITEM 9B. OTHER INFORMATION
None.
74
PART III
ITEM 10. DIRECTORS, EXECUTIVE OFFICERS AND CORPORATE GOVERNANCE
The information required by Item 10 of this Annual Report on Form 10-K is incorporated byreference from our Proxy Statement related to the 2010 Annual Meeting of Stockholders under theheadings ‘‘Proposal 1—Election of Directors,’’ ‘‘Executive Officers of the Registrant,’’ ‘‘InformationRegarding Corporate Governance, the Board, and Its Committees,’’ ‘‘Section 16(a) Beneficial OwnershipReporting Compliance’’ and ‘‘Report of the Audit Committee.’’
The Board of Directors has adopted: (i) Corporate Governance Guidelines and a (ii) Code of BusinessConduct and Ethics that apply to directors, officers and employees. Copies of these documents and thecommittee charters are available on our website at www.sallybeautyholdings.com and are available in printto any person, without charge, upon written request to our Vice President of Investor Relations. We intendto disclose on our website at www.sallybeautyholdings.com any substantive amendment to, or waiver from, aprovision of the Code of Business Conduct and Ethics that applies to these individuals or personsperforming similar functions.
ITEM 11. EXECUTIVE COMPENSATION
The information required by Item 11 of this Annual Report on Form 10-K is incorporated byreference from our Proxy Statement related to the 2010 Annual Meeting of Stockholders under theheadings ‘‘Information on the Compensation of Directors,’’ ‘‘Compensation Discussion and Analysis,’’‘‘Compensation Committee Report,’’ ‘‘Executive Compensation’’ and ‘‘Compensation CommitteeInterlocks and Insider Participation.’’
ITEM 12. SECURITY OWNERSHIP OF CERTAIN BENEFICIAL OWNERS AND MANAGEMENTAND RELATED STOCKHOLDER MATTERS
The information required by Item 12 of this Annual Report on Form 10-K is incorporated byreference from our Proxy Statement related to the 2010 Annual Meeting of Stockholders under theheadings ‘‘Ownership of Securities’’ and ‘‘Equity Compensation Plan Information.’’
ITEM 13. CERTAIN RELATIONSHIPS AND RELATED TRANSACTIONS, AND DIRECTORINDEPENDENCE
The information required by Item 13 of this Annual Report on Form 10-K is incorporated byreference from our Proxy Statement related to the 2010 Annual Meeting of Stockholders under theheadings ‘‘Information Regarding Corporate Governance, the Board, and Its Committees,’’‘‘Compensation Committee Interlocks and Insider Participation’’ and ‘‘Certain Relationships and RelatedTransactions.’’
ITEM 14. PRINCIPAL ACCOUNTANT FEES AND SERVICES
The information required by Item 14 of this Annual Report on Form 10-K is incorporated byreference from our Proxy Statement related to the 2010 Annual Meeting of Stockholders under theheadings ‘‘Proposal 2—Ratification of Selection of Auditors.’’
75
PART IV
ITEM 15. EXHIBITS AND FINANCIAL STATEMENT SCHEDULES
Documents filed as part of this Annual Report:
(a) Financial Statements and Financial Statement Schedules
Please see ‘‘Index to Financial Statements’’ which is located on page 84 of this Annual Report.
(b) Exhibits Required by Securities and Exchange Commission Regulation S-K
The following exhibits are filed as part of this Annual Report or are incorporated herein by reference:
Exhibits
Exhibit No. Description
2.1 Investment Agreement, dated as of June 19, 2006, among Alberto-Culver Company,New Aristotle Company, Sally Holdings, Inc., New Sally Holdings, Inc. and CDRSAcquisition LLC, which is incorporated herein by reference from Exhibit 2.1 toAmendment No. 3 to the Company’s Registration Statement on Form S-4 (FileNo. 333-136259) filed on October 10, 2006
2.2 First Amendment to the Investment Agreement, dated as of October 3, 2006, amongAlberto-Culver Company, New Aristotle Company, Sally Holdings, Inc., New SallyHoldings, Inc. and CDRS Acquisition LLC, which is incorporated herein by referencefrom Exhibit 2.2 to Amendment No. 3 to the Company’s Registration Statement onForm S-4 (File No. 333-136259) filed on October 10, 2006
2.3 Second Amendment to the Investment Agreement, dated as of October 26, 2006,among Alberto-Culver Company, New Aristotle Company, Sally Holdings, Inc., NewSally Holdings, Inc. and CDRS Acquisition LLC, which is incorporated herein byreference from Exhibit 2.02 to the Company’s Current Report on Form 8-K filed onOctober 30, 2006
2.4 Separation Agreement, dated as of June 19, 2006, among Alberto-Culver Company,Sally Holdings, Inc., New Sally Holdings, Inc. and New Aristotle Holdings, Inc., whichis incorporated herein by reference from Exhibit 2.3 to Amendment No. 3 to theCompany’s Registration Statement on Form S-4 (File No. 333-136259) filed onOctober 10, 2006
2.5 First Amendment to the Separation Agreement, dated as of October 3, 2006, amongAlberto-Culver Company, Sally Holdings, Inc., New Sally Holdings, Inc. and NewAristotle Holdings, Inc., which is incorporated herein by reference from Exhibit 2.4 toAmendment No. 3 to the Company’s Registration Statement on Form S-4 (FileNo. 333-136259) filed on October 10, 2006
2.6 Second Amendment to the Separation Agreement, dated as of October 26, 2006,among Alberto-Culver Company, Sally Holdings, Inc., New Sally Holdings, Inc. andNew Aristotle Holdings, Inc., which is incorporated herein by reference fromExhibit 2.01 to the Company’s Current Report on Form 8-K filed on October 30, 2006
3.1 Amended and Restated Certificate of Incorporation of Sally Beauty Holdings, Inc.,dated November 16, 2006, which is incorporated herein by reference from Exhibit 4.1to the Company’s Registration Statement on Form S-8 filed on November 20, 2006
76
3.2 Third Amended and Restated Bylaws of Sally Beauty Holdings, Inc., dated October 23,2008, which is incorporated herein by reference from Exhibit 3.1 to the Company’sCurrent Report on Form 8-K filed on October 23, 2008.
4.1 Stockholders Agreement, dated as of November 16, 2006, by and among the Company,CDRS Acquisition LLC, CD&R Parallel Fund VII, L.P. and the other stockholdersparty thereto, which is incorporated herein by reference from Exhibit 4.8 to theCompany’s Current Report on Form 8-K filed on November 22, 2006
4.2 First Amendment to the Stockholders Agreement, dated as of December 13, 2006,between the Company and CDRS Acquisition LLC and Carol L. Bernick, asrepresentative of the other stockholders, which is incorporated herein by referencefrom Exhibit 4.2 to the Company’s Annual Report on Form 10-K filed onDecember 22, 2006
4.3 Indenture, dated as of November 16, 2006, by and among Sally Holdings LLC andSally Capital Inc., as Co-Issuers, the Subsidiary Guarantors from time to time partiesthereto, and Wells Fargo Bank, National Association, as Trustee, governing the 9.25%Senior Notes due 2014, which is incorporated herein by reference from Exhibit 4.1 tothe Company’s Current Report on Form 8-K filed on November 22, 2006
4.4 First Supplemental Indenture, dated as of May 30, 2007, by and among SallyHoldings LLC and Sally Capital Inc., as co-Issuers, the Subsidiary Guarantors namedtherein, and Wells Fargo Bank, National Association, as trustee, governing the 9.25%Senior Notes due 2014, which is incorporated herein by reference from Exhibit 4.2from the Registration Statement on Form S-4 (File No. 333-144427) of SallyHoldings LLC and Sally Capital Inc. filed on July 9, 2007
4.5 Indenture, dated as of November 16, 2006, by and among Sally Holdings LLC andSally Capital Inc., as Co-Issuers, the Subsidiary Guarantors from time to time partiesthereto, and Wells Fargo Bank, National Association, as Trustee, governing the 10.5%Senior Subordinated Notes due 2016, which is incorporated herein by reference fromExhibit 4.2 to the Company’s Current Report on Form 8-K filed on November 22, 2006
4.6 First Supplemental Indenture, dated as of May 30, 2007, by and among SallyHoldings LLC and Sally Capital Inc., as co-Issuers, the Subsidiary Guarantors namedtherein, and Wells Fargo Bank, National Association, as trustee, governing the 10.5%Senior Subordinated Notes due 2016, which is incorporated herein by reference fromExhibit 4.4 from the Registration Statement on Form S-4 (File No. 333-144427) ofSally Holdings LLC and Sally Capital Inc. filed on July 9, 2007
4.7 Exchange and Registration Rights Agreement, dated as of November 16, 2006, by andamong Sally Holdings LLC, Sally Capital Inc., the Subsidiary Guarantors partiesthereto, Merrill Lynch, Pierce, Fenner & Smith, Incorporated and the other financialinstitutions named therein, relating to the 9.25% Senior Notes due 2014, which isincorporated herein by reference from Exhibit 4.3 to the Company’s Current Reporton Form 8-K filed on November 22, 2006
4.8 Exchange and Registration Rights Agreement, dated as of November 16, 2006, by andamong Sally Holdings LLC, Sally Capital Inc., the Subsidiary Guarantors partiesthereto, Merrill Lynch, Pierce, Fenner & Smith, Incorporated and the other financialinstitutions named therein, relating to the 10.5% Senior Subordinated Notes due 2016,which is incorporated herein by reference from Exhibit 4.4 to the Company’s CurrentReport on Form 8-K filed on November 22, 2006
77
4.9 Credit Agreement, dated November 16, 2006, with respect to a Term Loan Facility, byand among Sally Holdings LLC, the several lenders from time to time parties thereto,and Merrill Lynch Capital Corporation, as Administrative Agent and Collateral Agent,which is incorporated herein by reference from Exhibit 4.5.1 to the Company’s CurrentReport on Form 8-K filed on November 22, 2006
4.10 Guarantee and Collateral Agreement, dated as of November 16, 2006, made by SallyInvestment Holdings LLC, Sally Holdings LLC and certain subsidiaries of SallyHoldings LLC in favor of Merrill Lynch Capital Corporation, as Administrative Agentand Collateral Agent, which is incorporated herein by reference from Exhibit 4.5.2 tothe Company’s Current Report on Form 8-K filed on November 22, 2006
4.11 Credit Agreement, dated November 16, 2006, with respect to an Asset-Based LoanFacility, among Sally Holdings LLC, Beauty Systems Group LLC, Sally BeautySupply LLC, any Canadian Borrower from time to time party thereto, certainsubsidiaries of Sally Holdings LLC, the several lenders from time to time partiesthereto, Merrill Lynch Capital, a division of Merrill Lynch Business FinancialServices Inc., as Administrative Agent and Collateral Agent, and Merrill Lynch CapitalCanada Inc., as Canadian Agent and Canadian Collateral Agent, which is incorporatedherein by reference from Exhibit 4.6.1 to the Company’s Current Report on Form 8-Kfiled on November 22, 2006
4.12 U.S. Guarantee and Collateral Agreement, dated as of November 16, 2006, made bySally Investment Holdings LLC, Sally Holdings LLC and certain subsidiaries of SallyHoldings LLC in favor of Merrill Lynch Capital, a division of Merrill Lynch BusinessFinancial Services Inc., as Administrative Agent and Collateral Agent, which isincorporated herein by reference from Exhibit 4.6.2 to the Company’s Current Reporton Form 8-K filed on November 22, 2006
4.13 Canadian Guarantee and Collateral Agreement, dated as of November 16, 2006, madeby Sally Beauty (Canada) Corporation, Beauty Systems Group (Canada), Inc., SallyBeauty Canada Holdings Inc. and certain of their respective subsidiaries in favor ofMerrill Lynch Capital Canada Inc., as Canadian Agent and Canadian Collateral Agent,which is incorporated herein by reference from Exhibit 4.6.3 to the Company’s CurrentReport on Form 8-K filed on November 22, 2006
4.14 Intercreditor Agreement, dated as of November 16, 2006, by and between MerrillLynch Capital Corporation, as Administrative Agent and Collateral Agent under theTerm Loan Facility, and Merrill Lynch Capital, a division of Merrill Lynch BusinessFinancial Services Inc., as Administrative Agent and Collateral Agent under the Asset-Based Loan Facility, which is incorporated herein by reference from Exhibit 4.7 to theCompany’s Current Report on Form 8-K filed on November 22, 2006
4.15 Assignment and Acceptance of that certain Credit Agreement, dated as ofNovember 16, 2006, among Sally Holdings LLC, Beauty Systems Group LLC, SallyBeauty Supply LLC, the Canadian Borrowers (as defined in the Credit Agreement),the several banks and other financial institutions from time to time parties thereto,Merrill Lynch Capital, a division of’ Merrill Lynch Business Financial Services Inc., asadministrative agent and collateral agent for the Lenders and Merrill Lynch CapitalCanada, Inc., as Canadian agent and Canadian collateral agent for the Lenders*
78
10.1 Tax Allocation Agreement, dated as of June 19, 2006, among Alberto-Culver Company,New Aristotle Holdings, Inc., New Sally Holdings, Inc. and Sally Holdings, Inc., whichis incorporated herein by reference from Exhibit 10.1 to Amendment No. 3 to theCompany’s Registration Statement on Form S-4 (File No. 333-136259) filed onOctober 10, 2006
10.2 First Amendment to the Tax Allocation Agreement, dated as of October 3, 2006,among Alberto-Culver Company, New Aristotle Holdings, Inc., New SallyHoldings, Inc. and Sally Holdings, Inc., which is incorporated herein by reference fromExhibit 10.2 to Amendment No. 3 to the Company’s Registration Statement onForm S-4 (File No. 333-136259) filed on October 10, 2006
10.3 Second Amendment to the Tax Allocation Agreement, dated as of October 26, 2006,among Alberto-Culver Company, New Aristotle Holdings, Inc., New SallyHoldings, Inc. and Sally Holdings, Inc., which is incorporated herein by reference fromExhibit 10.01 to the Company’s Current Report on Form 8-K filed on October 30,2006
10.4 Employee Matters Agreement, dated as of June 19, 2006, among Alberto-CulverCompany, New Aristotle Holdings, Inc., New Sally Holdings, Inc. and SallyHoldings, Inc., which is incorporated herein by reference from Exhibit 10.3 toAmendment No. 3 to the Company’s Registration Statement on Form S-4 (FileNo. 333-136259) filed on October 10, 2006
10.5 First Amendment to the Employee Matters Agreement, dated October 3, 2006, amongAlberto-Culver Company, New Aristotle Holdings, Inc., New Sally Holdings, Inc. andSally Holdings, Inc., which is incorporated herein by reference from Exhibit 10.4 toAmendment No. 3 to the Company’s Registration Statement on Form S-4 (FileNo. 333-136259) filed on October 10, 2006
10.6 Second Amendment to the Employee Matters Agreement, dated as of October 26,2006, among Alberto-Culver Company, New Aristotle Holdings, Inc., New SallyHoldings, Inc. and Sally Holdings, Inc., which is incorporated herein by reference fromExhibit 10.02 to the Company’s Current Report on Form 8-K filed on October 30,2006
10.7 Support Agreement, dated as of June 19, 2006, among CDRS Acquisition LLC,Alberto-Culver Company, New Sally Holdings, Inc. and the stockholders party thereto,which is incorporated herein by reference from Exhibit 10.10 to the Current Report onForm 8-K filed by Alberto-Culver Company on June 22, 2006
10.8 Support Agreement, dated as of June 19, 2006, among CDRS Acquisition LLC,Alberto-Culver Company, New Sally Holdings, Inc. and Howard B. Bernick, which isincorporated herein by reference from Exhibit 10.11 to the Current Report onForm 8-K filed by Alberto-Culver Company on June 22, 2006
10.9 Termination Agreement, dated as of June 18, 2006, among Alberto-Culver Company,Sally Holdings, Inc. and Gary G. Winterhalter, which is incorporated herein byreference from Exhibit 10.9 to the Current Report on Form 8-K filed by Alberto-Culver Company on June 22, 2006
10.10 Form of First Amendment to the Termination Agreement with Gary G. Winterhalter,which is incorporated herein by reference from Exhibit 10.1 to the Company’s CurrentReport on Form 8-K filed on January 29, 2007
79
10.11 Form of Amended and Restated Severance Agreement for Executive Officers (Gary G.Winterhalter, Michael G. Spinozzi, John R. Golliher, W. Richard Dowd, Bennie L.Lowery, Raal H. Roos) effective as of October 3, 2008, which is incorporated herein byreference from Exhibit 10.1 to the Company’s Current Report on Form 8-K filed onOctober 6, 2008
10.12 Sally Beauty Holdings, Inc. Independent Director Compensation Policy*
10.13 Alberto-Culver Company 2003 Stock Option Plan for Non-Employee Directors, whichis incorporated herein by reference from Exhibit 10.17 to the Registration Statementon Form S-4 (File No. 333-144427) of Sally Holdings LLC and Sally Capital Inc. filedon July 9, 2007
10.14 Alberto-Culver Company 2003 Restricted Stock Plan, which is incorporated herein byreference from Exhibit 10.18 to the Registration Statement on Form S-4 (FileNo. 333-144427) of Sally Holdings LLC and Sally Capital Inc. filed on July 9, 2007
10.15 Sally Beauty Holdings, Inc. Annual Incentive Plan, which is incorporated herein byreference from Exhibit 10.1 to the Company’s Quarterly Report on Form 10-Q filed onMay 8, 2008
10.16 Sally Beauty Holdings, Inc. 2007 Omnibus Incentive Plan, which is incorporated hereinby reference from Exhibit 4.4 to the Company’s Registration Statement on Form S-8filed on May 3, 2007
10.17 Form of Stock Option Agreement for Independent Directors pursuant to the SallyBeauty Holdings, Inc. 2007 Omnibus Incentive Plan, which is incorporated herein byreference form Exhibit 10.1 to the Company’s Current Report on Form 8-K filed onApril 27, 2007
10.18 2007 Form of Stock Option Agreement for Employees pursuant to the Sally BeautyHoldings, Inc. 2007 Omnibus Incentive Plan, which is incorporated herein by referencefrom Exhibit 10.2 to the Company’s Current Report on Form 8-K filed April 27, 2007
10.19 2007 Form of Restricted Stock Unit Agreement for Independent Directors pursuant tothe Sally Beauty Holdings, Inc. 2007 Omnibus Incentive Plan, which is incorporatedherein by reference from Exhibit 10.3 to the Company’s Current Report on Form 8-Kfiled on April 27, 2007
10.20 2007 Form of Restricted Stock Agreement for Employees pursuant to the Sally BeautyHoldings, Inc. 2007 Omnibus Incentive Plan, which is incorporated herein by referenceform Exhibit 10.4 to the Company’s Current Report on Form 8-K filed on April 27,2007
10.21 2009 Form of Stock Option Agreement for Employees pursuant to the Sally BeautyHoldings, Inc. 2007 Omnibus Incentive Plan, which is incorporated herein by referencefrom Exhibit 10.23 to the Company’s Annual Report on Form 10-K filed onNovember 20, 2008
10.22 2009 Form of Restricted Stock Unit Agreement for Independent Directors pursuant tothe Sally Beauty Holdings, Inc. 2007 Omnibus Incentive Plan, which is incorporatedherein by reference from Exhibit 10.24 to the Company’s Annual Report onForm 10-K filed on November 20, 2008
80
10.23 2009 Form of Restricted Stock Agreement for Employees pursuant to the Sally BeautyHoldings, Inc. 2007 Omnibus Incentive Plan, which is incorporated herein by referencefrom Exhibit 10.25 to the Company’s Annual Report on Form 10-K filed onNovember 20, 2008
10.24 Tax Sharing Agreement, dated as of November 16, 2006, made and entered into by andamong Sally Beauty Holdings, Inc., Sally Investment Holdings LLC and SallyHoldings LLC, which is incorporated herein by reference from Exhibit 10.14 of theQuarterly Report on Form 10-Q of Sally Holdings LLC and Sally Capital Inc. filed onAugust 29, 2007
10.25 Release and Separation Agreement by and between Sally Beauty Holdings, Inc. andWalter Richard Dowd, which is incorporated herein by reference from Exhibit 10.2 tothe Company’s Quarterly Report on Form 10-Q filed on May 6, 2009
10.26 Form of Option Exercise Period Extension Agreement for Retired Executives, which isincorporated herein by reference from Exhibit 10.3 to the Company’s Quarterly Reporton Form 10-Q filed on May 6, 2009
10.27 Agreement and Plan of Merger by and among Beauty Systems Group LLC, Lady LynnEnterprises, Inc., Schoeneman Beauty Supply, Inc., the Shareholders and F. DaleSchoeneman, dated September 30, 2009*
10.28 Amendment and Restated Alberto-Culver Company Employee Stock Option Plan of2003*
10.29 2010 Form of Restricted Stock Unit Agreement for Independent Directors pursuant tothe Sally Beauty Holdings, Inc. 2007 Omnibus Incentive Plan*
10.30 2010 Form of Restricted Stock Agreement for Employees pursuant to the Sally BeautyHoldings, Inc. 2007 Omnibus Incentive Plan*
10.31 2010 Form of Stock Option Agreement for Employees pursuant to the Sally BeautyHoldings, Inc. 2007 Omnibus Incentive Plan*
10.32 2010 Form of Stock Option Agreement for Employees pursuant to the Alberto-CulverCompany Employee Stock Option Plan of 2003*
10.33 Form of Amended and Restated Indemnification Agreement with Directors*
21.1 List of Subsidiaries of Sally Beauty Holdings, Inc.*
23.1 Consent of KPMG*
31.1 Rule 13(a)-14(a)/15(d)-14(a) Certification of Gary G. Winterhalter*
31.2 Rule 13(a)-14(a)/15(d)-14(a) Certification of Mark J. Flaherty*
32.1 Section 1350 Certification of Gary G. Winterhalter*
32.2 Section 1350 Certification of Mark J. Flaherty*
* Included herewith
PLEASE NOTE: In reviewing the agreements included as exhibits to this Annual Report, pleaseremember they are included to provide you with information regarding their terms and are not intended toprovide any other factual or disclosure information about the Company or the other parties to theagreements. The agreements contain representations and warranties by each of the parties to the
81
applicable agreement. These representations and warranties have been made solely for the benefit of theother parties to the applicable agreement and:
• should not in all instances be treated as categorical statements of fact, but rather as a way ofallocating the risk to one of the parties if those statements prove to be inaccurate;
• have been qualified by disclosures that were made to the other party in connection with thenegotiation of the applicable agreement, which disclosures are not necessarily reflected in theagreement;
• may apply standards of materiality in a way that is different from what may be viewed as material toyou or other investors; and
• were made only as of the date of the applicable agreement or such other date or dates as may bespecified in the agreement and are subject to more recent developments.
Accordingly, these representations and warranties may not describe the actual state of affairs as of the datethey were made or at any other time. Additional information about the Company may be found elsewherein this filing and in the Company’s other public filings, which are available without charge through theSEC’s website at http://www.sec.gov. Please see ‘‘Where You Can Find More Information.’’
82
SIGNATURES
Pursuant to the requirements of Section 13 or 15(d) of the Securities Exchange Act of 1934, the registranthas duly caused this report to be signed on its behalf by the undersigned, thereunto duly authorized, on the19th day of November, 2009.
SALLY BEAUTY HOLDINGS, INC.
By: /s/ GARY G. WINTERHALTER
Gary G. WinterhalterPresident, Chief Executive Officer and Director
By: /s/ MARK J. FLAHERTY
Mark J. FlahertySenior Vice President and Chief Financial Officer
By: /s/ JANNA S. MINTON
Janna S. MintonVice President, Chief Accounting Officer andController
Pursuant to the requirements of the Securities Exchange Act of 1934, this report has been signed below bythe following persons on behalf of the registrant and in the capacities and on the dates indicated.
Signature Title Date
/s/ JAMES G. BERGES Chairman of the Board and Director November 19, 2009
James G. Berges
/s/ KATHLEEN J. AFFELDT Director November 19, 2009
Kathleen J. Affeldt
/s/ MARSHALL E. EISENBERG Director November 19, 2009
Marshall E. Eisenberg
/s/ KENNETH A. GIURICEO Director November 19, 2009
Kenneth A. Giuriceo
/s/ ROBERT R. MCMASTER Director November 19, 2009
Robert R. McMaster
/s/ WALTER METCALFE Director November 19, 2009
Walter Metcalfe
/s/ JOHN A. MILLER Director November 19, 2009
John A. Miller
/s/ MARTHA MILLER DE LOMBERA Director November 19, 2009
Martha Miller de Lombera
/s/ EDWARD W. RABIN Director November 19, 2009
Edward W. Rabin
/s/ RICHARD J. SCHNALL Director November 19, 2009Richard J. Schnall
83
SALLY BEAUTY HOLDINGS, INC. AND SUBSIDIARIES
Financial StatementsYears ended September 30, 2009, 2008 and 2007
INDEX TO FINANCIAL STATEMENTS
Page
Report of Independent Registered Public Accounting Firm . . . . . . . . . . . . . . . . . . . . . . . . . . . F-1Consolidated Financial Statements: F-3
Consolidated Balance Sheets as of September 30, 2009 and 2008 . . . . . . . . . . . . . . . . . . . . . . F-4Consolidated Statements of Earnings for the years ended September 30, 2009, 2008 and 2007 . F-5Consolidated Statements of Cash Flows for the years ended September 30, 2009, 2008 and
2007 . . . . . . . . . . . . . . . . . . . . . . . . . . . . . . . . . . . . . . . . . . . . . . . . . . . . . . . . . . . . . . . . F-6Consolidated Statements of Stockholders’ (Deficit) Equity for the years ended September 30,
2009, 2008 and 2007 . . . . . . . . . . . . . . . . . . . . . . . . . . . . . . . . . . . . . . . . . . . . . . . . . . . . F-7Notes to Consolidated Financial Statements for the years ended September 30, 2009, 2008 and
2007 . . . . . . . . . . . . . . . . . . . . . . . . . . . . . . . . . . . . . . . . . . . . . . . . . . . . . . . . . . . . . . . . . F-8
84
Report of Independent Registered Public Accounting Firm
The Board of Directors and StockholdersSally Beauty Holdings, Inc.:
We have audited Sally Beauty Holdings, Inc.’s internal control over financial reporting as of September 30,2009, based on criteria established in Internal Control—Integrated Framework issued by the Committee ofSponsoring Organizations of the Treadway Commission (COSO). Sally Beauty Holdings, Inc.’smanagement is responsible for maintaining effective internal control over financial reporting and for itsassessment of the effectiveness of internal control over financial reporting, included in the accompanyingManagement’s Annual Report on Internal Control over Financial Reporting. Our responsibility is toexpress an opinion on the Company’s internal control over financial reporting based on our audit.
We conducted our audit in accordance with the standards of the Public Company Accounting OversightBoard (United States). Those standards require that we plan and perform the audit to obtain reasonableassurance about whether effective internal control over financial reporting was maintained in all materialrespects. Our audit included obtaining an understanding of internal control over financial reporting,assessing the risk that a material weakness exists, and testing and evaluating the design and operatingeffectiveness of internal control based on the assessed risk. Our audit also included performing such otherprocedures as we considered necessary in the circumstances. We believe that our audit provides areasonable basis for our opinion.
A company’s internal control over financial reporting is a process designed to provide reasonableassurance regarding the reliability of financial reporting and the preparation of financial statements forexternal purposes in accordance with U.S. generally accepted accounting principles. A company’s internalcontrol over financial reporting includes those policies and procedures that (1) pertain to the maintenanceof records that, in reasonable detail, accurately and fairly reflect the transactions and dispositions of theassets of the company; (2) provide reasonable assurance that transactions are recorded as necessary topermit preparation of financial statements in accordance with U.S. generally accepted accountingprinciples, and that receipts and expenditures of the company are being made only in accordance withauthorizations of management and directors of the company; and (3) provide reasonable assuranceregarding prevention or timely detection of unauthorized acquisition, use, or disposition of the company’sassets that could have a material effect on the financial statements.
Because of its inherent limitations, internal control over financial reporting may not prevent or detectmisstatements. Also, projections of any evaluation of effectiveness to future periods are subject to the riskthat controls may become inadequate because of changes in conditions, or that the degree of compliancewith the policies or procedures may deteriorate.
In our opinion, Sally Beauty Holdings, Inc. maintained, in all material respects, effective internal controlover financial reporting as of September 30, 2009, based on criteria established in Internal Control—Integrated Framework issued by the Committee of Sponsoring Organizations of the Treadway Commission.
We also have audited, in accordance with the standards of the Public Company Accounting OversightBoard (United States), the consolidated balance sheets of Sally Beauty Holdings, Inc. (prior toNovember 16, 2006, Sally Holdings, Inc.) and subsidiaries as of September 30, 2009 and 2008, and therelated consolidated statements of earnings, cash flows and stockholders’ (deficit) equity for each of theyears in the three-year period ended September 30, 2009, and our report dated November 18, 2009expressed an unqualified opinion on those consolidated financial statements.
/s/ KPMG LLP
KPMG LLPDallas, TexasNovember 18, 2009
F-1
Report of Independent Registered Public Accounting Firm
The Board of Directors and StockholdersSally Beauty Holdings, Inc.:
We have audited the accompanying consolidated balance sheets of Sally Beauty Holdings, Inc. (theCompany) (prior to November 16, 2006, Sally Holdings, Inc.) and subsidiaries as of September 30, 2009and 2008, and the related consolidated statements of earnings, cash flows and stockholders’ (deficit) equityfor each of the years in the three-year period ended September 30, 2009. These consolidated financialstatements are the responsibility of the Company’s management. Our responsibility is to express anopinion on these consolidated financial statements based on our audits.
We conducted our audits in accordance with the standards of the Public Company Accounting OversightBoard (United States). Those standards require that we plan and perform the audit to obtain reasonableassurance about whether the financial statements are free of material misstatement. An audit includesexamining, on a test basis, evidence supporting the amounts and disclosures in the financial statements. Anaudit also includes assessing the accounting principles used and significant estimates made bymanagement, as well as evaluating the overall financial statement presentation. We believe that our auditsprovide a reasonable basis for our opinion.
In our opinion, the consolidated financial statements referred to above present fairly, in all materialrespects, the financial position of Sally Beauty Holdings, Inc. and subsidiaries as of September 30, 2009 and2008, and the results of their operations and their cash flows for each of the years in the three-year periodended September 30, 2009, in conformity with U.S. generally accepted accounting principles.
We also have audited, in accordance with the standards of the Public Company Accounting OversightBoard (United States), Sally Beauty Holdings, Inc.’s internal control over financial reporting as ofSeptember 30, 2009, based on criteria established in Internal Control—Integrated Framework issued by theCommittee of Sponsoring Organizations of the Treadway Commission (COSO), and our report datedNovember 18, 2009 expressed an unqualified opinion on the effectiveness of the Company’s internalcontrol over financial reporting.
/s/ KPMG LLP
KPMG LLPDallas, TexasNovember 18, 2009
F-2
Consolidated Financial Statements
The following consolidated balance sheets as of September 30, 2009 and 2008 and the related consolidatedstatements of earnings, cash flows and stockholders’ (deficit) equity for each of the fiscal years in thethree-year period ended September 30, 2009 are those of Sally Beauty Holdings, Inc. (prior toNovember 16, 2006, Sally Holdings, Inc.) and its consolidated subsidiaries. In November of 2006, SallyHoldings, Inc. was converted to a Delaware limited liability company, was renamed ‘‘Sally Holdings LLC’’and became an indirect wholly-owned subsidiary of Sally Beauty Holdings, Inc. in connection with ourseparation from the Alberto-Culver Company (‘‘Alberto-Culver’’). In these financial statements andelsewhere in this Annual Report on Form 10-K, we refer to these transactions as the SeparationTransactions. Sally Beauty Holdings, Inc. was formed on June 16, 2006 in connection with the separation ofour business from Alberto-Culver.
F-3
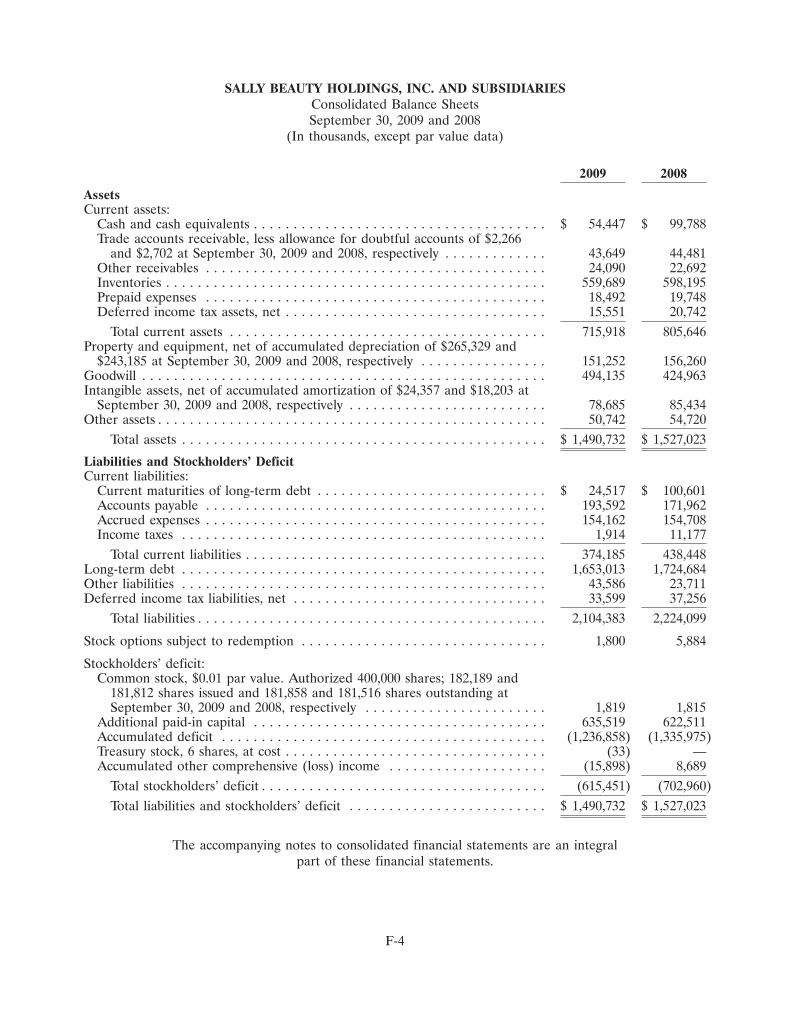
SALLY BEAUTY HOLDINGS, INC. AND SUBSIDIARIESConsolidated Balance SheetsSeptember 30, 2009 and 2008
(In thousands, except par value data)
2009 2008
AssetsCurrent assets:
Cash and cash equivalents . . . . . . . . . . . . . . . . . . . . . . . . . . . . . . . . . . . . . $ 54,447 $ 99,788Trade accounts receivable, less allowance for doubtful accounts of $2,266
and $2,702 at September 30, 2009 and 2008, respectively . . . . . . . . . . . . . 43,649 44,481Other receivables . . . . . . . . . . . . . . . . . . . . . . . . . . . . . . . . . . . . . . . . . . . 24,090 22,692Inventories . . . . . . . . . . . . . . . . . . . . . . . . . . . . . . . . . . . . . . . . . . . . . . . . 559,689 598,195Prepaid expenses . . . . . . . . . . . . . . . . . . . . . . . . . . . . . . . . . . . . . . . . . . . 18,492 19,748Deferred income tax assets, net . . . . . . . . . . . . . . . . . . . . . . . . . . . . . . . . . 15,551 20,742
Total current assets . . . . . . . . . . . . . . . . . . . . . . . . . . . . . . . . . . . . . . . . 715,918 805,646Property and equipment, net of accumulated depreciation of $265,329 and
$243,185 at September 30, 2009 and 2008, respectively . . . . . . . . . . . . . . . . 151,252 156,260Goodwill . . . . . . . . . . . . . . . . . . . . . . . . . . . . . . . . . . . . . . . . . . . . . . . . . . . 494,135 424,963Intangible assets, net of accumulated amortization of $24,357 and $18,203 at
September 30, 2009 and 2008, respectively . . . . . . . . . . . . . . . . . . . . . . . . . 78,685 85,434Other assets . . . . . . . . . . . . . . . . . . . . . . . . . . . . . . . . . . . . . . . . . . . . . . . . . 50,742 54,720
Total assets . . . . . . . . . . . . . . . . . . . . . . . . . . . . . . . . . . . . . . . . . . . . . . $ 1,490,732 $ 1,527,023
Liabilities and Stockholders’ DeficitCurrent liabilities:
Current maturities of long-term debt . . . . . . . . . . . . . . . . . . . . . . . . . . . . . $ 24,517 $ 100,601Accounts payable . . . . . . . . . . . . . . . . . . . . . . . . . . . . . . . . . . . . . . . . . . . 193,592 171,962Accrued expenses . . . . . . . . . . . . . . . . . . . . . . . . . . . . . . . . . . . . . . . . . . . 154,162 154,708Income taxes . . . . . . . . . . . . . . . . . . . . . . . . . . . . . . . . . . . . . . . . . . . . . . 1,914 11,177
Total current liabilities . . . . . . . . . . . . . . . . . . . . . . . . . . . . . . . . . . . . . . 374,185 438,448Long-term debt . . . . . . . . . . . . . . . . . . . . . . . . . . . . . . . . . . . . . . . . . . . . . . 1,653,013 1,724,684Other liabilities . . . . . . . . . . . . . . . . . . . . . . . . . . . . . . . . . . . . . . . . . . . . . . 43,586 23,711Deferred income tax liabilities, net . . . . . . . . . . . . . . . . . . . . . . . . . . . . . . . . 33,599 37,256
Total liabilities . . . . . . . . . . . . . . . . . . . . . . . . . . . . . . . . . . . . . . . . . . . . 2,104,383 2,224,099
Stock options subject to redemption . . . . . . . . . . . . . . . . . . . . . . . . . . . . . . . 1,800 5,884
Stockholders’ deficit:Common stock, $0.01 par value. Authorized 400,000 shares; 182,189 and
181,812 shares issued and 181,858 and 181,516 shares outstanding atSeptember 30, 2009 and 2008, respectively . . . . . . . . . . . . . . . . . . . . . . . 1,819 1,815
Additional paid-in capital . . . . . . . . . . . . . . . . . . . . . . . . . . . . . . . . . . . . . 635,519 622,511Accumulated deficit . . . . . . . . . . . . . . . . . . . . . . . . . . . . . . . . . . . . . . . . . (1,236,858) (1,335,975)Treasury stock, 6 shares, at cost . . . . . . . . . . . . . . . . . . . . . . . . . . . . . . . . . (33) —Accumulated other comprehensive (loss) income . . . . . . . . . . . . . . . . . . . . (15,898) 8,689
Total stockholders’ deficit . . . . . . . . . . . . . . . . . . . . . . . . . . . . . . . . . . . . (615,451) (702,960)Total liabilities and stockholders’ deficit . . . . . . . . . . . . . . . . . . . . . . . . . $ 1,490,732 $ 1,527,023
The accompanying notes to consolidated financial statements are an integralpart of these financial statements.
F-4
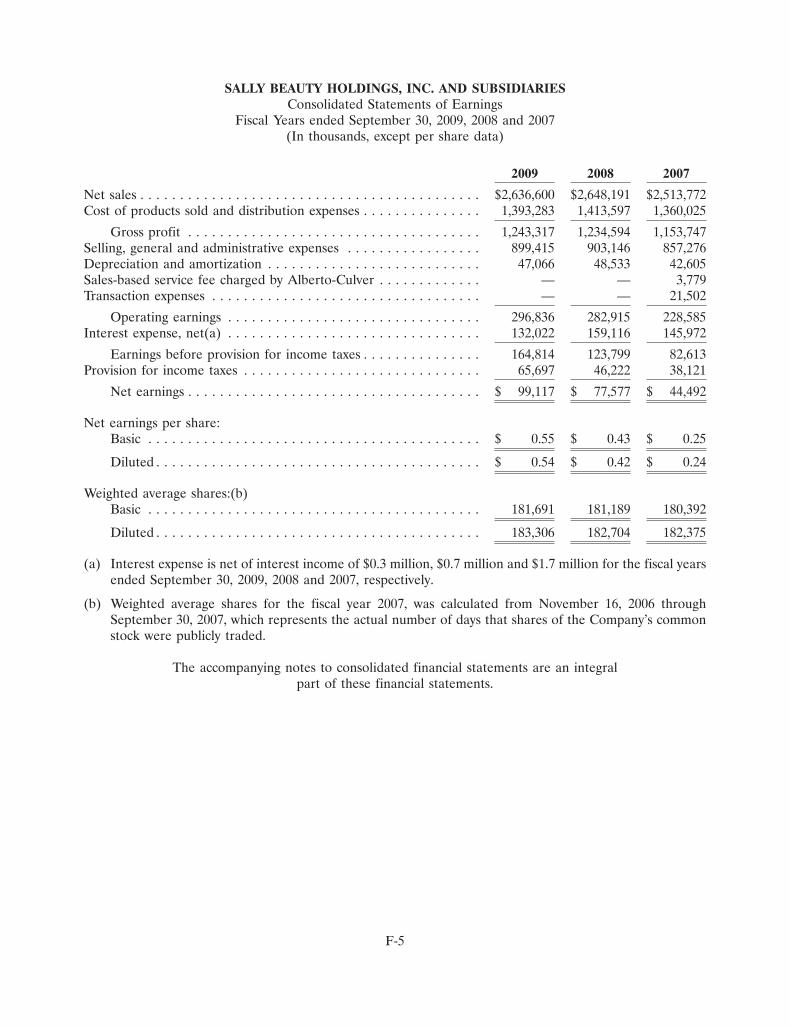
SALLY BEAUTY HOLDINGS, INC. AND SUBSIDIARIESConsolidated Statements of Earnings
Fiscal Years ended September 30, 2009, 2008 and 2007(In thousands, except per share data)
2009 2008 2007
Net sales . . . . . . . . . . . . . . . . . . . . . . . . . . . . . . . . . . . . . . . . . . . $2,636,600 $2,648,191 $2,513,772Cost of products sold and distribution expenses . . . . . . . . . . . . . . . 1,393,283 1,413,597 1,360,025
Gross profit . . . . . . . . . . . . . . . . . . . . . . . . . . . . . . . . . . . . . 1,243,317 1,234,594 1,153,747Selling, general and administrative expenses . . . . . . . . . . . . . . . . . 899,415 903,146 857,276Depreciation and amortization . . . . . . . . . . . . . . . . . . . . . . . . . . . 47,066 48,533 42,605Sales-based service fee charged by Alberto-Culver . . . . . . . . . . . . . — — 3,779Transaction expenses . . . . . . . . . . . . . . . . . . . . . . . . . . . . . . . . . . — — 21,502
Operating earnings . . . . . . . . . . . . . . . . . . . . . . . . . . . . . . . . 296,836 282,915 228,585Interest expense, net(a) . . . . . . . . . . . . . . . . . . . . . . . . . . . . . . . . 132,022 159,116 145,972
Earnings before provision for income taxes . . . . . . . . . . . . . . . 164,814 123,799 82,613Provision for income taxes . . . . . . . . . . . . . . . . . . . . . . . . . . . . . . 65,697 46,222 38,121
Net earnings . . . . . . . . . . . . . . . . . . . . . . . . . . . . . . . . . . . . . $ 99,117 $ 77,577 $ 44,492
Net earnings per share:Basic . . . . . . . . . . . . . . . . . . . . . . . . . . . . . . . . . . . . . . . . . . $ 0.55 $ 0.43 $ 0.25
Diluted . . . . . . . . . . . . . . . . . . . . . . . . . . . . . . . . . . . . . . . . . $ 0.54 $ 0.42 $ 0.24
Weighted average shares:(b)Basic . . . . . . . . . . . . . . . . . . . . . . . . . . . . . . . . . . . . . . . . . . 181,691 181,189 180,392
Diluted . . . . . . . . . . . . . . . . . . . . . . . . . . . . . . . . . . . . . . . . . 183,306 182,704 182,375
(a) Interest expense is net of interest income of $0.3 million, $0.7 million and $1.7 million for the fiscal yearsended September 30, 2009, 2008 and 2007, respectively.
(b) Weighted average shares for the fiscal year 2007, was calculated from November 16, 2006 throughSeptember 30, 2007, which represents the actual number of days that shares of the Company’s commonstock were publicly traded.
The accompanying notes to consolidated financial statements are an integralpart of these financial statements.
F-5
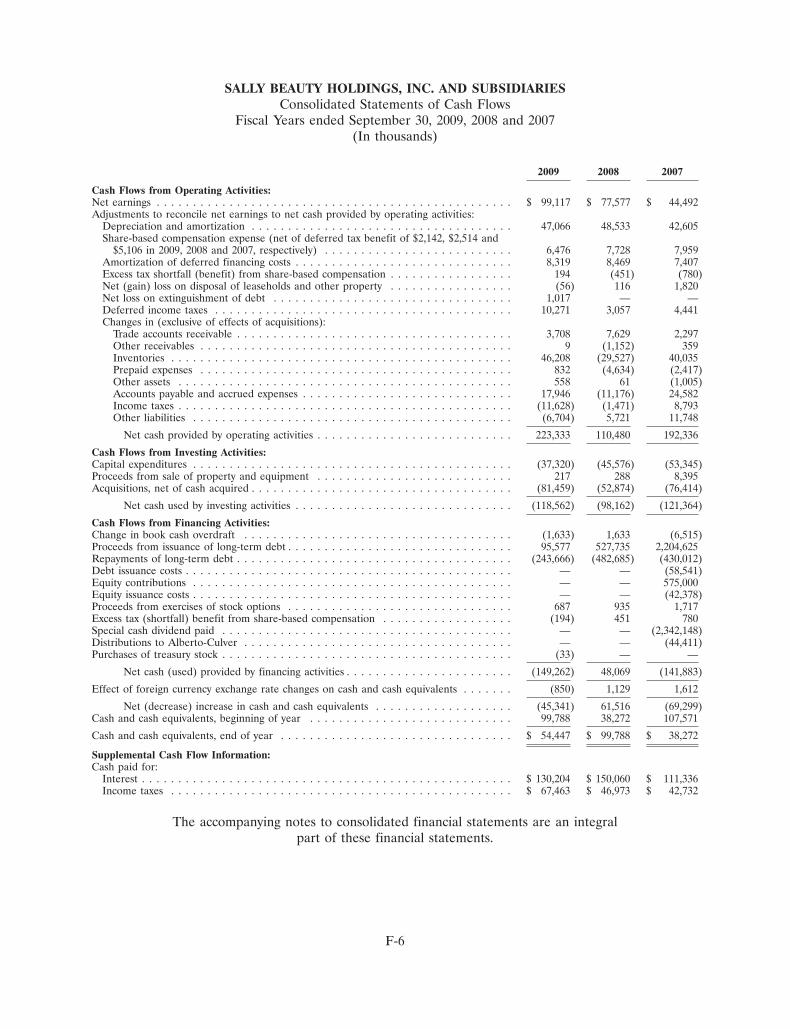
SALLY BEAUTY HOLDINGS, INC. AND SUBSIDIARIESConsolidated Statements of Cash Flows
Fiscal Years ended September 30, 2009, 2008 and 2007(In thousands)
2009 2008 2007
Cash Flows from Operating Activities:Net earnings . . . . . . . . . . . . . . . . . . . . . . . . . . . . . . . . . . . . . . . . . . . . . . . . . $ 99,117 $ 77,577 $ 44,492Adjustments to reconcile net earnings to net cash provided by operating activities:
Depreciation and amortization . . . . . . . . . . . . . . . . . . . . . . . . . . . . . . . . . . . . 47,066 48,533 42,605Share-based compensation expense (net of deferred tax benefit of $2,142, $2,514 and
$5,106 in 2009, 2008 and 2007, respectively) . . . . . . . . . . . . . . . . . . . . . . . . . . 6,476 7,728 7,959Amortization of deferred financing costs . . . . . . . . . . . . . . . . . . . . . . . . . . . . . . 8,319 8,469 7,407Excess tax shortfall (benefit) from share-based compensation . . . . . . . . . . . . . . . . . 194 (451) (780)Net (gain) loss on disposal of leaseholds and other property . . . . . . . . . . . . . . . . . (56) 116 1,820Net loss on extinguishment of debt . . . . . . . . . . . . . . . . . . . . . . . . . . . . . . . . . 1,017 — —Deferred income taxes . . . . . . . . . . . . . . . . . . . . . . . . . . . . . . . . . . . . . . . . . 10,271 3,057 4,441Changes in (exclusive of effects of acquisitions):
Trade accounts receivable . . . . . . . . . . . . . . . . . . . . . . . . . . . . . . . . . . . . . . 3,708 7,629 2,297Other receivables . . . . . . . . . . . . . . . . . . . . . . . . . . . . . . . . . . . . . . . . . . . 9 (1,152) 359Inventories . . . . . . . . . . . . . . . . . . . . . . . . . . . . . . . . . . . . . . . . . . . . . . . 46,208 (29,527) 40,035Prepaid expenses . . . . . . . . . . . . . . . . . . . . . . . . . . . . . . . . . . . . . . . . . . . 832 (4,634) (2,417)Other assets . . . . . . . . . . . . . . . . . . . . . . . . . . . . . . . . . . . . . . . . . . . . . . 558 61 (1,005)Accounts payable and accrued expenses . . . . . . . . . . . . . . . . . . . . . . . . . . . . . 17,946 (11,176) 24,582Income taxes . . . . . . . . . . . . . . . . . . . . . . . . . . . . . . . . . . . . . . . . . . . . . . (11,628) (1,471) 8,793Other liabilities . . . . . . . . . . . . . . . . . . . . . . . . . . . . . . . . . . . . . . . . . . . . (6,704) 5,721 11,748
Net cash provided by operating activities . . . . . . . . . . . . . . . . . . . . . . . . . . . 223,333 110,480 192,336
Cash Flows from Investing Activities:Capital expenditures . . . . . . . . . . . . . . . . . . . . . . . . . . . . . . . . . . . . . . . . . . . . (37,320) (45,576) (53,345)Proceeds from sale of property and equipment . . . . . . . . . . . . . . . . . . . . . . . . . . . 217 288 8,395Acquisitions, net of cash acquired . . . . . . . . . . . . . . . . . . . . . . . . . . . . . . . . . . . . (81,459) (52,874) (76,414)
Net cash used by investing activities . . . . . . . . . . . . . . . . . . . . . . . . . . . . . . (118,562) (98,162) (121,364)
Cash Flows from Financing Activities:Change in book cash overdraft . . . . . . . . . . . . . . . . . . . . . . . . . . . . . . . . . . . . . (1,633) 1,633 (6,515)Proceeds from issuance of long-term debt . . . . . . . . . . . . . . . . . . . . . . . . . . . . . . . 95,577 527,735 2,204,625Repayments of long-term debt . . . . . . . . . . . . . . . . . . . . . . . . . . . . . . . . . . . . . . (243,666) (482,685) (430,012)Debt issuance costs . . . . . . . . . . . . . . . . . . . . . . . . . . . . . . . . . . . . . . . . . . . . . — — (58,541)Equity contributions . . . . . . . . . . . . . . . . . . . . . . . . . . . . . . . . . . . . . . . . . . . . — — 575,000Equity issuance costs . . . . . . . . . . . . . . . . . . . . . . . . . . . . . . . . . . . . . . . . . . . . — — (42,378)Proceeds from exercises of stock options . . . . . . . . . . . . . . . . . . . . . . . . . . . . . . . 687 935 1,717Excess tax (shortfall) benefit from share-based compensation . . . . . . . . . . . . . . . . . . (194) 451 780Special cash dividend paid . . . . . . . . . . . . . . . . . . . . . . . . . . . . . . . . . . . . . . . . — — (2,342,148)Distributions to Alberto-Culver . . . . . . . . . . . . . . . . . . . . . . . . . . . . . . . . . . . . . — — (44,411)Purchases of treasury stock . . . . . . . . . . . . . . . . . . . . . . . . . . . . . . . . . . . . . . . . (33) — —
Net cash (used) provided by financing activities . . . . . . . . . . . . . . . . . . . . . . . (149,262) 48,069 (141,883)
Effect of foreign currency exchange rate changes on cash and cash equivalents . . . . . . . (850) 1,129 1,612
Net (decrease) increase in cash and cash equivalents . . . . . . . . . . . . . . . . . . . (45,341) 61,516 (69,299)Cash and cash equivalents, beginning of year . . . . . . . . . . . . . . . . . . . . . . . . . . . . 99,788 38,272 107,571
Cash and cash equivalents, end of year . . . . . . . . . . . . . . . . . . . . . . . . . . . . . . . . $ 54,447 $ 99,788 $ 38,272
Supplemental Cash Flow Information:Cash paid for:
Interest . . . . . . . . . . . . . . . . . . . . . . . . . . . . . . . . . . . . . . . . . . . . . . . . . . . $ 130,204 $ 150,060 $ 111,336Income taxes . . . . . . . . . . . . . . . . . . . . . . . . . . . . . . . . . . . . . . . . . . . . . . . $ 67,463 $ 46,973 $ 42,732
The accompanying notes to consolidated financial statements are an integralpart of these financial statements.
F-6
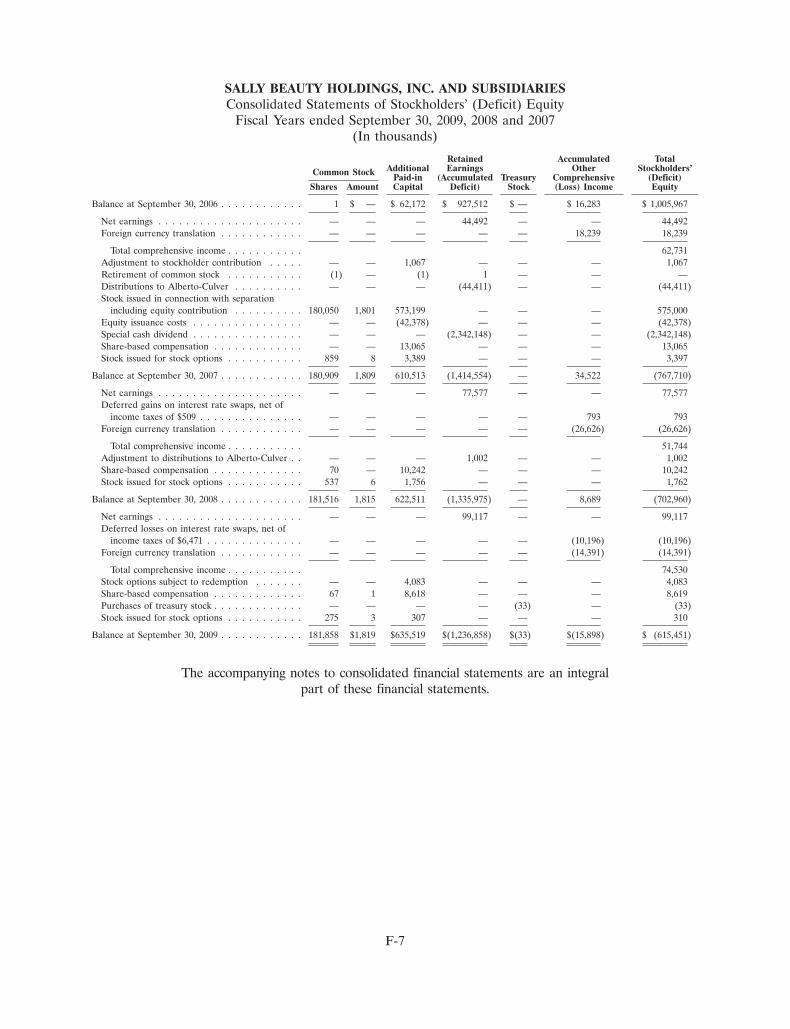
SALLY BEAUTY HOLDINGS, INC. AND SUBSIDIARIESConsolidated Statements of Stockholders’ (Deficit) Equity
Fiscal Years ended September 30, 2009, 2008 and 2007(In thousands)
Retained Accumulated TotalAdditional Earnings Other Stockholders’Common Stock Paid-in (Accumulated Treasury Comprehensive (Deficit)
Shares Amount Capital Deficit) Stock (Loss) Income Equity
Balance at September 30, 2006 . . . . . . . . . . . . 1 $ — $ 62,172 $ 927,512 $ — $ 16,283 $ 1,005,967
Net earnings . . . . . . . . . . . . . . . . . . . . . — — — 44,492 — — 44,492Foreign currency translation . . . . . . . . . . . . — — — — — 18,239 18,239
Total comprehensive income . . . . . . . . . . . 62,731Adjustment to stockholder contribution . . . . . — — 1,067 — — — 1,067Retirement of common stock . . . . . . . . . . . (1) — (1) 1 — — —Distributions to Alberto-Culver . . . . . . . . . . — — — (44,411) — — (44,411)Stock issued in connection with separation
including equity contribution . . . . . . . . . . 180,050 1,801 573,199 — — — 575,000Equity issuance costs . . . . . . . . . . . . . . . . — — (42,378) — — — (42,378)Special cash dividend . . . . . . . . . . . . . . . . — — — (2,342,148) — — (2,342,148)Share-based compensation . . . . . . . . . . . . . — — 13,065 — — — 13,065Stock issued for stock options . . . . . . . . . . . 859 8 3,389 — — — 3,397
Balance at September 30, 2007 . . . . . . . . . . . . 180,909 1,809 610,513 (1,414,554) — 34,522 (767,710)
Net earnings . . . . . . . . . . . . . . . . . . . . . — — — 77,577 — — 77,577Deferred gains on interest rate swaps, net of
income taxes of $509 . . . . . . . . . . . . . . . — — — — — 793 793Foreign currency translation . . . . . . . . . . . . — — — — — (26,626) (26,626)
Total comprehensive income . . . . . . . . . . . 51,744Adjustment to distributions to Alberto-Culver . . — — — 1,002 — — 1,002Share-based compensation . . . . . . . . . . . . . 70 — 10,242 — — — 10,242Stock issued for stock options . . . . . . . . . . . 537 6 1,756 — — — 1,762
Balance at September 30, 2008 . . . . . . . . . . . . 181,516 1,815 622,511 (1,335,975) — 8,689 (702,960)
Net earnings . . . . . . . . . . . . . . . . . . . . . — — — 99,117 — — 99,117Deferred losses on interest rate swaps, net of
income taxes of $6,471 . . . . . . . . . . . . . . — — — — — (10,196) (10,196)Foreign currency translation . . . . . . . . . . . . — — — — — (14,391) (14,391)
Total comprehensive income . . . . . . . . . . . 74,530Stock options subject to redemption . . . . . . . — — 4,083 — — — 4,083Share-based compensation . . . . . . . . . . . . . 67 1 8,618 — — — 8,619Purchases of treasury stock . . . . . . . . . . . . . — — — — (33) — (33)Stock issued for stock options . . . . . . . . . . . 275 3 307 — — — 310
Balance at September 30, 2009 . . . . . . . . . . . . 181,858 $1,819 $635,519 $(1,236,858) $(33) $(15,898) $ (615,451)
The accompanying notes to consolidated financial statements are an integralpart of these financial statements.
F-7
Sally Beauty Holdings, Inc. and Subsidiaries
Notes to Consolidated Financial Statements
1. Description of Business and Basis of Presentation
Description of Business
Sally Beauty Holdings, Inc. and its consolidated subsidiaries (‘‘Sally Beauty’’ or ‘‘the Company’’) sellprofessional beauty supplies, primarily through its Sally Beauty Supply retail stores, in the U.S., PuertoRico, Belgium, Canada, Chile, Mexico, the United Kingdom and certain other countries in Europe.Additionally, the Company distributes professional beauty products to salons and professionalcosmetologists through its Beauty Systems Group (‘‘BSG’’) store operations and a commissioned directsales force that calls on salons primarily in the U.S., Puerto Rico, Canada, the United Kingdom and certainother countries in Europe, and to franchises in the southern and southwestern U.S. and in Mexico throughthe operations of its subsidiary Armstrong McCall, L.P. (‘‘Armstrong McCall’’). Certain beauty productssold by BSG and Armstrong McCall are sold through exclusive territory agreements with themanufacturers of the products.
In November 2006, the stockholders of Alberto-Culver approved a plan to separate its consumer productsbusiness and its Sally Beauty Supply/BSG distribution business into two separate, publicly-tradedcompanies. As more fully discussed in Note 3, the separation was completed on November 16, 2006 (the‘‘Separation Transactions’’) and was effected pursuant to an investment agreement dated as of June 19,2006 (the ‘‘Investment Agreement’’) among Alberto-Culver and certain of its subsidiaries, including SallyHoldings, Inc. (‘‘Sally Holdings’’) and CDRS Acquisition LLC (‘‘CDRS’’). Sally Holdings was a wholly-owned subsidiary of Alberto-Culver until November 16, 2006, when it was converted to a Delaware limitedliability company, was renamed ‘‘Sally Holdings LLC,’’ and became an indirect wholly-owned subsidiary ofSally Beauty. Sally Beauty was formed on June 16, 2006, and became the accounting successor company toSally Holdings, Inc. upon the completion of the Separation Transactions.
Basis of Presentation
The consolidated financial statements included herein have been prepared in accordance with accountingprinciples generally accepted in the United States of America (‘‘GAAP’’). The consolidated financialstatements of our business prior to November 16, 2006 have been prepared from financial statements andaccounting records maintained by Alberto-Culver and reflect assumptions and allocations made byAlberto-Culver. The historical consolidated financial statements may not necessarily be indicative of thefinancial position that would have existed or the results of operations or cash flows that would haveresulted if the Company had been operated as an unaffiliated entity.
All references in these notes to ‘‘management’’ are to the management of Sally Beauty. All references inthese notes to ‘‘the Company’’ are to Sally Beauty and, prior to November 16, 2006, to Sally Holdings, Inc.
2. Significant Accounting Policies
The preparation of financial statements in conformity with GAAP requires us to interpret and applyaccounting standards and to develop and follow accounting policies consistent with such standards. Thefollowing is a summary of the significant accounting policies used in preparing the Company’s consolidatedfinancial statements.
Principles of Consolidation
These consolidated financial statements include the Company and its subsidiaries. All significantintercompany accounts and transactions have been eliminated in the consolidated financial statements.
F-8
Sally Beauty Holdings, Inc. and Subsidiaries
Notes to Consolidated Financial Statements (Continued)
Reclassifications
Certain amounts for prior periods have been reclassified to conform to the current year’s presentation.
Use of Estimates
The preparation of financial statements in conformity with GAAP requires management to make estimatesand assumptions that affect the reported amounts of assets, liabilities, revenues and expenses anddisclosure of contingent assets and liabilities in the financial statements. The level of uncertainty inestimates and assumptions increases with the length of time until the underlying transactions arecompleted. Actual results may differ from these estimates in amounts that may be material to the financialstatements. Management believes that the estimates and assumptions used are reasonable.
Cash and Cash Equivalents
All highly liquid investments purchased by the Company from time to time which have an original maturityof three months or less are considered to be cash equivalents. These investments are stated at cost, whichapproximates market value. Also included in cash equivalents are proceeds due from customer credit anddebit card transactions, which generally settle within two to five days, and were approximately $7.2 millionand $6.8 million at September 30, 2009 and 2008, respectively.
Fair Value of Financial Instruments
The Company’s financial instruments consist of cash and cash equivalents, trade and other accountsreceivable, accounts payable, interest rate swap agreements and long-term borrowings.
The carrying amounts of cash and cash equivalents, trade and other accounts receivable and accountspayable approximate fair value due to the short-term nature of these financial instruments.
The aggregate fair value of all interest rate swap agreements held at September 30, 2009 was a liability of$17.7 million, consisting of $2.3 million included in accrued expenses and $15.4 million included in otherliabilities. The aggregate fair value of all interest rate swap agreements held at September 30, 2008 was anet liability of $6.4 million, consisting of $0.5 million included in accrued expenses, $7.2 million included inother liabilities and $1.3 million included in other assets. Fair value amounts reported for the swapagreements are based on third-party information and were determined using proprietary models basedupon well-recognized financial principles and reasonable estimates about relevant future marketconditions. Please see Recent Accounting Pronouncements below.
The fair value of the Company’s long-term borrowings was approximately $1,655.1 million and$1,676.1 million at September 30, 2009 and 2008. The fair values of the Company’s long-term borrowingsare based on quoted market prices where available or, if not available, based on discounted future cashflows using current market interest rates.
Derivative Instruments and Hedging Activities
The Company utilizes interest rate swap agreements to manage its cash flow exposure associated withchanging interest rates in connection with its term loan obligations and accounts for them in accordancewith the Financial Accounting Standards Board (‘‘FASB’’) Accounting Standards Codification (‘‘ASC’’)815, Derivatives and Hedging (‘‘ASC 815’’). The Company does not purchase or hold any derivativeinstruments for speculative or trading purposes. Certain interest rate swap agreements owned by theCompany at September 30, 2009 are designated as effective cash flow hedges and adjustments to reflectthe change in their fair values, which are adjusted quarterly, are recorded, net of income tax, in
F-9
Sally Beauty Holdings, Inc. and Subsidiaries
Notes to Consolidated Financial Statements (Continued)
accumulated other comprehensive income until the hedged obligation is settled or the swap agreementsexpire, whichever is earlier. Any hedge ineffectiveness, as this term is used in ASC 815, is recognized in netinterest expense in the consolidated statements of earnings. Certain other interest rate swap agreementsowned by the Company at September 30, 2009 are not designated as hedges and, accordingly, adjustmentsto reflect changes in their fair values, which are adjusted quarterly, are recorded in net interest expense.
Concentration of Credit Risk
Financial instruments that potentially expose the Company to concentration of credit risk consist primarilyof investments in cash equivalents and accounts receivable. The Company invests from time to time insecurities of financial institutions with high-credit quality. Accounts receivable are generally diversified dueto the high number of entities comprising the Company’s customer base and their dispersion across diversegeographical regions. The Company believes no significant concentration of credit risk exists with respectto its investments in cash equivalents and its accounts receivable.
Trade Accounts Receivable and Allowance for Doubtful Accounts
Trade accounts receivable are recorded at the values invoiced to customers and do not bear interest. Tradeaccounts receivable are stated net of the allowance for doubtful accounts. The allowance for doubtfulaccounts requires management to estimate future amounts of receivables to be collected. Managementrecords allowances for doubtful accounts based on historical collection data and current customerinformation. Account balances are charged against the allowance after all means of collection have beenexhausted and the potential for recovery is considered remote.
In the consolidated statements of earnings, bad debt expense is included in selling, general andadministrative expenses. The Company’s exposure to credit risk with respect to trade receivables ismitigated by the Company’s broad customer base and their dispersion across diverse geographical regions.
Other Receivables
Other receivables consist primarily of amounts expected to be received from vendors under variouscontractual agreements. Other receivables are recorded at the amount management estimates will becollected.
Inventories
Inventories consist primarily of beauty supplies and related accessories and salon equipment for sale in thenormal course of our business and are stated at the lower of cost, determined using the first-in, first-out(FIFO) method, or market (net realizable value). When necessary, the Company adjusts the carrying valueof inventories to the lower of cost or market, including costs to sell or dispose, and for estimated inventoryshrinkage. Estimates of the future demand for the Company’s products, age of the inventory and changesin stock keeping units (‘‘SKUs’’) are some of the key factors used by management in assessing the netrealizable value of inventories. The Company estimates inventory shrinkage based on historical experience.Inventory shrinkage averaged approximately 1.0% of consolidated net sales in fiscal years 2009, 2008 and2007.
Property and Equipment
Property and equipment are stated at cost less accumulated depreciation. Depreciation is calculated usingthe straight-line method based on estimated useful lives of the respective classes of assets and is reflectedin depreciation and amortization expense in the consolidated statements of earnings. Buildings and
F-10
Sally Beauty Holdings, Inc. and Subsidiaries
Notes to Consolidated Financial Statements (Continued)
building improvements are depreciated over periods ranging from five to 40 years. Leaseholdimprovements are amortized over the lesser of the estimated useful lives of the assets or the term of therelated lease, including renewals determined to be reasonably assured. Furniture, fixtures and equipmentare depreciated over periods ranging from three to ten years. Expenditures for maintenance and repairsare expensed as incurred while expenditures for major renewals and improvements are capitalized. Uponthe disposition of property and equipment, the cost and related accumulated depreciation are removedfrom the accounts.
Lease Accounting
The Company’s lease agreements for office space, retail stores and warehouse/distribution facilities areaccounted for as operating leases. Rent expense (including any rent abatements or escalation charges) isrecognized on a straight-line basis from the date the Company takes possession of the property to beginpreparation of the site for occupancy to the end of the lease term, including renewal options determined tobe reasonably assured. Certain leases provide for contingent rents that are determined as a percentage ofrevenues in excess of specified levels. The Company records a contingent rent liability along with thecorresponding rent expense when specified levels have been achieved or when management determinesthat achieving the specified levels during the fiscal year is probable.
Certain lease agreements to which the Company is a party provide for tenant improvement allowances.Such allowances are recorded as deferred lease credits, included in accrued expenses and other liabilities,as appropriate, on the balance sheet and amortized on a straight-line basis over the lease term (includingrenewal options determined to be reasonably assured) as a reduction of rent expense; which is generallyconsistent with the amortization period used for the constructed leasehold improvement asset.
Valuation of Long-Lived Assets
Long-lived assets, such as property and equipment and purchased intangibles subject to depreciation oramortization, are reviewed for impairment annually, and whenever events or changes in circumstancesindicate that the carrying amount of an asset may not be recoverable. Recoverability of long-lived assets ismeasured by a comparison of the carrying amount of an asset to estimated future cash flows expected to begenerated by the asset. If the carrying amount of an asset exceeds its estimated future cash flows, animpairment charge is recognized by the amount by which the carrying amount of the asset exceeds the fairvalue of the asset. There were no significant impairments in the current or prior fiscal years presented inthe accompanying financial statements.
Goodwill and Other Intangibles
Goodwill is the cost of an acquisition less the fair value of the net assets of the acquired business. Goodwillis reviewed for impairment at least annually, and whenever events or changes in circumstances indicate it ismore likely than not that the fair value of a reporting unit is less than its carrying amount, in accordancewith ASC 350. Management considers whether there has been a permanent impairment to the value ofgoodwill and other intangibles by evaluating if various factors, including current operating results,anticipated future results and cash flows, and market and economic conditions, indicate possibleimpairment. Based on the annual reviews performed, after taking into account the recent economicdownturn in certain geographies in which we operate, there was no impairment in the current or priorfiscal years presented.
Other intangibles with indefinite lives include trade names and certain distribution rights. Other intangibleassets subject to amortization include customer relationships, certain distribution rights and
F-11
Sally Beauty Holdings, Inc. and Subsidiaries
Notes to Consolidated Financial Statements (Continued)
non-competition agreements, and are amortized over periods of one to twelve years. The weighted averageamortization period is approximately six years.
Deferred Financing Costs
Expenses incurred with the issuance of long-term debt are capitalized and amortized over the life of therelated debt agreements on a straight line-basis or by using the effective interest method. These capitalizedexpenses are recorded on the consolidated balance sheet as other assets.
Insurance/Self-Insurance Programs
The Company retains a substantial portion of the risk related to certain of its workers’ compensation,general and auto liability and property damage insurable loss exposure. Predetermined loss limits havebeen arranged with insurance companies to limit the Company’s exposure per occurrence and aggregatecash outlay. Certain of our employees and their dependents are also covered by a self-insurance programfor healthcare benefit purposes, up to a certain maximum lifetime limit. Currently these self-insurancecosts, less amounts recovered through payroll deductions and certain out-of-pocket amounts in connectionwith the employee healthcare program, are funded by the Company. The Company maintains an annualstop-loss insurance policy for the healthcare benefits plan.
The Company records an estimated liability for the ultimate cost of claims incurred and unpaid as of thebalance sheet date, which includes both claims filed and estimated losses incurred but not yet reported.The Company estimates the ultimate cost based on an analysis of historical data and actuarial estimates.Workers’ compensation, general and auto liability and property damage insurable loss liabilities arerecorded at the estimate of their net present value, while healthcare plan liabilities are not discounted.These estimates are reviewed on a regular basis to ensure that the recorded liability is adequate. TheCompany believes the amounts accrued at September 30, 2009 and 2008 are adequate, although actuallosses may differ from the amounts provided.
Advertising Costs
Advertising costs relate mainly to print, radio and television advertisements and trade shows. Advertisingcosts incurred in connection with print, radio and television advertisements are expensed the first time theadvertisement is run. Other advertising costs are expensed when incurred. Advertising costs wereapproximately $55.2 million; $50.6 million and $49.2 million in the fiscal years ended September 30, 2009,2008 and 2007, respectively, and are included in selling, general and administrative expenses in theCompany’s consolidated statements of earnings.
Vendor Rebates and Concessions
The Company accounts for cash consideration received from vendors under ASC 605-50, CustomerPayments and Incentives. This accounting standard states that cash consideration received by a customer ispresumed to be a reduction of the cost of sales unless it is for an asset or service or a reimbursement of aspecific, incremental, identifiable cost incurred by the customer in selling the vendor’s products. Themajority of cash consideration received by the Company is considered to be a reduction of the cost of salesand is allocated to cost of products sold and distribution expenses as the related inventory is sold.
Income Taxes
The Company accounts for income taxes in accordance with ASC 740, Income Taxes (‘‘ASC 740’’). UnderASC 740, deferred income taxes are recognized for the estimated future tax consequences attributable to
F-12
Sally Beauty Holdings, Inc. and Subsidiaries
Notes to Consolidated Financial Statements (Continued)
temporary differences between the financial statement carrying amounts of existing assets and liabilitiesand their respective tax bases. Deferred tax assets and liabilities are measured using enacted tax ratesexpected to apply to taxable income in the years in which temporary differences are estimated to berecovered or settled. The effect on deferred taxes of a change in tax rates is recognized in the consolidatedstatements of earnings in the period of enactment. A valuation allowance is recorded to reduce thecarrying amounts of deferred tax assets to the amount expected to be realized unless it ismore-likely-than-not that such assets will be realized in full. The estimated tax benefit of an uncertain taxposition is recorded in our financial statements only after determining a more-likely-than-not probabilitythat the uncertain tax position will withstand challenge, if any, from applicable taxing authorities.
Effective October 1, 2007, the Company adopted the provisions of ASC 740-10-25, Income Taxes—Recognition, an interpretative amendment of ASC 740. The adoption of this amendment did not require achange to the Company’s liability for unrecognized tax benefits and had no impact on the Company’sopening balance of accumulated deficit. Please see Note 16 for additional information.
Foreign Currency
The functional currency of each of the Company’s foreign operations is generally the respective localcurrency. Balance sheet accounts are translated into U.S. dollars at the rates of exchange in effect at thebalance sheet date, while the results of operations are translated using the average exchange rates duringthe period presented. The resulting translation adjustments are recorded as a component of accumulatedother comprehensive income within stockholders’ (deficit) equity. Foreign currency transaction gains orlosses are included in the consolidated statements of earnings when incurred and were not significant inany of the periods presented in the accompanying financial statements.
Net Earnings per Share
Basic net earnings per share is calculated by dividing net earnings by the weighted average number ofshares of common stock outstanding during the period. For the fiscal year 2007, the weighted averageshares were calculated from November 16, 2006 through September 30, 2007, which represents the actualnumber of days that shares of the Company’s common stock were publicly traded. Diluted net earnings pershare is calculated similarly but includes potential dilution from the exercise of stock options and stockawards, except when the effect would be anti-dilutive.
Revenue Recognition
The Company recognizes revenue when a customer consummates a point of sale transaction in a store.The cost of sales incentive programs, such as customer and consumer coupons, are recognized as areduction of revenue at the time of sale. Taxes collected from customers and remitted to governmentalauthorities are recorded on a net basis and are excluded from revenue. The Company also recognizesrevenue on merchandise shipped to customers when title and risk of loss pass to the customer. Appropriateprovisions for sales returns and cash discounts are made at the time the sales are recorded. Sales returnsand allowances averaged approximately 2.2% of net sales over each of the past three fiscal years.
Cost of Products Sold and Distribution Expenses
Cost of products sold and distribution expenses include actual product costs, the cost of transportation tothe Company’s distribution centers and certain shipping and handling costs, such as freight from thedistribution centers to the stores and handling costs incurred at the distribution centers. All other shippingand handling costs are included in selling, general and administrative expenses.
F-13
Sally Beauty Holdings, Inc. and Subsidiaries
Notes to Consolidated Financial Statements (Continued)
Shipping and Handling
Shipping and handling costs related to freight and distribution expenses for delivery to customers areincluded in selling, general and administrative expenses in the consolidated statements of earnings andamounted to $30.3 million, $35.8 million and $38.3 million for the fiscal years 2009, 2008 and 2007,respectively.
Share-Based Compensation
The Company accounts for stock option and stock awards, which include share-based payment plans inaccordance with ASC 718, Compensation—Stock Compensation. Accordingly, the Company measures thecost of employee services received in exchange for an award of equity instruments based on the grant-datefair value of the award and recognizes compensation expense on a straight-line basis over the vestingperiod or to the date a participant becomes eligible for retirement, if earlier.
Securities and Exchange Commission (‘‘SEC’’) Staff Accounting Bulletin No. 107, Share-Based Payment,requires public companies to apply the rules of Accounting Series Release No. 268 (‘‘ASR 268’’),Presentation in Financial Statements of Redeemable Preferred Stocks, to stock options with contingent cashsettlement provisions. ASR 268 requires securities with contingent cash settlement provisions, which arenot solely in the control of the issuer, without regard to probability of occurrence, to be classified outsideof stockholders’ equity. Prior to November 16, 2006, the Company was a subsidiary of Alberto-Culver andhad no share-based compensation plans of its own. Prior to the Company’s separation from Alberto-Culver, Alberto-Culver granted stock options to Company employees with a contingent cash settlementprovision upon the occurrence of certain change in control events, pursuant to its stock option plans. Assuch, the contingent cash settlement of the stock options as a result of such event would not be solely in thecontrol of the Company. In accordance with ASR 268, the Company reported $1.8 million and $5.9 millionin ‘‘Stock options subject to redemption’’ outside of accumulated stockholders’ (deficit) equity on itsconsolidated balance sheet as of September 30, 2009 and 2008, respectively, and this amount will bereclassified back into additional paid-in capital in future periods as the related stock options are exercisedor canceled or otherwise terminated.
Comprehensive Income
Comprehensive income reflects changes in accumulated stockholders’ (deficit) equity from sources otherthan transactions with stockholders and, as such, includes net earnings and certain other specifiedcomponents. The Company’s only components of comprehensive income, other than net earnings, are thecumulative foreign currency translation adjustments and deferred gains (losses) on certain interest rateswap agreements, net of income tax.
F-14
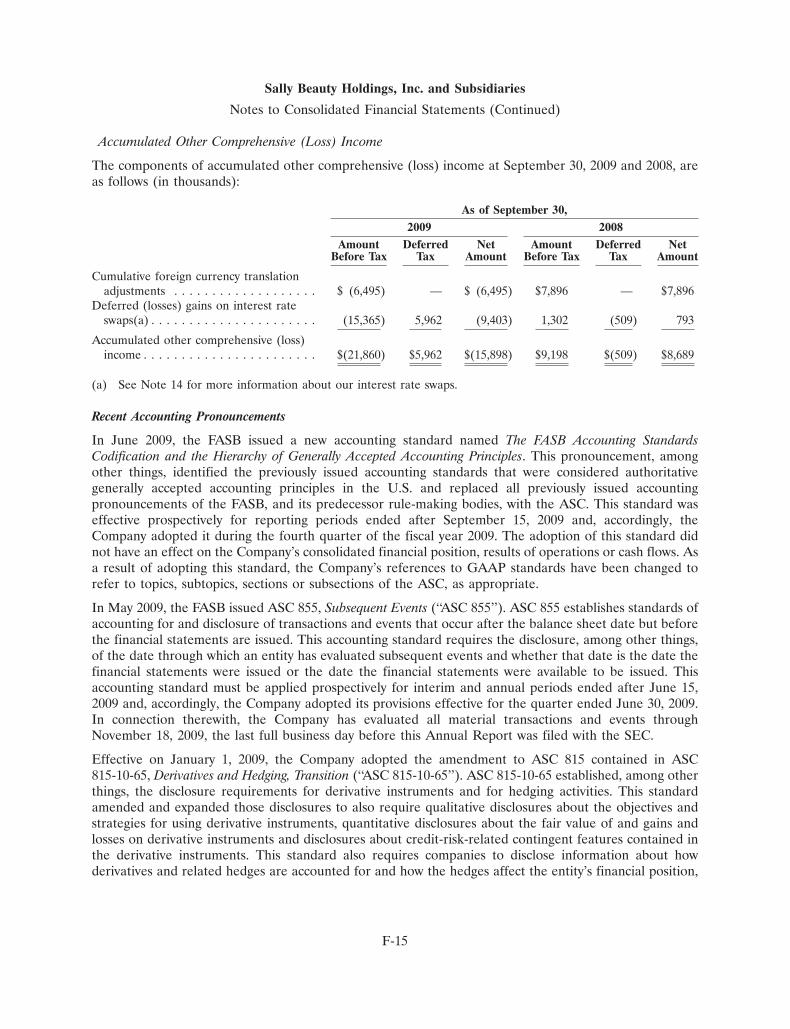
Sally Beauty Holdings, Inc. and Subsidiaries
Notes to Consolidated Financial Statements (Continued)
Accumulated Other Comprehensive (Loss) Income
The components of accumulated other comprehensive (loss) income at September 30, 2009 and 2008, areas follows (in thousands):
As of September 30,2009 2008
Amount Deferred Net Amount Deferred NetBefore Tax Tax Amount Before Tax Tax Amount
Cumulative foreign currency translationadjustments . . . . . . . . . . . . . . . . . . . $ (6,495) — $ (6,495) $7,896 — $7,896
Deferred (losses) gains on interest rateswaps(a) . . . . . . . . . . . . . . . . . . . . . . (15,365) 5,962 (9,403) 1,302 (509) 793
Accumulated other comprehensive (loss)income . . . . . . . . . . . . . . . . . . . . . . . $(21,860) $5,962 $(15,898) $9,198 $(509) $8,689
(a) See Note 14 for more information about our interest rate swaps.
Recent Accounting Pronouncements
In June 2009, the FASB issued a new accounting standard named The FASB Accounting StandardsCodification and the Hierarchy of Generally Accepted Accounting Principles. This pronouncement, amongother things, identified the previously issued accounting standards that were considered authoritativegenerally accepted accounting principles in the U.S. and replaced all previously issued accountingpronouncements of the FASB, and its predecessor rule-making bodies, with the ASC. This standard waseffective prospectively for reporting periods ended after September 15, 2009 and, accordingly, theCompany adopted it during the fourth quarter of the fiscal year 2009. The adoption of this standard didnot have an effect on the Company’s consolidated financial position, results of operations or cash flows. Asa result of adopting this standard, the Company’s references to GAAP standards have been changed torefer to topics, subtopics, sections or subsections of the ASC, as appropriate.
In May 2009, the FASB issued ASC 855, Subsequent Events (‘‘ASC 855’’). ASC 855 establishes standards ofaccounting for and disclosure of transactions and events that occur after the balance sheet date but beforethe financial statements are issued. This accounting standard requires the disclosure, among other things,of the date through which an entity has evaluated subsequent events and whether that date is the date thefinancial statements were issued or the date the financial statements were available to be issued. Thisaccounting standard must be applied prospectively for interim and annual periods ended after June 15,2009 and, accordingly, the Company adopted its provisions effective for the quarter ended June 30, 2009.In connection therewith, the Company has evaluated all material transactions and events throughNovember 18, 2009, the last full business day before this Annual Report was filed with the SEC.
Effective on January 1, 2009, the Company adopted the amendment to ASC 815 contained in ASC815-10-65, Derivatives and Hedging, Transition (‘‘ASC 815-10-65’’). ASC 815-10-65 established, among otherthings, the disclosure requirements for derivative instruments and for hedging activities. This standardamended and expanded those disclosures to also require qualitative disclosures about the objectives andstrategies for using derivative instruments, quantitative disclosures about the fair value of and gains andlosses on derivative instruments and disclosures about credit-risk-related contingent features contained inthe derivative instruments. This standard also requires companies to disclose information about howderivatives and related hedges are accounted for and how the hedges affect the entity’s financial position,
F-15
Sally Beauty Holdings, Inc. and Subsidiaries
Notes to Consolidated Financial Statements (Continued)
financial performance and cash flows, including the location and amounts of derivative instruments in theentity’s financial statements.
As required by ASC 815, the Company records all derivative instruments on its balance sheet at fair value.The accounting for changes in the fair value of derivative instruments depends on the intended use of thederivative, whether the Company has elected to designate a derivative instrument in a hedging relationshipand apply hedge accounting and whether the hedging relationship has satisfied the criteria necessary toapply hedge accounting. Derivative instruments designated and qualifying as a hedge of the exposure tovariability in expected future cash flows, or other types of forecasted transactions, are considered cash flowhedges. Hedge accounting generally provides for the matching of the timing of gain or loss recognition onthe hedging instrument with the recognition of the impact on earnings of the hedged transaction ortransactions. The Company may from time to time enter into derivative contracts that are intended tohedge certain economic risks even though hedge accounting does not apply or the Company elects not toapply hedge accounting to such derivative contracts. Please see Note 14 for more details about theCompany’s derivative instruments and hedging activities as of September 30, 2009.
The Company adopted the provisions of ASC 820, Fair Value Measurements and Disclosures (‘‘ASC 820’’),as it relates to its financial instruments, effective on October 1, 2008. ASC 820 defines fair value,establishes a framework for measuring fair value, and expands disclosures about fair value measurements.This standard defines ‘‘fair value’’ as the price that would be received to sell an asset or paid to transfer aliability in the principal or most advantageous market in an orderly transaction between marketparticipants on the measurement date. This standard establishes a three-level hierarchy for measuring fairvalue and requires an entity to maximize the use of observable inputs and minimize the use ofunobservable inputs when measuring fair value.
This valuation hierarchy is based upon the transparency of inputs to the valuation of an asset or liability onthe measurement date. The three levels of that hierarchy are defined as follows:
Level 1—Unadjusted quoted prices in active markets for identical assets or liabilities
Level 2—Unadjusted quoted prices in active markets for similar assets or liabilities; or unadjustedquoted prices for identical or similar assets or liabilities in markets that are not active; or inputs otherthan quoted prices that are observable for the asset or liability; or inputs that are derived principallyfrom or corroborated by observable market data
Level 3—Unobservable inputs for the asset or liability
The Company measures certain financial assets and liabilities at fair value on a recurring basis, includinginterest rate swaps. The Company has determined that the majority of the inputs used to value its interestrate swaps fall within Level 2 of the valuation hierarchy. In accordance with ASC 820, the Company
F-16
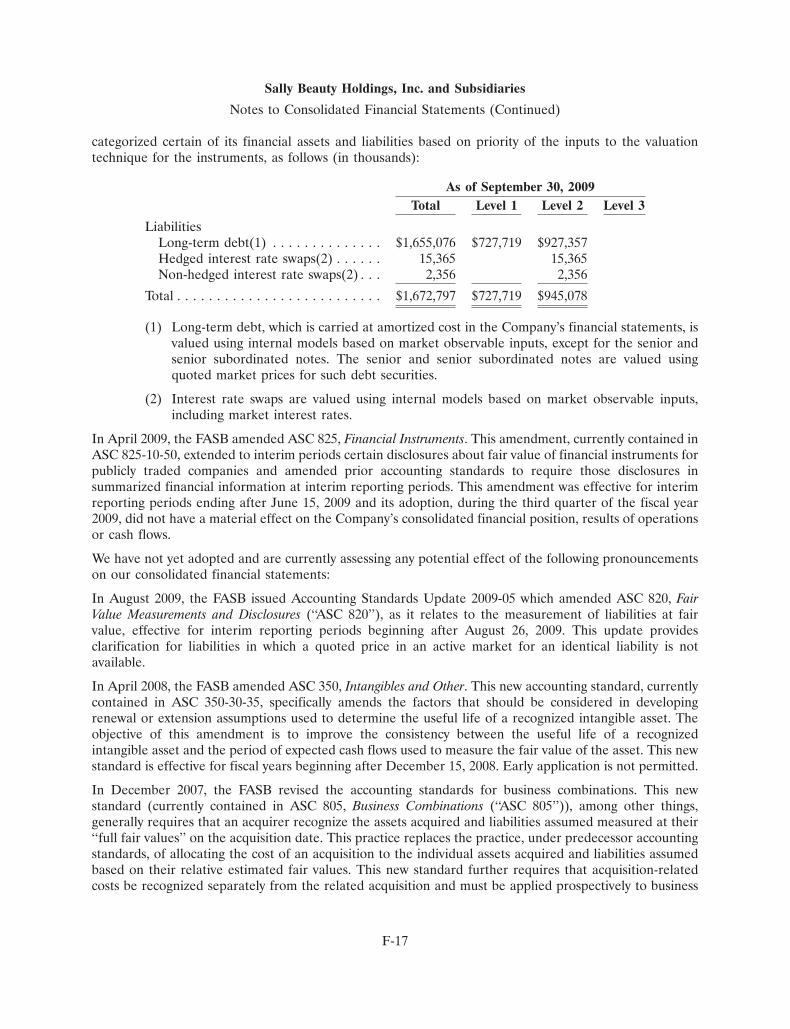
Sally Beauty Holdings, Inc. and Subsidiaries
Notes to Consolidated Financial Statements (Continued)
categorized certain of its financial assets and liabilities based on priority of the inputs to the valuationtechnique for the instruments, as follows (in thousands):
As of September 30, 2009Total Level 1 Level 2 Level 3
LiabilitiesLong-term debt(1) . . . . . . . . . . . . . . $1,655,076 $727,719 $927,357Hedged interest rate swaps(2) . . . . . . 15,365 15,365Non-hedged interest rate swaps(2) . . . 2,356 2,356
Total . . . . . . . . . . . . . . . . . . . . . . . . . . $1,672,797 $727,719 $945,078
(1) Long-term debt, which is carried at amortized cost in the Company’s financial statements, isvalued using internal models based on market observable inputs, except for the senior andsenior subordinated notes. The senior and senior subordinated notes are valued usingquoted market prices for such debt securities.
(2) Interest rate swaps are valued using internal models based on market observable inputs,including market interest rates.
In April 2009, the FASB amended ASC 825, Financial Instruments. This amendment, currently contained inASC 825-10-50, extended to interim periods certain disclosures about fair value of financial instruments forpublicly traded companies and amended prior accounting standards to require those disclosures insummarized financial information at interim reporting periods. This amendment was effective for interimreporting periods ending after June 15, 2009 and its adoption, during the third quarter of the fiscal year2009, did not have a material effect on the Company’s consolidated financial position, results of operationsor cash flows.
We have not yet adopted and are currently assessing any potential effect of the following pronouncementson our consolidated financial statements:
In August 2009, the FASB issued Accounting Standards Update 2009-05 which amended ASC 820, FairValue Measurements and Disclosures (‘‘ASC 820’’), as it relates to the measurement of liabilities at fairvalue, effective for interim reporting periods beginning after August 26, 2009. This update providesclarification for liabilities in which a quoted price in an active market for an identical liability is notavailable.
In April 2008, the FASB amended ASC 350, Intangibles and Other. This new accounting standard, currentlycontained in ASC 350-30-35, specifically amends the factors that should be considered in developingrenewal or extension assumptions used to determine the useful life of a recognized intangible asset. Theobjective of this amendment is to improve the consistency between the useful life of a recognizedintangible asset and the period of expected cash flows used to measure the fair value of the asset. This newstandard is effective for fiscal years beginning after December 15, 2008. Early application is not permitted.
In December 2007, the FASB revised the accounting standards for business combinations. This newstandard (currently contained in ASC 805, Business Combinations (‘‘ASC 805’’)), among other things,generally requires that an acquirer recognize the assets acquired and liabilities assumed measured at their‘‘full fair values’’ on the acquisition date. This practice replaces the practice, under predecessor accountingstandards, of allocating the cost of an acquisition to the individual assets acquired and liabilities assumedbased on their relative estimated fair values. This new standard further requires that acquisition-relatedcosts be recognized separately from the related acquisition and must be applied prospectively to business
F-17
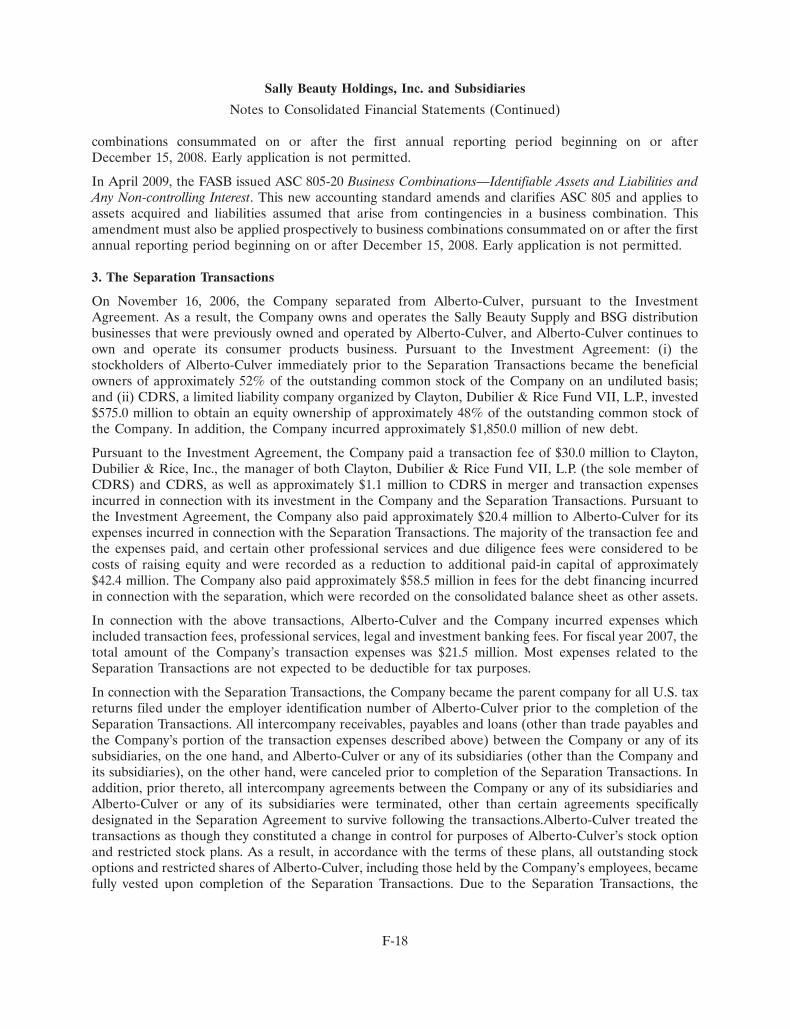
Sally Beauty Holdings, Inc. and Subsidiaries
Notes to Consolidated Financial Statements (Continued)
combinations consummated on or after the first annual reporting period beginning on or afterDecember 15, 2008. Early application is not permitted.
In April 2009, the FASB issued ASC 805-20 Business Combinations—Identifiable Assets and Liabilities andAny Non-controlling Interest. This new accounting standard amends and clarifies ASC 805 and applies toassets acquired and liabilities assumed that arise from contingencies in a business combination. Thisamendment must also be applied prospectively to business combinations consummated on or after the firstannual reporting period beginning on or after December 15, 2008. Early application is not permitted.
3. The Separation Transactions
On November 16, 2006, the Company separated from Alberto-Culver, pursuant to the InvestmentAgreement. As a result, the Company owns and operates the Sally Beauty Supply and BSG distributionbusinesses that were previously owned and operated by Alberto-Culver, and Alberto-Culver continues toown and operate its consumer products business. Pursuant to the Investment Agreement: (i) thestockholders of Alberto-Culver immediately prior to the Separation Transactions became the beneficialowners of approximately 52% of the outstanding common stock of the Company on an undiluted basis;and (ii) CDRS, a limited liability company organized by Clayton, Dubilier & Rice Fund VII, L.P., invested$575.0 million to obtain an equity ownership of approximately 48% of the outstanding common stock ofthe Company. In addition, the Company incurred approximately $1,850.0 million of new debt.
Pursuant to the Investment Agreement, the Company paid a transaction fee of $30.0 million to Clayton,Dubilier & Rice, Inc., the manager of both Clayton, Dubilier & Rice Fund VII, L.P. (the sole member ofCDRS) and CDRS, as well as approximately $1.1 million to CDRS in merger and transaction expensesincurred in connection with its investment in the Company and the Separation Transactions. Pursuant tothe Investment Agreement, the Company also paid approximately $20.4 million to Alberto-Culver for itsexpenses incurred in connection with the Separation Transactions. The majority of the transaction fee andthe expenses paid, and certain other professional services and due diligence fees were considered to becosts of raising equity and were recorded as a reduction to additional paid-in capital of approximately$42.4 million. The Company also paid approximately $58.5 million in fees for the debt financing incurredin connection with the separation, which were recorded on the consolidated balance sheet as other assets.
In connection with the above transactions, Alberto-Culver and the Company incurred expenses whichincluded transaction fees, professional services, legal and investment banking fees. For fiscal year 2007, thetotal amount of the Company’s transaction expenses was $21.5 million. Most expenses related to theSeparation Transactions are not expected to be deductible for tax purposes.
In connection with the Separation Transactions, the Company became the parent company for all U.S. taxreturns filed under the employer identification number of Alberto-Culver prior to the completion of theSeparation Transactions. All intercompany receivables, payables and loans (other than trade payables andthe Company’s portion of the transaction expenses described above) between the Company or any of itssubsidiaries, on the one hand, and Alberto-Culver or any of its subsidiaries (other than the Company andits subsidiaries), on the other hand, were canceled prior to completion of the Separation Transactions. Inaddition, prior thereto, all intercompany agreements between the Company or any of its subsidiaries andAlberto-Culver or any of its subsidiaries were terminated, other than certain agreements specificallydesignated in the Separation Agreement to survive following the transactions.Alberto-Culver treated thetransactions as though they constituted a change in control for purposes of Alberto-Culver’s stock optionand restricted stock plans. As a result, in accordance with the terms of these plans, all outstanding stockoptions and restricted shares of Alberto-Culver, including those held by the Company’s employees, becamefully vested upon completion of the Separation Transactions. Due to the Separation Transactions, the
F-18
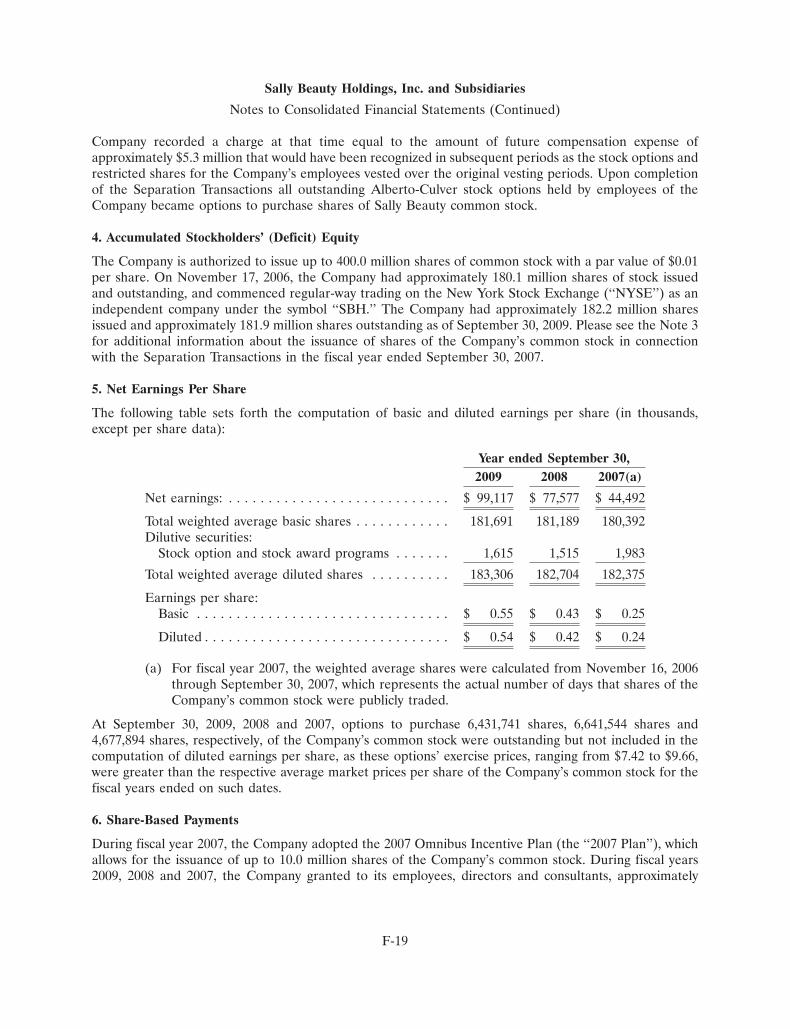
Sally Beauty Holdings, Inc. and Subsidiaries
Notes to Consolidated Financial Statements (Continued)
Company recorded a charge at that time equal to the amount of future compensation expense ofapproximately $5.3 million that would have been recognized in subsequent periods as the stock options andrestricted shares for the Company’s employees vested over the original vesting periods. Upon completionof the Separation Transactions all outstanding Alberto-Culver stock options held by employees of theCompany became options to purchase shares of Sally Beauty common stock.
4. Accumulated Stockholders’ (Deficit) Equity
The Company is authorized to issue up to 400.0 million shares of common stock with a par value of $0.01per share. On November 17, 2006, the Company had approximately 180.1 million shares of stock issuedand outstanding, and commenced regular-way trading on the New York Stock Exchange (‘‘NYSE’’) as anindependent company under the symbol ‘‘SBH.’’ The Company had approximately 182.2 million sharesissued and approximately 181.9 million shares outstanding as of September 30, 2009. Please see the Note 3for additional information about the issuance of shares of the Company’s common stock in connectionwith the Separation Transactions in the fiscal year ended September 30, 2007.
5. Net Earnings Per Share
The following table sets forth the computation of basic and diluted earnings per share (in thousands,except per share data):
Year ended September 30,2009 2008 2007(a)
Net earnings: . . . . . . . . . . . . . . . . . . . . . . . . . . . . $ 99,117 $ 77,577 $ 44,492
Total weighted average basic shares . . . . . . . . . . . . 181,691 181,189 180,392Dilutive securities:
Stock option and stock award programs . . . . . . . 1,615 1,515 1,983
Total weighted average diluted shares . . . . . . . . . . 183,306 182,704 182,375
Earnings per share:Basic . . . . . . . . . . . . . . . . . . . . . . . . . . . . . . . . $ 0.55 $ 0.43 $ 0.25
Diluted . . . . . . . . . . . . . . . . . . . . . . . . . . . . . . . $ 0.54 $ 0.42 $ 0.24
(a) For fiscal year 2007, the weighted average shares were calculated from November 16, 2006through September 30, 2007, which represents the actual number of days that shares of theCompany’s common stock were publicly traded.
At September 30, 2009, 2008 and 2007, options to purchase 6,431,741 shares, 6,641,544 shares and4,677,894 shares, respectively, of the Company’s common stock were outstanding but not included in thecomputation of diluted earnings per share, as these options’ exercise prices, ranging from $7.42 to $9.66,were greater than the respective average market prices per share of the Company’s common stock for thefiscal years ended on such dates.
6. Share-Based Payments
During fiscal year 2007, the Company adopted the 2007 Omnibus Incentive Plan (the ‘‘2007 Plan’’), whichallows for the issuance of up to 10.0 million shares of the Company’s common stock. During fiscal years2009, 2008 and 2007, the Company granted to its employees, directors and consultants, approximately
F-19
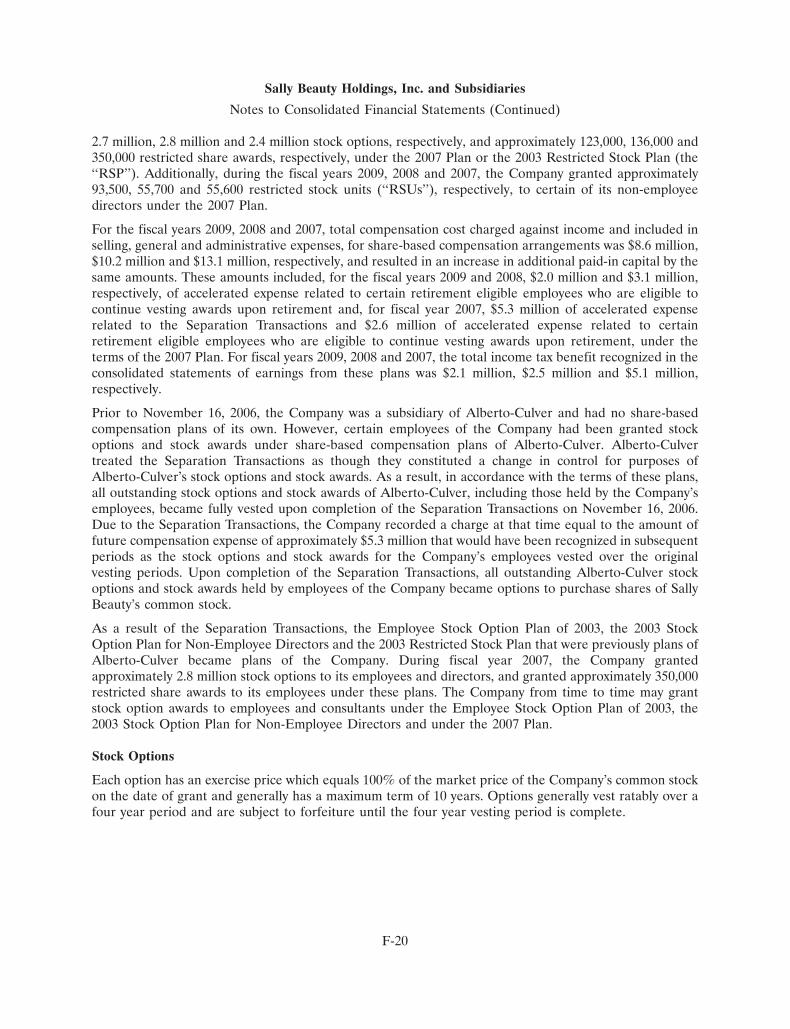
Sally Beauty Holdings, Inc. and Subsidiaries
Notes to Consolidated Financial Statements (Continued)
2.7 million, 2.8 million and 2.4 million stock options, respectively, and approximately 123,000, 136,000 and350,000 restricted share awards, respectively, under the 2007 Plan or the 2003 Restricted Stock Plan (the‘‘RSP’’). Additionally, during the fiscal years 2009, 2008 and 2007, the Company granted approximately93,500, 55,700 and 55,600 restricted stock units (‘‘RSUs’’), respectively, to certain of its non-employeedirectors under the 2007 Plan.
For the fiscal years 2009, 2008 and 2007, total compensation cost charged against income and included inselling, general and administrative expenses, for share-based compensation arrangements was $8.6 million,$10.2 million and $13.1 million, respectively, and resulted in an increase in additional paid-in capital by thesame amounts. These amounts included, for the fiscal years 2009 and 2008, $2.0 million and $3.1 million,respectively, of accelerated expense related to certain retirement eligible employees who are eligible tocontinue vesting awards upon retirement and, for fiscal year 2007, $5.3 million of accelerated expenserelated to the Separation Transactions and $2.6 million of accelerated expense related to certainretirement eligible employees who are eligible to continue vesting awards upon retirement, under theterms of the 2007 Plan. For fiscal years 2009, 2008 and 2007, the total income tax benefit recognized in theconsolidated statements of earnings from these plans was $2.1 million, $2.5 million and $5.1 million,respectively.
Prior to November 16, 2006, the Company was a subsidiary of Alberto-Culver and had no share-basedcompensation plans of its own. However, certain employees of the Company had been granted stockoptions and stock awards under share-based compensation plans of Alberto-Culver. Alberto-Culvertreated the Separation Transactions as though they constituted a change in control for purposes ofAlberto-Culver’s stock options and stock awards. As a result, in accordance with the terms of these plans,all outstanding stock options and stock awards of Alberto-Culver, including those held by the Company’semployees, became fully vested upon completion of the Separation Transactions on November 16, 2006.Due to the Separation Transactions, the Company recorded a charge at that time equal to the amount offuture compensation expense of approximately $5.3 million that would have been recognized in subsequentperiods as the stock options and stock awards for the Company’s employees vested over the originalvesting periods. Upon completion of the Separation Transactions, all outstanding Alberto-Culver stockoptions and stock awards held by employees of the Company became options to purchase shares of SallyBeauty’s common stock.
As a result of the Separation Transactions, the Employee Stock Option Plan of 2003, the 2003 StockOption Plan for Non-Employee Directors and the 2003 Restricted Stock Plan that were previously plans ofAlberto-Culver became plans of the Company. During fiscal year 2007, the Company grantedapproximately 2.8 million stock options to its employees and directors, and granted approximately 350,000restricted share awards to its employees under these plans. The Company from time to time may grantstock option awards to employees and consultants under the Employee Stock Option Plan of 2003, the2003 Stock Option Plan for Non-Employee Directors and under the 2007 Plan.
Stock Options
Each option has an exercise price which equals 100% of the market price of the Company’s common stockon the date of grant and generally has a maximum term of 10 years. Options generally vest ratably over afour year period and are subject to forfeiture until the four year vesting period is complete.
F-20
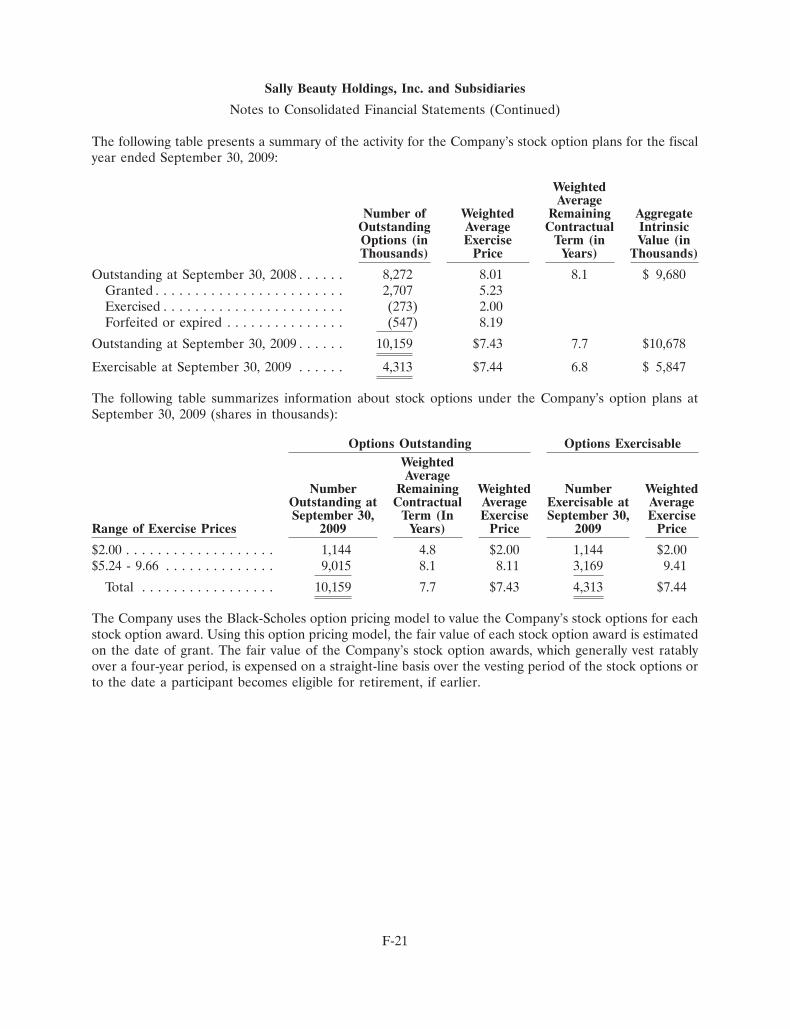
Sally Beauty Holdings, Inc. and Subsidiaries
Notes to Consolidated Financial Statements (Continued)
The following table presents a summary of the activity for the Company’s stock option plans for the fiscalyear ended September 30, 2009:
WeightedAverage
Number of Weighted Remaining AggregateOutstanding Average Contractual IntrinsicOptions (in Exercise Term (in Value (inThousands) Price Years) Thousands)
Outstanding at September 30, 2008 . . . . . . 8,272 8.01 8.1 $ 9,680Granted . . . . . . . . . . . . . . . . . . . . . . . . 2,707 5.23Exercised . . . . . . . . . . . . . . . . . . . . . . . (273) 2.00Forfeited or expired . . . . . . . . . . . . . . . (547) 8.19
Outstanding at September 30, 2009 . . . . . . 10,159 $7.43 7.7 $10,678
Exercisable at September 30, 2009 . . . . . . 4,313 $7.44 6.8 $ 5,847
The following table summarizes information about stock options under the Company’s option plans atSeptember 30, 2009 (shares in thousands):
Options Outstanding Options ExercisableWeightedAverage
Number Remaining Weighted Number WeightedOutstanding at Contractual Average Exercisable at AverageSeptember 30, Term (In Exercise September 30, Exercise
Range of Exercise Prices 2009 Years) Price 2009 Price
$2.00 . . . . . . . . . . . . . . . . . . . 1,144 4.8 $2.00 1,144 $2.00$5.24 - 9.66 . . . . . . . . . . . . . . 9,015 8.1 8.11 3,169 9.41
Total . . . . . . . . . . . . . . . . . 10,159 7.7 $7.43 4,313 $7.44
The Company uses the Black-Scholes option pricing model to value the Company’s stock options for eachstock option award. Using this option pricing model, the fair value of each stock option award is estimatedon the date of grant. The fair value of the Company’s stock option awards, which generally vest ratablyover a four-year period, is expensed on a straight-line basis over the vesting period of the stock options orto the date a participant becomes eligible for retirement, if earlier.
F-21
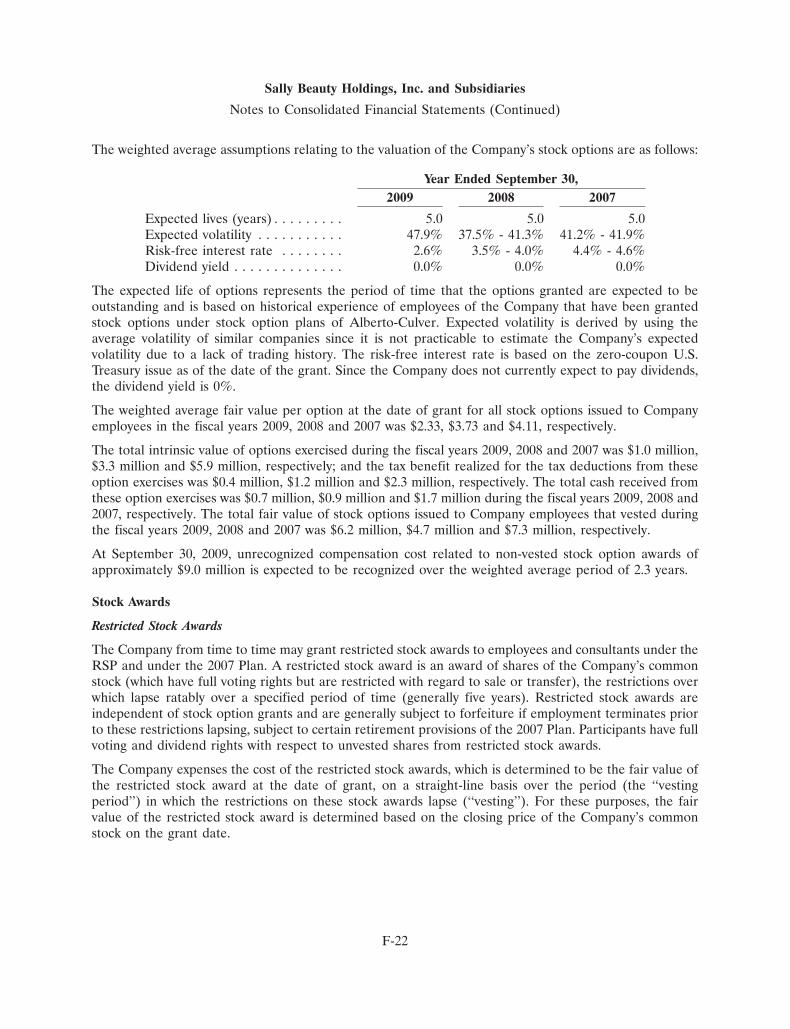
Sally Beauty Holdings, Inc. and Subsidiaries
Notes to Consolidated Financial Statements (Continued)
The weighted average assumptions relating to the valuation of the Company’s stock options are as follows:
Year Ended September 30,2009 2008 2007
Expected lives (years) . . . . . . . . . 5.0 5.0 5.0Expected volatility . . . . . . . . . . . 47.9% 37.5% - 41.3% 41.2% - 41.9%Risk-free interest rate . . . . . . . . 2.6% 3.5% - 4.0% 4.4% - 4.6%Dividend yield . . . . . . . . . . . . . . 0.0% 0.0% 0.0%
The expected life of options represents the period of time that the options granted are expected to beoutstanding and is based on historical experience of employees of the Company that have been grantedstock options under stock option plans of Alberto-Culver. Expected volatility is derived by using theaverage volatility of similar companies since it is not practicable to estimate the Company’s expectedvolatility due to a lack of trading history. The risk-free interest rate is based on the zero-coupon U.S.Treasury issue as of the date of the grant. Since the Company does not currently expect to pay dividends,the dividend yield is 0%.
The weighted average fair value per option at the date of grant for all stock options issued to Companyemployees in the fiscal years 2009, 2008 and 2007 was $2.33, $3.73 and $4.11, respectively.
The total intrinsic value of options exercised during the fiscal years 2009, 2008 and 2007 was $1.0 million,$3.3 million and $5.9 million, respectively; and the tax benefit realized for the tax deductions from theseoption exercises was $0.4 million, $1.2 million and $2.3 million, respectively. The total cash received fromthese option exercises was $0.7 million, $0.9 million and $1.7 million during the fiscal years 2009, 2008 and2007, respectively. The total fair value of stock options issued to Company employees that vested duringthe fiscal years 2009, 2008 and 2007 was $6.2 million, $4.7 million and $7.3 million, respectively.
At September 30, 2009, unrecognized compensation cost related to non-vested stock option awards ofapproximately $9.0 million is expected to be recognized over the weighted average period of 2.3 years.
Stock Awards
Restricted Stock Awards
The Company from time to time may grant restricted stock awards to employees and consultants under theRSP and under the 2007 Plan. A restricted stock award is an award of shares of the Company’s commonstock (which have full voting rights but are restricted with regard to sale or transfer), the restrictions overwhich lapse ratably over a specified period of time (generally five years). Restricted stock awards areindependent of stock option grants and are generally subject to forfeiture if employment terminates priorto these restrictions lapsing, subject to certain retirement provisions of the 2007 Plan. Participants have fullvoting and dividend rights with respect to unvested shares from restricted stock awards.
The Company expenses the cost of the restricted stock awards, which is determined to be the fair value ofthe restricted stock award at the date of grant, on a straight-line basis over the period (the ‘‘vestingperiod’’) in which the restrictions on these stock awards lapse (‘‘vesting’’). For these purposes, the fairvalue of the restricted stock award is determined based on the closing price of the Company’s commonstock on the grant date.
F-22
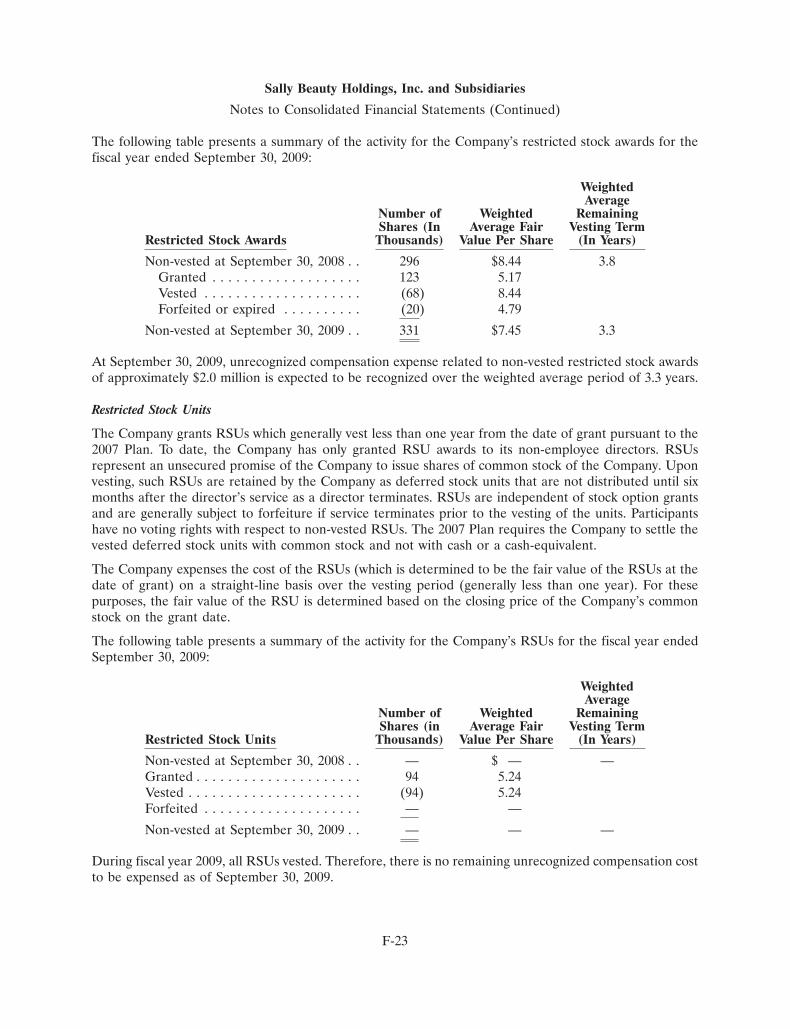
Sally Beauty Holdings, Inc. and Subsidiaries
Notes to Consolidated Financial Statements (Continued)
The following table presents a summary of the activity for the Company’s restricted stock awards for thefiscal year ended September 30, 2009:
WeightedAverage
Number of Weighted RemainingShares (In Average Fair Vesting Term
Restricted Stock Awards Thousands) Value Per Share (In Years)
Non-vested at September 30, 2008 . . 296 $8.44 3.8Granted . . . . . . . . . . . . . . . . . . . 123 5.17Vested . . . . . . . . . . . . . . . . . . . . (68) 8.44Forfeited or expired . . . . . . . . . . (20) 4.79
Non-vested at September 30, 2009 . . 331 $7.45 3.3
At September 30, 2009, unrecognized compensation expense related to non-vested restricted stock awardsof approximately $2.0 million is expected to be recognized over the weighted average period of 3.3 years.
Restricted Stock Units
The Company grants RSUs which generally vest less than one year from the date of grant pursuant to the2007 Plan. To date, the Company has only granted RSU awards to its non-employee directors. RSUsrepresent an unsecured promise of the Company to issue shares of common stock of the Company. Uponvesting, such RSUs are retained by the Company as deferred stock units that are not distributed until sixmonths after the director’s service as a director terminates. RSUs are independent of stock option grantsand are generally subject to forfeiture if service terminates prior to the vesting of the units. Participantshave no voting rights with respect to non-vested RSUs. The 2007 Plan requires the Company to settle thevested deferred stock units with common stock and not with cash or a cash-equivalent.
The Company expenses the cost of the RSUs (which is determined to be the fair value of the RSUs at thedate of grant) on a straight-line basis over the vesting period (generally less than one year). For thesepurposes, the fair value of the RSU is determined based on the closing price of the Company’s commonstock on the grant date.
The following table presents a summary of the activity for the Company’s RSUs for the fiscal year endedSeptember 30, 2009:
WeightedAverage
Number of Weighted RemainingShares (in Average Fair Vesting Term
Restricted Stock Units Thousands) Value Per Share (In Years)
Non-vested at September 30, 2008 . . — $ — —Granted . . . . . . . . . . . . . . . . . . . . . 94 5.24Vested . . . . . . . . . . . . . . . . . . . . . . (94) 5.24Forfeited . . . . . . . . . . . . . . . . . . . . — —
Non-vested at September 30, 2009 . . — — —
During fiscal year 2009, all RSUs vested. Therefore, there is no remaining unrecognized compensation costto be expensed as of September 30, 2009.
F-23
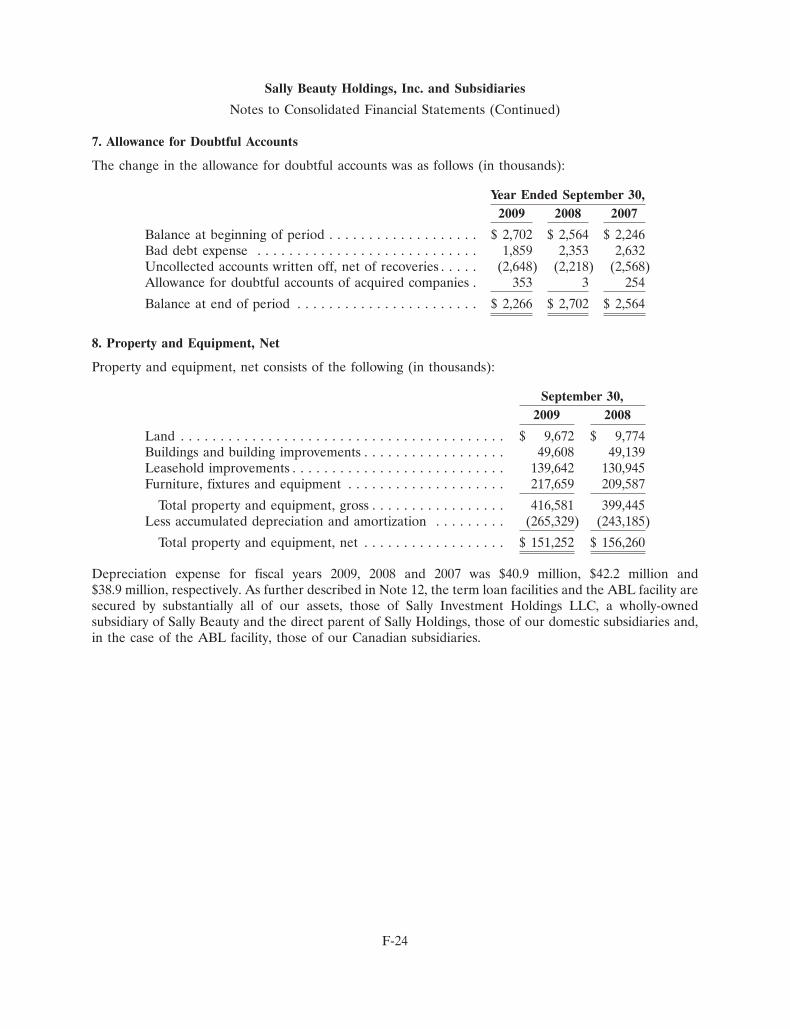
Sally Beauty Holdings, Inc. and Subsidiaries
Notes to Consolidated Financial Statements (Continued)
7. Allowance for Doubtful Accounts
The change in the allowance for doubtful accounts was as follows (in thousands):
Year Ended September 30,2009 2008 2007
Balance at beginning of period . . . . . . . . . . . . . . . . . . . $ 2,702 $ 2,564 $ 2,246Bad debt expense . . . . . . . . . . . . . . . . . . . . . . . . . . . . 1,859 2,353 2,632Uncollected accounts written off, net of recoveries . . . . . (2,648) (2,218) (2,568)Allowance for doubtful accounts of acquired companies . 353 3 254
Balance at end of period . . . . . . . . . . . . . . . . . . . . . . . $ 2,266 $ 2,702 $ 2,564
8. Property and Equipment, Net
Property and equipment, net consists of the following (in thousands):
September 30,2009 2008
Land . . . . . . . . . . . . . . . . . . . . . . . . . . . . . . . . . . . . . . . . . $ 9,672 $ 9,774Buildings and building improvements . . . . . . . . . . . . . . . . . . 49,608 49,139Leasehold improvements . . . . . . . . . . . . . . . . . . . . . . . . . . . 139,642 130,945Furniture, fixtures and equipment . . . . . . . . . . . . . . . . . . . . 217,659 209,587
Total property and equipment, gross . . . . . . . . . . . . . . . . . 416,581 399,445Less accumulated depreciation and amortization . . . . . . . . . (265,329) (243,185)
Total property and equipment, net . . . . . . . . . . . . . . . . . . $ 151,252 $ 156,260
Depreciation expense for fiscal years 2009, 2008 and 2007 was $40.9 million, $42.2 million and$38.9 million, respectively. As further described in Note 12, the term loan facilities and the ABL facility aresecured by substantially all of our assets, those of Sally Investment Holdings LLC, a wholly-ownedsubsidiary of Sally Beauty and the direct parent of Sally Holdings, those of our domestic subsidiaries and,in the case of the ABL facility, those of our Canadian subsidiaries.
F-24
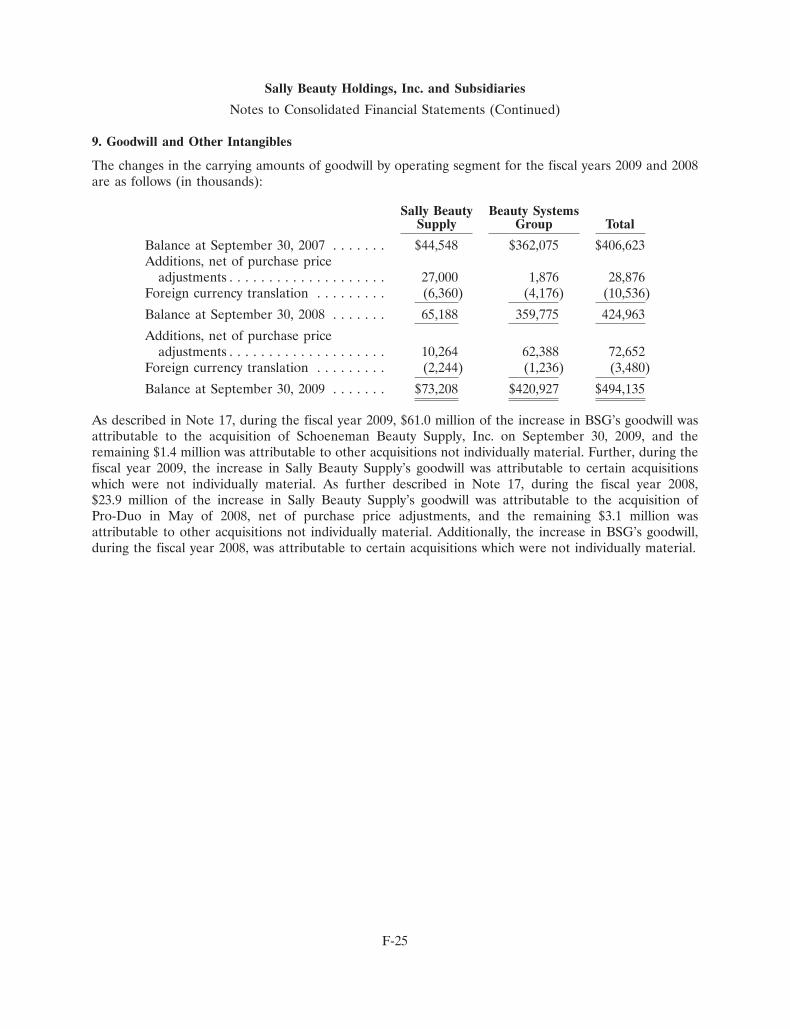
Sally Beauty Holdings, Inc. and Subsidiaries
Notes to Consolidated Financial Statements (Continued)
9. Goodwill and Other Intangibles
The changes in the carrying amounts of goodwill by operating segment for the fiscal years 2009 and 2008are as follows (in thousands):
Sally Beauty Beauty SystemsSupply Group Total
Balance at September 30, 2007 . . . . . . . $44,548 $362,075 $406,623Additions, net of purchase price
adjustments . . . . . . . . . . . . . . . . . . . . 27,000 1,876 28,876Foreign currency translation . . . . . . . . . (6,360) (4,176) (10,536)
Balance at September 30, 2008 . . . . . . . 65,188 359,775 424,963
Additions, net of purchase priceadjustments . . . . . . . . . . . . . . . . . . . . 10,264 62,388 72,652
Foreign currency translation . . . . . . . . . (2,244) (1,236) (3,480)
Balance at September 30, 2009 . . . . . . . $73,208 $420,927 $494,135
As described in Note 17, during the fiscal year 2009, $61.0 million of the increase in BSG’s goodwill wasattributable to the acquisition of Schoeneman Beauty Supply, Inc. on September 30, 2009, and theremaining $1.4 million was attributable to other acquisitions not individually material. Further, during thefiscal year 2009, the increase in Sally Beauty Supply’s goodwill was attributable to certain acquisitionswhich were not individually material. As further described in Note 17, during the fiscal year 2008,$23.9 million of the increase in Sally Beauty Supply’s goodwill was attributable to the acquisition ofPro-Duo in May of 2008, net of purchase price adjustments, and the remaining $3.1 million wasattributable to other acquisitions not individually material. Additionally, the increase in BSG’s goodwill,during the fiscal year 2008, was attributable to certain acquisitions which were not individually material.
F-25
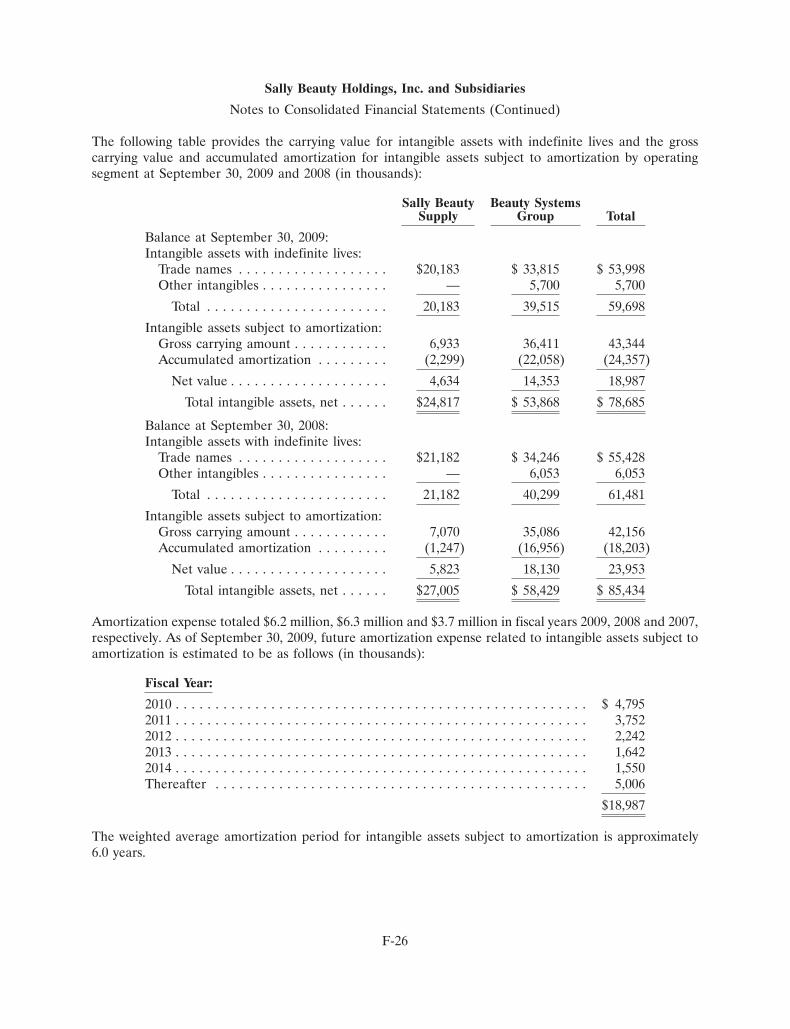
Sally Beauty Holdings, Inc. and Subsidiaries
Notes to Consolidated Financial Statements (Continued)
The following table provides the carrying value for intangible assets with indefinite lives and the grosscarrying value and accumulated amortization for intangible assets subject to amortization by operatingsegment at September 30, 2009 and 2008 (in thousands):
Sally Beauty Beauty SystemsSupply Group Total
Balance at September 30, 2009:Intangible assets with indefinite lives:
Trade names . . . . . . . . . . . . . . . . . . . $20,183 $ 33,815 $ 53,998Other intangibles . . . . . . . . . . . . . . . . — 5,700 5,700
Total . . . . . . . . . . . . . . . . . . . . . . . 20,183 39,515 59,698
Intangible assets subject to amortization:Gross carrying amount . . . . . . . . . . . . 6,933 36,411 43,344Accumulated amortization . . . . . . . . . (2,299) (22,058) (24,357)
Net value . . . . . . . . . . . . . . . . . . . . 4,634 14,353 18,987
Total intangible assets, net . . . . . . $24,817 $ 53,868 $ 78,685
Balance at September 30, 2008:Intangible assets with indefinite lives:
Trade names . . . . . . . . . . . . . . . . . . . $21,182 $ 34,246 $ 55,428Other intangibles . . . . . . . . . . . . . . . . — 6,053 6,053
Total . . . . . . . . . . . . . . . . . . . . . . . 21,182 40,299 61,481
Intangible assets subject to amortization:Gross carrying amount . . . . . . . . . . . . 7,070 35,086 42,156Accumulated amortization . . . . . . . . . (1,247) (16,956) (18,203)
Net value . . . . . . . . . . . . . . . . . . . . 5,823 18,130 23,953
Total intangible assets, net . . . . . . $27,005 $ 58,429 $ 85,434
Amortization expense totaled $6.2 million, $6.3 million and $3.7 million in fiscal years 2009, 2008 and 2007,respectively. As of September 30, 2009, future amortization expense related to intangible assets subject toamortization is estimated to be as follows (in thousands):
Fiscal Year:
2010 . . . . . . . . . . . . . . . . . . . . . . . . . . . . . . . . . . . . . . . . . . . . . . . . . . . . $ 4,7952011 . . . . . . . . . . . . . . . . . . . . . . . . . . . . . . . . . . . . . . . . . . . . . . . . . . . . 3,7522012 . . . . . . . . . . . . . . . . . . . . . . . . . . . . . . . . . . . . . . . . . . . . . . . . . . . . 2,2422013 . . . . . . . . . . . . . . . . . . . . . . . . . . . . . . . . . . . . . . . . . . . . . . . . . . . . 1,6422014 . . . . . . . . . . . . . . . . . . . . . . . . . . . . . . . . . . . . . . . . . . . . . . . . . . . . 1,550Thereafter . . . . . . . . . . . . . . . . . . . . . . . . . . . . . . . . . . . . . . . . . . . . . . . 5,006
$18,987
The weighted average amortization period for intangible assets subject to amortization is approximately6.0 years.
F-26
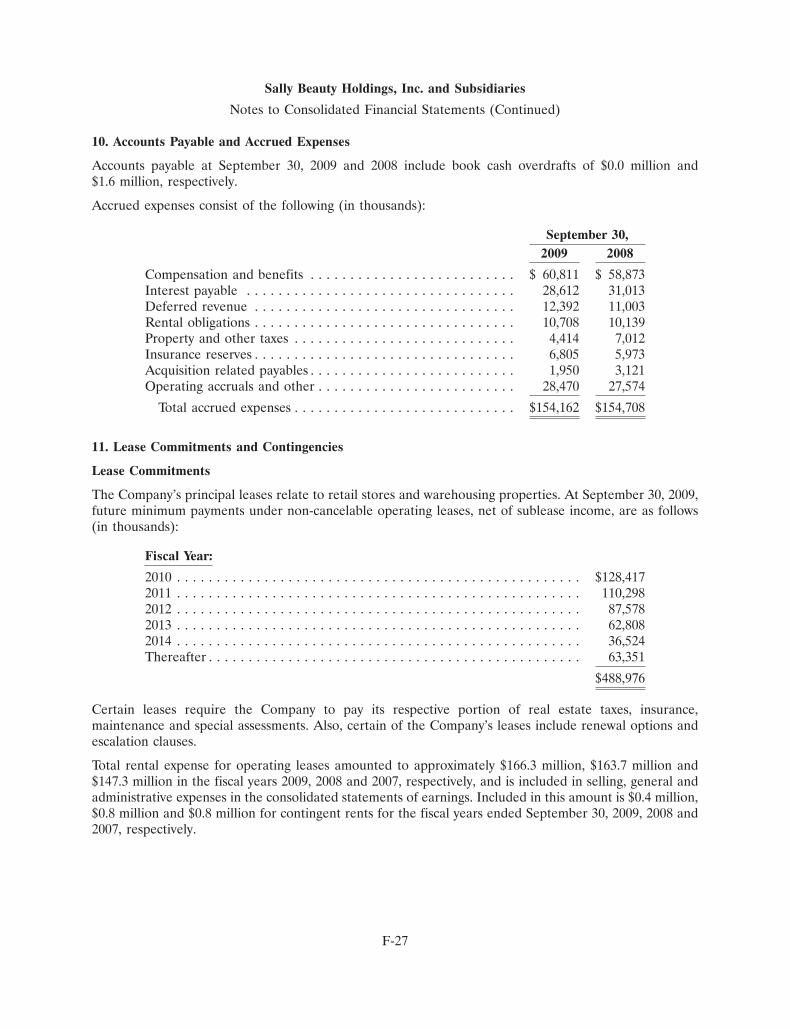
Sally Beauty Holdings, Inc. and Subsidiaries
Notes to Consolidated Financial Statements (Continued)
10. Accounts Payable and Accrued Expenses
Accounts payable at September 30, 2009 and 2008 include book cash overdrafts of $0.0 million and$1.6 million, respectively.
Accrued expenses consist of the following (in thousands):
September 30,2009 2008
Compensation and benefits . . . . . . . . . . . . . . . . . . . . . . . . . . $ 60,811 $ 58,873Interest payable . . . . . . . . . . . . . . . . . . . . . . . . . . . . . . . . . . 28,612 31,013Deferred revenue . . . . . . . . . . . . . . . . . . . . . . . . . . . . . . . . . 12,392 11,003Rental obligations . . . . . . . . . . . . . . . . . . . . . . . . . . . . . . . . . 10,708 10,139Property and other taxes . . . . . . . . . . . . . . . . . . . . . . . . . . . . 4,414 7,012Insurance reserves . . . . . . . . . . . . . . . . . . . . . . . . . . . . . . . . . 6,805 5,973Acquisition related payables . . . . . . . . . . . . . . . . . . . . . . . . . . 1,950 3,121Operating accruals and other . . . . . . . . . . . . . . . . . . . . . . . . . 28,470 27,574
Total accrued expenses . . . . . . . . . . . . . . . . . . . . . . . . . . . . $154,162 $154,708
11. Lease Commitments and Contingencies
Lease Commitments
The Company’s principal leases relate to retail stores and warehousing properties. At September 30, 2009,future minimum payments under non-cancelable operating leases, net of sublease income, are as follows(in thousands):
Fiscal Year:
2010 . . . . . . . . . . . . . . . . . . . . . . . . . . . . . . . . . . . . . . . . . . . . . . . . . . . $128,4172011 . . . . . . . . . . . . . . . . . . . . . . . . . . . . . . . . . . . . . . . . . . . . . . . . . . . 110,2982012 . . . . . . . . . . . . . . . . . . . . . . . . . . . . . . . . . . . . . . . . . . . . . . . . . . . 87,5782013 . . . . . . . . . . . . . . . . . . . . . . . . . . . . . . . . . . . . . . . . . . . . . . . . . . . 62,8082014 . . . . . . . . . . . . . . . . . . . . . . . . . . . . . . . . . . . . . . . . . . . . . . . . . . . 36,524Thereafter . . . . . . . . . . . . . . . . . . . . . . . . . . . . . . . . . . . . . . . . . . . . . . . 63,351
$488,976
Certain leases require the Company to pay its respective portion of real estate taxes, insurance,maintenance and special assessments. Also, certain of the Company’s leases include renewal options andescalation clauses.
Total rental expense for operating leases amounted to approximately $166.3 million, $163.7 million and$147.3 million in the fiscal years 2009, 2008 and 2007, respectively, and is included in selling, general andadministrative expenses in the consolidated statements of earnings. Included in this amount is $0.4 million,$0.8 million and $0.8 million for contingent rents for the fiscal years ended September 30, 2009, 2008 and2007, respectively.
F-27
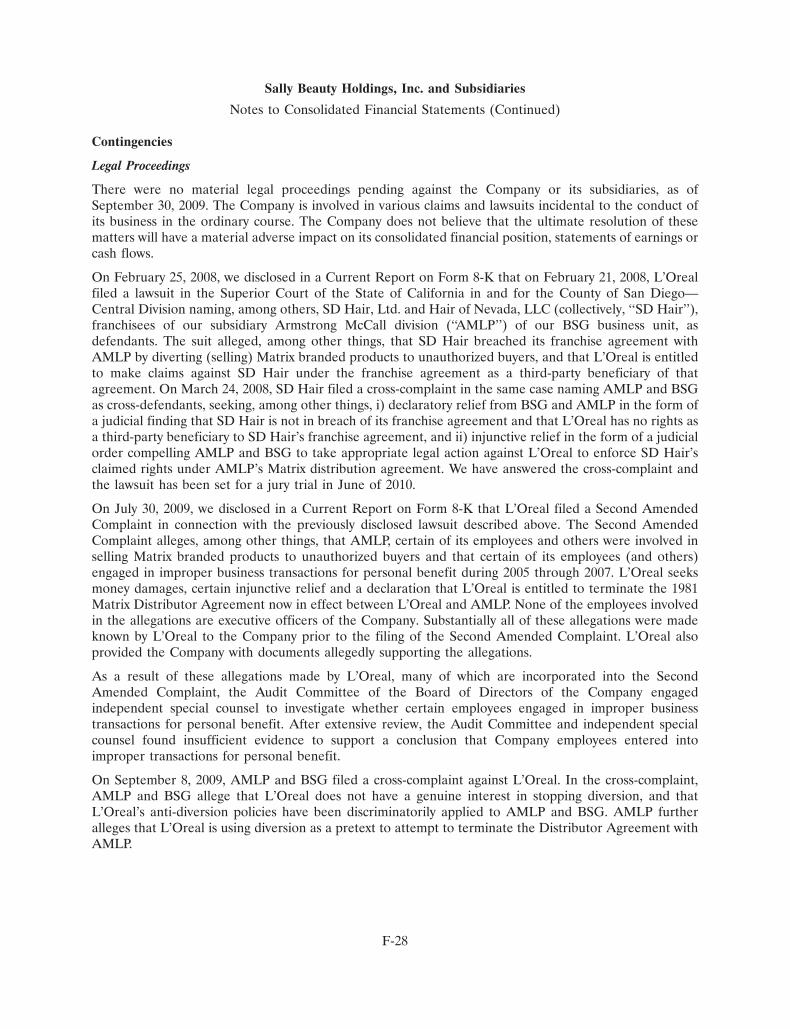
Sally Beauty Holdings, Inc. and Subsidiaries
Notes to Consolidated Financial Statements (Continued)
Contingencies
Legal Proceedings
There were no material legal proceedings pending against the Company or its subsidiaries, as ofSeptember 30, 2009. The Company is involved in various claims and lawsuits incidental to the conduct ofits business in the ordinary course. The Company does not believe that the ultimate resolution of thesematters will have a material adverse impact on its consolidated financial position, statements of earnings orcash flows.
On February 25, 2008, we disclosed in a Current Report on Form 8-K that on February 21, 2008, L’Orealfiled a lawsuit in the Superior Court of the State of California in and for the County of San Diego—Central Division naming, among others, SD Hair, Ltd. and Hair of Nevada, LLC (collectively, ‘‘SD Hair’’),franchisees of our subsidiary Armstrong McCall division (‘‘AMLP’’) of our BSG business unit, asdefendants. The suit alleged, among other things, that SD Hair breached its franchise agreement withAMLP by diverting (selling) Matrix branded products to unauthorized buyers, and that L’Oreal is entitledto make claims against SD Hair under the franchise agreement as a third-party beneficiary of thatagreement. On March 24, 2008, SD Hair filed a cross-complaint in the same case naming AMLP and BSGas cross-defendants, seeking, among other things, i) declaratory relief from BSG and AMLP in the form ofa judicial finding that SD Hair is not in breach of its franchise agreement and that L’Oreal has no rights asa third-party beneficiary to SD Hair’s franchise agreement, and ii) injunctive relief in the form of a judicialorder compelling AMLP and BSG to take appropriate legal action against L’Oreal to enforce SD Hair’sclaimed rights under AMLP’s Matrix distribution agreement. We have answered the cross-complaint andthe lawsuit has been set for a jury trial in June of 2010.
On July 30, 2009, we disclosed in a Current Report on Form 8-K that L’Oreal filed a Second AmendedComplaint in connection with the previously disclosed lawsuit described above. The Second AmendedComplaint alleges, among other things, that AMLP, certain of its employees and others were involved inselling Matrix branded products to unauthorized buyers and that certain of its employees (and others)engaged in improper business transactions for personal benefit during 2005 through 2007. L’Oreal seeksmoney damages, certain injunctive relief and a declaration that L’Oreal is entitled to terminate the 1981Matrix Distributor Agreement now in effect between L’Oreal and AMLP. None of the employees involvedin the allegations are executive officers of the Company. Substantially all of these allegations were madeknown by L’Oreal to the Company prior to the filing of the Second Amended Complaint. L’Oreal alsoprovided the Company with documents allegedly supporting the allegations.
As a result of these allegations made by L’Oreal, many of which are incorporated into the SecondAmended Complaint, the Audit Committee of the Board of Directors of the Company engagedindependent special counsel to investigate whether certain employees engaged in improper businesstransactions for personal benefit. After extensive review, the Audit Committee and independent specialcounsel found insufficient evidence to support a conclusion that Company employees entered intoimproper transactions for personal benefit.
On September 8, 2009, AMLP and BSG filed a cross-complaint against L’Oreal. In the cross-complaint,AMLP and BSG allege that L’Oreal does not have a genuine interest in stopping diversion, and thatL’Oreal’s anti-diversion policies have been discriminatorily applied to AMLP and BSG. AMLP furtheralleges that L’Oreal is using diversion as a pretext to attempt to terminate the Distributor Agreement withAMLP.
F-28
Sally Beauty Holdings, Inc. and Subsidiaries
Notes to Consolidated Financial Statements (Continued)
Other Contingencies
The Company provides healthcare benefits to essentially all of its full-time employees. The Company islargely self-funded for the cost of the healthcare plan, other than certain fees and out-of-pocket amountspaid by the employees. In addition, the Company retains a substantial portion of the risk related to certainworkers’ compensation, general liability and automobile and property insurance. The Company records anestimated liability for the ultimate cost of claims incurred and unpaid as of the balance sheet date. Theestimated liability is included in accrued expenses (current portion) and other liabilities (long-termportion) in our consolidated balance sheets. The Company carries insurance coverage in such amounts inexcess of its self-insured retention which management believes to be reasonable.
Liabilities for loss contingencies, arising from claims, assessments, litigation, fines, penalties and othersources are recorded when it is probable that a liability has been incurred and the amount of theassessment can be reasonably estimated. The Company has no significant liabilities for loss contingenciesat September 30, 2009 and 2008.
12. Long-Term Debt
Details of long-term debt are as follows (in thousands):
September 30,2009 Maturity dates Interest Rates
ABL facility . . . . . . . . . $ — — (i) Prime and up to 0.50% or;(ii) LIBOR (a) plus (1.00% to 1.50%)
Term Loan A . . . . . . . . 105,000 Nov. 2012 (i) Prime plus (1.00% to 1.50%) or;(ii) LIBOR plus (2.00% to 2.50%)
Term Loan B . . . . . . . . 863,856 Nov. 2013 (i) Prime plus (1.25% to 1.50%) or;(ii) LIBOR plus (2.25% to 2.50%)
Other (b) . . . . . . . . . . . 3,135 2010-2014 4.05% to 7.00%
Total . . . . . . . . . . . . . $ 971,991
Senior notes . . . . . . . . . $ 430,000 Nov. 2014 9.25%Senior subordinated
notes . . . . . . . . . . . . . 275,000 Nov. 2016 10.50%
Total . . . . . . . . . . . . . $ 705,000
Capitalized leases andother . . . . . . . . . . . . . $ 539
Less: current portion . . . (24,517)
Total long-term debt . . $1,653,013
(a) London Interbank Offered Rate (‘‘LIBOR’’)
(b) Represents pre-acquisition debt of Pro-Duo, N.V.
In connection with the Separation Transactions on November 16, 2006, the Company, through itssubsidiaries (Sally Investment Holdings LLC and Sally Holdings LLC) incurred $1,850.0 million ofindebtedness by: (i) drawing on a $400.0 million revolving (asset-based lending (‘‘ABL’’)) facility in anamount equal to $70.0 million; (ii) entering into two term loan facilities (term loans A and B) in anaggregate amount of $1,070.0 million; and (iii) together (jointly and severally) with another of the
F-29
Sally Beauty Holdings, Inc. and Subsidiaries
Notes to Consolidated Financial Statements (Continued)
Company’s indirect subsidiaries, Sally Capital Inc., issuing senior notes in an aggregate amount of$430.0 million and senior subordinated notes in an aggregate amount of $280.0 million. The Companyincurred approximately $58.5 million in costs related to the issuance of the debt, which was capitalized andis being amortized to interest expense over the life of the related debt instruments. Proceeds from theinitial debt were used primarily to pay the $25.00 per share special cash dividend to holders of record ofAlberto-Culver stockholders and for certain expenses associated with the Separation Transactions.
The ABL facility provides for senior secured revolving loans up to a maximum aggregate principal amountof $400.0 million, subject to borrowing base limitations. The availability of funds under the ABL facility issubject to a borrowing base calculation, which is based on specified percentages of the value of eligibleinventory and eligible accounts receivables, subject to certain reserves and other adjustments and reducedby certain outstanding letters of credit. At September 30, 2009, the Company had $325.6 million availablefor borrowing under the ABL facility. Additionally, the Company is required to pay a commitment feeranging from 0.20% to 0.35% on the unused portion of the ABL facility. At September 30, 2009, thecommitment fee rate was 0.20%.
The ABL facility contains a covenant requiring Sally Holdings and its subsidiaries to maintain a fixed-charge coverage ratio of at least 1.0 to 1.0 when availability under the ABL facility falls below$40.0 million. The fixed-charge coverage ratio is defined as the ratio of EBITDA (as defined in theagreement underlying the ABL facility, or Credit Agreement EBITDA) less unfinanced capitalexpenditures to fixed charges (as included in the definition of the fixed-charge coverage ratio in theagreement governing the ABL facility).
The senior term loan facilities consist of (i) a $150.0 million senior term loan A facility and (ii) a$920.0 million senior term loan B facility. Principal and interest is payable on a quarterly basis.
The Term Loans contain a covenant requiring Sally Holdings and its subsidiaries to meet certain maximumconsolidated secured leverage ratio levels, which decline over time. The consolidated secured leverageratio is a ratio of (A) net consolidated secured debt to (B) Consolidated EBITDA as defined in theagreement underlying the Term Loans. Compliance with the consolidated secured leverage ratio is testedquarterly, with a maximum ratio of 4.50 as of September 30, 2009. Failure to comply with the consolidatedsecured leverage ratio covenant under the Term Loans would result in a default under such facilities.
The senior term loan facilities and the ABL facility are secured by substantially all of our assets, those ofSally Investment Holdings LLC, a wholly-owned subsidiary of Sally Beauty and the direct parent of SallyHoldings, those of our domestic subsidiaries and, in the case of the ABL facility, those of our Canadiansubsidiaries. During the fiscal year ended September 30, 2009, the Company made scheduled payments inthe aggregate amount of $6.1 million on its senior term loans. The borrowings under the senior term loanfacilities may be prepaid at the option of Sally Holdings at any time without premium or penalty and aresubject to mandatory repayment in an amount equal to 50% of excess cash flow (as defined in theagreement governing the senior term loan facilities) for any fiscal year, unless a specified leverage ratio ismet. In January of 2009, the Company made a mandatory repayment on the senior term loans in theaggregate amount of $16.7 million and expects to make a mandatory repayment in the amount of$22.3 million in January of 2010. Amounts paid pursuant to said provision may be applied, at the option ofthe Company, against minimum loan repayments otherwise required of us over the twelve-month periodfollowing any such repayment under the terms of the loan agreement. Additionally, borrowings under theterm loan facility would be subject to mandatory repayment in an amount equal to 100% of the proceedsof specified asset sales that are not reinvested in the business or applied to repay borrowings under theABL facility. We believe that the Company is currently in compliance with the agreements and instrumentsgoverning our debt, including our financial covenants.
F-30
Sally Beauty Holdings, Inc. and Subsidiaries
Notes to Consolidated Financial Statements (Continued)
During the fiscal year ended September 30, 2009, the Company also made optional repayments in theaggregate amount of $45.0 million on its senior term loans. In addition, in May 2009, the Companyrepurchased $5.0 million in par value of its 10.5% senior subordinated notes (due in November of 2016)for approximately $5.0 million, plus accrued interest. In connection with the mandatory and optionalrepayments made during the fiscal year ended September 30, 2009, the Company recorded losses onextinguishment of debt in the aggregate amount of $1.0 million, which are included in net interest expensein the Company’s consolidated statements of earnings.
The senior notes and senior subordinated notes are unsecured obligations of the issuers and areguaranteed on a senior basis (in the case of the senior notes) and on a senior subordinated basis (in thecase of the senior subordinated notes) by each material domestic subsidiary of the Company. The seniornotes and the senior subordinated notes carry optional redemption features whereby the Company has theoption to redeem the notes on or before November 15, 2010 and November 15, 2011, respectively, at parplus a premium, plus accrued and unpaid interest, and on or after November 15, 2010 and November 15,2011, respectively, at par plus a premium declining ratably to par, plus accrued and unpaid interest.Interest on the senior notes and senior subordinated notes is payable semi-annually. Furthermore, theagreements underlying the Company’s credit facilities contain terms, which significantly restrict the abilityof Sally Beauty’s subsidiaries to pay dividends or otherwise transfer assets to Sally Beauty.
In November of 2006, the Company entered into four interest rate swap agreements with an aggregatenotional amount of $500.0 million in connection with its cash flow risk associated with changing interestrates related to its Term Loans. In May of 2008, the Company entered into two additional interest rateswap agreements with an aggregate notional amount of $300.0 million. Please see Note 14 for furtherinformation on the interest rate swap agreements.
Maturities of the Company’s long-term debt are as follows at September 30, 2009 (in thousands):
Fiscal Year:
2010 . . . . . . . . . . . . . . . . . . . . . . . . . . . . . . . . . . . . . . . . . . . . . . . . $ 24,2412011 . . . . . . . . . . . . . . . . . . . . . . . . . . . . . . . . . . . . . . . . . . . . . . . . 8,1882012 . . . . . . . . . . . . . . . . . . . . . . . . . . . . . . . . . . . . . . . . . . . . . . . . 75,3472013 . . . . . . . . . . . . . . . . . . . . . . . . . . . . . . . . . . . . . . . . . . . . . . . . 8,4542014 . . . . . . . . . . . . . . . . . . . . . . . . . . . . . . . . . . . . . . . . . . . . . . . . 855,761Thereafter . . . . . . . . . . . . . . . . . . . . . . . . . . . . . . . . . . . . . . . . . . . . 705,000
$1,676,991Capital leases and other . . . . . . . . . . . . . . . . . . . . . . . . . . . . . . . . . . . 539Less: current portion . . . . . . . . . . . . . . . . . . . . . . . . . . . . . . . . . . . . . . (24,517)
Total . . . . . . . . . . . . . . . . . . . . . . . . . . . . . . . . . . . . . . . . . . . . . . . . $1,653,013
F-31
Sally Beauty Holdings, Inc. and Subsidiaries
Notes to Consolidated Financial Statements (Continued)
We are a holding company and do not have any material assets or operations other than ownership ofequity interests of our subsidiaries. The agreements and instruments governing the debt of Sally Holdingsand its subsidiaries contain material limitations on their ability to pay dividends and other restrictedpayments to us which, in turn, constitute material limitations on our ability to pay dividends and otherpayments to our stockholders.
Under the agreements and indentures governing the term loan facilities and the notes, Sally Holdings maynot make certain restricted payments to us if a default then exists under the credit agreement or theindentures or if its consolidated interest coverage ratio is less than 2.0 to 1.0 at the time of the making ofsuch restricted payment. As of September 30, 2009, its consolidated interest coverage ratio exceeded 2.0 to1.0. Further, the aggregate amount of restricted payments it is able to make is limited pursuant to variousbaskets as calculated pursuant to the credit agreement and indentures.
The agreements governing our ABL facility generally permit the making of distributions and certain otherrestricted payments so long as borrowing availability under the facility equals or exceeds $60.0 million. Ifborrowing availability falls below this amount, Sally Holdings may nevertheless make restricted paymentsto us in the aggregate since the date of the Separation Transactions, together with the aggregate cashamount paid in acquisitions since said date, of not greater than $50.0 million, together with certain otherexceptions. As of September 30, 2009, borrowing availability under the ABL facility exceeded$60.0 million. As of September 30, 2009, the net assets of our consolidated subsidiaries that wereunrestricted from transfer under our credit arrangements totaled $225.3 million, subject to certainadjustments.
At September 30, 2009 and 2008, the Company had no off balance sheet financing arrangements otherthan operating leases incurred in the ordinary course of business as disclosed in Note 11, and outstandingletters of credit related to inventory purchases and self-insurance programs which totaled $13.4 million and$12.1 million at September 30, 2009 and 2008, respectively.
F-32
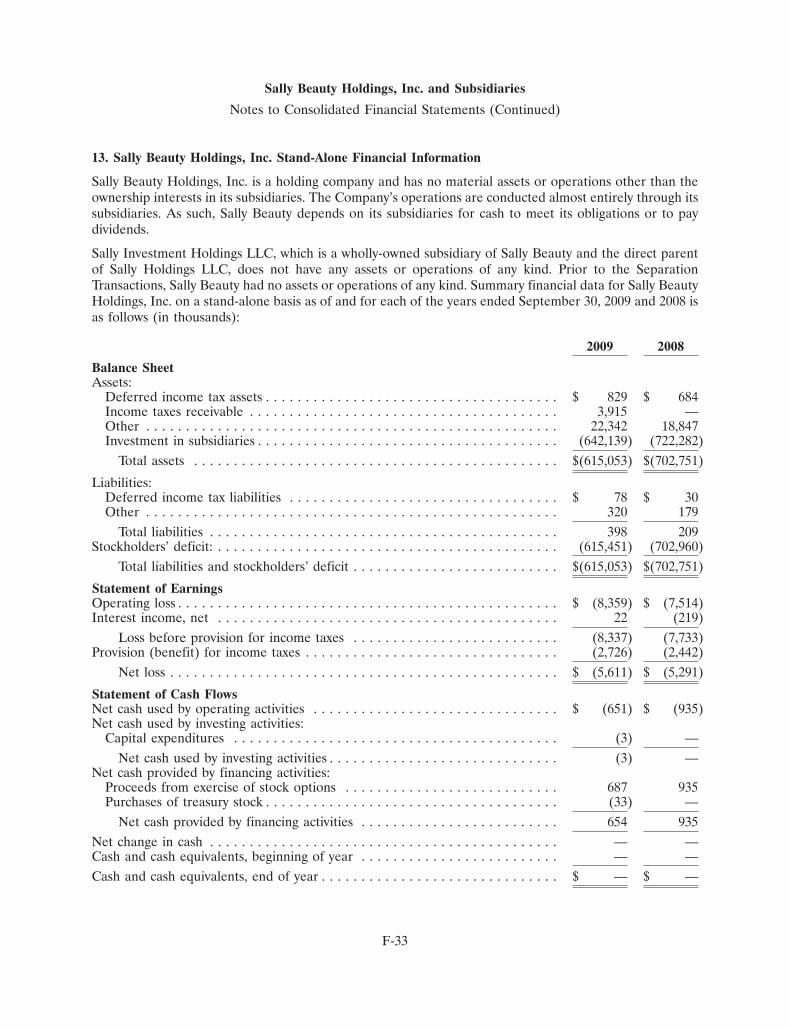
Sally Beauty Holdings, Inc. and Subsidiaries
Notes to Consolidated Financial Statements (Continued)
13. Sally Beauty Holdings, Inc. Stand-Alone Financial Information
Sally Beauty Holdings, Inc. is a holding company and has no material assets or operations other than theownership interests in its subsidiaries. The Company’s operations are conducted almost entirely through itssubsidiaries. As such, Sally Beauty depends on its subsidiaries for cash to meet its obligations or to paydividends.
Sally Investment Holdings LLC, which is a wholly-owned subsidiary of Sally Beauty and the direct parentof Sally Holdings LLC, does not have any assets or operations of any kind. Prior to the SeparationTransactions, Sally Beauty had no assets or operations of any kind. Summary financial data for Sally BeautyHoldings, Inc. on a stand-alone basis as of and for each of the years ended September 30, 2009 and 2008 isas follows (in thousands):
2009 2008
Balance SheetAssets:
Deferred income tax assets . . . . . . . . . . . . . . . . . . . . . . . . . . . . . . . . . . . . . $ 829 $ 684Income taxes receivable . . . . . . . . . . . . . . . . . . . . . . . . . . . . . . . . . . . . . . . 3,915 —Other . . . . . . . . . . . . . . . . . . . . . . . . . . . . . . . . . . . . . . . . . . . . . . . . . . . . 22,342 18,847Investment in subsidiaries . . . . . . . . . . . . . . . . . . . . . . . . . . . . . . . . . . . . . . (642,139) (722,282)
Total assets . . . . . . . . . . . . . . . . . . . . . . . . . . . . . . . . . . . . . . . . . . . . . . $(615,053) $(702,751)
Liabilities:Deferred income tax liabilities . . . . . . . . . . . . . . . . . . . . . . . . . . . . . . . . . . $ 78 $ 30Other . . . . . . . . . . . . . . . . . . . . . . . . . . . . . . . . . . . . . . . . . . . . . . . . . . . . 320 179
Total liabilities . . . . . . . . . . . . . . . . . . . . . . . . . . . . . . . . . . . . . . . . . . . . 398 209Stockholders’ deficit: . . . . . . . . . . . . . . . . . . . . . . . . . . . . . . . . . . . . . . . . . . . (615,451) (702,960)
Total liabilities and stockholders’ deficit . . . . . . . . . . . . . . . . . . . . . . . . . . $(615,053) $(702,751)
Statement of EarningsOperating loss . . . . . . . . . . . . . . . . . . . . . . . . . . . . . . . . . . . . . . . . . . . . . . . . $ (8,359) $ (7,514)Interest income, net . . . . . . . . . . . . . . . . . . . . . . . . . . . . . . . . . . . . . . . . . . . 22 (219)
Loss before provision for income taxes . . . . . . . . . . . . . . . . . . . . . . . . . . (8,337) (7,733)Provision (benefit) for income taxes . . . . . . . . . . . . . . . . . . . . . . . . . . . . . . . . (2,726) (2,442)
Net loss . . . . . . . . . . . . . . . . . . . . . . . . . . . . . . . . . . . . . . . . . . . . . . . . . $ (5,611) $ (5,291)
Statement of Cash FlowsNet cash used by operating activities . . . . . . . . . . . . . . . . . . . . . . . . . . . . . . . $ (651) $ (935)Net cash used by investing activities:
Capital expenditures . . . . . . . . . . . . . . . . . . . . . . . . . . . . . . . . . . . . . . . . . (3) —Net cash used by investing activities . . . . . . . . . . . . . . . . . . . . . . . . . . . . . (3) —
Net cash provided by financing activities:Proceeds from exercise of stock options . . . . . . . . . . . . . . . . . . . . . . . . . . . 687 935Purchases of treasury stock . . . . . . . . . . . . . . . . . . . . . . . . . . . . . . . . . . . . . (33) —
Net cash provided by financing activities . . . . . . . . . . . . . . . . . . . . . . . . . 654 935Net change in cash . . . . . . . . . . . . . . . . . . . . . . . . . . . . . . . . . . . . . . . . . . . . — —Cash and cash equivalents, beginning of year . . . . . . . . . . . . . . . . . . . . . . . . . — —Cash and cash equivalents, end of year . . . . . . . . . . . . . . . . . . . . . . . . . . . . . . $ — $ —
F-33
Sally Beauty Holdings, Inc. and Subsidiaries
Notes to Consolidated Financial Statements (Continued)
14. Interest Rate Swaps
The Company is exposed to a wide variety of risks, including risks arising from changing economicconditions. The Company manages its exposure to certain economic risks (including liquidity, credit riskand changes in interest rates) primarily (a) by closely managing its cash flows from operating and investingactivities and the amounts and sources of its debt obligations; (b) by assessing periodically thecreditworthiness of its business partners; and (c) through the use of interest rate swaps by Sally Holdings.The Company uses interest rate swaps, as part of its overall economic risk management strategy to addstability to the interest payments due in connection with its term loan obligations. Interest paymentsrelated to the term loans are impacted by changes in LIBOR. Interest rate swap agreements involve theperiodic receipt by Sally Holdings of amounts based on a variable rate in exchange for Sally Holdingsmaking payments based on a fixed rate over the term of the interest rate swap agreements, withoutexchange of the underlying notional amount. At September 30, 2009, the Company did not hold any otherderivative instruments or hold any derivative instruments for trading or speculative purposes.
Designated Cash Flow Hedges of Interest Rate Risk
In May of 2008, Sally Holdings entered into two interest rate swap agreements with an aggregate notionalamount of $300 million. These interest rate swap agreements expire in May of 2012 and are designated andqualify as effective cash flow hedges, in accordance with ASC 815. Accordingly, changes in the fair value ofderivatives designated and qualifying as cash flow hedges are recorded quarterly, net of income tax, inaccumulated other comprehensive (loss) income (‘‘OCI’’) until the hedged obligation is settled or the swapagreements expire, whichever is earlier. Any hedge ineffectiveness, as this term is used in ASC 815, isrecognized in net interest expense in our consolidated statements of earnings. No hedge ineffectiveness oncash flow hedges was recognized during the fiscal years ended September 30, 2009 and 2008.
Amounts reported in OCI related to interest rate swaps are reclassified into net interest expense, as a yieldadjustment, in the same period in which interest on the Company’s variable-rate debt obligations affectearnings. During the fiscal years ended September 30, 2009 and 2008, net interest expense of $7.9 millionand $1.2 million, respectively, resulted from such reclassifications. During the twelve months endingSeptember 30, 2010, the Company estimates that an additional $8.9 million of the amount reported in OCIwill be reclassified into interest expense.
Non-designated Cash Flow Hedges of Interest Rate Risk
Interest rate swaps not designated as hedges are used to manage the Company’s exposure to interest ratemovements but do not meet the hedge accounting requirements of ASC 815. In connection with theSeparation Transactions, in November 2006, Sally Holdings entered into four interest rate swapagreements with an aggregate notional amount of $500 million. Interest rate swap agreements with anaggregate notional amount of $150 million expired in November 2008 and interest rate swap agreementswith a notional amount of $350 million expire in November 2009. These interest rate swap agreements arenot designated as hedges and, accordingly, the changes in fair value of these interest rate swap agreements(which are adjusted quarterly) are recorded in net interest expense in our consolidated statements ofearnings. During the fiscal years ended September 30, 2009, 2008 and 2007, net interest expense of$7.5 million, $10.5 million and $1.2 million, respectively, resulted from interest rate swaps not designatedas hedges.
F-34
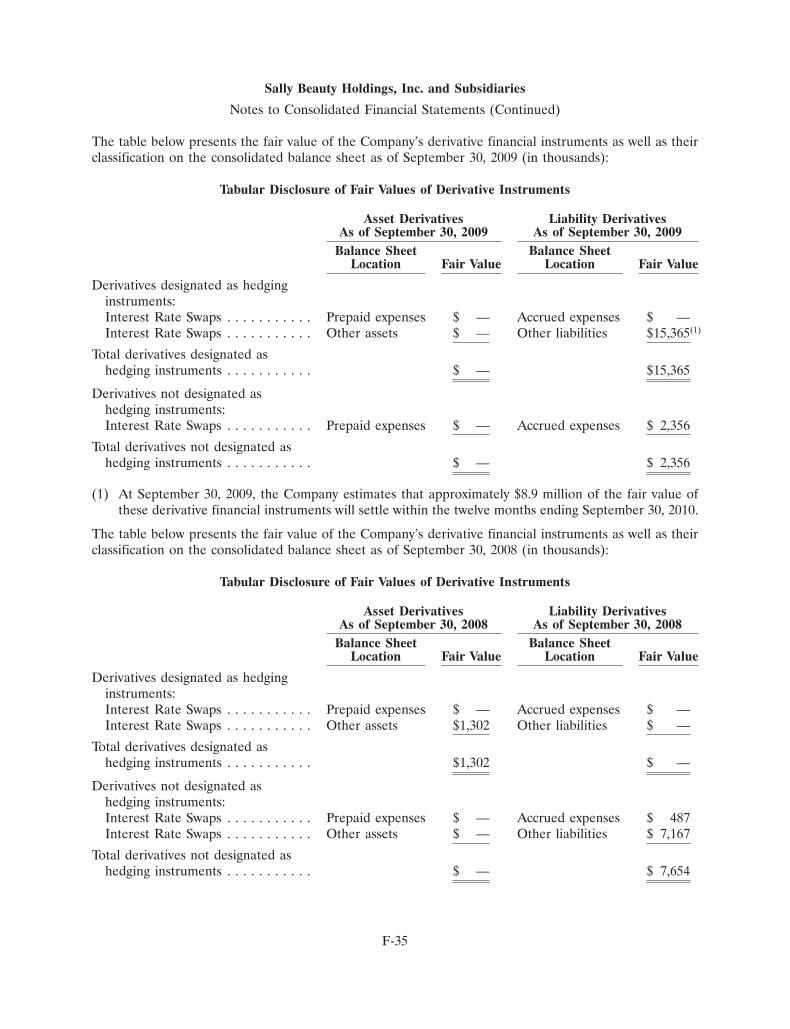
Sally Beauty Holdings, Inc. and Subsidiaries
Notes to Consolidated Financial Statements (Continued)
The table below presents the fair value of the Company’s derivative financial instruments as well as theirclassification on the consolidated balance sheet as of September 30, 2009 (in thousands):
Tabular Disclosure of Fair Values of Derivative Instruments
Asset Derivatives Liability DerivativesAs of September 30, 2009 As of September 30, 2009
Balance Sheet Balance SheetLocation Fair Value Location Fair Value
Derivatives designated as hedginginstruments:Interest Rate Swaps . . . . . . . . . . . Prepaid expenses $ — Accrued expenses $ —Interest Rate Swaps . . . . . . . . . . . Other assets $ — Other liabilities $15,365(1)
Total derivatives designated ashedging instruments . . . . . . . . . . . $ — $15,365
Derivatives not designated ashedging instruments:Interest Rate Swaps . . . . . . . . . . . Prepaid expenses $ — Accrued expenses $ 2,356
Total derivatives not designated ashedging instruments . . . . . . . . . . . $ — $ 2,356
(1) At September 30, 2009, the Company estimates that approximately $8.9 million of the fair value ofthese derivative financial instruments will settle within the twelve months ending September 30, 2010.
The table below presents the fair value of the Company’s derivative financial instruments as well as theirclassification on the consolidated balance sheet as of September 30, 2008 (in thousands):
Tabular Disclosure of Fair Values of Derivative Instruments
Asset Derivatives Liability DerivativesAs of September 30, 2008 As of September 30, 2008
Balance Sheet Balance SheetLocation Fair Value Location Fair Value
Derivatives designated as hedginginstruments:Interest Rate Swaps . . . . . . . . . . . Prepaid expenses $ — Accrued expenses $ —Interest Rate Swaps . . . . . . . . . . . Other assets $1,302 Other liabilities $ —
Total derivatives designated ashedging instruments . . . . . . . . . . . $1,302 $ —
Derivatives not designated ashedging instruments:Interest Rate Swaps . . . . . . . . . . . Prepaid expenses $ — Accrued expenses $ 487Interest Rate Swaps . . . . . . . . . . . Other assets $ — Other liabilities $ 7,167
Total derivatives not designated ashedging instruments . . . . . . . . . . . $ — $ 7,654
F-35
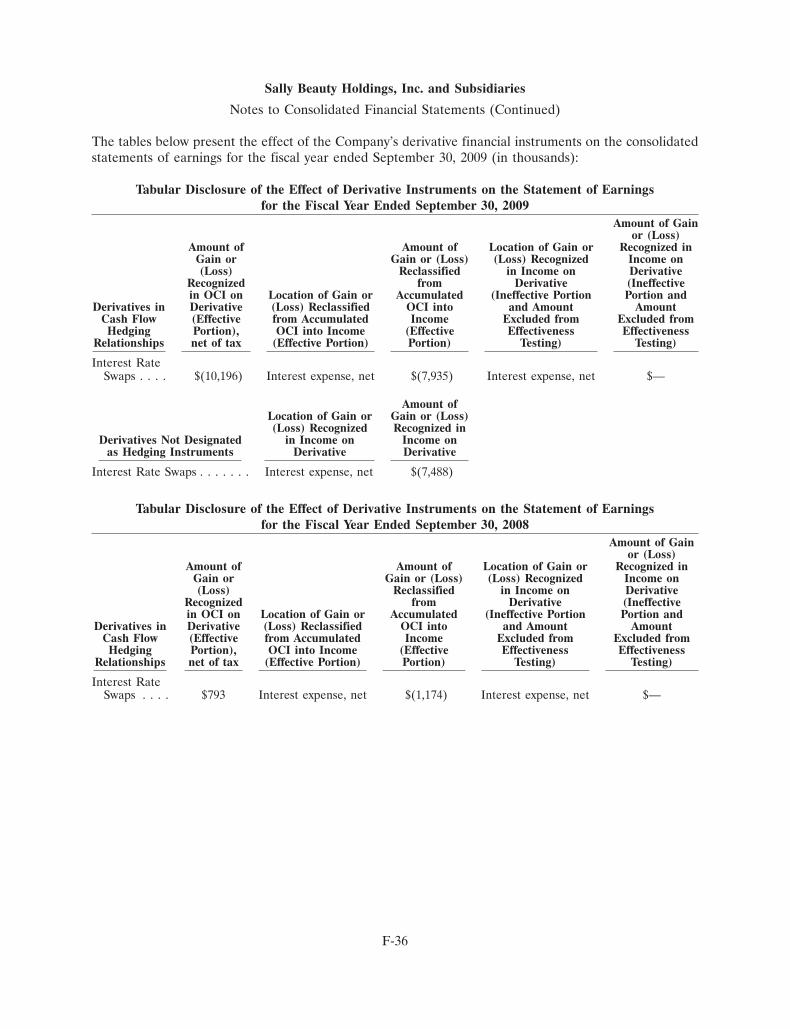
Sally Beauty Holdings, Inc. and Subsidiaries
Notes to Consolidated Financial Statements (Continued)
The tables below present the effect of the Company’s derivative financial instruments on the consolidatedstatements of earnings for the fiscal year ended September 30, 2009 (in thousands):
Tabular Disclosure of the Effect of Derivative Instruments on the Statement of Earningsfor the Fiscal Year Ended September 30, 2009
Amount of Gainor (Loss)
Amount of Amount of Location of Gain or Recognized inGain or Gain or (Loss) (Loss) Recognized Income on(Loss) Reclassified in Income on Derivative
Recognized from Derivative (Ineffectivein OCI on Location of Gain or Accumulated (Ineffective Portion Portion and
Derivatives in Derivative (Loss) Reclassified OCI into and Amount AmountCash Flow (Effective from Accumulated Income Excluded from Excluded fromHedging Portion), OCI into Income (Effective Effectiveness Effectiveness
Relationships net of tax (Effective Portion) Portion) Testing) Testing)
Interest RateSwaps . . . . $(10,196) Interest expense, net $(7,935) Interest expense, net $—
Amount ofLocation of Gain or Gain or (Loss)(Loss) Recognized Recognized in
Derivatives Not Designated in Income on Income onas Hedging Instruments Derivative Derivative
Interest Rate Swaps . . . . . . . Interest expense, net $(7,488)
Tabular Disclosure of the Effect of Derivative Instruments on the Statement of Earningsfor the Fiscal Year Ended September 30, 2008
Amount of Gainor (Loss)
Amount of Amount of Location of Gain or Recognized inGain or Gain or (Loss) (Loss) Recognized Income on(Loss) Reclassified in Income on Derivative
Recognized from Derivative (Ineffectivein OCI on Location of Gain or Accumulated (Ineffective Portion Portion and
Derivatives in Derivative (Loss) Reclassified OCI into and Amount AmountCash Flow (Effective from Accumulated Income Excluded from Excluded fromHedging Portion), OCI into Income (Effective Effectiveness Effectiveness
Relationships net of tax (Effective Portion) Portion) Testing) Testing)
Interest RateSwaps . . . . $793 Interest expense, net $(1,174) Interest expense, net $—
F-36
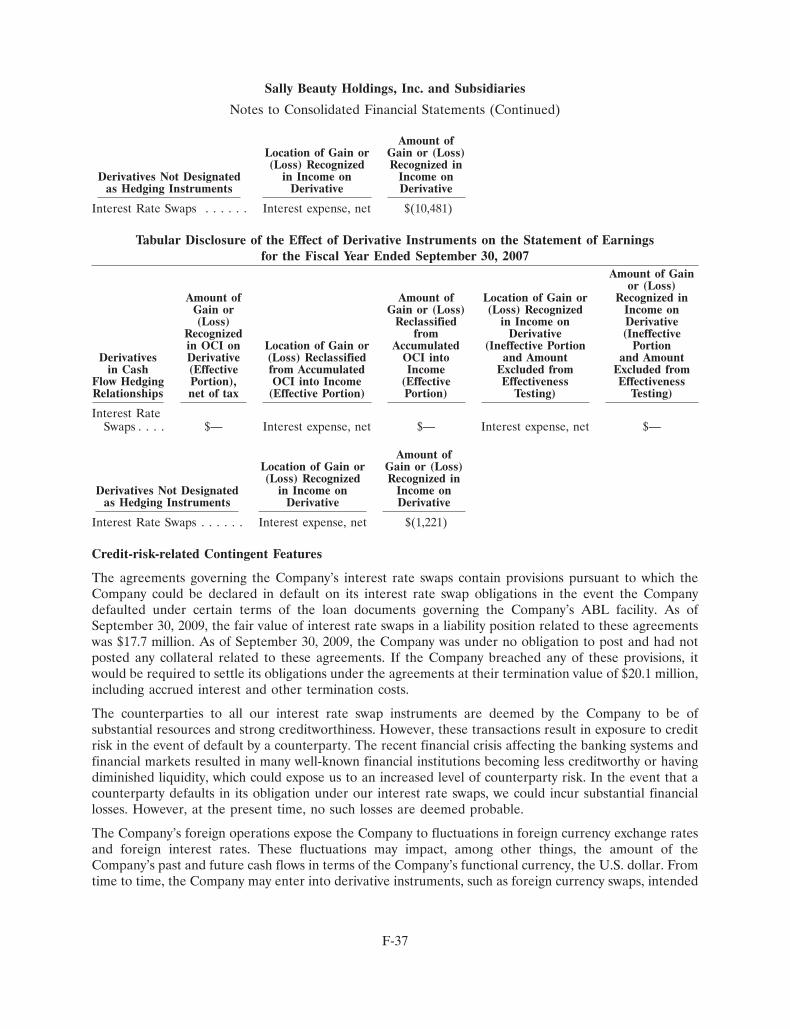
Sally Beauty Holdings, Inc. and Subsidiaries
Notes to Consolidated Financial Statements (Continued)
Amount ofLocation of Gain or Gain or (Loss)(Loss) Recognized Recognized in
Derivatives Not Designated in Income on Income onas Hedging Instruments Derivative Derivative
Interest Rate Swaps . . . . . . Interest expense, net $(10,481)
Tabular Disclosure of the Effect of Derivative Instruments on the Statement of Earningsfor the Fiscal Year Ended September 30, 2007
Amount of Gainor (Loss)
Amount of Amount of Location of Gain or Recognized inGain or Gain or (Loss) (Loss) Recognized Income on(Loss) Reclassified in Income on Derivative
Recognized from Derivative (Ineffectivein OCI on Location of Gain or Accumulated (Ineffective Portion Portion
Derivatives Derivative (Loss) Reclassified OCI into and Amount and Amountin Cash (Effective from Accumulated Income Excluded from Excluded from
Flow Hedging Portion), OCI into Income (Effective Effectiveness EffectivenessRelationships net of tax (Effective Portion) Portion) Testing) Testing)
Interest RateSwaps . . . . $— Interest expense, net $— Interest expense, net $—
Amount ofLocation of Gain or Gain or (Loss)(Loss) Recognized Recognized in
Derivatives Not Designated in Income on Income onas Hedging Instruments Derivative Derivative
Interest Rate Swaps . . . . . . Interest expense, net $(1,221)
Credit-risk-related Contingent Features
The agreements governing the Company’s interest rate swaps contain provisions pursuant to which theCompany could be declared in default on its interest rate swap obligations in the event the Companydefaulted under certain terms of the loan documents governing the Company’s ABL facility. As ofSeptember 30, 2009, the fair value of interest rate swaps in a liability position related to these agreementswas $17.7 million. As of September 30, 2009, the Company was under no obligation to post and had notposted any collateral related to these agreements. If the Company breached any of these provisions, itwould be required to settle its obligations under the agreements at their termination value of $20.1 million,including accrued interest and other termination costs.
The counterparties to all our interest rate swap instruments are deemed by the Company to be ofsubstantial resources and strong creditworthiness. However, these transactions result in exposure to creditrisk in the event of default by a counterparty. The recent financial crisis affecting the banking systems andfinancial markets resulted in many well-known financial institutions becoming less creditworthy or havingdiminished liquidity, which could expose us to an increased level of counterparty risk. In the event that acounterparty defaults in its obligation under our interest rate swaps, we could incur substantial financiallosses. However, at the present time, no such losses are deemed probable.
The Company’s foreign operations expose the Company to fluctuations in foreign currency exchange ratesand foreign interest rates. These fluctuations may impact, among other things, the amount of theCompany’s past and future cash flows in terms of the Company’s functional currency, the U.S. dollar. Fromtime to time, the Company may enter into derivative instruments, such as foreign currency swaps, intended
F-37
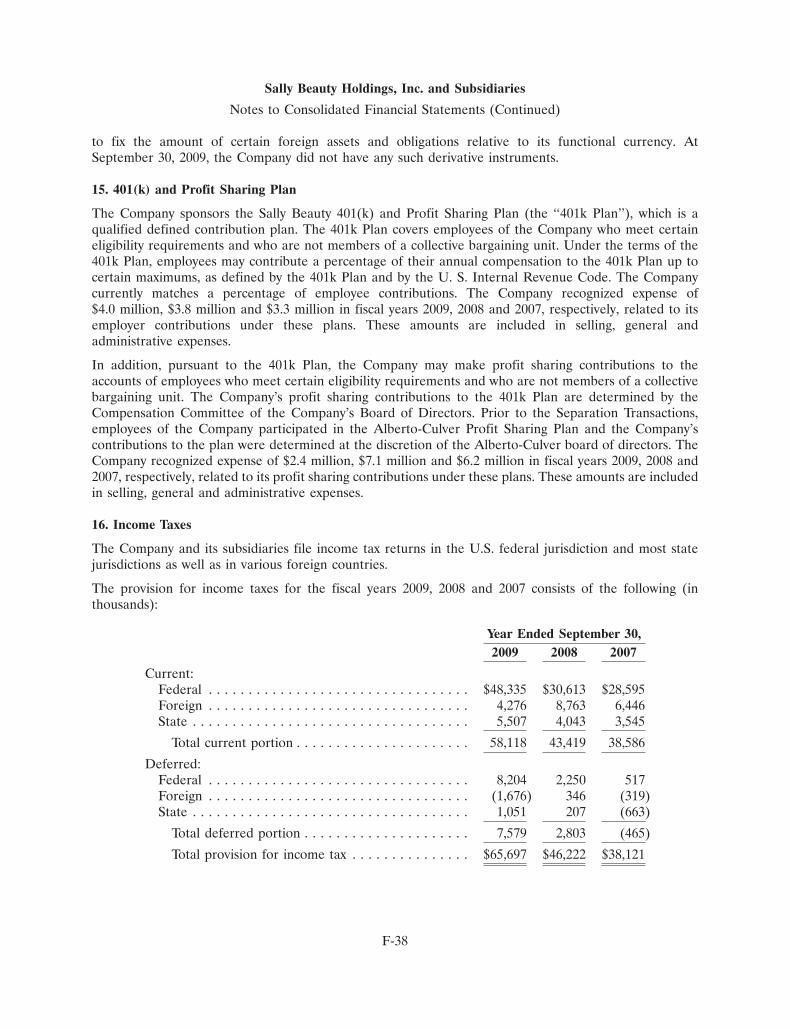
Sally Beauty Holdings, Inc. and Subsidiaries
Notes to Consolidated Financial Statements (Continued)
to fix the amount of certain foreign assets and obligations relative to its functional currency. AtSeptember 30, 2009, the Company did not have any such derivative instruments.
15. 401(k) and Profit Sharing Plan
The Company sponsors the Sally Beauty 401(k) and Profit Sharing Plan (the ‘‘401k Plan’’), which is aqualified defined contribution plan. The 401k Plan covers employees of the Company who meet certaineligibility requirements and who are not members of a collective bargaining unit. Under the terms of the401k Plan, employees may contribute a percentage of their annual compensation to the 401k Plan up tocertain maximums, as defined by the 401k Plan and by the U. S. Internal Revenue Code. The Companycurrently matches a percentage of employee contributions. The Company recognized expense of$4.0 million, $3.8 million and $3.3 million in fiscal years 2009, 2008 and 2007, respectively, related to itsemployer contributions under these plans. These amounts are included in selling, general andadministrative expenses.
In addition, pursuant to the 401k Plan, the Company may make profit sharing contributions to theaccounts of employees who meet certain eligibility requirements and who are not members of a collectivebargaining unit. The Company’s profit sharing contributions to the 401k Plan are determined by theCompensation Committee of the Company’s Board of Directors. Prior to the Separation Transactions,employees of the Company participated in the Alberto-Culver Profit Sharing Plan and the Company’scontributions to the plan were determined at the discretion of the Alberto-Culver board of directors. TheCompany recognized expense of $2.4 million, $7.1 million and $6.2 million in fiscal years 2009, 2008 and2007, respectively, related to its profit sharing contributions under these plans. These amounts are includedin selling, general and administrative expenses.
16. Income Taxes
The Company and its subsidiaries file income tax returns in the U.S. federal jurisdiction and most statejurisdictions as well as in various foreign countries.
The provision for income taxes for the fiscal years 2009, 2008 and 2007 consists of the following (inthousands):
Year Ended September 30,2009 2008 2007
Current:Federal . . . . . . . . . . . . . . . . . . . . . . . . . . . . . . . . . $48,335 $30,613 $28,595Foreign . . . . . . . . . . . . . . . . . . . . . . . . . . . . . . . . . 4,276 8,763 6,446State . . . . . . . . . . . . . . . . . . . . . . . . . . . . . . . . . . . 5,507 4,043 3,545
Total current portion . . . . . . . . . . . . . . . . . . . . . . 58,118 43,419 38,586
Deferred:Federal . . . . . . . . . . . . . . . . . . . . . . . . . . . . . . . . . 8,204 2,250 517Foreign . . . . . . . . . . . . . . . . . . . . . . . . . . . . . . . . . (1,676) 346 (319)State . . . . . . . . . . . . . . . . . . . . . . . . . . . . . . . . . . . 1,051 207 (663)
Total deferred portion . . . . . . . . . . . . . . . . . . . . . 7,579 2,803 (465)
Total provision for income tax . . . . . . . . . . . . . . . $65,697 $46,222 $38,121
F-38
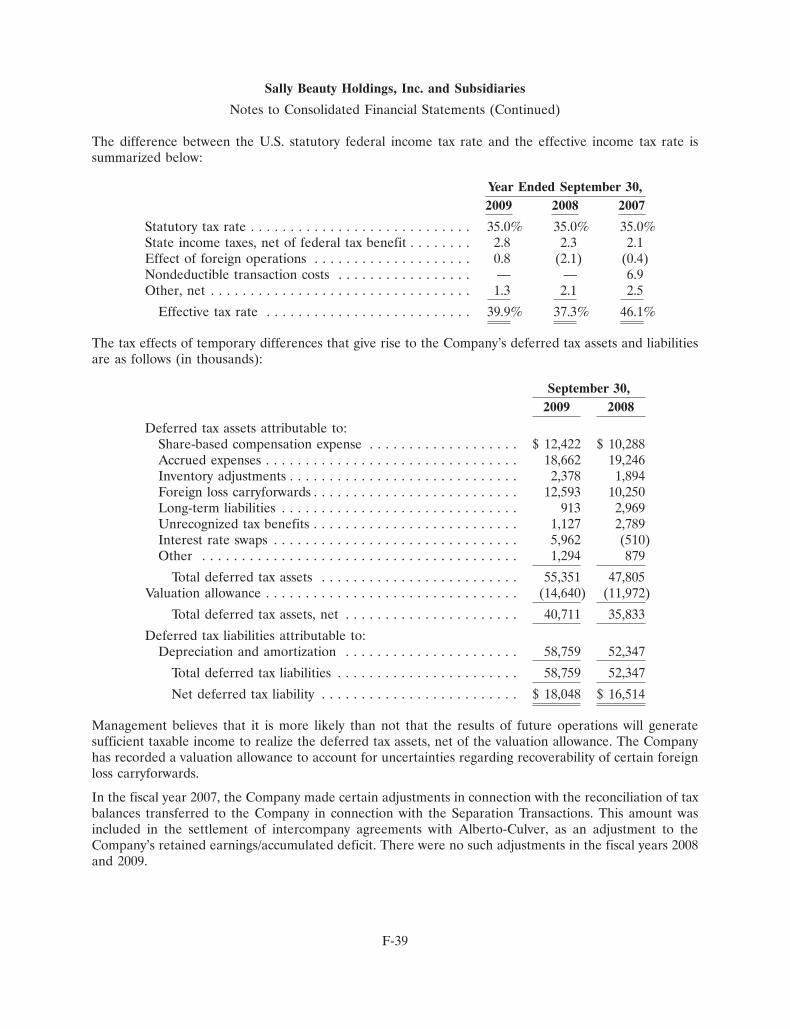
Sally Beauty Holdings, Inc. and Subsidiaries
Notes to Consolidated Financial Statements (Continued)
The difference between the U.S. statutory federal income tax rate and the effective income tax rate issummarized below:
Year Ended September 30,2009 2008 2007
Statutory tax rate . . . . . . . . . . . . . . . . . . . . . . . . . . . . 35.0% 35.0% 35.0%State income taxes, net of federal tax benefit . . . . . . . . 2.8 2.3 2.1Effect of foreign operations . . . . . . . . . . . . . . . . . . . . 0.8 (2.1) (0.4)Nondeductible transaction costs . . . . . . . . . . . . . . . . . — — 6.9Other, net . . . . . . . . . . . . . . . . . . . . . . . . . . . . . . . . . 1.3 2.1 2.5
Effective tax rate . . . . . . . . . . . . . . . . . . . . . . . . . . 39.9% 37.3% 46.1%
The tax effects of temporary differences that give rise to the Company’s deferred tax assets and liabilitiesare as follows (in thousands):
September 30,2009 2008
Deferred tax assets attributable to:Share-based compensation expense . . . . . . . . . . . . . . . . . . . $ 12,422 $ 10,288Accrued expenses . . . . . . . . . . . . . . . . . . . . . . . . . . . . . . . . 18,662 19,246Inventory adjustments . . . . . . . . . . . . . . . . . . . . . . . . . . . . . 2,378 1,894Foreign loss carryforwards . . . . . . . . . . . . . . . . . . . . . . . . . . 12,593 10,250Long-term liabilities . . . . . . . . . . . . . . . . . . . . . . . . . . . . . . 913 2,969Unrecognized tax benefits . . . . . . . . . . . . . . . . . . . . . . . . . . 1,127 2,789Interest rate swaps . . . . . . . . . . . . . . . . . . . . . . . . . . . . . . . 5,962 (510)Other . . . . . . . . . . . . . . . . . . . . . . . . . . . . . . . . . . . . . . . . 1,294 879
Total deferred tax assets . . . . . . . . . . . . . . . . . . . . . . . . . 55,351 47,805Valuation allowance . . . . . . . . . . . . . . . . . . . . . . . . . . . . . . . . (14,640) (11,972)
Total deferred tax assets, net . . . . . . . . . . . . . . . . . . . . . . 40,711 35,833
Deferred tax liabilities attributable to:Depreciation and amortization . . . . . . . . . . . . . . . . . . . . . . 58,759 52,347
Total deferred tax liabilities . . . . . . . . . . . . . . . . . . . . . . . 58,759 52,347
Net deferred tax liability . . . . . . . . . . . . . . . . . . . . . . . . . $ 18,048 $ 16,514
Management believes that it is more likely than not that the results of future operations will generatesufficient taxable income to realize the deferred tax assets, net of the valuation allowance. The Companyhas recorded a valuation allowance to account for uncertainties regarding recoverability of certain foreignloss carryforwards.
In the fiscal year 2007, the Company made certain adjustments in connection with the reconciliation of taxbalances transferred to the Company in connection with the Separation Transactions. This amount wasincluded in the settlement of intercompany agreements with Alberto-Culver, as an adjustment to theCompany’s retained earnings/accumulated deficit. There were no such adjustments in the fiscal years 2008and 2009.
F-39
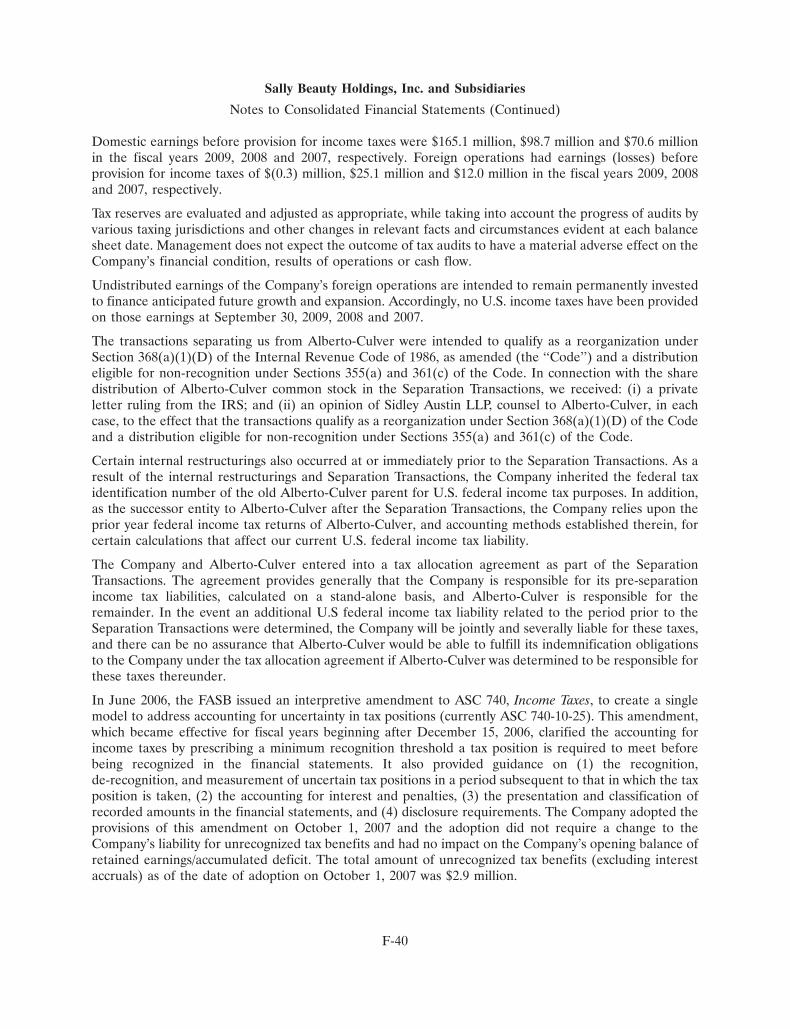
Sally Beauty Holdings, Inc. and Subsidiaries
Notes to Consolidated Financial Statements (Continued)
Domestic earnings before provision for income taxes were $165.1 million, $98.7 million and $70.6 millionin the fiscal years 2009, 2008 and 2007, respectively. Foreign operations had earnings (losses) beforeprovision for income taxes of $(0.3) million, $25.1 million and $12.0 million in the fiscal years 2009, 2008and 2007, respectively.
Tax reserves are evaluated and adjusted as appropriate, while taking into account the progress of audits byvarious taxing jurisdictions and other changes in relevant facts and circumstances evident at each balancesheet date. Management does not expect the outcome of tax audits to have a material adverse effect on theCompany’s financial condition, results of operations or cash flow.
Undistributed earnings of the Company’s foreign operations are intended to remain permanently investedto finance anticipated future growth and expansion. Accordingly, no U.S. income taxes have been providedon those earnings at September 30, 2009, 2008 and 2007.
The transactions separating us from Alberto-Culver were intended to qualify as a reorganization underSection 368(a)(1)(D) of the Internal Revenue Code of 1986, as amended (the ‘‘Code’’) and a distributioneligible for non-recognition under Sections 355(a) and 361(c) of the Code. In connection with the sharedistribution of Alberto-Culver common stock in the Separation Transactions, we received: (i) a privateletter ruling from the IRS; and (ii) an opinion of Sidley Austin LLP, counsel to Alberto-Culver, in eachcase, to the effect that the transactions qualify as a reorganization under Section 368(a)(1)(D) of the Codeand a distribution eligible for non-recognition under Sections 355(a) and 361(c) of the Code.
Certain internal restructurings also occurred at or immediately prior to the Separation Transactions. As aresult of the internal restructurings and Separation Transactions, the Company inherited the federal taxidentification number of the old Alberto-Culver parent for U.S. federal income tax purposes. In addition,as the successor entity to Alberto-Culver after the Separation Transactions, the Company relies upon theprior year federal income tax returns of Alberto-Culver, and accounting methods established therein, forcertain calculations that affect our current U.S. federal income tax liability.
The Company and Alberto-Culver entered into a tax allocation agreement as part of the SeparationTransactions. The agreement provides generally that the Company is responsible for its pre-separationincome tax liabilities, calculated on a stand-alone basis, and Alberto-Culver is responsible for theremainder. In the event an additional U.S federal income tax liability related to the period prior to theSeparation Transactions were determined, the Company will be jointly and severally liable for these taxes,and there can be no assurance that Alberto-Culver would be able to fulfill its indemnification obligationsto the Company under the tax allocation agreement if Alberto-Culver was determined to be responsible forthese taxes thereunder.
In June 2006, the FASB issued an interpretive amendment to ASC 740, Income Taxes, to create a singlemodel to address accounting for uncertainty in tax positions (currently ASC 740-10-25). This amendment,which became effective for fiscal years beginning after December 15, 2006, clarified the accounting forincome taxes by prescribing a minimum recognition threshold a tax position is required to meet beforebeing recognized in the financial statements. It also provided guidance on (1) the recognition,de-recognition, and measurement of uncertain tax positions in a period subsequent to that in which the taxposition is taken, (2) the accounting for interest and penalties, (3) the presentation and classification ofrecorded amounts in the financial statements, and (4) disclosure requirements. The Company adopted theprovisions of this amendment on October 1, 2007 and the adoption did not require a change to theCompany’s liability for unrecognized tax benefits and had no impact on the Company’s opening balance ofretained earnings/accumulated deficit. The total amount of unrecognized tax benefits (excluding interestaccruals) as of the date of adoption on October 1, 2007 was $2.9 million.
F-40
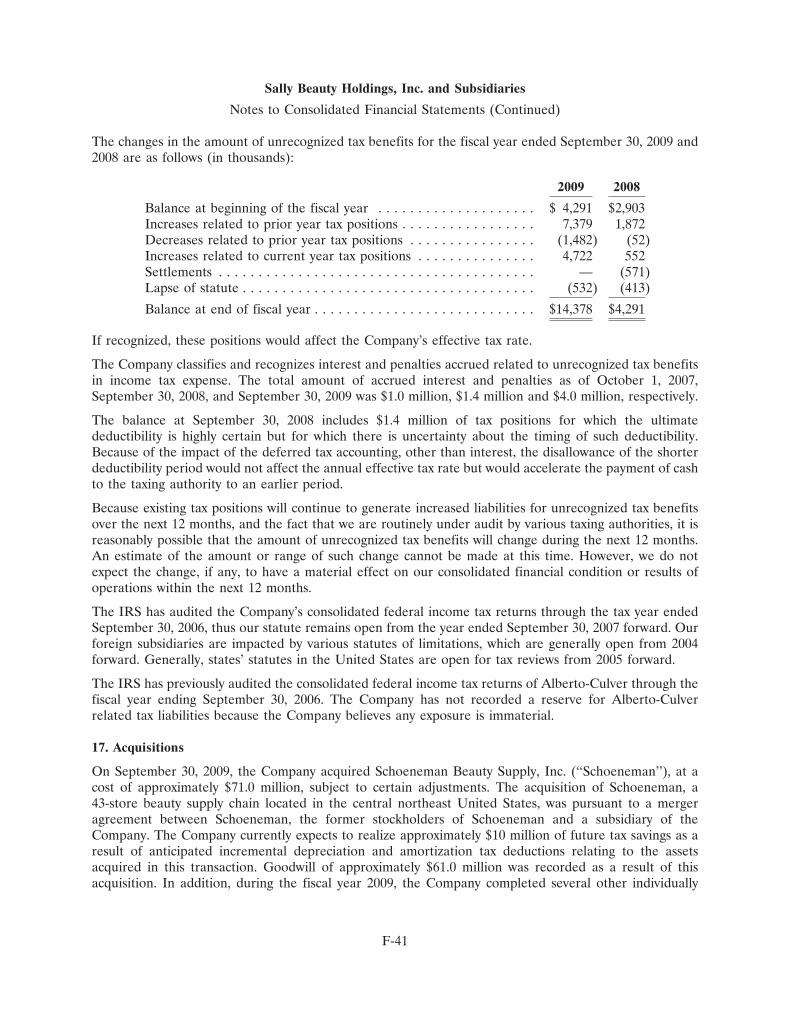
Sally Beauty Holdings, Inc. and Subsidiaries
Notes to Consolidated Financial Statements (Continued)
The changes in the amount of unrecognized tax benefits for the fiscal year ended September 30, 2009 and2008 are as follows (in thousands):
2009 2008
Balance at beginning of the fiscal year . . . . . . . . . . . . . . . . . . . . $ 4,291 $2,903Increases related to prior year tax positions . . . . . . . . . . . . . . . . . 7,379 1,872Decreases related to prior year tax positions . . . . . . . . . . . . . . . . (1,482) (52)Increases related to current year tax positions . . . . . . . . . . . . . . . 4,722 552Settlements . . . . . . . . . . . . . . . . . . . . . . . . . . . . . . . . . . . . . . . . — (571)Lapse of statute . . . . . . . . . . . . . . . . . . . . . . . . . . . . . . . . . . . . . (532) (413)
Balance at end of fiscal year . . . . . . . . . . . . . . . . . . . . . . . . . . . . $14,378 $4,291
If recognized, these positions would affect the Company’s effective tax rate.
The Company classifies and recognizes interest and penalties accrued related to unrecognized tax benefitsin income tax expense. The total amount of accrued interest and penalties as of October 1, 2007,September 30, 2008, and September 30, 2009 was $1.0 million, $1.4 million and $4.0 million, respectively.
The balance at September 30, 2008 includes $1.4 million of tax positions for which the ultimatedeductibility is highly certain but for which there is uncertainty about the timing of such deductibility.Because of the impact of the deferred tax accounting, other than interest, the disallowance of the shorterdeductibility period would not affect the annual effective tax rate but would accelerate the payment of cashto the taxing authority to an earlier period.
Because existing tax positions will continue to generate increased liabilities for unrecognized tax benefitsover the next 12 months, and the fact that we are routinely under audit by various taxing authorities, it isreasonably possible that the amount of unrecognized tax benefits will change during the next 12 months.An estimate of the amount or range of such change cannot be made at this time. However, we do notexpect the change, if any, to have a material effect on our consolidated financial condition or results ofoperations within the next 12 months.
The IRS has audited the Company’s consolidated federal income tax returns through the tax year endedSeptember 30, 2006, thus our statute remains open from the year ended September 30, 2007 forward. Ourforeign subsidiaries are impacted by various statutes of limitations, which are generally open from 2004forward. Generally, states’ statutes in the United States are open for tax reviews from 2005 forward.
The IRS has previously audited the consolidated federal income tax returns of Alberto-Culver through thefiscal year ending September 30, 2006. The Company has not recorded a reserve for Alberto-Culverrelated tax liabilities because the Company believes any exposure is immaterial.
17. Acquisitions
On September 30, 2009, the Company acquired Schoeneman Beauty Supply, Inc. (‘‘Schoeneman’’), at acost of approximately $71.0 million, subject to certain adjustments. The acquisition of Schoeneman, a43-store beauty supply chain located in the central northeast United States, was pursuant to a mergeragreement between Schoeneman, the former stockholders of Schoeneman and a subsidiary of theCompany. The Company currently expects to realize approximately $10 million of future tax savings as aresult of anticipated incremental depreciation and amortization tax deductions relating to the assetsacquired in this transaction. Goodwill of approximately $61.0 million was recorded as a result of thisacquisition. In addition, during the fiscal year 2009, the Company completed several other individually
F-41
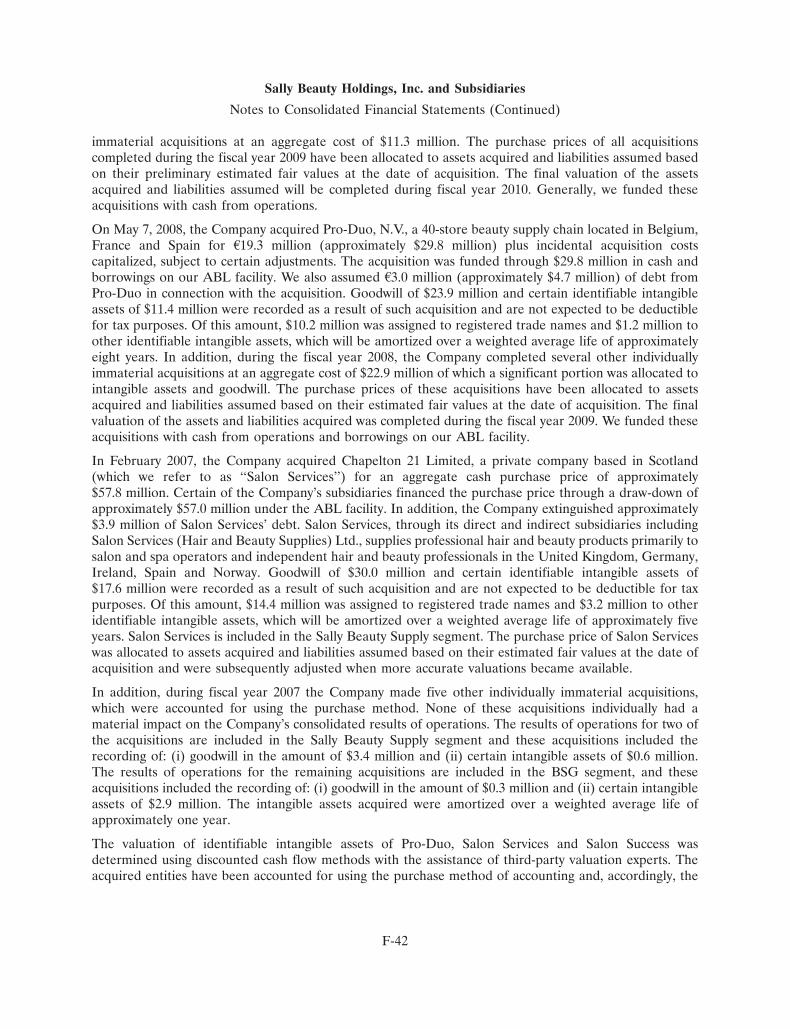
Sally Beauty Holdings, Inc. and Subsidiaries
Notes to Consolidated Financial Statements (Continued)
immaterial acquisitions at an aggregate cost of $11.3 million. The purchase prices of all acquisitionscompleted during the fiscal year 2009 have been allocated to assets acquired and liabilities assumed basedon their preliminary estimated fair values at the date of acquisition. The final valuation of the assetsacquired and liabilities assumed will be completed during fiscal year 2010. Generally, we funded theseacquisitions with cash from operations.
On May 7, 2008, the Company acquired Pro-Duo, N.V., a 40-store beauty supply chain located in Belgium,France and Spain for A19.3 million (approximately $29.8 million) plus incidental acquisition costscapitalized, subject to certain adjustments. The acquisition was funded through $29.8 million in cash andborrowings on our ABL facility. We also assumed A3.0 million (approximately $4.7 million) of debt fromPro-Duo in connection with the acquisition. Goodwill of $23.9 million and certain identifiable intangibleassets of $11.4 million were recorded as a result of such acquisition and are not expected to be deductiblefor tax purposes. Of this amount, $10.2 million was assigned to registered trade names and $1.2 million toother identifiable intangible assets, which will be amortized over a weighted average life of approximatelyeight years. In addition, during the fiscal year 2008, the Company completed several other individuallyimmaterial acquisitions at an aggregate cost of $22.9 million of which a significant portion was allocated tointangible assets and goodwill. The purchase prices of these acquisitions have been allocated to assetsacquired and liabilities assumed based on their estimated fair values at the date of acquisition. The finalvaluation of the assets and liabilities acquired was completed during the fiscal year 2009. We funded theseacquisitions with cash from operations and borrowings on our ABL facility.
In February 2007, the Company acquired Chapelton 21 Limited, a private company based in Scotland(which we refer to as ‘‘Salon Services’’) for an aggregate cash purchase price of approximately$57.8 million. Certain of the Company’s subsidiaries financed the purchase price through a draw-down ofapproximately $57.0 million under the ABL facility. In addition, the Company extinguished approximately$3.9 million of Salon Services’ debt. Salon Services, through its direct and indirect subsidiaries includingSalon Services (Hair and Beauty Supplies) Ltd., supplies professional hair and beauty products primarily tosalon and spa operators and independent hair and beauty professionals in the United Kingdom, Germany,Ireland, Spain and Norway. Goodwill of $30.0 million and certain identifiable intangible assets of$17.6 million were recorded as a result of such acquisition and are not expected to be deductible for taxpurposes. Of this amount, $14.4 million was assigned to registered trade names and $3.2 million to otheridentifiable intangible assets, which will be amortized over a weighted average life of approximately fiveyears. Salon Services is included in the Sally Beauty Supply segment. The purchase price of Salon Serviceswas allocated to assets acquired and liabilities assumed based on their estimated fair values at the date ofacquisition and were subsequently adjusted when more accurate valuations became available.
In addition, during fiscal year 2007 the Company made five other individually immaterial acquisitions,which were accounted for using the purchase method. None of these acquisitions individually had amaterial impact on the Company’s consolidated results of operations. The results of operations for two ofthe acquisitions are included in the Sally Beauty Supply segment and these acquisitions included therecording of: (i) goodwill in the amount of $3.4 million and (ii) certain intangible assets of $0.6 million.The results of operations for the remaining acquisitions are included in the BSG segment, and theseacquisitions included the recording of: (i) goodwill in the amount of $0.3 million and (ii) certain intangibleassets of $2.9 million. The intangible assets acquired were amortized over a weighted average life ofapproximately one year.
The valuation of identifiable intangible assets of Pro-Duo, Salon Services and Salon Success wasdetermined using discounted cash flow methods with the assistance of third-party valuation experts. Theacquired entities have been accounted for using the purchase method of accounting and, accordingly, the
F-42
Sally Beauty Holdings, Inc. and Subsidiaries
Notes to Consolidated Financial Statements (Continued)
results of operations of the entities have been included in the consolidated financial statements since theirrespective dates of acquisition.
18. Related Party Transactions
In connection with the Separation Transactions, the Company terminated substantially all intercompanyagreements with Alberto-Culver and its subsidiaries. All intercompany receivables, payables and loansbetween the Company, on the one hand, and Alberto-Culver and its subsidiaries, on the other hand, otherthan those specifically designated to survive following the Separation Transactions, were cancelled. Inaddition, the Company became the parent company for all U.S. tax returns which were filed under theemployer identification number of Alberto-Culver prior to the completion of the Separation Transactions.
Prior to the Separation Transactions, the Company purchased inventory and conducted business with,and/or had transactions with, Alberto-Culver and its subsidiaries. In fiscal year 2007, the Companypurchased inventory from Alberto-Culver of approximately $3.7 million.
Alberto-Culver and its affiliates performed certain administrative services for the Company and incurredcertain direct expenses on behalf of the Company prior to the Separation Transactions. Costs for certainadministrative services and other corporate functions and direct expenses incurred on behalf of theCompany were allocated by Alberto-Culver to the Company and totaled $1.0 million in fiscal year 2007.These amounts are included in selling, general and administrative expenses in the consolidated statementsof earnings and are classified as part of unallocated expenses for the Company’s segment reportingpurposes.
Alberto-Culver also charged the Company a sales-based service fee under the consulting, businessdevelopment and advisory services agreement between Alberto-Culver and certain subsidiaries of theCompany. The sales-based service fees totaled $3.8 million in fiscal year 2007. Management believes thathad the Company been operating as a stand-alone entity not affiliated with Alberto-Culver during all offiscal year 2007, the Company likely would not have needed to engage any third party or incur additionalcosts as a stand-alone company for the services provided to its subsidiaries under these agreements.
The Company also had an agreement with Alberto-Culver that required the Company to make equitydistributions to Alberto-Culver whenever employees of the Company exercised Alberto-Culver stockoptions. During fiscal year 2007, the Company paid $4.8 million to Alberto-Culver in connection with thisagreement.
19. Business Segments and Geographic Area Information
The Company’s business is organized into two separate segments: (i) Sally Beauty Supply, a domestic andinternational chain of cash and carry retail stores, which offers professional beauty supplies to both salonprofessionals and retail customers; and (ii) BSG, a full service beauty supply distributor, which offersprofessional brands of beauty products directly to salons through its own sales force and professional onlystores in certain exclusive geographical territories primarily in North and South America and parts ofEurope.
In connection with the Separation Transactions, in the fiscal year 2007 the Company’s managementevaluated the structure of its internal organization to identify and separate the costs incurred at thecorporate level from the business units, as well as costs incurred that benefit both the Sally Beauty Supplyand BSG segments. Accordingly, management defined its reportable segments as Sally Beauty Supply andBSG, to report these segments separately from the Company’s shared corporate expenses, and revised thecomparable prior years for comparability purposes.
The accounting policies of both of our business segments are the same as described in the summary ofsignificant accounting policies in Note 2. Sales between segments, which were eliminated in consolidation,were not material for the fiscal years ended September 30, 2009, 2008 and 2007.
F-43
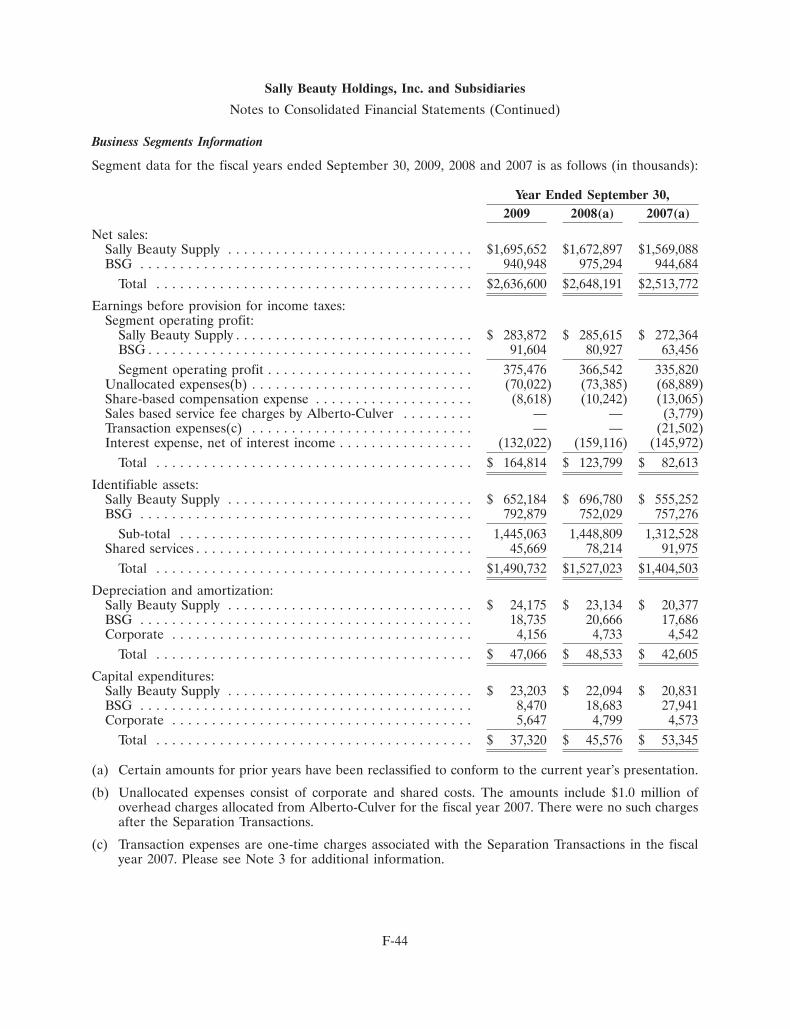
Sally Beauty Holdings, Inc. and Subsidiaries
Notes to Consolidated Financial Statements (Continued)
Business Segments Information
Segment data for the fiscal years ended September 30, 2009, 2008 and 2007 is as follows (in thousands):
Year Ended September 30,2009 2008(a) 2007(a)
Net sales:Sally Beauty Supply . . . . . . . . . . . . . . . . . . . . . . . . . . . . . . . $1,695,652 $1,672,897 $1,569,088BSG . . . . . . . . . . . . . . . . . . . . . . . . . . . . . . . . . . . . . . . . . . 940,948 975,294 944,684
Total . . . . . . . . . . . . . . . . . . . . . . . . . . . . . . . . . . . . . . . . $2,636,600 $2,648,191 $2,513,772
Earnings before provision for income taxes:Segment operating profit:
Sally Beauty Supply . . . . . . . . . . . . . . . . . . . . . . . . . . . . . . $ 283,872 $ 285,615 $ 272,364BSG . . . . . . . . . . . . . . . . . . . . . . . . . . . . . . . . . . . . . . . . . 91,604 80,927 63,456Segment operating profit . . . . . . . . . . . . . . . . . . . . . . . . . . 375,476 366,542 335,820
Unallocated expenses(b) . . . . . . . . . . . . . . . . . . . . . . . . . . . . (70,022) (73,385) (68,889)Share-based compensation expense . . . . . . . . . . . . . . . . . . . . (8,618) (10,242) (13,065)Sales based service fee charges by Alberto-Culver . . . . . . . . . — — (3,779)Transaction expenses(c) . . . . . . . . . . . . . . . . . . . . . . . . . . . . — — (21,502)Interest expense, net of interest income . . . . . . . . . . . . . . . . . (132,022) (159,116) (145,972)
Total . . . . . . . . . . . . . . . . . . . . . . . . . . . . . . . . . . . . . . . . $ 164,814 $ 123,799 $ 82,613
Identifiable assets:Sally Beauty Supply . . . . . . . . . . . . . . . . . . . . . . . . . . . . . . . $ 652,184 $ 696,780 $ 555,252BSG . . . . . . . . . . . . . . . . . . . . . . . . . . . . . . . . . . . . . . . . . . 792,879 752,029 757,276
Sub-total . . . . . . . . . . . . . . . . . . . . . . . . . . . . . . . . . . . . . 1,445,063 1,448,809 1,312,528Shared services . . . . . . . . . . . . . . . . . . . . . . . . . . . . . . . . . . . 45,669 78,214 91,975
Total . . . . . . . . . . . . . . . . . . . . . . . . . . . . . . . . . . . . . . . . $1,490,732 $1,527,023 $1,404,503
Depreciation and amortization:Sally Beauty Supply . . . . . . . . . . . . . . . . . . . . . . . . . . . . . . . $ 24,175 $ 23,134 $ 20,377BSG . . . . . . . . . . . . . . . . . . . . . . . . . . . . . . . . . . . . . . . . . . 18,735 20,666 17,686Corporate . . . . . . . . . . . . . . . . . . . . . . . . . . . . . . . . . . . . . . 4,156 4,733 4,542
Total . . . . . . . . . . . . . . . . . . . . . . . . . . . . . . . . . . . . . . . . $ 47,066 $ 48,533 $ 42,605
Capital expenditures:Sally Beauty Supply . . . . . . . . . . . . . . . . . . . . . . . . . . . . . . . $ 23,203 $ 22,094 $ 20,831BSG . . . . . . . . . . . . . . . . . . . . . . . . . . . . . . . . . . . . . . . . . . 8,470 18,683 27,941Corporate . . . . . . . . . . . . . . . . . . . . . . . . . . . . . . . . . . . . . . 5,647 4,799 4,573
Total . . . . . . . . . . . . . . . . . . . . . . . . . . . . . . . . . . . . . . . . $ 37,320 $ 45,576 $ 53,345
(a) Certain amounts for prior years have been reclassified to conform to the current year’s presentation.
(b) Unallocated expenses consist of corporate and shared costs. The amounts include $1.0 million ofoverhead charges allocated from Alberto-Culver for the fiscal year 2007. There were no such chargesafter the Separation Transactions.
(c) Transaction expenses are one-time charges associated with the Separation Transactions in the fiscalyear 2007. Please see Note 3 for additional information.
F-44
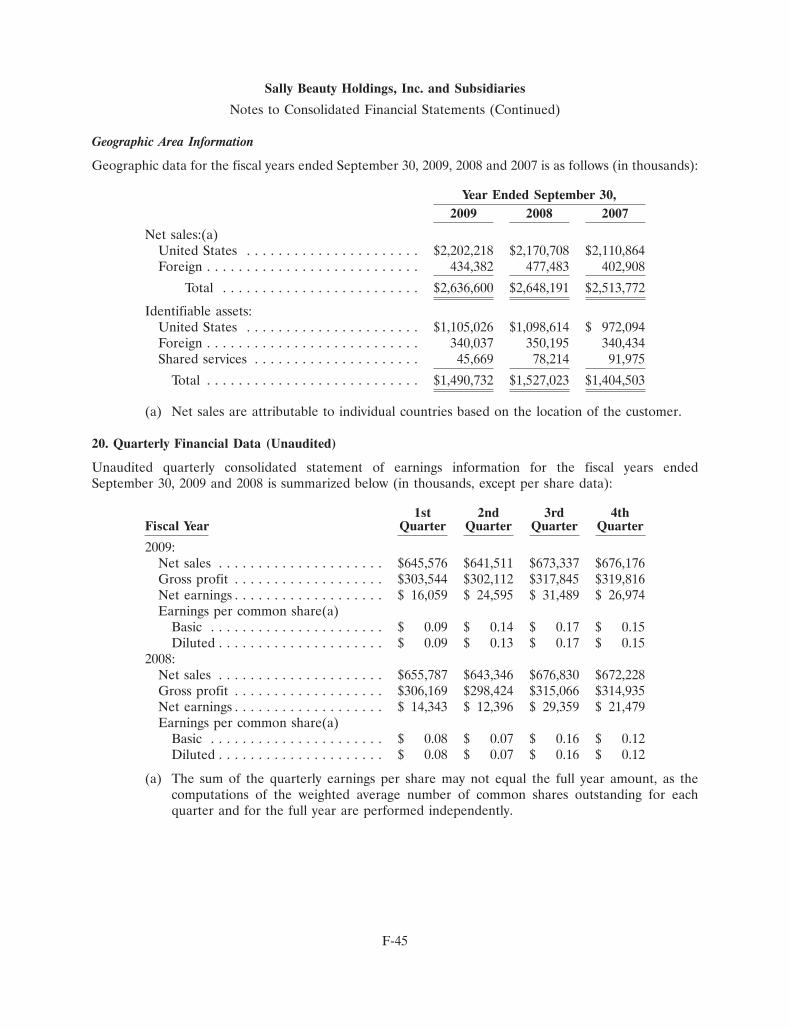
Sally Beauty Holdings, Inc. and Subsidiaries
Notes to Consolidated Financial Statements (Continued)
Geographic Area Information
Geographic data for the fiscal years ended September 30, 2009, 2008 and 2007 is as follows (in thousands):
Year Ended September 30,2009 2008 2007
Net sales:(a)United States . . . . . . . . . . . . . . . . . . . . . . $2,202,218 $2,170,708 $2,110,864Foreign . . . . . . . . . . . . . . . . . . . . . . . . . . . 434,382 477,483 402,908
Total . . . . . . . . . . . . . . . . . . . . . . . . . $2,636,600 $2,648,191 $2,513,772
Identifiable assets:United States . . . . . . . . . . . . . . . . . . . . . . $1,105,026 $1,098,614 $ 972,094Foreign . . . . . . . . . . . . . . . . . . . . . . . . . . . 340,037 350,195 340,434Shared services . . . . . . . . . . . . . . . . . . . . . 45,669 78,214 91,975
Total . . . . . . . . . . . . . . . . . . . . . . . . . . . $1,490,732 $1,527,023 $1,404,503
(a) Net sales are attributable to individual countries based on the location of the customer.
20. Quarterly Financial Data (Unaudited)
Unaudited quarterly consolidated statement of earnings information for the fiscal years endedSeptember 30, 2009 and 2008 is summarized below (in thousands, except per share data):
1st 2nd 3rd 4thFiscal Year Quarter Quarter Quarter Quarter
2009:Net sales . . . . . . . . . . . . . . . . . . . . . $645,576 $641,511 $673,337 $676,176Gross profit . . . . . . . . . . . . . . . . . . . $303,544 $302,112 $317,845 $319,816Net earnings . . . . . . . . . . . . . . . . . . . $ 16,059 $ 24,595 $ 31,489 $ 26,974Earnings per common share(a)
Basic . . . . . . . . . . . . . . . . . . . . . . $ 0.09 $ 0.14 $ 0.17 $ 0.15Diluted . . . . . . . . . . . . . . . . . . . . . $ 0.09 $ 0.13 $ 0.17 $ 0.15
2008:Net sales . . . . . . . . . . . . . . . . . . . . . $655,787 $643,346 $676,830 $672,228Gross profit . . . . . . . . . . . . . . . . . . . $306,169 $298,424 $315,066 $314,935Net earnings . . . . . . . . . . . . . . . . . . . $ 14,343 $ 12,396 $ 29,359 $ 21,479Earnings per common share(a)
Basic . . . . . . . . . . . . . . . . . . . . . . $ 0.08 $ 0.07 $ 0.16 $ 0.12Diluted . . . . . . . . . . . . . . . . . . . . . $ 0.08 $ 0.07 $ 0.16 $ 0.12
(a) The sum of the quarterly earnings per share may not equal the full year amount, as thecomputations of the weighted average number of common shares outstanding for eachquarter and for the full year are performed independently.
F-45
Exhibit 31.1
CERTIFICATIONPURSUANT TO EXCHANGE ACT RULES 13a-14(a) AND 15d-14(a),
AS ADOPTED PURSUANT TO SECTION 302 OF THE SARBANES-OXLEY ACT OF 2002
I, Gary G. Winterhalter, certify that:
(1) I have reviewed this Annual Report on Form 10-K of Sally Beauty Holdings, Inc.;
(2) Based on my knowledge, this report does not contain any untrue statement of a material fact or omitto state a material fact necessary to make the statements made, in light of the circumstances under whichsuch statements were made, not misleading with respect to the period covered by this report;
(3) Based on my knowledge, the financial statements, and other financial information included in thisreport, fairly present in all material respects the financial condition, results of operations and cash flows ofthe registrant as of, and for, the periods presented in this report;
(4) The registrant’s other certifying officer and I are responsible for establishing and maintainingdisclosure controls and procedures (as defined in Exchange Act Rules 13a-15(e) and 15d-15(e)) andinternal control over financial reporting (as defined in Exchange Act Rules 13a-15(f) and 15d-15(f)) for theregistrant and have:
a. Designed such disclosure controls and procedures, or caused such disclosure controls andprocedures to be designed under our supervision, to ensure that material information relating to theregistrant, including its consolidated subsidiaries, is made known to us by others within those entities,particularly during the period in which this report is being prepared;
b. Designed such internal control over financial reporting, or caused such internal control overfinancial reporting to be designed under our supervision, to provide reasonable assurance regardingthe reliability of financial reporting and the preparation of financial statements for external purposesin accordance with generally accepted accounting principles;
c. Evaluated the effectiveness of the registrant’s disclosure controls and procedures and presentedin this report our conclusions about the effectiveness of the disclosure controls and procedures, as ofthe end of the period covered by this report based on such evaluation; and
d. Disclosed in this report any change in the registrant’s internal control over financial reportingthat occurred during the registrant’s most recent fiscal quarter (the registrant’s fourth fiscal quarter inthe case of an annual report) that has materially affected, or is reasonably likely to materially affect,the registrant’s internal control over financial reporting; and
(5) The registrant’s other certifying officer and I have disclosed, based on our most recent evaluation ofinternal control over financial reporting, to the registrant’s auditors and the audit committee of theregistrant’s board of directors (or persons performing the equivalent functions):
a. All significant deficiencies and material weaknesses in the design or operation of internal controlover financial reporting which are reasonably likely to adversely affect the registrant’s ability torecord, process, summarize and report financial information; and
b. Any fraud, whether or not material, that involves management or other employees who have asignificant role in the registrant’s internal control over financial reporting.
Date: November 19, 2009
By: /s/ GARY G. WINTERHALTER
Gary G. WinterhalterChief Executive Officer
Exhibit 31.2
CERTIFICATIONPURSUANT TO EXCHANGE ACT RULES 13a-14(a) AND 15d-14(a),
AS ADOPTED PURSUANT TO SECTION 302 OF THE SARBANES-OXLEY ACT OF 2002
I, Mark J. Flaherty, certify that:
(1) I have reviewed this Annual Report on Form 10-K of Sally Beauty Holdings, Inc.;
(2) Based on my knowledge, this report does not contain any untrue statement of a material fact or omitto state a material fact necessary to make the statements made, in light of the circumstances under whichsuch statements were made, not misleading with respect to the period covered by this report;
(3) Based on my knowledge, the financial statements, and other financial information included in thisreport, fairly present in all material respects the financial condition, results of operations and cash flows ofthe registrant as of, and for, the periods presented in this report;
(4) The registrant’s other certifying officer and I are responsible for establishing and maintainingdisclosure controls and procedures (as defined in Exchange Act Rules 13a-15(e) and 15d-15(e)) andinternal control over financial reporting (as defined in Exchange Act Rules 13a-15(f) and 15d-15(f)) for theregistrant and have:
a. Designed such disclosure controls and procedures, or caused such disclosure controls andprocedures to be designed under our supervision, to ensure that material information relating to theregistrant, including its consolidated subsidiaries, is made known to us by others within those entities,particularly during the period in which this report is being prepared;
b. Designed such internal control over financial reporting, or caused such internal control overfinancial reporting to be designed under our supervision, to provide reasonable assurance regardingthe reliability of financial reporting and the preparation of financial statements for external purposesin accordance with generally accepted accounting principles;
c. Evaluated the effectiveness of the registrant’s disclosure controls and procedures and presentedin this report our conclusions about the effectiveness of the disclosure controls and procedures, as ofthe end of the period covered by this report based on such evaluation; and
d. Disclosed in this report any change in the registrant’s internal control over financial reportingthat occurred during the registrant’s most recent fiscal quarter (the registrant’s fourth fiscal quarter inthe case of an annual report) that has materially affected, or is reasonably likely to materially affect,the registrant’s internal control over financial reporting; and
(5) The registrant’s other certifying officer and I have disclosed, based on our most recent evaluation ofinternal control over financial reporting, to the registrant’s auditors and the audit committee of theregistrant’s board of directors (or persons performing the equivalent functions):
a. All significant deficiencies and material weaknesses in the design or operation of internal controlover financial reporting which are reasonably likely to adversely affect the registrant’s ability torecord, process, summarize and report financial information; and
b. Any fraud, whether or not material, that involves management or other employees who have asignificant role in the registrant’s internal control over financial reporting.
Date: November 19, 2009
By: /s/ MARK J. FLAHERTY
Mark J. FlahertySenior Vice President and Chief Financial Officer
Exhibit 32.1
CERTIFICATION PURSUANT TO18 U.S.C. SECTION 1350,
AS ADOPTED PURSUANT TOSECTION 906 OF THE SARBANES-OXLEY ACT OF 2002
In connection with the Annual Report of Sally Beauty Holdings, Inc. (the ‘‘Company’’) on Form 10-K forthe fiscal year ended September 30, 2009 as filed with the Securities and Exchange Commission on thedate hereof (the ‘‘Report’’), I, Gary G. Winterhalter, Chief Executive Officer of the Company, certify,pursuant to 18 U.S.C. §1350, as adopted pursuant to §906 of the Sarbanes-Oxley Act of 2002, that:
(1) The Report fully complies with the requirements of Section 13(a) or 15(d) of the SecuritiesExchange Act of 1934; and
(2) The information contained in the Report fairly presents, in all material respects, the financialcondition and result of operations of the Company.
By: /s/ GARY G. WINTERHALTER
Gary G. WinterhalterChief Executive Officer
Date: November 19, 2009
Exhibit 32.2
CERTIFICATION PURSUANT TO18 U.S.C. SECTION 1350,
AS ADOPTED PURSUANT TOSECTION 906 OF THE SARBANES-OXLEY ACT OF 2002
In connection with the Annual Report of Sally Beauty Holdings, Inc. (the ‘‘Company’’) on Form 10-K forthe fiscal year ended September 30, 2009 as filed with the Securities and Exchange Commission on thedate hereof (the ‘‘Report’’), I, Mark J. Flaherty, Senior Vice President and Chief Financial Officer of theCompany, certify, pursuant to 18 U.S.C. §1350, as adopted pursuant to §906 of the Sarbanes-Oxley Act of2002, that:
(1) The Report fully complies with the requirements of Section 13(a) or 15(d) of the SecuritiesExchange Act of 1934; and
(2) The information contained in the Report fairly presents, in all material respects, the financialcondition and result of operations of the Company.
By: /s/ MARK J. FLAHERTY
Mark J. FlahertySenior Vice President and Chief Financial Officer
Date: November 19, 2009
Board of DirectorsJames G. BergesChairman of the Board
Partner, Clayton, Dubilier & Rice, Inc.
Gary G. WinterhalterPresident and Chief Executive Officer
Kathleen J. AffeldtRetired Vice President of Human Resources of
Lexmark International
Marshall E. EisenbergFounding Partner,
Neil, Gerber & Eisenberg LLP
Kenneth A. GiuriceoPartner, Clayton, Dubilier & Rice, Inc.
Robert R. McMasterRetired Partner of KPMG LLP
Walter L. Metcalfe, Jr.Senior Counsel, Bryan Cave LLP
John A. MillerPresident and Chief Executive Officer,
North American Corporation of Illinois
Martha Miller de LomberaRetired Vice President of
The Procter & Gamble Company
Edward W. RabinRetired President of Hyatt Hotels Corporation
Richard J. SchnallPartner, Clayton, Dubilier & Rice, Inc.
Executive OfficersGary G. WinterhalterPresident and Chief Executive Officer
John GolliherPresident, Beauty Systems Group
Michael G. SpinozziPresident, Sally Beauty Supply
Mark J. FlahertySenior Vice President and Chief Financial Officer
Bennie L. LowerySenior Vice President and
General Merchandise Manager,
Beauty Systems Group
Raal H. RoosSenior Vice President, General Counsel and Secretary
Janna S. MintonVice President, Chief Accounting Officer
and Controller
Executive Offices3001 Colorado BoulevardDenton, Texas 762101-940-898-7500www.sallybeautyholdings.com
Common StockApproximately 1,484 shareholders of record. Traded on the New York Stock Exchange (the “NYSE”) Symbol: SBH
Independent Registered Public Accounting FirmKPMG LLPDallas, Texas
Transfer AgentComputershare Trust Company, N.A.P.O. Box 43078Providence, RI 02940-3078Tel: 1-800-733-5001www.computershare.com/investor
Annual MeetingThe annual meeting of shareholders is to be held on January 27, 2010 at 9:00 a.m. (Central) in the Sally Beauty Holdings headquarters location at 3001 Colorado Boulevard, Denton, Texas 76210. The Board of Directors has also set November 30, 2009, as the record date for determination of stockholders entitled to vote at the annual meeting.
Form 10-K Reports and Investor RelationsThe Company has included as an Exhibit to its Annual Report or Form 10-K filed with the Securities and Exchange Commission certificates of the Company’s Chief Executive Officer and Chief Financial Officer certifying the quality of the Company’s public disclosure.
The certification of our Chief Executive Officer regarding compliance with the New York Stock Exchange (NYSE) corporate governance listing standards required by NYSE Rule 303.A.12 will be filed with the NYSE in February of 2010 fol-lowing the 2010 Annual Meeting of Stockholders. Last year, we filed this certification with the NYSE after the 2009 Annual Meeting of Stockholders.
A copy of the Sally Beauty Holdings, Inc. 2009 Form 10-K, as filed with the Securities and Exchange Commission, is available on the investing section of the Company’s website at investor.sallybeautyholdings.com. Investor inquiries or a copy of the Company Annual Report or Form 10-K or any exhibit thereto can be obtained by writing, submitting a request via the investor section of the website, or calling the Investor Relations department at:
Sally Beauty Holdings, Inc.3001 Colorado BoulevardDenton, Texas 76210
1-940-297-3877http://investor.sallybeautyholdings.com
Cautionary Notice Regarding Forward-Looking StatementsStatements in this report which are not purely historical facts or which depend upon future events may be forward-looking statements within the meaning of Section 27A of the Securities Act of 1933, as amended, and Section 21E of the Securities Exchange Act of 1934, as amended. Words such as “anticipate,” “believe,” “estimate,” “expect,” “intend,” “plan,” “project,” “tar-get,” “can,” “could,” “may,” “should,” “will,” “would,” or similar expressions may also identify such forward-looking statements.
Readers are cautioned not to place undue reliance on forward-looking statements as such statements speak only as of the date they were made. Any forward-looking statements involve risks and uncertainties that could cause actual events or results to differ materially from the events or results described in the forward-looking statements, including, but not limited to, risks and uncertainties related to: the highly competitive nature of, and the increasing consolidation of, the beauty products distri-bution industry; anticipating changes in consumer preferences and buying trends or managing our product lines and inven-tory; potential fluctuation in our same store sales and quarterly financial performance; our dependence upon manufacturers who may be unwilling or unable to continue to supply products to us; the possibility of material interruptions in the supply of beauty supply products by our manufacturers; products sold by us being found to be defective in labeling or content; compli-ance with laws and regulations or becoming subject to addi-tional or more stringent laws and regulations; product diversion to mass retailers; the operational and financial performance of our Armstrong McCall, L.P. business; the success of our new Internet-based business; successfully identifying acquisition candidates or successfully completing desirable acquisitions; integrating businesses acquired in the future; opening and operating new stores profitably; the impact of a continued downturn in the economy upon our business; the success of our cost control plans; protecting our intellectual property rights, specifically our trademarks; conducting business outside the United States; disruption in our information technology sys-tems; natural disasters or acts of terrorism; the preparedness of our accounting and other management systems to meet finan-cial reporting and other requirements and the upgrade of our existing financial reporting system; being a holding company, with no operations of our own, and depending on our subsid-iaries for cash; our substantial indebtedness; the possibility that we may incur substantial additional debt; restrictions and limi-tations in the agreements and instruments governing our debt; generating the significant amount of cash needed to service all of our debt and refinancing all or a portion of our indebtedness or obtaining additional financing; changes in interest rates increasing the cost of servicing our debt or increasing our inter-est expense due to our interest rate swap agreements; the poten-tial impact on us if the financial institutions we deal with become impaired; the representativeness of our historical con-solidated financial information with respect to our future financial position, results of operations or cash flows; our reli-ance upon Alberto-Culver for the accuracy of certain historical services and information; the share distribution of Alberto-Culver common stock in our separation from Alberto-Culver not constituting a tax-free distribution; actions taken by certain large shareholders adversely affecting the tax-free nature of the share distribution of Alberto-Culver common stock; the voting power of our largest stockholder discouraging third party acqui-sitions of us at a premium; and the interests of our largest stock-holder differing from the interests of other holders of our common stock.
Additional factors that could cause actual events or results to differ materially from the events or results described in the forward-looking statements can be found in our most recent Annual Report on Form 10-K for the year ended September 30, 2009, as filed with the Securities and Exchange Commission. Consequently, all forward-looking statements in this report are qualified by the factors, risks and uncertainties contained therein. We assume no obligation to publicly update or revise any forward-looking statements.
ShAREhOLDER INFORMATION
Ann
ual R
epor
t D
esig
n by
Cur
ran
& C
onno
rs, I
nc. /
ww
w.c
urra
n-co
nnor
s.com

3001 Colorado BoulevardDenton, Texas 76210www.sallybeautyholdings.com