Embed Size (px)
Citation preview

The Basics of Lean and Clean
Laura Pyzik
2007 Great Lakes/Great Plains P2 Conference
March 13, 2007

2
Defining Lean
Lean is:
“A systematic approach to identifying and eliminating waste (non-value added activities) through continuous improvement by flowing the product at the pull of the customer in pursuit of perfection”
—The MEP Lean Network

3
What is Lean Manufacturing? A business model that emphasizes
eliminating “waste” while delivering quality products at the least cost to the manufacturer and customers.
Lean thinking focuses on three objectives: Reduce production resource requirements by
minimizing inventory, equipment, storage and production space, and materials;
Increase manufacturing velocity and flexibility; and
Improve quality and eliminate defects.

4
What is Lean Cont.
Lean can provide an “entry point” for P2
Lean methods create a continual improvement-based, waste elimination culture
Lean tools can be used to address environmental concerns

5
The L&E Initiative
OPEI coordinates a cross-office partnership including OPPT and OSWER.
Work with P2 assistance providers, as well as, business assistance providers, with outreach activities.
Work with specific companies, industrial sectors, Lean experts and EPA programs to: Develop or adapt appropriate tools Find applications for existing tools Address regulatory barriers

6
Lean’s Environmental “Blind Spots”
Lean’s “Deadly Wastes”
1. Overproduction2. Inventory 3. Transportation4. Motion5. Defects6. Over Processing7. Waiting
Where are environmental wastes?
• Excess materials use• Pollution/emissions• Scrap & non-product output• Hazardous wastes

7
The P2 – Lean Connection Late 1990s: EPA, others began to see
similarities between lean and P2 Many lean efforts had environmental
benefits: Material savings Less solid waste generated Less energy use
Developed The Lean Manufacturing and Environment report documenting these opportunities.
8
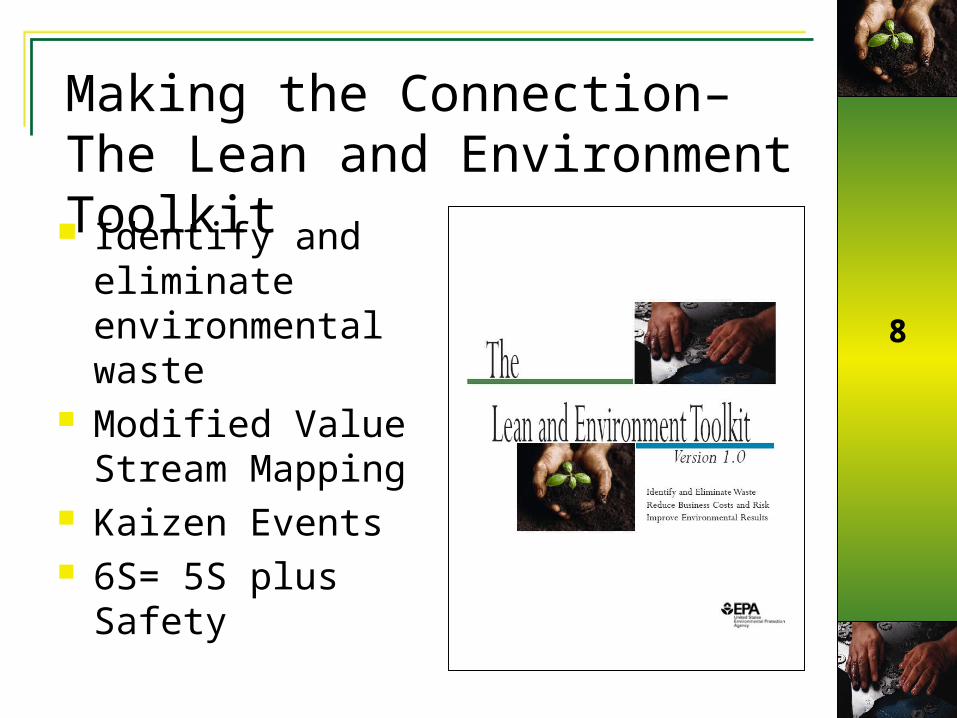
Making the Connection– The Lean and Environment Toolkit Identify and
eliminate environmental waste
Modified Value Stream Mapping
Kaizen Events 6S= 5S plus Safety
9
The Toolkit and the Green Suppliers Network
Green Suppliers Network is a direct application of the Toolkit
Green Suppliers Network team helped in development
Value Stream and Process Mapping sections are foundation of reviews
Integral in collaborations with lean experts at Manufacturing Extension Partnership Centers

10
Value Stream Mapping
Value stream mapping is a mapping method that enables an organization to “see” all the actions involved in producing a product or service
Current State Map: Visual representation of existing operations (information and product flows) Identify the largest sources of waste (non-value
added activity) in the value stream
Future State Map: Drawing of Lean flow (vision) Develop implementation plan for Lean activities

11
Map the Process
Makes work visible Visibility improves communication and
understanding Identifies Improvement Opportunities
Eliminate the non-value added steps Reduce wasted resources
Diagnostics Determine the cause of a problem or condition.
Training and communication

12
Current State Value Stream Map
Market Forecast
Total Lead Time = 68 days Value Added Time = 15 min
CustomerA
2 people
C/T = 4 minC/O = 3 hrUptime = 61%
Assembly &Inspection
2 people
Milling
C/T = 2 minC/O = 2 hrUptime = 74%
3 people
C/T = 7 minC/O = 4 hrUptime = 48%
Painting
I I I3 people
Shipping
7 min4 min2 min
15 days 8 days10 days 30 days
Production ControlAnnual Production Plan
Weekly delivery schedule
Wee
kly
sch
edul
e
Daily sch
edu
le
Daily schedule
Daily schedule
WK
I
5 days
D ID
30 daysWK
Receiving
C/T = 2 minC/O = 30 minUptime = 93%
Welding
5 days
2 min
CustomerBSupplier
1Supplier
2

13
Enhanced Value Stream Mapping
• Use icons to identify processes with EHS opportunities
• Record environmental data for processes in VSMs
• Analyze materials use vs. need in a “materials line” for VSMs
• Expand the application of value stream mapping to natural resource flows
• Find Lean and Clean opportunities in future state VSMs

14
Types of Environmental Metrics Scrap/Non-Product Output Materials Use Hazardous Materials Use Energy Use Water Use Air Emissions Solid Waste Hazardous Waste Water Pollution/Wastewater
15
Common Processes with EHS Wastes and Opportunities Metal casting
Chemical and heat treatment of materials
Metal fabrication and machining
Cleaning and surface preparation
Bonding and sealing
Welding Metal finishing and
plating Painting and
coating Waste
management Chemical and
hazardous materials management

16
Adding EHS Icons to Value Stream Maps
Market Forecast
Total Lead Time = 68 days Value Added Time = 15 min
CustomerA
2 people
C/T = 4 minC/O = 3 hrUptime = 61%
Assembly &Inspection
2 people
Milling
C/T = 2 minC/O = 2 hrUptime = 74%
3 people
C/T = 7 minC/O = 4 hrUptime = 48%
Painting
I I I3 people
Shipping
7 min4 min2 min
15 days 8 days10 days 30 days
Production ControlAnnual Production Plan
Weekly delivery schedule
Wee
kly
sch
edul
e
Daily sch
edu
le
Daily schedule
Daily scheduleWK
I
5 days
D ID
30 daysWK
Receiving
C/T = 2 minC/O = 30 minUptime = 93%
Welding
5 days
2 min
CustomerBSupplier
1Supplier
2
EHS EHS EHS

17
Record Environmental Data for Processes in VSMs
C/T = 2 minC/O = 2 hrUptime = 74%Haz. Waste = 5 lbs
2 people
Milling
EHS
Hazardous waste generated per shift

18
VSM with Environmental Metrics & EHS Icons
Market Forecast
Total Lead Time = 68 days Value Added Time = 15 min
CustomerA
2 people
C/T = 4 minC/O = 3 hrUptime = 61%Haz. Waste = 20 lbs
Assembly &Inspection
2 people
Milling
C/T = 2 minC/O = 2 hrUptime = 74%Haz. Waste = 5 lbs
3 people
C/T = 7 minC/O = 4 hrUptime = 48%Haz. Waste = 60 lbs
Painting
I I I3 people
Shipping
7 min4 min2 min
15 days 8 days10 days 30 days
Production ControlAnnual Production Plan
Weekly delivery schedule
Wee
kly
sch
edul
e
Daily sch
edu
le
Daily schedule
Daily scheduleWK
I
5 days
D ID
30 daysWK
Receiving
C/T = 2 minC/O = 30 minUptime = 93%
Welding
5 days
2 min
CustomerBSupplier
1Supplier
2
EHS EHS EHS

19
Analyze Materials Use Versus Need in a “Materials Line” The “timeline” on value stream maps looks at value-added and non-value-added time in the value stream
4 min2 min
10 days5 daysLead Time = 15 days Value Added Time = 6 min
Add a “materials line” to examine: Amount of raw materials used by each process Amount of materials that end up in the product
and add value from the customer’s perspective

20
Example Materials Line
Materials lines can be developed for any major material source used in processes and products
2 people2 people
Milling
II
Welding
EHS EHS
5 lbs80 lbs
15 lbs120 lbsMaterials Used = 135 lbs Materials Needed = 85 lbsMaterials Wasted = 50 lbs
Top line: Materials Used by Process
Bottom line: Materials Added to Product During the Process

21
VSM with Materials Line and EHS Icons
Market Forecast
Total Lead Time = 68 days Value Added Time = 15 min
CustomerA
2 people
C/T = 4 minC/O = 3 hrUptime = 61%
Assembly &Inspection
2 people
Milling
C/T = 2 minC/O = 2 hrUptime = 74%
3 people
C/T = 7 minC/O = 4 hrUptime = 48%
Painting
I I I3 people
Shipping
7 min4 min2 min
15 days 8 days10 days 30 days
Production ControlAnnual Production Plan
Weekly delivery schedule
Wee
kly
sch
edul
e
Daily sch
edu
le
Daily schedule
Daily schedule
WK
I
5 days
D ID
30 daysWK
Receiving
C/T = 2 minC/O = 30 minUptime = 93%
Welding
5 days
2 min
CustomerBSupplier
1Supplier
2
EHS EHS EHS
Total Materials Used = 195 lbs Materials Needed = 110 lbs
20 lbs5 lbs80 lbs
40 lbs 20 lbs15 lbs120 lbs
5 lbs

22
Example Future State VSM
2x Week
Market Forecast
Lead Time = 27 days Value Added Time = 15 min
Customer A
Customer B
2 people
C/T = 4 minC/O = 3 hrUptime = 61%
Assembly &Inspection
2 people
Milling
C/T = 2 minC/O = 1 hrUptime = 87%
3 people
C/T = 7 minC/O = 1.5 hrUptime = 80%
Painting
3 people
Shipping
Production Control
Supplier 1
Supplier 2
Annual Production Plan
Daily schedule
Daily schedule
C/T = 2 minC/O = 30 minUptime = 93%
Total Materials Used < 150 lbsMaterials Needed = 110 lbs
Welding
<90 lbs
5 lb
EHSEHS EHS
DI
7 min4 min2 min
6 days 3 days4 days2 days2 min
20 lbs5 lbs<25 lbs 20 lbs15 lbs
80 lbs
12 days

23
Expand the Application of Value Stream Mapping to Natural Resource Flows
You can also use VSMs to look in more detail at the use of energy, water, and/or materials
Energy/water/materials used vs. needed
Environmental waste streams
Information flows to regulatory agencies

24
Raw waterSource Pump No.1 or 2
Plant ProcessInitial State
Initial Usage (Gal/day) = 300K gal Per DayProduct Need Per Day = 34K gal Per Day
44Kgal 50Kgal40Kgal
179Kgal 44Kgal
H2O: 12Kgal reject
Multigrade filter
H2O: 44Kgal reject
Softener RO1 RO2
Sterilizer uses and rejects 12K gal
Still
H2O: 40Kgal reject
25Kgal overflows & 25Kgal is reject
281Kgal293Kgal 94Kgal
201K galInto Effluent tank per day
Pollution control Regulations
Multigra
de filter
RO
1 R
ejec
t
Bo
iler reject
RO2 RejectSof
tene
r
12Kgal 10Kgal
58KL
Distillation reject
Local
H2O: 10Kgal reject
Sterilizer reject
Boiler feed. Uses 33K gal &
rejects all.
293K gal
Wash rooms,pantry,Cooling
Sewage
139Kgal
45Kgal
34Kgal
58K
gal

25
Raw waterSource Pump No.1 or 2
Plant ProcessGoal and Achievement
Usage goal (K gal) = 213K gal / dayAchieved usage = 233K gal / dayProduct Need = 34K gal/ day
44Kgal 0Kgal22Kgal
159Kgal 44Kgal
10K gal reject as backwash time shall be reduced by 5 mins
Multigrade filter
44K gal reject
Softener RO1 RO2
Sterilizer uses and rejects 12K gal
Still
18K gal shall be channelised to wash room out of 40KL gal reject
10K gal overflow is channelised to RO1 Tank and 40K gal goes to wash room
203Kgal213Kgal 94Kgal
121K galInto Effluent tank per day
Pollution control Regulations
Multigra
de filter
RO
1 R
ejec
t
Bo
iler reject
Softe
ner
10Kgal 0Kgal
18Kgal
Distillation reject
Local
10K gal reject now goes to boiler feed tank
Sterilizer rejectBoiler feed.
uses 23Kgal from RO1 & 10Kgal from still and rejects all.
213K galWash rooms, pantry,Cooling tower gets 18Kgal from RO1 reject and 40Kgal from RO2 reject
Sewage
119Kgal
45Kgal
34Kgal
58K
gal
10K gal of overflow40Kgal of reject
Achieved
UnchangedOngoing


![The great plains[1]](https://img.pdfslide.us/doc/110x75/54b9ed8d4a795905448b470a/the-great-plains1.jpg)