Embed Size (px)
Citation preview

T H E B A R T H R E P O R T
H O P S 2 0 0 7 / 2 0 0 8
Hops 07/08
2
C O N T E N T S
World Market Key Data 2Foreword 3Political Situation 4European Union 4Economic Situation 6Key Data of the USA, Japan, Germany and China 6World Beer Production 2006/2007 7Output Development 8Market Analysis 8Forward Contract Rates 9Development 1996 – 2007 10Hop Acreage and Production 2006/2007 12Alpha Acid Production/Alpha Acid Balance 13
Country Reports 2007 Crop/European UnionGermany 14Czech Republic 18Poland 18Slovenia 19England 20 France 20Spain 21 Slovakia 21
Country Reports 2007 Crop/Rest of EuropeUkraine 22Russia 22
Country Reports 2007 Crop/AmericaUSA 23
Country Reports 2007 Crop/AsiaChina 26
Country Reports 2008 Crop/AfricaSouth Africa 27
Country Reports 2008 Crop/Australia/OceaniaAustralia 28New Zealand 29
Plant Development 2008 29Outlook 2008 30Barth-Haas Group awards research grants 30Conversion Table 31Currency Exchange Rates 31Barth-Haas Group 31Top 40 Brewery Groups 32
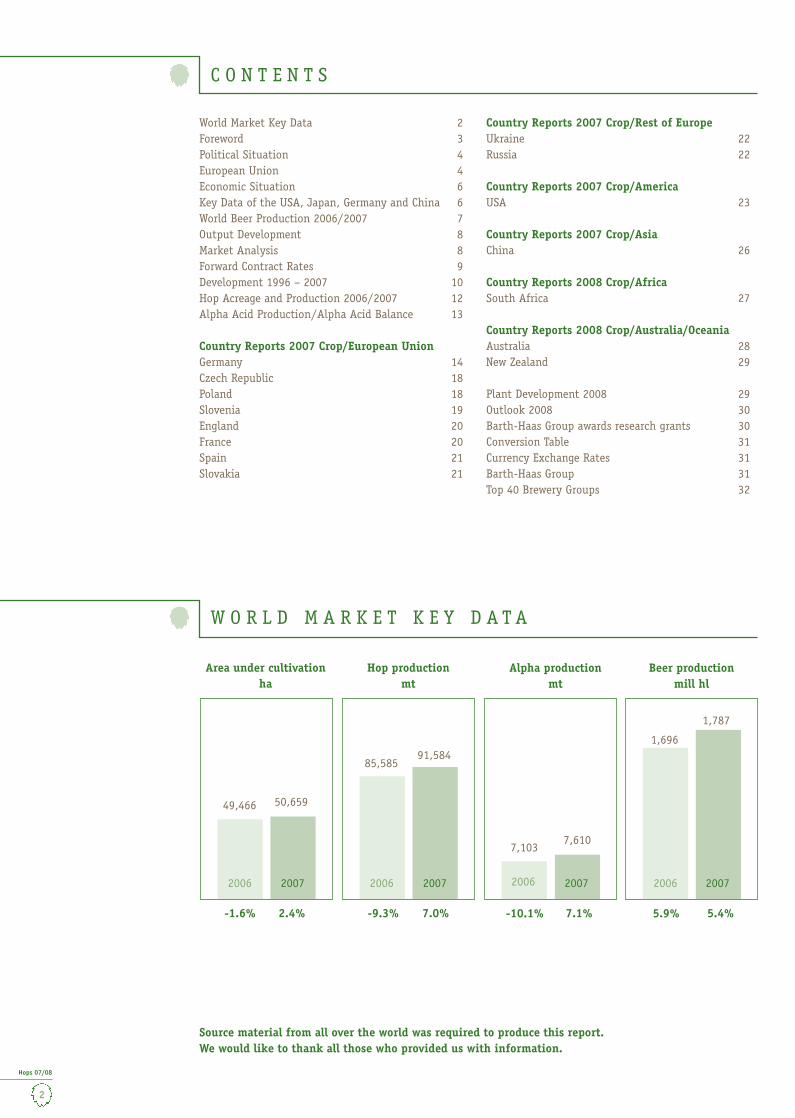
W O R L D M A R K E T K E Y D A T A
Alpha productionmt
Beer productionmill hl
50,65949,466
7,6107,103
85,58591,584
2006 2006 2006 20062007 2007 2007 2007
-1.6% 5.4%5.9%7.1%-10.1%7.0%-9.3%2.4%
Area under cultivationha
Hop productionmt
1,696
1,787
Source material from all over the world was required to produce this report.We would like to thank all those who provided us with information.

Hops 07/08
3
Green gold
The description of hops as “green gold” probably came into common usage as a result of the record prices following the 1949 hop harvest. This expression has been used again and again ever since – although often erroneously, because for many years the hop growers‘ revenues did not even cover their production costs or only just enabled them to break even. Today the term “green gold” is experiencing a renaissance and can certainly stand up to comparison with gold as a commodity.
What has happened? Production volume in crop years 2006 and 2007 was not nearly suffi cient to meet the requirements of the brewing industry and prices rose many times over because the stocks in the brewers’ warehouses had already been largely depleted in the
years before. Despite continually rising prices, demand for hops remained consistently high and could not be satisfi ed. The industry was thus plunged into a full-blown state of emergency. The market prices for crop 2007 reached hitherto unthinkable and unprecedented heights.
Extreme situations demonstrate the value of a sup-plier who keeps his word and fulfi ls his contractual obligations, no matter how high the market price may be. It has always been a question of principle for the Barth-Haas Group to honour existing contracts. In crop year 2007 likewise our actions were governed by this maxim. However, we faced many obstacles. Production volume was disappointing in the USA and Slovenia in particular, but also in Germany among the high alpha Hallertau Magnum hops. This was caused by unfavour- able weather conditions shortly before or during the harvest and by a certain reluctance to deliver on the part of large numbers of our Eastern European hop sup-pliers who, despite long-standing forward contracts, were unable to resist the temptation of exorbitantly high spot market prices or who, like the hop growers in the Czech Repbulic, simply had economic diffi cul-ties to contend with. These contracts proved to be vir-tually worthless. It even happened that processed hop products were stolen on their way to the customer.
The brewing industry used to acknowledge the impor-tance of service and contractual reliability by placing signifi cant long-term forward contracts with suppliers who were committed to these criteria.Crop year 2007 fi nally reminded brewers, regardless of the league they played in terms of size, just how im-portant it was to secure the supply of raw materials and how seriously this had been neglected in recent years.
Hops have been recognised once again as an indis-pensable strategic raw material. For that reason alone, the term “green gold” is a worthy description of this plant.
F O R E W O R D
Stephan J. Barth
Managing Partner, Joh. Barth & Sohn GmbH & Co. KG

Hops 07/08
4
P O L I T I C A L S I T U A T I O N
As in the years before, events in the Middle East were at the forefront of attention. Despite numerous initi-atives, the prospect of a peaceful settlement between Israel and the Arab-Islamic world is as distant as ever.In Iraq, the violent confrontation between the diffe-rent groups continues despite US military presence. The dispute between the UN and Iran also continued. In March 2008 the Security Council tightened sanc-tions against Iran because of that country’s nuclear programme.In May 2008 Lebanon experienced the worst unrest since the civil war of 1975–90. The unrest was triggered by a general strike organised by the Hezbollah Shiite militia and directed against the pro-Western cabinet of Prime Minister Siniora. In the meantime an agreement has been reached and a Muslim, Michel Suleiman, has been elected as the new head of state.Despite the presence of international peace-keeping forces in Afghanistan, the country was affl icted more and more by suicide bombings and kidnappings which disrupted reconstruction efforts.In Myanmar (Burma) there were protests against the military government in September 2007. Buddhist monks began a nationwide resistance campaign. The uprising was put down bloodily. On 3.5.2008, Hurri-cane Nargis caused serious damage and a high number of casualties.
The province of Sichuan in Southwest China was af-fected by multiple serious earthquakes causing signi-fi cant casualties among the population and damage to property.In Pakistan, Pervez Musharraf won the presidential election, but stood down as military ruler.As of February 2008 the number of states in Eastern Europe has increased by one. On 17.2.2008, the parlia-ment in Pristina declared Kosovo’s independence from Serbia. The new nation is called the Republic of Koso-vo and is the seventh state to emerge from the former Yugoslavia.In Russia the constitutional transfer of presidential power from President Putin to Dmitry Medvedev took place on 7.5.2008. One day later the Russian parlia-ment elected Vladimir Putin prime minister.Silvio Berlusconi’s coalition succeeded in winning by a large majority the parliamentary elections in Italy in January 2008.In Zimbabwe, the ruling party Zanu-PF, led by Robert Mugabe, lost its majority in parliament. Whether this means a new departure for this long-suffering country remains open to question.The whole world is watching the election campaign for the US presidential election in November 2008 with great interest.
E U R O P E A N U N I O N ( E U )
EU enlargementIn April 2008 the European Union and Serbia signed a stabilisation and association agreement as a fi rst step towards Serbia’s accession to the EU. The agreement will not take effect until the EU governments “unani-mously fi nd that the Republic of Serbia is cooperating fully with the International War Crimes Tribunal”.
EU reform treatyIn 2007, during the German presidency of the EU Council an EU reform treaty was negotiated and signed by the heads of government and state in Lisbon in October. The Treaty of Lisbon is intended to make the European Union better able to reach decisions and to act. In order that the reform treaty, which replaces the failed EU constitution, can come into effect on 1.1.2009, it has to be ratifi ed by the 27 member states. There are different procedures for this, depending on national law. Up to now the only country in which a referendum is planned is Ireland. By the end of May 2008 14 states had ratifi ed the Treaty of Lisbon.
EU currency unionThe European currency was introduced in Malta and Cyprus on 1.1.2008.In Latvia, the introduction of the euro also planned for this date had to be postponed to 2009 or 2010 due to the country’s persisting infl ation. This means that the euro is legal tender in 15 countries out of the 27 EU member states. They are: Austria, Belgium, Finland, France, Germany, Greece, Ireland, Italy, Luxembourg, Malta, the Netherlands, Portugal, Slo-venia, Spain and Cyprus.
Reforms of the Common Agricultural Policy –The common market organisation for hops is re-placed by a common organisation for the agricul-tural marketsOn 11.6.2007 the agriculture ministers of the EU agreed to the European Commission‘s proposal to introduce a single common market organisation (CMO) for all ag-ricultural products, thus replacing the 21 previously existing CMOs. The aim of the creation of a single CMO is to streamline legal regulations and make them more

Hops 07/08
5
transparent, so that the measures are more accessible. The creation of this single CMO applying to all agricul-tural products would constitute the most signifi cant technical simplifi cation of the Common Agricultu-ral Policy (CAP) to date. The introduction of the new CMO allows nearly 50 Commission directives to be abo-lished: Whereas previously 650 articles were necessary to regulate the individual agricultural sectors, 200 will suffi ce in the future. As of 1.7.2008, the new Council Regulation (EC) No. 1234/2007 for the common organisation of the agricul-tural markets of 22.10.2007 will also apply to hops. It will then replace Council Regulation (EC) No. 1952/2005 of 23.11.2005 which applied to the common market organisation for hops and will cease to be effective as of 1.7.2008. However, the existing regulations in the hop market organisation have largely been retained in the new CMO, in particular the provisions regarding the certifi cation of hops and hop products and also the regulations affecting producers’ associations. Since the Commission Directive (EEC) No. 1351/72 regarding the recognition of producers’ associations in the hop sector had been amended several times and in major points, it seemed advisable to reform this directive for reasons of clarity. On 6.11.2007 a new version of Regulation (EC) No. 1299/2007 regarding the preconditions for the re-cognition of producers’ associations in the hop sector was passed by the Commission. The old directive (EEC) No. 1351/72 was annulled at the same time. The European Commission published its proposals for a simplifi cation and further modernisation of the Common Agricultural Policy on 20.11.2007. Building on the reforms enacted in 2003 and the experience gathered since then, the so-called “Health Check” of the CAP is designed to improve the way in which the policy functions, thus enabling it to respond better to the challenges and opportunities presented by a Union which by 2007 had 27 members. Although the reforms have led to a modernisation of the CAP, it is the Health Check that is meant to be seen as an outstanding means whereby further progress can be made in the agricultural policy.Here, there are three central questions:1. How can the regulations regarding the granting of farm payments be made more effective and simpli- fi ed?
2. How can the market support instruments that were originally conceived for a community of six member states be sensibly redesigned for today‘s world?3. How can new challenges – from climate change to organic fuels and water resource management, to bio- diversity protection – be overcome?In the spring of 2008 the Commission submitted pro-posals to the legislature in the hope that they could be approved by the agricultural ministers of the mem-ber states by the end of 2008 and then immediately come into effect. The Health Check is to be seen as a preparatory measure for the Commission’s concept for reviewing the budget for 2008/2009. It is intended to serve the purpose of “fi ne-tuning” the reforms of 2003 and to contribute to the discussion of the future focus of the agricultural sector.
Changes in plant protection policy in the EU have an impact on hop production and marketing in Europe A major step towards the standardisation of hop mar-keting and hop products was taken in the form of Re-gulation (EC) No. 396/2005. This regulation requires that by the end of this year at the latest all effective agents in pesticides relevant to European hop farming today will be labelled with harmonised maximum resi-due levels. This will lead to considerable simplifi cation of the hop trade within the EU member states.In addition, the Council and the European parlia-ment are discussing a “Pesticide Pact” that contains a number of guidelines and regulations concerning the use of pesticides, including the circulation of pesti-cides, environmental regulations for spraying equip-ment and environmental quality standards with regard to water policy. However, what will have by far the greatest impact on European hop farming is the “Di-rective regarding a community-wide thematic strategy on the sustainable use of pesticides” which is currently still being drawn up. A source of concern to European hop growers is above all the plan for quantitative and qualitative reduction targets for the use of pesticides, which will lead to a further restriction of what is al-ready a limited range of pesticides available for hop growing. The adoption of this directive is planned for January 2009.
E U R O P E A N U N I O N ( E U )
Hops 07/08
6
GPD growth (real) in %
Balance of Payments in USD bn
Balance of Trade in USD bn
Infl ation Rate Ø in %
Interest Rate Ø in %*)
Unemployment(as of 31.12.) in %
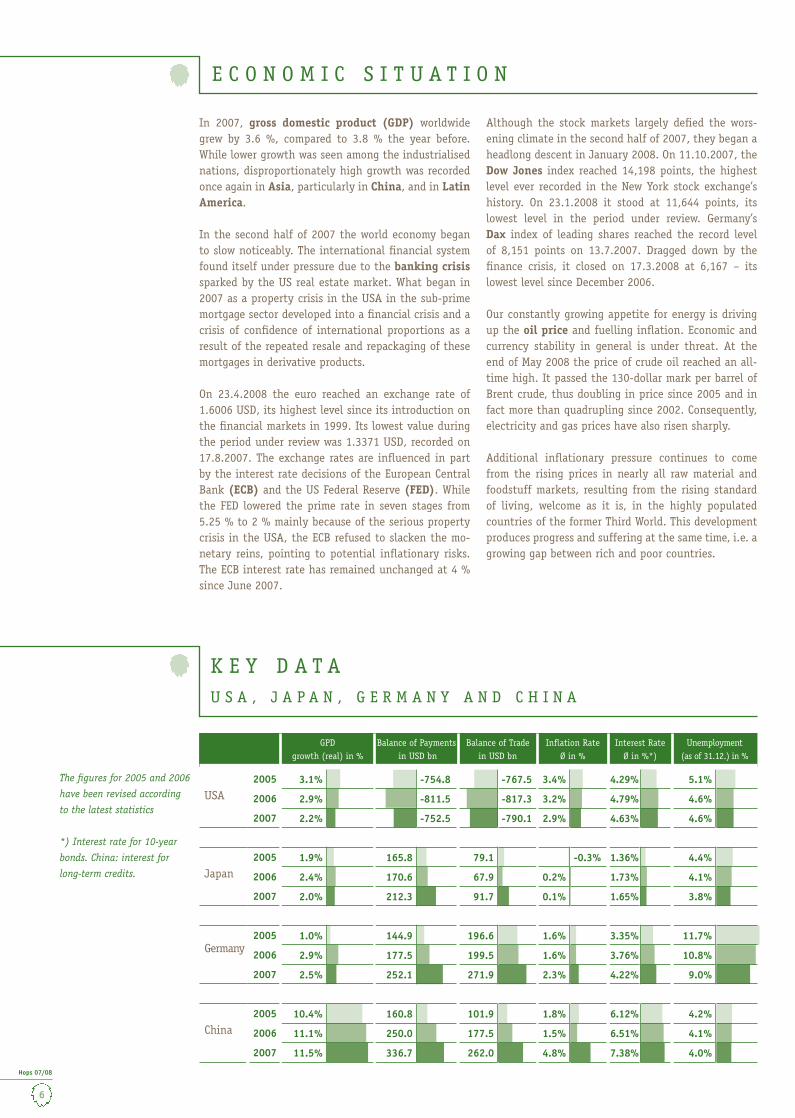
USA 2005 3.1% -754.8 -767.5 3.4% 4.29% 5.1%
2006 2.9% -811.5 -817.3 3.2% 4.79% 4.6%
2007 2.2% -752.5 -790.1 2.9% 4.63% 4.6%
Japan2005 1.9% 165.8 79.1 -0.3% 1.36% 4.4%
2006 2.4% 170.6 67.9 0.2% 1.73% 4.1%
2007 2.0% 212.3 91.7 0.1% 1.65% 3.8%
Germany2005 1.0% 144.9 196.6 1.6% 3.35% 11.7%
2006 2.9% 177.5 199.5 1.6% 3.76% 10.8%
2007 2.5% 252.1 271.9 2.3% 4.22% 9.0%
China2005 10.4% 160.8 101.9 1.8% 6.12% 4.2%
2006 11.1% 250.0 177.5 1.5% 6.51% 4.1%
2007 11.5% 336.7 262.0 4.8% 7.38% 4.0%
K E Y D A T AU S A , J A P A N , G E R M A N Y A N D C H I N A
In 2007, gross domestic product (GDP) worldwide grew by 3.6 %, compared to 3.8 % the year before. While lower growth was seen among the industrialised nations, disproportionately high growth was recorded once again in Asia, particularly in China, and in Latin America.
In the second half of 2007 the world economy began to slow noticeably. The international fi nancial system found itself under pressure due to the banking crisis sparked by the US real estate market. What began in 2007 as a property crisis in the USA in the sub-prime mortgage sector developed into a fi nancial crisis and a crisis of confi dence of international proportions as a result of the repeated resale and repackaging of these mortgages in derivative products.
On 23.4.2008 the euro reached an exchange rate of 1.6006 USD, its highest level since its introduction on the fi nancial markets in 1999. Its lowest value during the period under review was 1.3371 USD, recorded on 17.8.2007. The exchange rates are infl uenced in part by the interest rate decisions of the European Central Bank (ECB) and the US Federal Reserve (FED). While the FED lowered the prime rate in seven stages from 5.25 % to 2 % mainly because of the serious property crisis in the USA, the ECB refused to slacken the mo-netary reins, pointing to potential infl ationary risks. The ECB interest rate has remained unchanged at 4 % since June 2007.
Although the stock markets largely defi ed the wors-ening climate in the second half of 2007, they began a headlong descent in January 2008. On 11.10.2007, the Dow Jones index reached 14,198 points, the highest level ever recorded in the New York stock exchange’s history. On 23.1.2008 it stood at 11,644 points, its lowest level in the period under review. Germany’s Dax index of leading shares reached the record level of 8,151 points on 13.7.2007. Dragged down by the fi nance crisis, it closed on 17.3.2008 at 6,167 – its lowest level since December 2006.
Our constantly growing appetite for energy is driving up the oil price and fuelling infl ation. Economic and currency stability in general is under threat. At the end of May 2008 the price of crude oil reached an all-time high. It passed the 130-dollar mark per barrel of Brent crude, thus doubling in price since 2005 and in fact more than quadrupling since 2002. Consequently, electricity and gas prices have also risen sharply.
Additional infl ationary pressure continues to come from the rising prices in nearly all raw material and foodstuff markets, resulting from the rising standard of living, welcome as it is, in the highly populated countries of the former Third World. This development produces progress and suffering at the same time, i.e. a growing gap between rich and poor countries.
E C O N O M I C S I T U A T I O N
The fi gures for 2005 and 2006
have been revised according
to the latest statistics
*) Interest rate for 10-year
bonds. China: interest for
long-term credits.
Hops 07/08
7
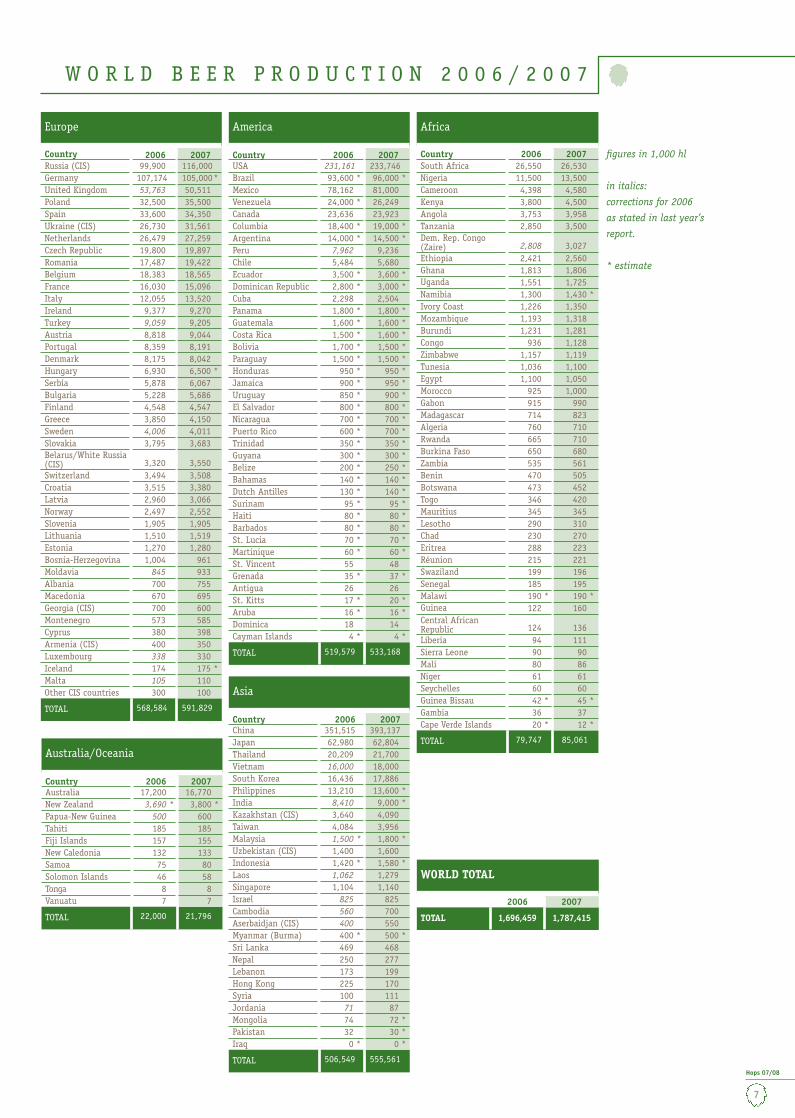
W O R L D B E E R P R O D U C T I O N 2 0 0 6 / 2 0 0 7
Europe
Country 2006 2007Russia (CIS) 99,900 116,000Germany 107,174 105,000 *United Kingdom 53,763 50,511Poland 32,500 35,500Spain 33,600 34,350Ukraine (CIS) 26,730 31,561Netherlands 26,479 27,259Czech Republic 19,800 19,897Romania 17,487 19,422Belgium 18,383 18,565France 16,030 15,096Italy 12,055 13,520Ireland 9,377 9,270Turkey 9,059 9,205Austria 8,818 9,044Portugal 8,359 8,191Denmark 8,175 8,042Hungary 6,930 6,500 *Serbia 5,878 6,067Bulgaria 5,228 5,686Finland 4,548 4,547Greece 3,850 4,150Sweden 4,006 4,011Slovakia 3,795 3,683Belarus/White Russia (CIS) 3,320 3,550Switzerland 3,494 3,508Croatia 3,515 3,380Latvia 2,960 3,066Norway 2,497 2,552Slovenia 1,905 1,905Lithuania 1,510 1,519Estonia 1,270 1,280Bosnia-Herzegovina 1,004 961Moldavia 845 933Albania 700 755Macedonia 670 695Georgia (CIS) 700 600Montenegro 573 585Cyprus 380 398Armenia (CIS) 400 350Luxembourg 338 330Iceland 174 175 *Malta 105 110Other CIS countries 300 100
TOTAL 568,584 591,829
America
Country 2006 2007USA 231,161 233,746Brazil 93,600 * 96,000 *Mexico 78,162 81,000Venezuela 24,000 * 26,249Canada 23,636 23,923Columbia 18,400 * 19,000 *Argentina 14,000 * 14,500 *Peru 7,962 9,236Chile 5,484 5,680 Ecuador 3,500 * 3,600 *Dominican Republic 2,800 * 3,000 *Cuba 2,298 2,504Panama 1,800 * 1,800 *Guatemala 1,600 * 1,600 *Costa Rica 1,500 * 1,600 *Bolivia 1,700 * 1,500 *Paraguay 1,500 * 1,500 *Honduras 950 * 950 *Jamaica 900 * 950 *Uruguay 850 * 900 *El Salvador 800 * 800 *Nicaragua 700 * 700 *Puerto Rico 600 * 700 *Trinidad 350 * 350 *Guyana 300 * 300 *Belize 200 * 250 *Bahamas 140 * 140 *Dutch Antilles 130 * 140 *Surinam 95 * 95 *Haiti 80 * 80 *Barbados 80 * 80 *St. Lucia 70 * 70 *Martinique 60 * 60 *St. Vincent 55 48Grenada 35 * 37 *Antigua 26 26St. Kitts 17 * 20 *Aruba 16 * 16 *Dominica 18 14Cayman Islands 4 * 4 *
TOTAL 519,579 533,168
Africa
Country 2006 2007South Africa 26,550 26,530Nigeria 11,500 13,500Cameroon 4,398 4,580Kenya 3,800 4,500Angola 3,753 3,958Tanzania 2,850 3,500Dem. Rep. Congo (Zaire) 2,808 3,027Ethiopia 2,421 2,560 Ghana 1,813 1,806Uganda 1,551 1,725Namibia 1,300 1,430 *Ivory Coast 1,226 1,350Mozambique 1,193 1,318Burundi 1,231 1,281Congo 936 1,128Zimbabwe 1,157 1,119Tunesia 1,036 1,100Egypt 1,100 1,050Morocco 925 1,000Gabon 915 990Madagascar 714 823Algeria 760 710Rwanda 665 710Burkina Faso 650 680Zambia 535 561Benin 470 505Botswana 473 452Togo 346 420Mauritius 345 345Lesotho 290 310Chad 230 270Eritrea 288 223Réunion 215 221Swaziland 199 196Senegal 185 195Malawi 190 * 190 *Guinea 122 160Central AfricanRepublic 124 136Liberia 94 111Sierra Leone 90 90Mali 80 86Niger 61 61Seychelles 60 60Guinea Bissau 42 * 45 *Gambia 36 37Cape Verde Islands 20 * 12 *
TOTAL 79,747 85,061
Australia/Oceania
Country 2006 2007Australia 17,200 16,770New Zealand 3,690 * 3,800 *Papua-New Guinea 500 600Tahiti 185 185Fiji Islands 157 155New Caledonia 132 133Samoa 75 80Solomon Islands 46 58Tonga 8 8Vanuatu 7 7
TOTAL 22,000 21,796
Asia
Country 2006 2007China 351,515 393,137Japan 62,980 62,804Thailand 20,209 21,700Vietnam 16,000 18,000South Korea 16,436 17,886Philippines 13,210 13,600 *India 8,410 9,000 *Kazakhstan (CIS) 3,640 4,090Taiwan 4,084 3,956Malaysia 1,500 * 1,800 *Uzbekistan (CIS) 1,400 1,600Indonesia 1,420 * 1,580 *Laos 1,062 1,279Singapore 1,104 1,140Israel 825 825Cambodia 560 700Aserbaidjan (CIS) 400 550Myanmar (Burma) 400 * 500 *Sri Lanka 469 468Nepal 250 277Lebanon 173 199Hong Kong 225 170Syria 100 111Jordania 71 87Mongolia 74 72 *Pakistan 32 30 *Iraq 0 * 0 *
TOTAL 506,549 555,561
WORLD TOTAL
2006 2007
TOTAL 1,696,459 1,787,415
fi gures in 1,000 hl
in italics:
corrections for 2006
as stated in last year’s
report.
* estimate

Hops 07/08
8
O U T P U T D E V E L O P M E N T
2006 1,000 hl
20071,000 hl
2006+/- % rel.
2007+/- % rel.
European Union 386,110 410,852 1.2% 6.4%Rest of Europe 182,474 180,977 10.5% -0.8%Europe total 568,584 591,829 4.0% 4.1%North America 254,797 257,669 0.3% 1.1%Central America/Caribbean 93,691 97,239 6.7% 3.8%South America 171,091 178,260 5.0% 4.2%America total 519,579 533,168 2.9% 2.6% Asia 506,549 555,561 11.0% 9.7%Africa 79,747 85,061 9.0% 6.7%Australia/Oceania 22,000 21,796 4.3% -0.9%
WORLD TOTAL 1,696,459 1,787,415 5.9% 5.4%
M A R K E T A N A L Y S I S
Crop year 2007 will go down in the history of the hop industry as the year of the turbo boom. The extent of the scarcity of hops and the resulting explosion in prices took the market participants at all levels by sur-prise. And yet this drama was structurally foreseeable. In the spring of 2007 it was already clear that the sup-ply bottlenecks resulting from the high global growth in the brewing industry, and in the absence of any notable increase in acreage, were not to be resolved without an outstanding harvest in 2007. The hoped-for record harvest did not arrive.
Unfavourable climatic conditions in the month of Au-gust in the USA and Germany, the pacemakers and main suppliers of the world market, produced in some cases bitterly disappointing results among the high alpha varieties. Although the alpha levels and yields per hectare in Europe were higher than in 2006, in the USA, for example, they still remained signifi cantly below the average. The harvest failed to live up to ex-pectations in other countries, too. In early September, once it became clear what could be expected of the crop, spot markets began to develop quickly in every
hop growing country for the relatively small quanti-ties of available hops compared with previous years. Consequently, farm-gate prices could only move in one direction – upwards. Spot price quotations every-where orientated themselves to the farm-gate prices paid for German and US high alpha hops. The pressure on the market was further exacerbated by the refusal of many Eastern European producers to deliver the hops they had sold by forward contract to their con-tractual partners in the trade at the prices agreed. The reasons for this supply boycott were diverse and in hardly any cases legitimate.
With only a few minor exceptions, the global hop tra-ding companies found their freedom of action severely curtailed by the chain of unfavourable circumstances described above. Their fi rst priority was to ensure their ability to fulfi l existing contracts with the brewing in-dustry by means of expensive supplementary farm-gate purchases and, by mutual agreement, by switching va-rieties. It was not until the end of September that a clear picture emerged of the hop volume freely availa-ble to the market, at which point sales to the brewing
In 2007 beer output rose by 5.4 %, or 91m hl, year on year and was once again above average. The out-put volumes stated for some countries in 2006 had to be revised, resulting in the fi gure in last year’s report being corrected downward by 2.5m hl Nevertheless, the growth in output in 2006 was still 5.9 %, which is signifi cantly above the long-term average of 3 % (1997 – 2006).
China alone, with 46 %, recorded by far the largest share in international year-on-year output growth in 2007. In addition to many other tables, China takes fi rst place among the world’s beer nations. Its share of world beer production is an impressive 22 %.
Growth in Europe, totalling 23.2m hl, can be mainly attributed to output rising in Russia (16.1m hl) and Ukraine (4.8m hl), although the United Kingdom again had a negative effect on the fi gures, this time recor-ding a minus of 3.3m hl.In America, output growth in Mexico (2.8m hl), USA (2.6m hl), Brazil (2.4m hl) and Venezuela (2.2m hl) contributed to an increase of 13.6m hl.Asia, and in particular China (+41.6m hl) and Vietnam (+2m hl), recorded a total increase of 49m hl.The country with by far the largest share in the in-crease in beer output in Africa of 5.3m hl was Nigeria (+2m hl).
As of 1.1.2007 Romania and
Bulgaria are members of the
EU.
Hops 07/08
9
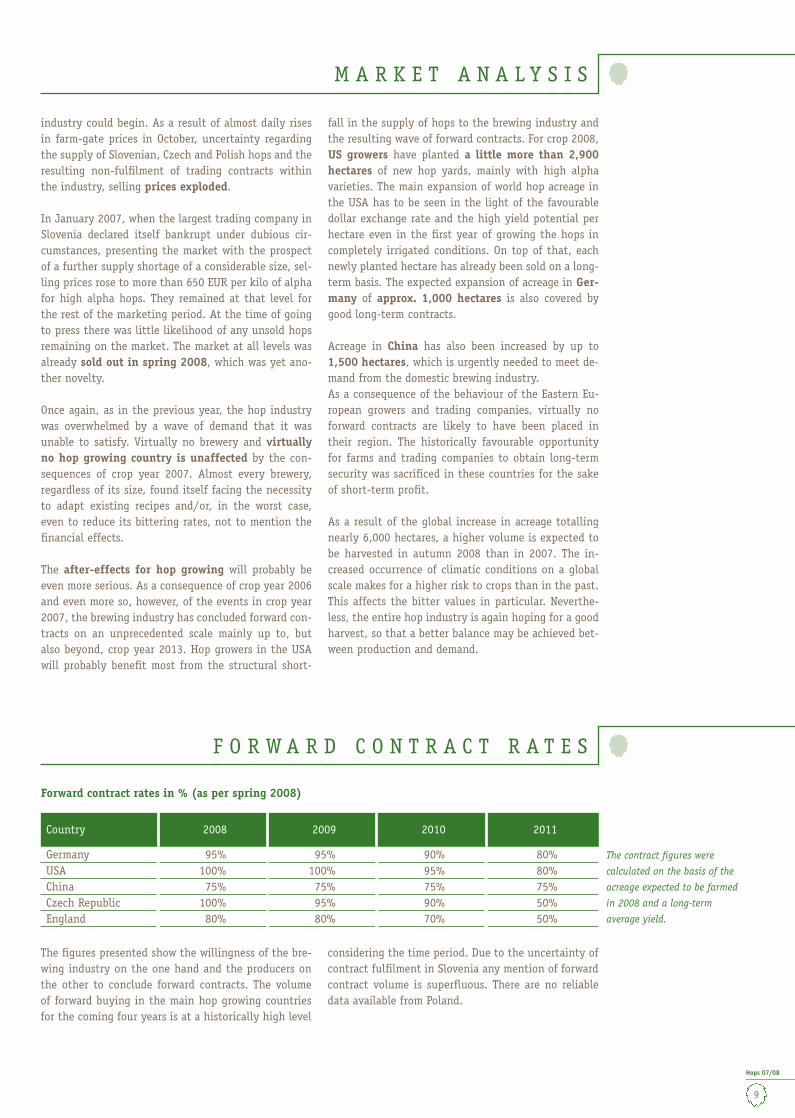
F O R W A R D C O N T R A C T R A T E S
Country 2008 2009 2010 2011
Germany 95% 95% 90% 80%USA 100% 100% 95% 80%China 75% 75% 75% 75%Czech Republic 100% 95% 90% 50%England 80% 80% 70% 50%
Forward contract rates in % (as per spring 2008)
industry could begin. As a result of almost daily rises in farm-gate prices in October, uncertainty regarding the supply of Slovenian, Czech and Polish hops and the resulting non-fulfi lment of trading contracts within the industry, selling prices exploded.
In January 2007, when the largest trading company in Slovenia declared itself bankrupt under dubious cir-cumstances, presenting the market with the prospect of a further supply shortage of a considerable size, sel-ling prices rose to more than 650 EUR per kilo of alpha for high alpha hops. They remained at that level for the rest of the marketing period. At the time of going to press there was little likelihood of any unsold hops remaining on the market. The market at all levels was already sold out in spring 2008, which was yet ano-ther novelty.
Once again, as in the previous year, the hop industry was overwhelmed by a wave of demand that it was unable to satisfy. Virtually no brewery and virtually no hop growing country is unaffected by the con-sequences of crop year 2007. Almost every brewery, regardless of its size, found itself facing the necessity to adapt existing recipes and/or, in the worst case, even to reduce its bittering rates, not to mention the fi nancial effects.
The after-effects for hop growing will probably be even more serious. As a consequence of crop year 2006 and even more so, however, of the events in crop year 2007, the brewing industry has concluded forward con-tracts on an unprecedented scale mainly up to, but also beyond, crop year 2013. Hop growers in the USA will probably benefi t most from the structural short-
fall in the supply of hops to the brewing industry and the resulting wave of forward contracts. For crop 2008, US growers have planted a little more than 2,900 hectares of new hop yards, mainly with high alpha varieties. The main expansion of world hop acreage in the USA has to be seen in the light of the favourable dollar exchange rate and the high yield potential per hectare even in the fi rst year of growing the hops in completely irrigated conditions. On top of that, each newly planted hectare has already been sold on a long-term basis. The expected expansion of acreage in Ger-many of approx. 1,000 hectares is also covered by good long-term contracts.
Acreage in China has also been increased by up to 1,500 hectares, which is urgently needed to meet de-mand from the domestic brewing industry.As a consequence of the behaviour of the Eastern Eu-ropean growers and trading companies, virtually no forward contracts are likely to have been placed in their region. The historically favourable opportunity for farms and trading companies to obtain long-term security was sacrifi ced in these countries for the sake of short-term profi t.
As a result of the global increase in acreage totalling nearly 6,000 hectares, a higher volume is expected to be harvested in autumn 2008 than in 2007. The in-creased occurrence of climatic conditions on a global scale makes for a higher risk to crops than in the past. This affects the bitter values in particular. Neverthe-less, the entire hop industry is again hoping for a good harvest, so that a better balance may be achieved bet-ween production and demand.
M A R K E T A N A L Y S I S
The fi gures presented show the willingness of the bre-wing industry on the one hand and the producers on the other to conclude forward contracts. The volume of forward buying in the main hop growing countries for the coming four years is at a historically high level
considering the time period. Due to the uncertainty of contract fulfi lment in Slovenia any mention of forward contract volume is superfl uous. There are no reliable data available from Poland.
The contract fi gures were
calculated on the basis of the
acreage expected to be farmed
in 2008 and a long-term
average yield.

Hops 07/08
10
D E V E L O P M E N T 1
80,000
A R E A U N D E R C U L T I V A T I O N H A
70,000
60,000
50,000
40,000
76,967
70,290
60,111 58,991
57,427
58,903
56,237 53,500
50,639
50,273
49,466
1996 1997 1998 1999 2000 2001 2002 2003 2004 2005 2006 2007
120,000
H O P P R O D U C T I O N M T
110,000
100,000
90,000
80,000
124,379
112,192
94,610
96,715
95,450
99,214 100,932
87,056
92,266
94,385
85,585
91,584
1996 1997 1998 1999 2000 2001 2002 2003 2004 2005 2006 2007
50,659
Hops 07/08
11
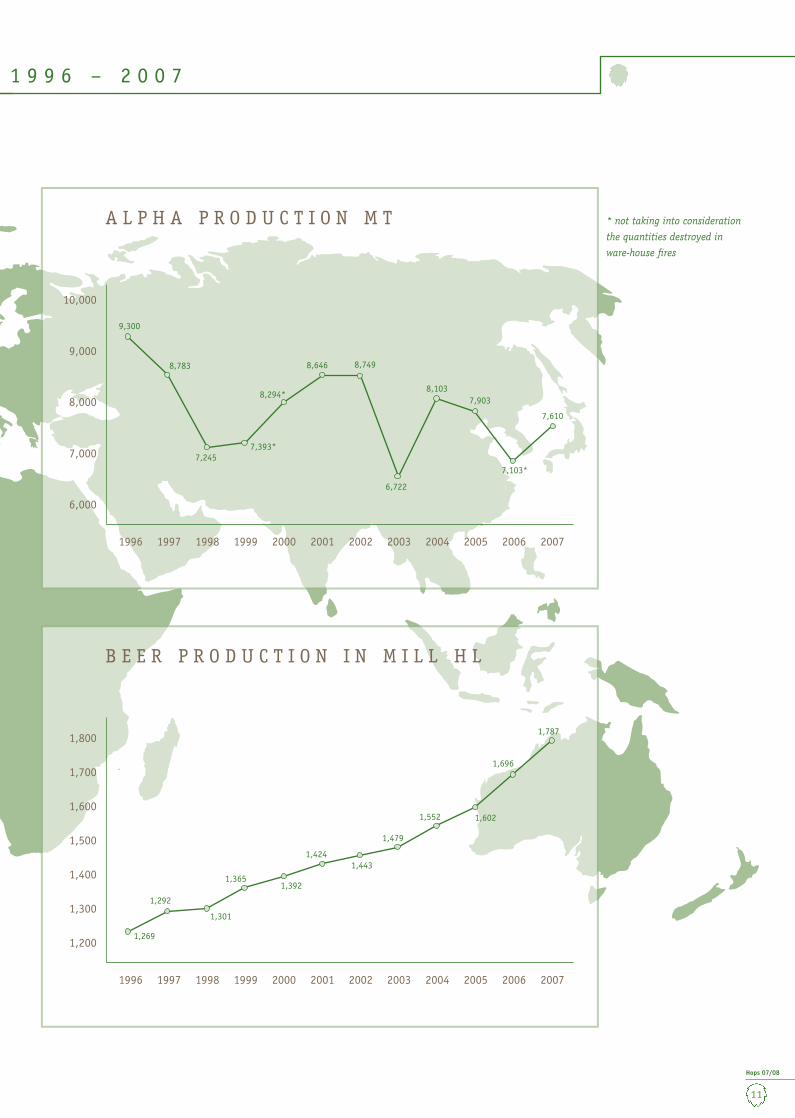
10,000
A L P H A P R O D U C T I O N M T
9,000
8,000
7,000
6,000
9,300
8,783
7,245
8,294*
7,393*
8,646 8,749
6,722
8,1037,903
7,610
7,103*
1996 1997 1998 1999 2000 2001 2002 2003 2004 2005 2006 2007
1,800
1,700
1,500
B E E R P R O D U C T I O N I N M I L L H L
1,600
1,400
1,300
1,2001,269
1,292
1,301
1,3921,365
1,4241,443
1,479
1,552 1,602
1,696
1,787
1996 1997 1998 1999 2000 2001 2002 2003 2004 2005 2006 2007
1 9 9 6 – 2 0 0 7
* not taking into consideration
the quantities destroyed in
ware-house fi res

Hops 07/08
12
2006 2007
Acreage
ha
Production
mt
Ø-Alpha
%
Alpha
mt
Acreage
ha
Production
mt
Ø-Alpha
%
Alpha
mt
Germany Hallertau 14,280 24,294.2 7.8% 1,905 14,754 27,200.8 8.6% 2,347Elbe-Saale 1,284 2,251.9 11.1% 249 1,321 2,698.3 11.8% 319Tettnang 1,200 1,423.8 2.5% 36 1,193 1,613.7 4.3% 69Spalt 387 504.2 3.6% 18 384 588.2 4.7% 28Others 19 34.2 7.2% 2 19 38.0 6.6% 3Total 17,170 28,508.3 7.8% 2,210 17,671 32,138.9 8.6% 2,766
Czech Republic Saaz 4,044 3,645.5 2.8% 103 4,006 3,891.8 3.6% 139Tirschitz 702 1,082.3 3.2% 34 702 1,025.6 3.8% 38Auscha 668 725.6 2.3% 17 681 713.2 3.1% 22Total 5,414 5,453.4 2.8% 154 5,389 5,630.6 3.5% 199
Poland 2,234 2,888.9 6.0% 172 2,179 3,256.1 6.8% 221Slovenia 1,507 1,819.0 5.6% 102 1,570 1,987.0 5.7% 113England 1,043 1,340.3 6.7% 90 1,063 1,473.0 7.2% 107France 795 1,187.7 2.4% 28 796 1,480.4 3.2% 47Spain 530 1,135.0 11.0% 125 497 936.7 12.1% 113Romania 1) – – – – 429 196.0 7.6% 15Slovakia 305 314.0 2.8% 9 300 294.0 3.7% 11Bulgaria 1) – – – – 221 227.3 8.1% 18Austria 219 342.3 6.7% 23 206 349.9 6.3% 22Belgium 183 274.0 7.7% 21 176 320.0 9.9% 32Portugal 21 25.2 9.3% 2 21 27.0 11.0% 3Hungary 37 59.0 10.9% 6 18 18.8 10.5% 2European Union 29,458 43,347.1 6.8% 2,942.0 30,536 48,335.7 7.6% 3,669Ukraine* 1,464 1,473.0 4.0% 59 1,145 700.0 5.4% 38Turkey 331 356.0 9.0% 32 331 280.0 9.3% 26Russia 420 340.0 4.4% 15 228 158.0 4.5% 7Serbia 67 138.0 6.1% 8 67 111.0 7.9% 9Belarus/White Russia 30 26.0 9.0% 2 30 30.0 9.0% 3Switzerland 20 27.7 8.9% 2 18 36.5 8.8% 3Croatia 10 15.0 5.5% 1 16 24.0 5.5% 1Romania* 1) 400 400.0 6.0% 24 – – – –Bulgaria 1) 221 275.0 9.3% 26 – – – –Rest of Europe 2,963 3,050.7 5.5% 169 1,835 1,339.5 6.5% 87EUROPE 32,421 46,397.8 6.7% 3,111 32,371 49,675.2 7.6% 3,756
USA Washington 8,714 20,100.3 12.3% 2,476 9,205 21,140.1 11.2% 2,377Oregon 2,038 4,020.5 8.6% 345 2,133 4,328.7 8.2% 353Idaho 1,132 2,045.9 8.4% 171 1,172 1,861.9 8.7% 161Total 11,884 26,166.7 11.4% 2,992 12,510 27,330.7 10.6% 2,891
Argentina* 167 290.0 7.6% 22 167 240.0 8.0% 19
AMERICA 12,051 26,456.7 11.4% 3,014 12,677 27,570.7 10.6% 2,910
China Xinjiang 1,880 5,184.0 7.3% 381 2,101 5,827.0 6.0% 347Gansu 1,664 4,698.0 6.3% 297 2,005 5,568.0 4.9% 270Total 3,544 9,882.0 6.9% 678 4,106 11,395.0 5.4% 617
Japan 235 415.1 5.8% 24 214 410.2 6.5% 27India 60 40.0 11.4% 5 62 42.5 11.1% 5
ASIA 3,839 10,337.1 6.8% 707 4,382 11,847.7 5.5% 649
South Africa 430 682.0 13.5% 92 434 900.2 13.0% 117AFRICA 430 682.0 13.5% 92 434 900.2 13.0% 117
Australia 372 1,044.0 11.3% 118 441 890.0 12.2% 108New Zealand 353 667.1 9.1% 61 354 700.1 10.0% 70
AUSTRALIA/OCEANIA 725 1,711.1 10.5% 179 795 1,590.1 11.2% 178
WORLD 49,466 85,584.7 8.3% 7,103 50,659 91,583.9 8.3% 7,610
Destroyed in a US warehouse fi re -110Remaining alpha quantity 6,993
H O P A C R E A G E A N D P R O D U C T I O N
* estimate
1) Accession to the European
Union as of 1.1.2007
in italics:
corrections for 2006 as stated
in last year’s report.

Hops 07/08
13
6,993 t α
7,610 t α
2004
5.1 g α/hl
2005
5.0 g α/hl
2006
4.9 g α/hl
2007
4.8 g α/hl
2008
4.6 g α/hl
8,580 t α8,469 t α*
A L P H A A C I D P R O D U C T I O N
Alpha acid production world-wide has been divided into variety groups:
A L P H A A C I D B A L A N C E
In crop year 2007 world alpha acid production in-creased by slightly more than 500 mt year on year.In 2007, as in the previous year, fi ne aroma hops suf-fered in terms of production volume due to unfavour-able weather conditions. The prevailing climatic condi-tions worldwide had an even more unfavourable effect on the high alpha varietal group.
Together, Germany and the USA produced 74.3 % of to-tal world alpha in crop year 2007 (previous year 73.3 %).Although the USA‘s share declined, it remained the largest alpha-producing nation, with 38 % (previous year 42.1 %). Germany improved from 31.1 % in the previous year to 36.3 % in 2007, thus taking second place, followed by China with 8.1 %, down from 9.5 % the year before.
8,500
8,000
7,500
7,000
6,500
9,000Brew year Surplus/Defi cit
2004 -1,194 t α
2005 +90 t α
2006 -410 t α
2007 -1,587 t α
2008* -859 t α
GROUP I: Fine aroma hops such as Hallertau Mittelfrueh, Hersbruck Spaet, Klon 18, Lublin, Saaz, Saphir, SA-1, Spalt, Styrian Golding, Strisselspalt, Tettnang.
GROUP II: Aroma hops such as Aurora, Cascade, First Gold, Fuggles, Golding, Hallertau Tradi-tion, Horizon, Mount Hood, NZ Hallertau, Perle, Spalt Select, Sterling, Willamette.
GROUP III: Bitter hops/High Alpha hops
such as Admiral, Chelan, Chinook, Cluster, Columbus/Tomahawk/Zeus (CTZ), Galena, Hallertau Magnum, Hallertau Taurus, Herkules, Kirin Flower, Marco Polo, Marynka, Millennium, Northern Brewer, Nugget, NZ Pacifi c Gem, Phoenix, Pride of Ringwood, Super Pride, Target, Tsingdao Flower, Victoria, Warrior.
2006 2007
Group Cropshare
Cropmt
AlphaØ
Alphamt
Alpha share
Cropshare
Cropmt
AlphaØ
Alphamt
Alphashare
I 17.0% 14,541 2.4% 347 4.9% 15.0% 13,774 3.0% 419 5.5%II 26.3% 22,551 5.3% 1,186 16.7% 29.1% 26,664 5.9% 1,563 20.5%III 56.7% 48,493 11.5% 5,570 78.4% 55.9% 51,146 11.0% 5,628 74.0%
TOTAL 100.0% 85,585 8.3% 7,103 100.0% 100.0% 91,584 8.3% 7,610 100.0%
The high alpha acid defi cit forecast for the 2007 bre-wing year in last year’s report turned out to be even higher than estimated. The estimate of beer output in 2007 was based on an average growth rate of 3 % per year over the last 10 years. In actual fact, however, beer production rose by 5.4 %. Although some 617 mt more alpha acid was available after the 2007 harvest compared with 2006, the total volume produced came nowhere near to meeting demand. For the third year in succession less alpha was harvested than was required. This amounted to a shortfall of more than 2,800 tons
in the last three years. Once again breweries’ stocks were used to make up for the shortfall, although they too are running low. Our estimates for the 2008 brew-ing year are again based on an increase in beer pro-duction of 3 %.These statistics do not take into account the alpha degradation that occurs during the time between the processing of the hops and their use in the brewing industry or the approx. 200 mt of alpha required for use outside the brewing industry.
Alpha supply
With the world hop crop divided into these groups, alpha acid production was as follows:
Brew year
Hopping rate
Crop year 2003 2004 2005 2006 2007
6,722 t α
8,103 t α
7,916 t α8,013 t α
8,313 t α
7,903 t α
Varieties with a long-term
average alpha content of up
to 4.5 %
Varieties with a long-term
average alpha content of over
4.5 %
Some minor corrections have
been made to the crop and
alpha volumes for 2006 con-
tained in last year’s report.
Alpha group I – fi ne aroma
hops: Germany 43.7 %
(previous year: 38.3 %),
Czech Republic 29.4 %
(previous year: 29.2 %).
Alpha group II – aroma hops:
Germany 55.7 % (previous
year: 46.8 %), USA 21.9 %
(previous year: 29.3 %).
Alpha group III – bitter hops/
high alpha hops: USA 45.3 %
(previous year: 47.5 %),
Germany 30.4 % (previous
year: 27.3 %).
Alpha demand (Brew year)
Alpha production
(Crop year)
* Estimated demand

Hops 07/08
14
G E R M A N Y
Area VarietyDevelopment of acreage
Acreage haDevelopment of production
Ø-Yield mt/ha Production mt
2006 +/- 2007 2006 2007 2006 2007Hallertau Perle 2,931 103 3,034 1.55 1.98 4,548.41 6,010.80
Hallertau Tradition 2,235 123 2,358 1.68 2.01 3,765.77 4,749.15Hallertau Mittelfrueh 1,516 78 1,594 1.38 1.07 2,085.66 1,708.73Hersbruck Spaet 865 -124 741 1.74 1.99 1,502.06 1,471.62Spalt Select 740 -7 733 1.83 2.26 1,351.89 1,654.48Saphir 191 -5 186 2.00 2.48 381.20 461.51Other Aroma 56 1 57 1.19 1.74 66.61 99.27Total Aroma 8,535 168 8,703 1.61 1.86 13,701.60 16,155.56Northern Brewer 395 -61 334 1.34 1.70 528.15 569.06Other Bitter 32 -1 31 2.16 2.43 69.27 75.32Total Bitter 427 -62 365 1.40 1.77 597.42 644.38Hallertau Magnum 3,549 -120 3,429 1.96 1.84 6,969.31 6,308.16Hallertau Taurus 1,146 -29 1,117 1.89 2.07 2,160.69 2,307.93Herkules 201 574 775 0.50 1.27 100.19 981.00Nugget 288 -37 251 1.90 2.39 548.29 598.77Hallertau Merkur 100 -17 83 1.68 1.86 168.14 154.35Other High Alpha 16 -7 9 1.39 1.86 22.31 16.74Total High Alpha 5,299 367 5,666 1.88 1.83 9,968.93 10,366.95Others 19 1 20 1.38 1.69 26.25 33.87Total Hallertau 14,280 474 14,754 1.70 1.84 24,294.20 27,200.76
Elbe-Saale Perle 128 4 132 1.42 1.91 181.81 251.96Hallertau Tradition 38 0 38 0.74 1.13 28.07 42.95Other Aroma 0 0 0 0.00 0.00 0.00 0.37Total Aroma 166 4 170 1.26 1.74 209.88 295.28Northern Brewer 155 -18 137 1.20 1.92 185.99 263.70Total Bitter 155 -18 137 1.20 1.92 185.99 263.70Hallertau Magnum 831 -4 827 1.97 2.21 1,638.70 1,830.85Herkules 13 71 84 0.64 1.06 8.37 89.42Other High Alpha 111 -16 95 1.80 2.15 199.41 204.08Total High Alpha 955 51 1,006 1.93 2.11 1,846.48 2,124.35Others 8 0 8 1.19 1.87 9.53 14.96Total Elbe-Saale 1,284 37 1,321 1.75 2.04 2,251.88 2,698.29
Tettnang Tettnang 754 6 725 1.15 1.30 863.69 945.16Hallertau Mittelfrueh 406 4 378 1.19 1.32 482.02 497.99Other Aroma 35 6 81 1.94 1.88 67.90 151.98Total Aroma 1,195 16 1,184 1.18 1.35 1,413.61 1,595.13High Alpha 5 4 9 2.04 2.06 10.19 18.56Total Tettnang 1,200 20 1,193 1.19 1.35 1,423.80 1,613.69
Spalt Spalt Select 114 -3 111 1.44 1.99 164.71 220.75Hallertau Mittelfrueh 114 -5 109 1.18 1.32 134.45 143.73Spalt 89 2 91 1.08 1.16 96.06 105.95Other Aroma 57 0 57 1.50 1.67 85.68 95.04Total Aroma 374 -8 366 1.29 1.55 480.90 565.47High Alpha 14 4 18 1.66 1.26 23.26 22.69Total Spalt 387 -3 384 1.30 1.53 504.16 588.16
Rhen.-P./Hochdorf
Aroma 14 2 16 1.81 1.89 25.37 30.17High Alpha 5 -2 3 1.77 2.60 8.84 7.80Total Rhenish./Hoch. 19 0 19 1.80 2.00 34.21 37.97
Total Aroma 10,284 156 10,440 1.54 1.79 15,831.36 18,641.61Total Bitter 582 -80 502 1.35 1.81 783.41 908.08Total High Alpha 6,277 424 6,701 1.89 1.87 11,857.70 12,540.35Total Others 27 1 28 1.33 1.74 35.78 48.83GERMANY TOTAL 17,170 501 17,671 1.66 1.82 28,508.25 32,138.87
200520042003
3,000
2,000
2,500
3,500
3,052 3,005
2,210
2,766
20072006
1,6431,500
1,000
500
Alpha production in mt
Rounding differences of the
acreage may cause differences
in addition.

Hops 07/08
15
Area Estimate (mt)August 2007
Weight (mt)31.3.08
Hallertau 26,500.00 27,200.76Elbe-Saale 2,253.60 2,698.29Tettnang 1,625,00 1,613.69 Spalt 525.00 588.16Rhenish-Palatinate/Hochdorf 35.50 37.97
TOTAL 30,939.10 32,138.87
Farm StructureIn spite of the return of a more favourable market en-vironment, the number of producers actively farming hops in crop year 2007 fell by 45 to 1,510. At the same time acreage increased. The average acreage of hops per farm rose accordingly from 11.0 ha in 2006 to 11.7 ha in 2007.
Growth, crop estimate and weightsThe winter of 2006/2007 was unusually mild. Tempera-tures seldom fell below freezing point. The work usual-ly done in winter was made diffi cult by above-average precipitation in January and February because the ground lacked the necessary load-bearing strength due to lack of frost. The continuation of the mild tempera-tures led to vegetation starting very early. The spring work had to be done at a correspondingly early date. Cutting had already begun by the end of the third week of February. The plants developed so quickly that training could begin as early as mid-April, which is unusually early. This work had been fi nished by the end of April. At that point vertical growth differed widely according to variety, with Hallertau Magnum far ahead of the other varieties with a height of up to 3 meters. The hop plants survived the driest April since weather records began without any damage thanks to the good soil moisture that had built up in the months before. There were only isolated cases of adverse ef-fects on yields due to crown rot, particularly among Hallertau Taurus plants. Strong winds and heavy rain, in some cases mixed with hail, in the month of May
dislodged many shoots from their training wires or even broke some of them off. Although this caused a considerable amount of additional work, it only af-fected yields adversely later on in seriously damaged plants, however. With the above-average temperatures continuing into June, hop growth remained ahead of normal in development and in some cases moved even further ahead. Consequently, most of the plants reached approx. 90 % of trellis height by mid-June. Also at this time, the onset of fl owering could already be observed in the fi rst hop yards. This early fl owering led to below-average production volume and alpha acid yields in the Hallertau Mittelfrueh variety and, to some extent, in Hallertau Magnum hops. At the end of June the weather cooled down again and the dif-ference in development between the hop plants and the long-term average shortened considerably. Nearly all varieties, with the exception of Hallertau Mittel-frueh, began to fl ower at the right time, which meant that there were no yield losses. A thunderstorm with heavy hail showers destroyed an estimated 1,000 mt of hops in the Hallertau region on 21 July.Thanks to the favourable weather conditions, with suffi cient rainfall in July and August, the varieties Hallertau Taurus and Perle in particular continued to develop well until harvest time. The other varieties too, with the exception of Hallertau Mittelfrueh and Hallertau Magnum, produced satisfactory yields, with good external quality and in some cases even above-average alpha acid content.
G E R M A N Y
The fi nal total recorded as the offi cially certifi ed hop volume for 2007 was 4 % above the crop estimate at the start of picking. The production volume, was 3,630 mt,
or 13 %, higher than the year before. The apha yield by weight produced a total increase of 25 %.

Hops 07/08
16
G E R M A N Y
Variety 2003ha
2004ha
2005ha
2006ha
2007ha
Perle 2,829 2,839 2,947 3,112 3,218Hallertau Tradition 1,727 1,958 2,173 2,322 2,445Hallertau Mittelfrueh 1,903 1,970 2,019 2,036 2,082Spalt Select 867 850 850 854 846Hersbruck Spaet 1,270 1,196 1,050 871 747Tettnang 822 790 767 752 725Spalt 116 101 99 98 92Other Aroma 134 185 227 239 285Total Aroma 9,668 9,889 10,132 10,284 10,440Northern Brewer 870 665 612 550 471Other Bitter 44 40 39 32 31Total Bitter 914 705 651 582 502Hallertau Magnum 4,929 4,870 4,526 4,387 4,263Hallertau Taurus 1,284 1,272 1,215 1,178 1,144Herkules – – – 214 868Nugget 501 450 380 331 290Other High Alpha 236 246 228 167 136Total High Alpha 6,950 6,838 6,349 6,277 6,701Others 30 44 29 27 28
GERMANY TOTAL 17,562 17,476 17,161 17,170 17,671
Over the last fi ve years the acreage developed as follows:
As was already the case in previous years, the acreage planted with aroma varieties grew further. This ex-pansion totalled 156 ha. The most signifi cant changes could be observed among the varieties Hallertau Tra-dition (+123 ha), Perle (+106 ha), Hallertau Mittel-frueh (+46 ha) and Hersbruck Spaet (-124 ha).The steady downward trend among the bitter varieties continued. Their acreage fell by 80 ha (-13.7 %).The acreage devoted to high alpha varieties grew for the fi rst time since 2004. The increase in crop year 2007 amounted to 424 ha (+6.7 %). This can be attri-buted solely to the Herkules variety whose acreage increased by 654 ha. The acreage of all the other high alpha varieties was reduced, especially that of the main variety Hallertau Magnum, with -124 ha.
Alpha Acid The alpha acid results for crop 2007 were good to very good and lay within the medium-term mean or above it. The two main varieties Perle and Hallertau Mag-num produced surprising results. The aroma variety Perle shone with good yields per hectare and good, above-average alpha acid values. The high alpha varie-
ty Hallertau Magnum, on the other hand, was disap-pointing in the Hallertau growing region, in terms of both yield and alpha production, with a signifi cantly negative effect on the alpha acid balance.
The alpha acid table shows the average alpha acid values measured in freshly harvested hops by mem-bers of “Arbeitsgruppe Hopfenanalyse” (AHA) on the fi xed date of 15 October. The members of AHA are the in-house laboratories of the German hop processing plants, the Bavarian state institute of agriculture‘s hop department (Hüll) and Labor Veritas (Zürich).These values constitute the basis for any adjustments of supply contracts containing “alpha clauses” between the brewing industry and hop merchants. The alpha clause was devised jointly by the German brewers‘ as-sociation and the hop industry association and applied for the fi rst time as a result of the 2003 harvest. It is a contractual provision used solely in forward contracts for aroma hops. The average values serve as the basis for parties concluding new supply contracts containing an alpha clause.
Share per variety group in
2007:
Aroma hops 59 %
Bitter varieties 3 %
High alpha varieties 38 %.
Acreage and Variety DevelopmentIn crop year 2007 hop acreage farmed in Germany was 501 ha (2.9 %) higher than in the previous year. Despitethe increase in acreage in the group comprising the
aroma varieties, their share of the fi nal total decreased due to the comparatively greater increase in the acreage planted with high alpha varieties.

Hops 07/08
17
G E R M A N Y
Area Variety 1998 1999 2000 2001 2002 2003 2004 2005 2006 2007 Ø 5Years
Ø 10Years
Hallertau Hallertau 4.7 4.1 4.9 4.6 4.6 3.1 4.3 4.4 2.4 3.9 3.6 4.1Hersbruck 3.7 2.1 4.9 3.0 3.2 2.1 3.0 3.5 2.2 2.6 2.7 3.0Saphir – – – – – – 3.4 4.1 3.2 4.6 3.8 –Opal – – – – – – – – – 7.4 7.4 –Smaragd – – – – – – – – – 6.1 6.1 –Perle 6.7 7.0 8.1 7.0 8.6 3.9 6.4 7.8 6.2 7.9 6.4 7.0Spalt Select 5.5 4.5 6.4 4.8 6.0 3.2 4.9 5.2 4.3 4.7 4.5 5.0Hallertau Tradition 5.6 6.0 7.1 6.3 7.2 4.1 6.3 6.3 4.8 6.0 5.5 6.0Northern Brewer 9.1 9.0 10.1 9.6 10.1 6.0 9.8 9.8 6.4 9.1 8.2 8.9Hallertau Magnum 14.0 13.4 14.4 13.9 14.6 11.7 14.8 13.8 12.8 12.6 13.1 13.6Nugget 11.2 10.0 12.9 11.9 12.4 8.5 10.6 11.3 10.2 10.7 10.3 11.0Hallertau Taurus 13.7 15.9 15.6 15.7 16.5 12.3 16.5 16.2 15.1 16.1 15.2 15.4Hallertau Merkur – – – – – – 13.5 13.3 10.3 13.0 12.5 –Herkules – – – – – – – – – 16.1 16.1 –
Elbe-Saale Hallertau Magnum 12.4 12.2 14.0 13.9 13.9 10.2 14.0 14.4 12.4 13.3 12.9 13.1Tettnang Tettnang 4.0 3.8 4.9 4.4 4.6 2.6 4.7 4.5 2.2 4.0 3.6 4.0
Hallertau 4.3 4.2 4.8 4.5 4.8 3.1 5.0 4.8 2.6 4.3 4.0 4.2Spalt Spalt 4.4 3.8 4.0 4.4 4.6 3.1 4.4 4.3 2.8 4.6 3.8 4.0
Alpha acid values as is, as per EBC 7.4, in freshly harvested hops.All other alpha acid values mentioned in the Barth Report were recorded on the basis of % as is, EBC 7.4 ToP (Time of Processing).
Market developmentThe hop market was inactive during the harvest. How-ever, the growers’ association opened their now custo-mary hop pool. It was not until mid to late Septem-ber, when the alpha values and production volumes specifi c to the crop became apparent, that an open market developed with fi rm prices for all varieties. The market for high alpha hops opened with prices around 7.00 EUR/kg for raw hops and developed a remarkable momentum until mid-October. Bidding for the varieties Hallertau Magnum, Hallertau Taurus and Herkules gradually rose to levels of up to 16.00 EUR/kg for raw hops. The high alpha hops had already reached the pricethreshold of 10.00 EUR/kg by late September. The aro-ma varieties were purchased at steadily rising price le-vels from late September to mid-October. Perle ranged from 6.50 to 13.00 EUR, Hallertau Tradition from around 6.50 to 11.00 EUR and Spalt Select from around 6.50 to 9.00 EUR per kilo of raw hops respectively. Grow-ers were even offered prices of up to 8.50 EUR/kg for Hersbruck hops. Between the middle and the end of October the few remaining open hops of the varieties Hallertau Taurus and Herkules fetched record prices of up to 20.00 EUR/kg for raw hops, and even more than that for lots with top alpha content. Due to the record prices unheard of since crop year 1980, the mar-ket was already virtually cleared by mid-November.
As a consequence of the opening of the hop pool by the growers‘ association, the other hop trading compa-
nies felt obliged to engage in hop purchasing initia-tives in addition to purchasing in the market for open hops described above. However, the market for hops from crop 2007 largely played out in the conventional open market at fi xed prices. According to the EU crop report, a total of 6,740 mt of hops was sold on the 2007 hop market at an average price of 11.19 EUR/kg. This corresponds to 21 per cent of the total crop. The German growers thus benefi ted widely from a spot market with historically high prices.
Due to the strength of demand from the brewing in-dustry, the terms of forward contracts were gradually extended following crop 2007. Whereas in the spring of 2007 growers were offered contract terms running to 2011 at the most for alpha varieties and to 2012 at the most for aroma varieties, by the summer of 2007 contracts were already being offered with terms run-ning up to and including 2013 and as of October the terms were up to and including 2014. As of January 2008, forward contracts were being offered up to and including 2015 for alpha and aroma hops and, fi nally, as of March 2008 ten-year terms were being offered for alpha hops. After more than 15 years characterised by spot markets and short contract terms, large quan-tities of hops are now covered by long-term forward contracts because brewers consider the safeguarding of raw material supplies at medium price levels to be more important than price-oriented purchasing on the spot markets (see page 9).
Alpha acid values in 2007
mostly average to above-
average disappointing
results, however, from the
main variety Hallertau
Magnum.
If the fi gures for the years
2003 to 2007 are not com-
plete, the 5-year average
refers to the average fi gure
for the years available.
Figures in %

Hops 07/08
18
Variety Development of acreage Acreage ha
Development of production Ø-Yield mt/ha Production mt
2006 +/- 2007 2006 2007 2006 2007Saaz 4,926 -86 4,840 0.96 0.94 4,717.9 4,563.4Premiant 181 68 249 1.35 1.70 244.8 424.4Sládek 222 -7 215 1.64 2.27 363.5 488.2Bor 17 -7 10 0.81 0.52 13.7 5.2Total Aroma 5,346 -32 5,314 1.00 1.03 5,339.9 5,481.2Agnus 51 0 51 1.70 2.35 86.6 119.7Magnum 7 3 10 1.81 1.54 12.7 15.4Total High Alpha 58 3 61 1.71 2.21 99.3 135.1Others 10 4 14 1.42 1.02 14.2 14.3
CZECH REPUBLIC TOTAL 5,414 -25 5,389 1.01 1.04 5,453.4 5,630.6
Farm StructureThe number of hop growers decreased year on year by 6 and now stands at 139. The average area used for hop production has increased from 37 ha to 39 ha per farm.
Acreage/Production/Alpha ContentThe development of the acreage in the individual hop growing areas varied widely: Saaz -38 ha, Tirschitz +/- 0,Auscha +13 ha. On the whole, the progressive reduction in hop acreage in the Czech Republic since 2001 lessened to some extent. Among the aroma varieties there was some replacement of Saaz with Premiant. Although the average yield per hectare improved year on year, it still remained below the long-term average, however. The alpha acid content of the 2007 hop crop was slightly below the average long-term fi gure. The results in de-tail (results for crop year 2006 in brackets): Saaz 2.7 %(2.1 %), Sládek 5.6 % (6.1 %), Premiant 8.0 % (6.9 %),Agnus 10.2 % (11.6 %). The alpha acid yield in terms of weight increased by 30 % year on year.
Market SituationThe entire volume produced in crop year 2007 had been purchased by forward contract. However, the Czech hop growers refused to supply the hops on the terms agreed. They were only willing to supply the hops if higher prices were paid. They cited a dramatic in-crease in production costs and the severe adverse ef-fects of the rise in the value of the Czech crown against the euro as reasons for their action. According to the Czech growers’ association, compliance with the terms of the forward contracts would have resulted in high losses for the growers. Moreover, they point out that due to a disproportionate percentage of old plants, the yields of Saaz hops have been below average for years and are subject to considerable fl uctuations in produc-tion volume as a result of heat and dry conditions. The entire 2008 crop has been contracted. Changes in the varietal mix from Saaz to Sládek and Premiant are continuing to a limited extent.
C Z E C H R E P U B L I C
P O L A N D
Variety Development of acreage Acreage ha
Development of production Ø-Yield mt/ha Production mt
2006 +/- 2007 2006 2007 2006 2007Lubelski 743 -104 639 1.03 1.18 768.3 752.2Perle 47 39 86 0.80 1.03 37.4 88.2Lomik 47 -17 30 1.31 1.76 61.6 52.9Other Aroma 11 20 31 0.65 0.87 7.1 27.0Total Aroma 848 -62 786 1.03 1.17 874.4 920.3Marynka 1,011 -53 958 1.36 1.75 1,372.1 1,679.5Other Bitter 48 15 63 0.74 0.96 35.7 60.5Total Bitter 1,059 -38 1,021 1.33 1.70 1,407.8 1,740.0Magnum 327 45 372 1.86 1.60 606.7 595.8Total High Alpha 327 45 372 1.86 1.60 606.7 595.8
POLAND TOTAL 2,234 -55 2,179 1.29 1.49 2,888.9 3,256.1
200520042003
267
302
154
199
20072006
175
250
150
200
300
100
350
Alpha production in mt
200520042003
250
150
200
300
211221
237
172
20072006
197
100
Alpha production in mt

Hops 07/08
19
S L O V E N I A
Variety Development of acreage Acreage ha
Development of production Ø-Yield mt/ha Production mt
2006 +/- 2007 2006 2007 2006 2007Aurora 940 52 992 1.22 1.21 1,147.0 1,205.0Styrian Golding 344 -31 313 0.98 1.08 336.0 340.0Bobek 151 7 158 1.70 1.87 256.0 296.0Other Aroma 0 31 31 0.00 1.94 0.0 60.0Total Aroma 1,435 59 1,494 1.21 1.27 1,739.0 1,901.0Magnum 72 4 76 1.11 1.13 80.0 86.0Total High Alpha 72 4 76 1.11 1.13 80.0 86.0
SLOVENIA TOTAL 1,507 63 1,570 1.21 1.27 1,819.0 1,987.0
Farm Structure2007 saw the number of active hop growers decrease by 10 year on year to stand at 140. At the same time, the average hop acreage rose from 10 ha to 11 ha per farm. The main hop growing region is Savinja Valley.
Acreage/Production/Alpha ContentWhile total hop acreage increased by 4 % in 2007, the acreage of the Styrian Golding variety was reduced. Although weather conditions were hardly typical, the overall effect they had on hop growth was positive. However, production volume reduced as a result of hailstorms in May and, in particular, in August affec-ting more than 400 ha.As was the case in 2006, alpha levels were far below the long-term average levels. The results for the aro-ma varieties in 2007 compared with the previous year: Styrian Golding 3.2 % (3.0 %), Bobek 4.0 % (4.2 %),Aurora 6.5 % (6.3 %). Compared with the previous year, the volume of alpha produced improved by 11 %.
Market SituationPointing to crop losses as a result of a tornado on 17.8.2007, a considerable number of hop growers failed to supply the volume agreed in their existing contracts. Once all relevant data had been collected, this action proved to have been mostly unrightful.Production volume was by no means as low as forecast. Gradually it became known that some forward contract parties had been undersupplied and the excess hops thus available had been sold to other buyers at at-tractive spot market prices. What is more, the greater part of the Slovenian hop crop is traditionally taken up by the former growers’ cooperative Hmezad. The forward contracts for this part of the crop could not be fulfi lled due to the bankruptcy of the marketing company Unihop. Those buyers of Slovenian hops who were not supplied were left to fi nd solutions of their own. It is not certain that existing contracts for the crops of 2008 and the following years will be fulfi lled by the Slovenian parties. The acreage strung with aroma varieties for the 2008 harvest has probably in-creased slightly.
Farm StructurePrior to the harvest in 2007, the number of hop growers in Poland decreased by a further 47. The 1,066 produc-ers still active farmed an average of 2 ha each, i.e. exactly the same acreage as in crop year 2006, which meant that total acreage decreased accordingly. The centre of hop growing in Poland is the region around the town of Lublin.
Acreage/Production/Alpha ContentAs in the previous year, the aroma variety Lubelski and the bitter variety Marynka were cut back. Con-sequently, acreage decreased by 2.5 %. During the vegetation period conditions for hop growth were fa-vourable. Isolated cases of hail and storm damage in the spring and in July did affect the fi nal production volume, however. Nevertheless, the yield per hectare improved by 15 % year on year. The alpha contents were also signifi cantly higher: aroma varieties 3.0 % (2.3 %), bitter varieties 8.3 % (7.6 %). As a result, the total volume of alpha by weight rose by 28 %.
Market SituationCiting lower yields due to hail and storm damage, which, as it later transpired, were not nearly as signi-fi cant as at fi rst stated, both growers and Polish hop merchants unilaterally declared the existing hop sup-ply contracts null and void. Due to the tense market situation and in order to limit the damage, the buyers felt compelled to submit to the demands of the Polish suppliers for considerable price increases. However, af-ter a further sharp rise in prices due to demand from Polish hop merchants, Polish suppliers did not consider themselves obliged to honour this second agreement either. No stocks of the 2007 crop are available. Be-cause of the anarchic situation in Poland, there are no reliable data available with regard to forward contract volume. It is unlikely, however, that many forward contracts have been concluded for future crop years. No change in acreage is anticipated.
P O L A N D
200520042003
150
50
100
200
231
189
102
113
20072006
75
0
250
Alpha production in mt

Hops 07/08
20
E N G L A N D
F R A N C E
Variety Development of acreage Acreage ha
Development of production Ø-Yield mt/ha Production mt
2006 +/- 2007 2006 2007 2006 2007Golding 260 15 275 1.51 1.44 391.4 394.9First Gold 170 3 173 0.86 0.95 147.0 164.1Fuggles 147 -7 140 1.25 1.52 184.3 212.1Challenger 79 6 85 1.30 1.55 103.0 131.9Other Aroma 117 31 148 1.18 1.28 138.5 189.3Total Aroma 773 48 821 1.25 1.33 964.2 1,092.3Target 133 -12 121 1.42 1.55 189.5 188.1Other High Alpha 137 -16 121 1.36 1.59 185.9 192.6Total High Alpha 270 -28 242 1.39 1.57 375.4 380.7Others 0 0 0 0.00 0.00 0.7 0.0
ENGLAND TOTAL 1,043 20 1,063 1.29 1.39 1,340.3 1,473.0
Farm StructureAs in previous years, hops were produced in England by 60 growers. The average area devoted to hop growing was 17.7 ha. Hop growing is divided almost equally between two areas in South-East England and the Mid-lands.
Acreage/Production/Alpha ContentThe acreage planted with aroma varieties grew by 6 %, whereas there was a reduction of 10 % in high alpha acreage. English hop farming is concentrating more and more on aroma varieties, while bitter and high alpha varieties are becoming increasingly insignifi cant. In total, the acreage recorded for crop year 2007 showed a slight increase over the previous year.
With regard to yields and alpha acid contents, the re-sults for 2007 can be described as average.Alpha acid content in 2007, with previous year in brack-ets: Golding 4.9 % (4.4 %), First Gold 8.1 % (8.2 %),Fuggles 4.7 % (4.3 %), Challenger 7.0 % (6.5 %), Tar-get 10.8 % (9.4 %). In total, the weight of alpha acid produced in 2007 was up by 18 % year on year.
Market SituationMore than 80 % of the volume produced was sold on the basis of forward contracts. The crop is completely sold out. By April more than 80 % of the 2008 crop was already under contract. A slight increase in acreage is expected, mainly accounted for by aroma varieties.
Area Variety Development of acreage Acreage ha
Development of production Ø-Yield mt/ha Production mt
2006 +/- 2007 2006 2007 2006 2007Alsace Strisselspalt 636 -14 622 1.56 1.93 992.2 1,198.1
Other Aroma 109 17 126 1.15 1.74 125.4 219.4Total Aroma 745 3 748 1.50 1.90 1,117.6 1,417.5Bitter 4 -1 3 1.38 0.67 5.5 2.0High Alpha 18 -1 17 1.86 1.32 33.5 22.5Total Alsace 767 1 768 1.51 1.88 1,156.6 1,442.0
Nord Aroma 10 -8 2 0.90 1.55 9.0 3.1Bitter 4 0 4 1.48 1.53 5.9 6.1High Alpha 14 8 22 1.16 1.33 16.2 29.2Total North 28 0 28 1.11 1.37 31.1 38.4
FRANCE TOTAL 795 1 796 1.49 1.86 1,187.7 1,480.4
Farm StructureIn crop year 2007 there were 90 active hop growers, 6 fewer than in the previous year. The average hop acre-age per farm increased from 8.3 ha to 8.8 ha.
Acreage/Production/Alpha ContentHop acreage increased in total by 1 ha. In the Alsace region, the process of change in the variety mix among the aroma hop varieties continued. Most of the acre-age that had been cleared of Strisselspalt hops was replanted with Hallertau Tradition.
200520042003
150
50
100
200172
125
90
107
20072006
159
0
250
Alpha production in mt
200520042003
30
20
25
35
22
28
47
39
20072006
25
15
40
45
50
55
Alpha production in mt
Hops 07/08
21
S P A I N
S L O V A K I A
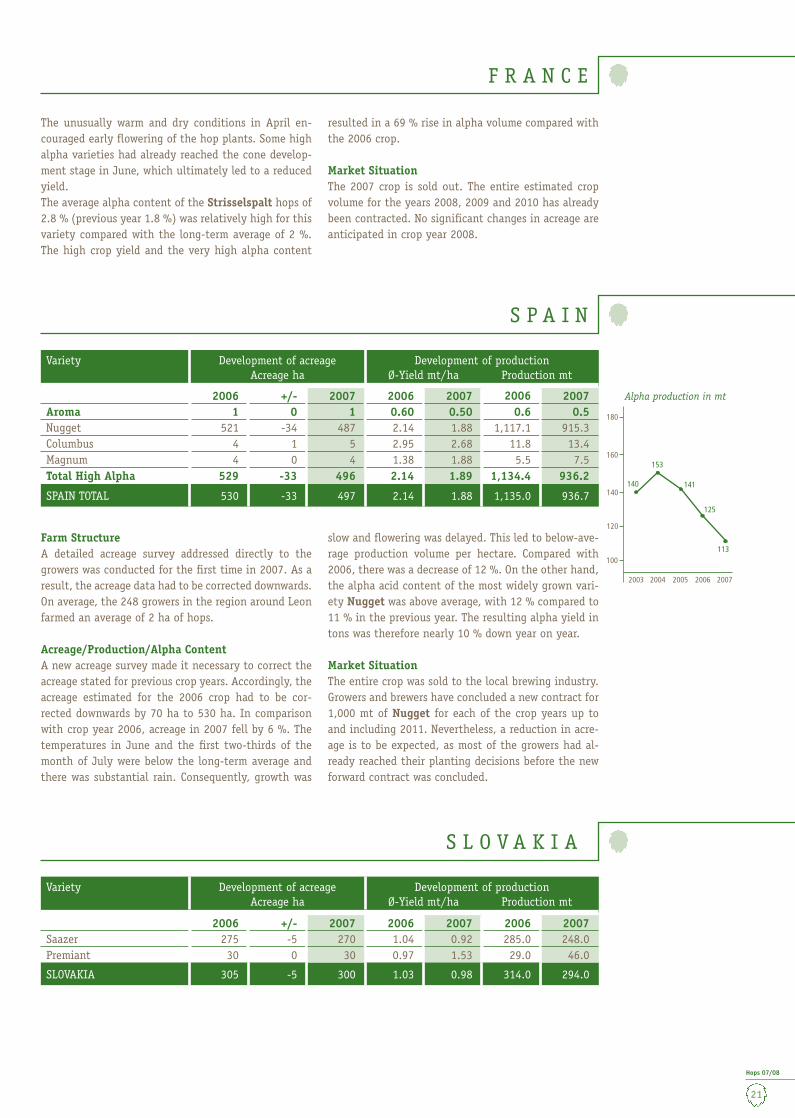
Variety Development of acreage Acreage ha
Development of production Ø-Yield mt/ha Production mt
2006 +/- 2007 2006 2007 2006 2007Aroma 1 0 1 0.60 0.50 0.6 0.5Nugget 521 -34 487 2.14 1.88 1,117.1 915.3Columbus 4 1 5 2.95 2.68 11.8 13.4Magnum 4 0 4 1.38 1.88 5.5 7.5Total High Alpha 529 -33 496 2.14 1.89 1,134.4 936.2
SPAIN TOTAL 530 -33 497 2.14 1.88 1,135.0 936.7
Farm StructureA detailed acreage survey addressed directly to the growers was conducted for the fi rst time in 2007. As a result, the acreage data had to be corrected downwards. On average, the 248 growers in the region around Leon farmed an average of 2 ha of hops.
Acreage/Production/Alpha ContentA new acreage survey made it necessary to correct the acreage stated for previous crop years. Accordingly, the acreage estimated for the 2006 crop had to be cor-rected downwards by 70 ha to 530 ha. In comparison with crop year 2006, acreage in 2007 fell by 6 %. The temperatures in June and the fi rst two-thirds of the month of July were below the long-term average and there was substantial rain. Consequently, growth was
slow and fl owering was delayed. This led to below-ave-rage production volume per hectare. Compared with 2006, there was a decrease of 12 %. On the other hand, the alpha acid content of the most widely grown vari-ety Nugget was above average, with 12 % compared to 11 % in the previous year. The resulting alpha yield in tons was therefore nearly 10 % down year on year.
Market SituationThe entire crop was sold to the local brewing industry. Growers and brewers have concluded a new contract for 1,000 mt of Nugget for each of the crop years up to and including 2011. Nevertheless, a reduction in acre-age is to be expected, as most of the growers had al-ready reached their planting decisions before the new forward contract was concluded.
The unusually warm and dry conditions in April en-couraged early fl owering of the hop plants. Some high alpha varieties had already reached the cone develop-ment stage in June, which ultimately led to a reduced yield.The average alpha content of the Strisselspalt hops of 2.8 % (previous year 1.8 %) was relatively high for this variety compared with the long-term average of 2 %. The high crop yield and the very high alpha content
resulted in a 69 % rise in alpha volume compared with the 2006 crop.
Market SituationThe 2007 crop is sold out. The entire estimated crop volume for the years 2008, 2009 and 2010 has already been contracted. No signifi cant changes in acreage are anticipated in crop year 2008.
F R A N C E
200520042003
160
120
140
180
153
141
125
113
20072006
140
100
Alpha production in mt
Variety Development of acreage Acreage ha
Development of production Ø-Yield mt/ha Production mt
2006 +/- 2007 2006 2007 2006 2007Saazer 275 -5 270 1.04 0.92 285.0 248.0Premiant 30 0 30 0.97 1.53 29.0 46.0
SLOVAKIA 305 -5 300 1.03 0.98 314.0 294.0

Hops 07/08
22
U K R A I N E
Variety Group Development of acreage Acreage ha
Development of production Ø-Yield mt/ha Production mt
2006 +/- 2007 2006 2007 2006 2007Aroma 895 -175 720 1.01 0.58 904.0 420.0Bitter 569 -144 425 1.00 0.66 569.0 280.0
UKRAINE TOTAL 1,464 -319 1,145 1.01 0.61 1,473.0 700.0
Farm StructureApproximately 70 farms are involved in hop gowing, with acreage averaging 16 ha per farm. The centre of hop growing is the area around the town of Zitomir.
Acreage/Production/Alpha ContentDue to lack of information, the data for 2005 had to be taken for 2006. The weather conditions in 2007 were ideal for the development of the hops. The results in
terms of average alpha acid content, amounting to 4 % for aroma varieties and 7.5 % for alpha varieties, were good. However, by international standards the yields in the Ukraine can only be described as very poor.
Market SituationThe hops harvested in 2007 are completely sold out. Acreage is expected to rise by approx. 200 ha in the coming crop year.
Variety Group Development of acreage Acreage ha
Development of production Ø-Yield mt/ha Production mt
2006 +/- 2007 2006 2007 2006 2007Aroma 195 -35 160 0.80 0.70 156.0 112.0Bitter 225 -157 68 0.82 0.68 184.0 46.0
RUSSIA TOTAL 420 -192 228 0.81 0.69 340.0 158.0
Farm StructureAs a result of privatisation measures, the production cooperatives that had only recently been created were turned into 38 independent hop producers. In the pro-cess, the average acreage under hops fell from 17.5 hato 6 ha per farm. Hops are grown mainly in the Re-public of Chuvashia, which is the northernmost hop-producing region in the world.
Acreage/Production/Alpha ContentHop acreage decreased by 46 % from 2006 to 2007. This reduction mainly affected bitter varieties. The to-tal yield was slightly above the long-term average. The alpha content recorded for the aroma varieties was an unusually good 4.2 % (previous year: 3.2 %). The bit-ter varieties, with 5.3 % (previous year: 5.4 %), were slightly below the usual range. As a result of the reduc-tion in acreage and the lower average yield, alpha acid production in 2007 was 53 % down year on year.
Farm StructureOne farm has stopped producing hops. The remaining 12 hop farms, whose hop yards are mainly in the Váh Valley, have an average hop acreage of 25 ha per farm.
Acreage/Production/Alpha ContentWith acreage virtually unchanged and an average yield of 0.98 mt/ha, the production volume was below the long-term average. A heat wave and the absence of rain in the second half of July had an adverse effect on the Saaz aroma hops. The cones remained very small.
Although the alpha content of the Saaz variety impro-ved year on year, it was only 3.1 % and therefore still below the long-term average. The volume of alpha acid produced rose by 24 % compared with crop year 2006.
Market SituationForward contracts accounted for the entire 2007 crop. The contract rate for the 2008 and 2009 crops is al-ready 100 %. The acreage planted with Saaz hops is being reduced slightly.
S L O V A K I A
R U S S I A
200520042003
60
20
40
80
5659
38
66
20072006
66
Alpha production in mt
200520042003
10
15
16
15
7
13
20072006
15
5
20
Alpha production in mt
200520042003
20
10
15
25
16
9
11
17
20072006
12
5
Alpha production in mt

Hops 07/08
23
R U S S I A
Market SituationNo stocks of the 2007 crop are available. In April a forward contract rate of 40 % was reported for hops
harvested in 2008. In spite of rising domestic demand for hops, an increase in acreage is not anticipated.
U S A
Area Variety Development of acreage Acreage ha
Development of production Ø-Yield mt/ha Production mt
2006 +/- 2007 2006 2007 2006 2007Washington Willamette 1,843 -37 1,806 1.37 1.48 2,524.2 2,667.5 Cascade 452 76 527 2.19 2.28 989.2 1,200.4
Centennial 86 10 96 1.42 1.23 121.7 118.3Palisade 22 15 37 3.34 2.81 73.4 104.0Golding 21 0 21 1.14 1.69 23.9 35.4Mount Hood 18 0 17 1.23 1.51 22.1 25.7Horizon 14 -8 6 1.39 1.25 19.5 7.5Perle 10 -10 0 1.10 0.00 11.0 0.0Other Aroma 314 45 359 1.73 0.92 544.0 331.2Total Aroma 2,780 89 2,869 1.56 1.57 4,329.0 4,490.0Cluster 142 6 148 2.46 2.28 348.7 337.0Total Bitter 142 6 148 2.46 2.28 348.7 337.0CTZ 2,733 536 3,270 3.18 3.04 8,694.6 9,938.3
Galena 1,541 -315 1,226 2.04 1.99 3,144.5 2,440.9 Nugget 445 -3 442 2.06 2.14 918.6 946.4 Chelan/Tillicum 259 97 356 2.47 2.55 639.6 907.5
Millennium 368 -74 295 2.61 2.63 959.3 776.0Warrior 170 -34 137 2.43 2.14 412.3 292.7Chinook 148 -22 126 2.09 2.04 309.8 256.5Other High Alpha 126 210 337 2.73 2.24 343.9 754.8Total High Alpha 5,792 396 6,188 2.66 2.64 15,422.6 16,313.1Total Washington 8,714 491 9,205 2.31 2.30 20,100.3 21,140.1
Oregon Willamette 931 38 970 1.64 1.77 1,523.1 1,713.9Mount Hood 46 26 72 2.45 1.84 112.8 132.5Golding 47 -1 47 1.97 1.56 92.5 73.2Cascade 25 0 25 2.07 1.80 51.8 45.0
Perle 30 -17 13 1.56 1.38 46.8 18.0Centennial 0 10 10 0.00 1.36 0.0 13.6Other Aroma 242 -63 179 1.14 1.58 276.9 282.3Total Aroma 1,322 -6 1,316 1.59 1.73 2,103.9 2,278.5
Nugget 607 71 678 2.58 2.50 1,567.3 1,695.0 Millennium 104 15 119 3.25 2.60 337.6 309.8 Warrior 5 -5 0 2.34 0.00 11.7 0.0
Other High Alpha 0 20 20 0.00 2.27 0.0 45.4Total High Alpha 716 101 817 2.68 2.51 1,916.6 2,050.2Total Oregon 2,038 95 2,133 1.97 2.03 4,020.5 4,328.7
Idaho* Total Aroma* 686 -30 656 1.35 1.05 924.4 686.4Total Bitter* 4 3 7 2.00 1.92 8.0 14.0Total High Alpha* 442 67 508 2.52 2.29 1,113.5 1,161.5Total Idaho 1,132 40 1,172 1.81 1.59 2,045.9 1,861.9
Total Aroma* 4,788 53 4,841 1.54 1.54 7,357.2 7,454.9Total Bitter* 146 9 155 2.44 2.26 356.7 351.0Total High Alpha* 6,950 564 7,513 2.66 2.60 18,452.7 19,524.8USA TOTAL 11,884 626 12,510 2.20 2.19 26,166.7 27,330.7
200520042003
3,000
2,500
2,750 2,691
2,543
2,992
2,891
20072006
2,630
2,250
Alpha production in mt
Minor statistical deviations
may result from conversion
of acres into hectares and
pounds into metric tons.
* As growers in Idaho have
only indicated total acreage
and production fi gures
since 2002, the fi gures for the
individual variety groups are
estimates.

Hops 07/08
24
U S A
Variety 2003ha
2004ha
2005ha
2006ha
2007ha
Willamette 2,409 2,362 2,645 2,823 2,816Cascade 994 619 505 484 561Centennial – – 45 86 106Mount Hood 101 103 109 64 89Other Aroma 1,327 1,226 1,288 1,331 1,269Total Aroma 4,831 4,310 4,592 4,788 4,841Cluster 255 244 250 146 155Total Bitter 255 244 250 146 155Columbus-Tomahawk-Zeus (CTZ) 2,317 2,679 2,911 2,911 3,533Galena 1,410 1,638 1,849 1,733 1,429Nugget 1,012 869 1,004 1,067 1,120Millennium 728 562 571 473 414Chelan/Tillicum 151 159 140 259 356Chinook 236 252 251 174 139Warrior 507 326 241 175 137Other High Alpha 121 98 115 158 385Total High Alpha 6,482 6,583 7,082 6,950 7,513
USA TOTAL 11,568 11,137 11,924 11,884 12,510*
Variety developmentThe acreage of the main varieties in the US growing regions developed as follows:
As growers in Idaho have only
indicated total acreage since
2002, the fi gures for the in-
dividual variety are estimates.
* rounding difference
Crop DevelopmentWashington: An abundant winter snow pack assured generous water supplies throughout the growing season. Due to favourable conditions for plant growth and development, by the end of August, growers were expecting an above-average crop. However, a small amount of rain at the beginning of harvest caused powdery mildew to fl are up and attack the hop cones in susceptible varieties. Within a week, hop yards lost their fresh green color as hop cones started to turn brown. Soon growers were unable to keep pace with the harvesting of quickly ripening and browning yards. Some even decided to skip harvesting brown yards in order to save those that were still green. Unfortuna-tely, no matter which strategy was employed, none
really helped to reduce the loss in yield and especial-ly in alpha in varieties susceptible to powdery mildew (particularly CTZ). As a result, the colour of many CTZ lots was below normal, the average alpha content was off by as much as 3 – 4 percentage points and the al-pha in bales degraded more quickly than usual during storage.
Oregon: Oregon experienced a normal winter with an adequate snow pack and precipitation for the crop 2007 season irrigation needs. Most varieties responded well to the moderate growing conditions throughout the summer. Pests and mildew were not a major issue during the growing season.
Farm StructureFor crop 2007, the number of US growers or decision-making entities has been calculated at 62. The average farm size was therefore 200 ha.
Acreage/Production/Alpha ContentThe overall US acreage expanded by 5 % or 626 ha in 2007 compared to 2006. Most of the expansion came from high alpha varieties. The variety group of Colum-bus/Tomahawk/Zeus (CTZ) increased by 622 ha and was followed by Summit which added 229 ha. Chelan and Super Galena, as well as Nugget, also expanded.
The variety that lost most ground was Galena which dropped by more than 300 ha. In contrast to the al-pha varieties, aroma varieties remained relatively un-changed, with the exception of Cascade which expan-ded by 77 ha.
The increase in acreage of alpha varieties did not translate into higher alpha production. Compared to crop 2006, the US actually produced approx. 100 tons of alpha less. This result was particularly due to poor performance of the CTZ variety group.

Hops 07/08
25
U S A
Contract MarketWith strong demand for alpha and a relatively low for-ward contracting rate as of crop 2007, growers had for the fi rst time in many years the opportunity to sell the greater part of their production at prices above the cost of production.
Aroma varieties: By the summer of 2007, contract pri-ces for aroma hops had risen to over 8.80 USD/kg. At these levels, prices were high enough to prevent fur-ther acreage removal, but too low to encourage growers to plant additional acreage.
High alpha varieties: The fact that all of the existing CTZ hops from crops 2007 through 2009 had been sold by late spring meant that any additional future vo-lumes had to come from crop 2008. The new acreage required the purchase or lease of new land, new trellis and drip irrigation equipment – a costly undertaking. In order to hedge their risks, growers were only willing to make this investment, if they received long-term contracts of no less than fi ve years with revenues that would repay the entire investment over this period of time. Depending on the needs of individual opera-tions, contracts varied, but generally prices started at 66.00 USD per kilo of alpha for raw hops in crop 2008 then declined to around 44.00 USD for 2009 and 2010 before fi nally dropping into the 20’s for crops 2011 and 2012. Growers also saw an opportunity to sell their open hops from 2010 to 2012 along with the new acreage contracts from 2008 to 2012. As a result, the US high alpha acreage became highly contracted from 2007 to 2009 and well contracted until 2012.While most of the contracting activity centred on the CTZ varieties, growers also sold all other alpha vari-eties. Pricing of these varieties was linked to the re-
venue per acre generation of CTZ. On this basis, all expected quantities of Galena and Nugget for crops 2007 through 2009 were completely sold out by sum-mer 2007.
Spot MarketReports during August of growers having sold some quantities of varietal alpha hops at approx. 22.00 USD/kg as part of a three-year contract, raised growers’ price expectations. The fi rst variety to gene-rate any spot hops was Willamette which initially sold at 16.00 USD/kg. Cascade soon followed and cemented the pricing of aroma hops at around 16.50 USD/kg. As it became clear in early September that alpha hops would not produce the expected yields and as the fi rst growers started to fall short of their contracted deli-veries, price expectations for raw hops increased from 132.00 – 154.00 USD/kg alpha pre-harvest to more than 200.00 USD/kg alpha. While some growers did in-itially sell at approx. 165,00 USD/kg alpha, most sales occurred at between 198.00 and 220.00 USD/kg alpha level during harvest. However, as the harvest stretched into October, and as alpha contents declined even fur-ther, estimates put the US alpha shortfall between 300 and 500 tons of alpha. As a consequence, the last remaining alpha hops sold in late autumn at prices ranging from 330.00 USD to as much as 992.00 USD/kg alpha and the last aroma hops sold for 44.00 USD to more than 66.00 USD/kg of raw hops.
Further Market DevelopmentsBy January 2008, US growers had already sold an es-timated 1,500 ha of new production, an amount that was thought to be the maximum new acreage that the industry could handle. The pricing refl ected the ne-cessary investment needs, which pushed prices above
Variety 2003 2004 2005 2006 2007 Average
Willamette 4.0% 4.2% 4.2% 4.6% 4.5% 4.3%Mount Hood 4.5% 4.3% 4.4% 4.6% 4.4% 4.4%Cascade 5.0% 5.5% 5.8% 6.1% 5.7% 5.6%Cluster 6.3% 6.4% 6.0% 7.0% 6.5% 6.4%Galena 11.9% 11.9% 12.1% 12.1% 11.6% 11.9%Nugget 12.7% 12.7% 12.3% 13.2% 12.3% 12.6%Chinook 12.8% 12.9% 11.5% 12.2% 11.6% 12.2%Super-High Alpha 14.5% 14.3% 14.4% 15.2% 13.2% 14.3%
Alpha Acid Table

Hops 07/08
26
Area Variety Development of acreage Acreage ha
Development of production Ø-Yield mt/ha Production mt
2006 +/- 2007 2006 2007 2006 2007Xinjiang Tsingdao Flower 945 -13 932 2.98 3.01 2,814.0 2,801.0 SA-1 430 103 533 1.79 1.88 770.0 1,000.0
Marco Polo 292 61 353 3.41 3.40 995.0 1,200.0Kirin Flower 135 69 204 3.19 3.18 430.0 648.0Other Aroma 78 1 79 2.24 2.25 175.0 178.0Total Xinjiang 1,880 221 2,101 2.76 2.77 5,184.0 5,827.0
Gansu Tsingdao Flower 1,343 117 1,460 3.07 3.32 4,120.0 4,853.0Nugget 208 136 344 1.52 0.78 316.0 269.0Kirin Flower 73 -60 13 1.85 3.85 135.0 50.0Other High Alpha 0 106 106 0.00 2.32 0.0 246.0Other Aroma 40 42 82 3.18 1.83 127.0 150.0Total Gansu 1,664 341 2,005 2.82 2.78 4,698.0 5,568.0
Total Aroma 548 146 694 1.96 1.91 1,072.0 1,328.0Total Bitter 2,496 113 2,609 3.00 3.20 7,499.0 8,352.0Total High Alpha 500 303 803 2.62 2.14 1,311.0 1,715.0CHINA TOTAL 3,544 562 4,106 2.79 2.78 9,882.0 11,395.0
U S A
Farm StructureThe 46 farms already involved in hop growing in crop year 2006 were joined by 16 new producers. Taking into account the increase in hop acreage, the average area devoted to hop growing was 66 ha per farm, com-pared with 77 ha in the previous year.
Acreage/Production/Alpha ContentThe increase in hop acreage applied to all varietal groups. The high alpha varieties accounted for the greatest share of the increase, with growth of 61 %.
Year on year, total acreage grew by 16 % in crop year 2007. In May and June, a storm caused lasting damage to plants in the hop growing region of Xinjiang. In Gansu the plants grew very slowly as a result of low temperatures in April and June. The plants entered a second fl owering phase. The alpha acid contents were correspondingly low and very disappointing. The main variety, Tsingdao Flower, only produced an average of 4.5 %. Despite the signifi cantly larger acreage, the alpha yield was some 9 % below that of the previous year.
88.00 USD per kilo of alpha for raw hops. As it became clear that even more alpha and therefore more acreage was needed, prices continued to rise until the returns would pay for the necessary infrastructure upgrades and the profi tability of hops exceeded other compe-ting crops in the respective area, making these acres available for hop production. In view of the fact that American farmers are able to obtain a 60 – 80 % yield on crops in their fi rst year, they were able to take ad-vantage of the attractive selling prices and conclude long-term contracts from crop 2008 onwards. Prices of fi ve-year contracts were concluded at 220.00 USD per
kilo alpha in the fi rst year, 132.00 USD per kilo alpha in the second year and variable prices thereafter.
While the fortunes of US hop growers have changed dramatically, much of the increase in prices and in re-venues will be spent on paying off debt that has accu-mulated over the last 10 years, upgrading harvesting operations and expanding acreage on a large scale for the 2008 crop. It is estimated that acreage expansion alone will have cost US growers about 80 million USD. In comparison, the total farm-gate value of crop 2007 was 169 million USD.
C H I N A
200520042003
1,500
500
1,000
644
657678
617
20072006
1,060
0
Alpha production in mt

Hops 07/08
27
C H I N A
Market SituationA large proportion of the 2007 crop was sold on a for-ward-contract basis. At the time of going to press in May 2008, only a small quantity of approx. 220 mt with low alpha acid content remained unsold due to overpricing. Approx. 75 % of the estimated production volume for 2008 has already been contracted. These contracts are defi ned in terms of volume, but are most-ly signed without an agreed price and are considered only as declarations of intent. After the contract is signed, the contracting parties conduct on-going ne-gotiations until they reach agreement on a fair market price at which the contract can be fulfi lled. The high demand for hops is driving further growth in acreage. An increase of up to 1,500 ha for crop year 2008 seems to be possible. However, the resulting yield will pro-bably be low, as newly planted hops in China produce at best 30 % of their full yield in the fi rst year. In addition to the bitter variety Tsingdao Flower, mainly
alpha and high-yielding varieties are being planted. An increase in hop acreage would enable the Chinese brewing industry to raise its bittering rates further. As a result of a scarcity of hops these rates have now fal-len to only 2 gr/hl and have thus entered a range that is technically questionable. For years now, China’s hop growers have been producing considerably less than the expansive domestic brewing industry requires. The resulting gaps cannot be closed by imports because of price and availability problems. Even with the above-mentioned increase in acreage, China will still not be able to meet its national requirements.
Hop StatisticsThere are no reliable statistics on acreage and pro-duction volume in China. The fi gures presented here, which due to the size of the Chinese hop growing re-gions are often based on estimates, have been gathe-red using our own sources.
C R O P 2 0 0 8 : S O U T H A F R I C A
Variety Development of acreage Acreage ha
Development of production Ø-Yield mt/ha Production mt
2007 +/- 2008 2007 2008 2007 2008Southern Star 284 10 294 2.03 1.40 577.6 412.0Southern Promise 108 3 111 2.35 1.54 253.8 171.0Outeniqua 34 -12 22 1.69 1.41 57.4 31.0Others 8 9 17 1.43 0.82 11.4 14.0
SOUTH AFRICA TOTAL 434 10 444 2.07 1.41 900.2 628.0
Farm StructureThe composition of the 15 hop-producing farms re-mained the same, with 11 private producers, three commercial farms and one research institute. The hop growing regions are located in the very south of the country.
Acreage/Production/Alpha ContentThe 2008 crop, harvested in February and March, proved to be the worst in South Africa’s 20-year hop growing history. The average yield per hectare was 32 % be-low the record level seen in crop year 2007. Damp soil conditions and lack of sunshine were presumably the main reason for the poor crop. This was exacerbated
by infestation by American bollworm which caused widespread damage to the hop cones immediately pri-or to harvest. The alpha content, on the other hand, was well above average. The results for crop year 2007 are in brackets: Southern Promise 12.2 % (10.4 %), Outeniqua 14.2 % (12.6 %), Southern Star 14.6 % (13.2 %). Nevertheless, the alpha acid yield fell year on year by 26 %.
Market SituationDue to the low yield producers were unable to supply enough hops to satisfy the demand for local beer pro-duction. The shortfall has to be met by purchases on the world market.
200620052004
100
80
70
90
110
121
92
117
87
20082007
126
120
130
Alpha production in mt

Hops 07/08
28
C R O P 2 0 0 8 : A U S T R A L I A
Area Variety Development of acreage Acreage ha
Development of production Ø-Yield mt/ha Production mt
2007 +/- 2008 2007 2008 2007 2008Tasmanien Super Pride 96 8 104 1.93 2.29 186.0 237.7 Pride of Ringwood 85 4 89 1.86 2.71 158.0 239.8
Millennium 39 8 47 2.73 2.10 106.0 99.5Victoria 12 0 12 2.93 3.18 36.0 39.4Cluster 9 0 9 1.67 2.51 15.0 22.3Others 17 14 31 2.02 1.51 34.0 46.4Total Tasmania 258 34 292 2.07 2.35 535.0 685.1
Victoria Topaz 68 8 76 2.57 3.58 174.0 271.0Super Pride 57 14 71 1.94 1.83 110.0 129.9Pride of Ringwood 29 -9 20 0.85 2.00 25.0 40.0Victoria 13 0 13 1.46 2.54 19.0 33.5Cluster 10 0 10 1.50 2.00 15.0 20.0Others 6 -4 2 2.04 4.05 12.0 9.7
Total Victoria 183 9 192 1.94 2.62 355.0 504.1
Total Bitter 133 -5 128 1.60 2.52 213.0 322.1Total High Alpha 285 38 323 2.21 2.51 631.0 811.0Total Others 23 10 33 2.00 1.70 46.0 56.1
AUSTRALIA TOTAL 441 43 484 2.02 2.46 890.0 1,189.2
Farm StructureAs in the previous year, hops were produced in Aus-tralia on 8 farms. As a result of an increase in acreage the average area per farm devoted to hop growing rose from 55 ha to 60 ha.
Acreage/Production/Alpha ContentThe growth in acreage, totalling 10 % nationwide, was due to increased planting of high alpha varieties, mainly in the hop region of Tasmania.Hop growth was generally good. Some areas suffered from water shortages, which led to lower yields. All in all, an above-average crop was expected. However, these prospects were dampened when Tasmania was visited at the start of the high alpha hop harvest by a strong, hot wind with a speed of 102 kph and a tem-perature of 37° which raged for nearly 12 hours on 14.3.2008. It literally dried out the plants at the edges of the hop yards in particular, making the lupulin fall out of the cones and thus causing damage.Although the yields of the high alpha variety Super
Pride failed to meet expectations in either of the Aus-tralian hop growing regions, this was compensated for by the very good results for the Topaz variety. Most of the hop growers in Victoria brought in very good har-vests. In Tasmania on the other hand, the picture was varied, with some growers reporting excellent yields, while others suffered losses.Average alpha contents in crop year 2008, compared with the results of the previous year: Pride of Ring-wood 8.0 % (9.4 %), Super Pride 12.8 % (13.3 %), Millennium 12.8 % (14.3 %), Topaz 15.7 % (12.8 %).Thanks to the enlarged acreage and the improved yield per hectare, the alpha yield increased by 31 % year on year.
Market SituationBy the time of harvest the 2008 hop crop had been completely sold by contract. New and interesting aro-ma varieties are coming onto the market as a result of the hop breeding programme of Hop Products Australia. Therefore a further increase in acreage is expected.
200620052004
140
100
120
160
146
108
142
118
20082007
163
80
180
Alpha production in mt

Hops 07/08
29
C R O P 2 0 0 8 : N E W Z E A L A N D
Variety Group Development of acreage Acreage ha
Development of production Ø-Yield mt/ha Production mt
2007 +/- 2008 2007 2008 2007 2008Aroma 224 2 226 1.99 1.71 446.7 387.0High Alpha 130 4 134 1.95 2.47 253.4 331.0
NEW ZEALAND TOTAL 354 6 360 1.98 1.99 700.1 718.0
Farm StructureAs in the previous year, hops are grown by 17 farmers in the Nelson region on New Zealand’s South Island. The average acreage strung with hops also remained unchanged at 21 ha.
Acreage/Production/Alpha ContentAcreage increased by 6 ha. The development of the aro-ma varieties was affected by frost in the late spring, which led to a drop in yield. The volume of alpha vari-eties produced, on the other hand, was slightly above average. The alpha acid contents presented a similar picture. While the results for the aroma varieties were slightly below the long-term average, the results recor-
ded for the alpha varieties were far above the average. The alpha content of the main varieties compares with the previous year as follows: NZ Hallertau Aroma 7.0 % (8.0 %), NZ Pacifi c Gem 16.0 % (15.0 %). Year on year, the alpha yield from the 2008 crop rose by 7 %.
Market SituationOnly small quantities were available on the spot mar-ket because the crop had already been sold through forward contracts. There is also a high forward con-tract rate for subsequent years. The New Zealand hop industry is maintaining its focus on breeding unique aroma varieties.
GermanyThe winter of 2007/2008 brought plentiful rainfall. There was an unusually large amount of rain in March in particular. Conditions were also comparatively mild until mid-March, without any days of frost. This led to a slight delay in spring work, as ground conditions were not always suitable for vehicles. Nevertheless, most of the hop plants were cut in good time.From the second half of March onwards conditions became unusually cool, with heavy precipitation con-tinuing. By comparison with the long-term average, vegetation at this point was slightly delayed. Tempera-tures rose again in early May, just in time for training, and exceeded the long-term mean. The weeks that fol-lowed were sunny and dry. On the whole, apart from a few exceptions, the month of May was above-average in temperature and somewhat too dry. However, by the beginning of June all varieties had developed in line with the long-term average and the plants had grown to approx. 60 % of trellis height.
USAWinter precipitation in all three hop growing regions was higher than average, assuring ample water sup-plies for the growing season. Temperatures, especially in Washington State, were considerably below normal during spring. As a result, growth of the aroma vari-eties and many newly planted hop yards (young hops in their fi rst year) were adversely affected. While the growing season is still considered long enough for the plants to make up for this delay, regardless of the in-crease in acreage, it will only be possible to achieve a new record this year if there are as few deviations from normal weather conditions as possible.
Experience shows that the weather patterns in July and August have a decisive infl uence on the outcome of the harvest, in terms of both quality and quantity.
P L A N T D E V E L O P M E N T 2 0 0 8
200620052004
70
50
60
8075 75
70
61
20082007
70
40
Alpha production in mt

Hops 07/08
30
O U T L O O K 2 0 0 8
GermanyAccording to the fi gures published by the hop growers’ association of Germany, the total acreage allocated to hops in crop year 2008 is 18,695 ha. This shows that acreage has increased by 1,024 ha over 2007, which corresponds to a rise of just below 6 %. Differences in acreage development can be seen between the various hop growing regions: Hallertau +923 ha, Elbe-Saale +63 ha, Tettnang +40 ha, Spalt -2 ha, other +/-0 ha. There have been no fundamental changes among the varieties. The predominant share of new acreage is ac-counted for by the new high alpha variety Herkules.
USAAccording to the results of the offi cial hop acreage sur-vey published by the US Ministry of Agriculture (USDA) on 1.6.2008, total hop acreage amounts to 15,437 ha. In comparison to 2007 this represents an increase of 2,927 ha. The CTZ group of varieties shows the highest increase with more than 1,200 ha, followed by Sum-
mit with 717 ha and some other alpha varieties whose acreage is reported to have risen by approx. 485 ha. The acreage planted with certain aroma varieties has also increased. Cascade in particular has seen its acre-age rise by about 350 ha, followed by Willamette with an increase of nearly 120 ha. One variety that has lost ground is Galena, with approx. 160 ha. The acreage expansion reported failed to meet expec-tations after inoffi cial estimates within the hop indus-try had suggested a fi gure of up to 3,600 ha. What is unclear is whether new acreage was planted after the acreage survey had been completed.
WorldThe changes in acreage reported may lead to an in-crease in acreage worldwide of up to nearly 6,000 ha. In the market-leading producer countries Germany, the USA and China, hop growers are responding to rising demand by increasing acreage. Virtually all of the new acreage is covered by long-term contracts.
B A R T H - H A A S G R O U P A W A R D S
R E S E A R C H G R A N T S
Once again the Barth-Haas Group has awarded grants for research activities focusing on the use of hops and hop products in all areas of the brewing industry. Due to the number of applications submitted this year the
jury decided to support fi ve instead of the four pro-jects envisaged. The following projects were selected and receive a grant of 2,000 EUR each:
Stipendiary Professor University Country Title
Sivalakshmi Dharmaraj Prof. Paul Hughes Heriot-Watt University,Edinburgh
England Development of a laboratory test for astringency: The role of hops
Dr. Frithjof Thiele Prof. Elke Ahrendt University College Cork Ireland Scanning Electron Microscope (SEM) examination on lupulin glands of different hop varieties
Luk Daenen Prof. Freddy DelvauxProf. Guy Derdelinckx
Katholieke Universiteit Leuven
Belgium Characterization of newly identifi ed aroma compounds in hops: DIHYDROE-DULANES and THEASPIRANES
Stefan Hanke Dr. Markus Hermann TU Munich Germany Research into additive and synergistic effects of hop aroma compounds
Michael di Pietro Prof. Charles Bamforth UC Davis USA The antioxidant effi cacy of hop poly-phenols

Hops 07/08
31
M E M B E R S O F Joh. Barth & Sohn GmbH & Co. KG Phone: +49 911 5489-0Freiligrathstraße 7/9 Fax: +49 911 5489-33090482 Nuremberg E-Mail: [email protected] www.barthhaasgroup.com
John I. Haas, Inc. Phone: +1 202 777-48005158 MacArthur Blvd, NW, Suite 300 Fax: +1 202 777-4895Washington, DC 20016 E-Mail: [email protected] www.barthhaasgroup.com
Botanix Ltd. Phone: +44 1892 833415Hop Pocket Lane Fax: +44 1892 836987Paddock Wood E-Mail: [email protected], TN12 6DQ www.botanix.co.ukUnited Kingdom
Hop Products Australia Phone: +61 3 6282 200026 Cambridge Road Fax: +61 3 6245 0970Bellerive E-Mail: [email protected] 7018 www.hopproducts.com.auAustralia
Barth Haas (Beijing) Trade Co., Ltd. Phone: +86 10 6590 7096Unit 26-28, Level 6 Fax: +86 10 6590 7095China World Tower 1 No. 1 E-Mail: [email protected] Avenue www.barthhaasgroup.com 100004 Beijing People’s Republic of China
Conversion Table
Area: Weight:1 hectare (ha) = 10,000 m2 = 2.934 Bavarian „Tagwerk“ 1 metr. ton (mt) = 1,000 kg = 20 cwt (D) = 2,204.6 lbs1 hectare (ha) = 10,000 m2 = 2.471 acres 1 Zentner cwt (D) = 50 kg = 110.23 lbs = 1.102 cwt (USA)1 Bavarian „Tagwerk“ = 0.341 ha = 110.23 lbs = 0.984 cwt (GB)1 acre = 0.4047 ha 1 hundredweight (cwt/USA) = 100 lbs = 45.36 kg
= 0.9072 Ztr. Length: 1 hundredweight (cwt/GB) = 112 lbs = 50.800 kg1 yard = 3 feet = 36 inches = 91.44 cm = 1.0160 Ztr.1 mile = 1.609 km 1 centner (GB) = 100 lbs = 45.36 kg
= 0.9072 Ztr.Volume: 1 kg = 2.20462 lbs1 hl = 100 l = 26.42 gall = 0.8523 bbl (USA) 1 lb = 0.45359 kg1 hl = 100 l = 22.01 gall = 0.6114 bbl (Brit.)1 barrel (bbl/USA) = 31 gall = 1,1734 hl Pressure:1 barrel (bbl/GB) = 36 gall = 1,6365 hl 1 bar = 14.5038 psi 1 psi = 0.06895 bar
86°F = = 30°C 30°C = +32 = 86°F (86 − 32) x 59
30 x 95
Currency Exchange Rates
1 EUR equals (reference by ECB):on 1 June 2007 on 2 June 2008 on 1 June 2007 on 2 June 2008
USA 1.3436 USD 1.5521 USD Canada 1.4335 CAD 1.5460 CADAustralia 1.6214 AUD 1.6243 AUD Poland 3.8150 PLN 3.3809 PLNChina 10.2749 CNY 10.7607 CNY Switzerland 1.6514 CHF 1.6182 CHFUnited Kingdom 0.6793 GBP 0.7915 GBP Czech Republic 28.2850 CZK 25.0300 CZKJapan 163.8100 JPY 162.6400 JPY
These exchange rates can only
serve as an indication.
They vary from bank to bank
and are not binding.

T H E 4 0 L A R G E S T B R E W I N G G R O U P S
W O R L D W I D E A S A T 3 1 . 1 2 . 2 0 0 7
Rank Brewery Country Production vol. 2007 in mill. hl
Percentage of world beer production
1 SABMiller United Kingdom 239.0 13.4 %2 InBev (1) Belgium 233.1 13.0 %3 Anheuser-Busch (2) USA 189.1 10.6 %4 Heineken Netherlands 139.2 7.8 %5 Baltic Beverages Holding (BBH) (3) Russia 55.3 3.1 %6 Carlsberg (without BBH) Denmark 52.9 3.0 %7 Grupo Modelo Mexico 51.0 2.9 %8 Tsingtao Brewery Group China 50.6 2.8 %9 Molson-Coors USA/Canada 49.2 2.8 %
10 Yanjing China 40.1 2.2 %11 Femsa Mexico 39.4 2.2 %12 Scottish & Newcastle (without BBH) United Kingdom 28.0 1.6 %13 Asahi Japan 23.8 1.3 %14 Kirin Japan 23.7 1.3 %15 Efes Group Turkey 20.9 1.2 %16 Diageo (Guinness) Ireland 19.5 1.1 %17 Polar Venezuela 18.5 1.0 %18 Chongqing Beer China 18.0 1.0 %19 Gold Star China 17.6 1.0 %20 BGI/Groupe Castel France 17.4 1.0 %21 Grupo Schincariol Brazil 17.0 1.0 %22 San Miguel Corporation Philippines 16.9 0.9 %23 Pearl River China 13.7 0.8 %24 Radeberger Gruppe Germany 13.6 0.8 %25 Grupo Mahou - San Miguel Spain 12.6 0.7 %26 Obolon Ukraine 10.9 0.6 %27 Foster’s Group Australia 10.9 0.6 %28 Hite South Korea 10.6 0.6 %29 Beer Thai (Chang) Thailand 10.5 0.6 %30 Singha Corporation Thailand 9.9 0.6 %31 Petropolis Brazil 9.0 0.5 %32 Lion Nathan Australia/New Zealand 8.5 0.5 %33 Bitburger Braugruppe Germany 8.4 0.5 %34 Oettinger Germany 8.3 0.5 %35 Sapporo Japan 7.8 0.4 %36 CCU Chile 7.6 0.4 %37 Damm Spain 7.6 0.4 %38 Shenzhen Kingway China 7.3 0.4 %39 Suntory Japan 6.9 0.4 %40 Shanghai Suntory China 6.4 0.4 %
TOTAL WORLD BEER PRODUCTION 2007
1,530.71,787.0
85.6 %100.0 %
The increase in the share of the world market held by the 40 largest brewing groups was disproportionately greater than the increase in beer output. This resulted from a combination of good beer sales volume and the by no means insignifi cant effects of brewery purchases, stakes in other companies and acquisitions. These very
activities produced a change at the top of the table. While the top three had a share of 36.6 % of world beer production in 2006, only one year later their share amounted to 37 %. This growth constitutes an increase in output of 40 million hectolitres.
1) Including proportional
stake in Pearl River, China
2) Including proportional
volume from stakes in Grupo
Modelo, Mexico, and Tsingtao
Brewery Group, China
3) Carlsberg and Scottish &
Newcastle each with 50 %
stake in BBH. As of 2008,
100 % held by Carlsberg.
The data were taken from the
brewers’ own annual reports.
In other cases, the production
volume had to be estimated
after different sources had re-
ported differing or no fi gures.