Embed Size (px)
Citation preview
1
This paper is published as: Druckman, A. and T. Jackson (2010). "The bare necessities: how much household carbon do we really need?" Ecological Economics 69(9): 1794–1804.
The bare necessities: how much household carbon do we really need?
Angela Druckman and Tim Jackson
Abstract The consumption patterns of Western nations are generally deemed to be unsustainable. Yet there is little attempt to restrain either material throughput or income growth. Nonetheless, in the face of the need to make ‘deep’ cuts in carbon emissions (for instance), consumption restraint may be a perfectly legitimate response. This paper explores the potential for a Reduced Consumption Scenario in the UK constructed by assuming that households achieve a specific ‘minimum income standard’ which is deemed to provide a decent life for each household type. The minimum income standards are taken from a recent study for the Joseph Rowntree Foundation and include not only subsistence commodities such as food, warmth and shelter but also the means to participate effectively in society. The Joseph Rowntree Foundation study produced detailed household expenditure budgets for these income standards. The paper uses an environmentally extended quasi-multi-regional input-output model to estimate the greenhouse gases (GHG) emissions required in the production and distribution of all goods and services purchased according to these budgets. Our results show that average household GHG emissions in the UK would be around 37% lower in the Reduced Consumption Scenario than they are currently. We explore several implications of these findings including: the need to change social norms around consumption, the need for investment to improve the thermal performance of homes and the need to develop new transport infrastructures. We also address the potential to reduce emissions below the level achieved in this Scenario and discuss the implications for policy. Keywords: Carbon footprint; Well-being; Lifestyles; Environmental Input-Output; Scenario.
1 Introduction The underlying premise in this paper is that the consumption patterns that characterise Western societies are unsustainable, both in terms of the resources they require and the emissions they generate. In particular, policy-makers are now struggling to find ways to shift society to lower carbon modes of living. Some believe that technological change will deliver a lower carbon future. Undoubtedly technology will be part of the solution. But it is also clear that this will not be sufficient on its own (HM Government 2005). Behaviours and lifestyles will also need to change (Defra 2008; Jackson 2008; Jackson and Papathanasopoulou 2008; Reay 2006). It is possible that we may even need to restrain consumption levels in richer nations if ‘deep’ cuts in carbon emissions such as those projected by the Intergovernmental Panel on Climate Change (IPCC) are to be achieved (IPCC 2007). A key requirement for the success of any such strategy is to ensure that people are still able to live a ‘decent’ life. That requirement includes people’s capabilities not only to provide food and shelter for themselves and their families but also to participate effectively in the life of society (Bradshaw et al. 2008; Jackson 2009; Sen 1984; Townsend 1979). Accordingly, this paper explores the potential for a Reduced Consumption Scenario in the UK that could deliver this goal. The study builds on some work carried out for the Joseph
2
Rowntree Foundation (JRF) to establish the basket of expenditures deemed necessary to enjoy a decent life (Bradshaw et al. 2008). The goal of the JRF study was to define an acceptable ‘minimum income standard’ needed to achieve this goal. The study defined a minimum acceptable standard of living to include ‘more than just, food, clothes and shelter. It is about having what you need in order to have the opportunities and choices necessary to participate in society.” (Bradshaw et al. 2008: p1). This definition is in line with a growing body of research that emphasises the importance of social relations in peoples’ ability to flourish (Jackson 2009; Sen 1984; Townsend 1979). Once material needs are met, peoples’ ability to flourish is correlated to their “ability to give and receive love, to enjoy the respect of [their] peers, to contribute useful work, and to have a sense of belonging and trust in the community (Jackson 2009). The JRF study builds in particular on Townsend’s (1979) seminal work on poverty in the UK in which he postulated that incomes and expenditures are not a good guide to poverty. His argument was that poverty is structural: it is produced by the organisation of society rather than by individual failings, and that rather than using monetary measures, poverty should be measured in terms of relative deprivation. Moreover, he theorised poverty not simply in terms of having enough to satisfy material needs for survival, but in terms of the ability to participate in social activities and to have living standards comparable to current norms. The JRF budgets were drawn up through consensual discussions among ordinary people, informed at successive stages by feedback from experts (Bradshaw et al. 2008). This process established expenditure budgets for 2008 for a variety of different types of representative households in the UK (such as couple parents with two children, and single pensioner households). In accordance with their definition, the budgets provide for more than simply adequate warmth, food and shelter: they include significant resources to “participate in society and maintain dignity” (ibid). They do, however, seek to exclude items that may be regarded as “‘aspirational’ – it is about fulfilling needs and not wants” (ibid). The budgets indicate which expenditures we should aim to protect, and which may be considered unnecessary and hence be potentially excluded. In this study, we use the expenditure budgets defined by the JRF work as a basis to answer the following question: what level of GHG emissions are required to support an acceptable standard of living in the UK? To answer this question we estimated the GHGs produced both in the UK and abroad during the production and distribution of all the goods and services purchased by UK households according to the minimum income standard defined by the JRF expenditure budgets. The results from this modelling exercise form our ‘Reduced Consumption Scenario’ which therefore gives us an indication of how much of the carbon that is used in our current consumer lifestyle is necessary for a ‘decent’ life, and how much may be thought of as “discretionary” and could potentially be eliminated. Of course, the viability of such a shift rests to a certain extent on how acceptable lifestyles in the Reduced Consumption Scenario are deemed to be. It also depends on our ability to shift the infrastructures and systems of provision needed to provide a decent life. In our discussion we explore these questions further. The organisation of this paper is as follows. In the next section we describe briefly the JRF budgets, set out what is included and excluded in them, and compare them to current expenditure levels. Section 3 describes the methodology used to estimate the GHG emissions that would arise in the production and distribution of all the goods and services purchased in the Reduced Consumption Scenario. Section 4 presents the results of the modelling exercise. In Section 5 we address the question of what lifestyles may be like in the Reduced Consumption Scenario, and explore evidence from social movements for indications of changes towards less materialist lifestyles. In Section 6 we summarise what can be learnt from the Reduced Consumption Scenario study and discuss its implications in the context of UK GHG reduction targets.

3
2 A Reduced Consumption Scenario for the UK The JRF study produced highly detailed weekly expenditure budgets for eleven types of households1. This was done by blending two methodologies that have previously been used to develop budget standards in Britain (Bradshaw et al. 2008). The first is the Family Budget Unit (FBU) approach developed at the University of York. This approach uses documented guidance (such as heating and nutrition standards), expert opinion (for example dieticians) and statistics (concerning, for example, product lifespans and expenditures) to determine items to be included in the budgets (ibid). The second methodology is the Consensual Budget Standards (CBS) method developed by the Centre for Research and Social Policy at Loughborough University. This is similar to the FBU approach but involves ordinary people instead of panels of experts, and it is a derivative of focus group methodology (ibid). As noted above, Bradshaw et al’s 2008 report on the JRF study summarises the resultant methodology used in drawing up the budgets as “holding ‘consensual’ discussions among ordinary people ...informed at successive stages by feedback from experts” (ibid page 3). The expenditures determined by the budgets are summarised in Table 1. Figure 1 compares the levels of expenditure in the Reduced Consumption Scenario against estimated expenditures as reported in the Expenditure and Food Survey (EFS)2, excluding housing and childcare. This shows that amongst single people of working age about two thirds of families spend more according to the EFS than in the Reduced Consumption Scenario. Similarly, among pensioner couples and couples with two children about three quarters spend more. However, among lone parents over half of families spend less. This indicates that some family types are, in monetary terms, better off on average in the Reduced Consumption Scenario than they are in reality today (Bradshaw et al. 2008).
(a) Decile distribution of expenditure: working-aged single
(b) Decile distribution of expenditure: pensioner couple
(c) Decile distribution of expenditure: couple + 2 children
(d) Decile distribution of expenditure: lone parent + 1 child
Fig. 1. Comparison of Reduced Consumption Scenario expenditures against the distribution of expenditure
as reported in the Expenditure and Food Survey. Source: Bradshaw et al (2008).
1 During the JRF study, initial expenditure budgets were produced for a set of fifteen types of individuals, ranging from ‘single female adult no children’ to ‘pre-school child’ (see Bradshaw et al (2008: page 9)). These were aggregated into the final family types used in the JRF study as shown in Table 1, taking account of economies of scale. These eleven family types are used in modelling the Reduced Consumption Scenario. 2 In order to undertake this comparison Bradshaw et al (2008) merged five years of data from the from the Expenditure and Food Survey (EFS) (2001/2 – 2005/6) with each year’s data being uprated to April 2008 using the commodity price index.
4
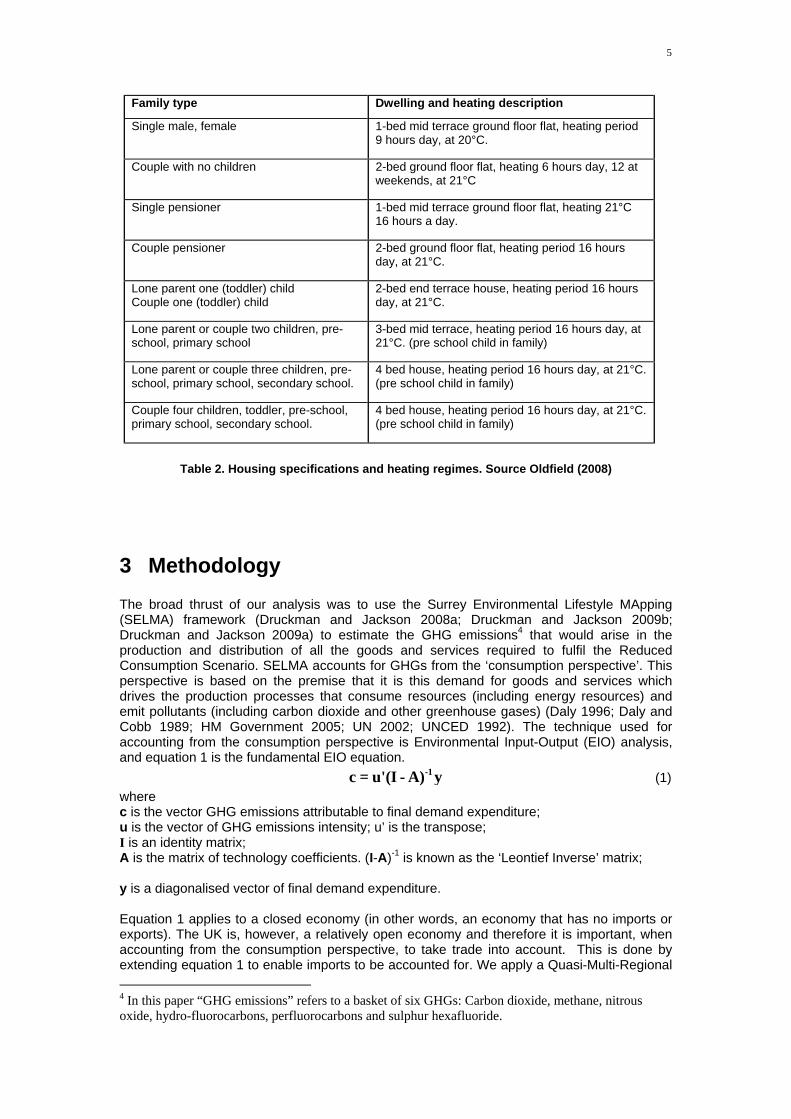
Each budget contains hundreds of costed items and allowances for activities and services purchased by each household type. 90% of items were costed at national chain stores such as Tesco and Argos. For non-food items the lifetime of each object was estimated (taking account of its quality and type of usage) and its cost was spread over its estimated lifetime. The budgets provide generous allowances for childcare (for example, £135.05 per week for a lone parent with one child). The budgets give precise details of all expenditure items. Food menus were checked by a nutritionist to ensure they met current government guidelines for healthy eating. An example of the weekly meat allocation for a lone parent with one child (toddler) is: 150g stewing steak; 400g beef mince; 62g bacon; 128g pork sausages; 175g chicken breasts; and 34g cooked chicken. All budgets contained some alcohol, the majority to be consumed in the home. For example a couple with one child is allocated 4 cans of Fosters’ lager; 4 cans of Thwaites’ Draught; and one bottle of Chilean white wine per week. A car was deemed unnecessary for the minimum standard of living to be met, and each budget includes a weekly bus pass for each household member (except for pensioners and small children who travel free). All budgets also included provision for taxi hire, to cover specific trips such as weekly supermarket visits, late night journeys, or emergency hospital visits. Each budget contained a one-week budget holiday in the UK. The household fuel use estimated in the budgets was calculated at the level necessary to “maintain health and well being of the householders and the fabric of the home” (Oldfield 2008). Table 2 shows the type of dwelling in which each family type is assumed to reside, and its prescribed heating regime. Each household type is assumed to occupy a dwelling that is closely matched to its family size. It should be noted that this is not currently the reality in the UK, where many households, even those on low incomes, and especially pensioners, have an extra bedroom above the number specified in Table 2. The heating regimes are based on World Health Organisation guidelines (Oldfield 2008). Average fuel use and costs were estimated using the Building Research Establishment Domestic Energy Model (BREDEM 12) (Anderson et al. 2002; Oldfield 2008). It was assumed that cavity wall insulation, loft insulation3 and double glazing were installed in each dwelling. Again, it should be pointed out that this differs from the reality today. This assumption, alongside the close fit of family size to number of bedrooms, resulted in the estimated household fuel consumption of each household type being below actual expenditure as shown in the Expenditure and Food Surveys for equivalent households (Oldfield 2008). The minimum standard of living budgets are for ‘average’ households in Britain, and it is acknowledged by the authors that actual budgets would, of course, vary. For example, many rural dwellings are not connected to the gas mains, and in rural locations transport may be less convenient and reliable, and also more expensive. Furthermore, additional travel expenses or clothes for work are not included.
3 The depth of loft insulation installed is not stated.
5
Family type Dwelling and heating description
Single male, female 1-bed mid terrace ground floor flat, heating period 9 hours day, at 20°C.
Couple with no children 2-bed ground floor flat, heating 6 hours day, 12 at weekends, at 21°C
Single pensioner 1-bed mid terrace ground floor flat, heating 21°C 16 hours a day.
Couple pensioner 2-bed ground floor flat, heating period 16 hours day, at 21°C.
Lone parent one (toddler) child Couple one (toddler) child
2-bed end terrace house, heating period 16 hours day, at 21°C.
Lone parent or couple two children, pre-school, primary school
3-bed mid terrace, heating period 16 hours day, at 21°C. (pre school child in family)
Lone parent or couple three children, pre-school, primary school, secondary school.
4 bed house, heating period 16 hours day, at 21°C. (pre school child in family)
Couple four children, toddler, pre-school, primary school, secondary school.
4 bed house, heating period 16 hours day, at 21°C. (pre school child in family)
Table 2. Housing specifications and heating regimes. Source Oldfield (2008)
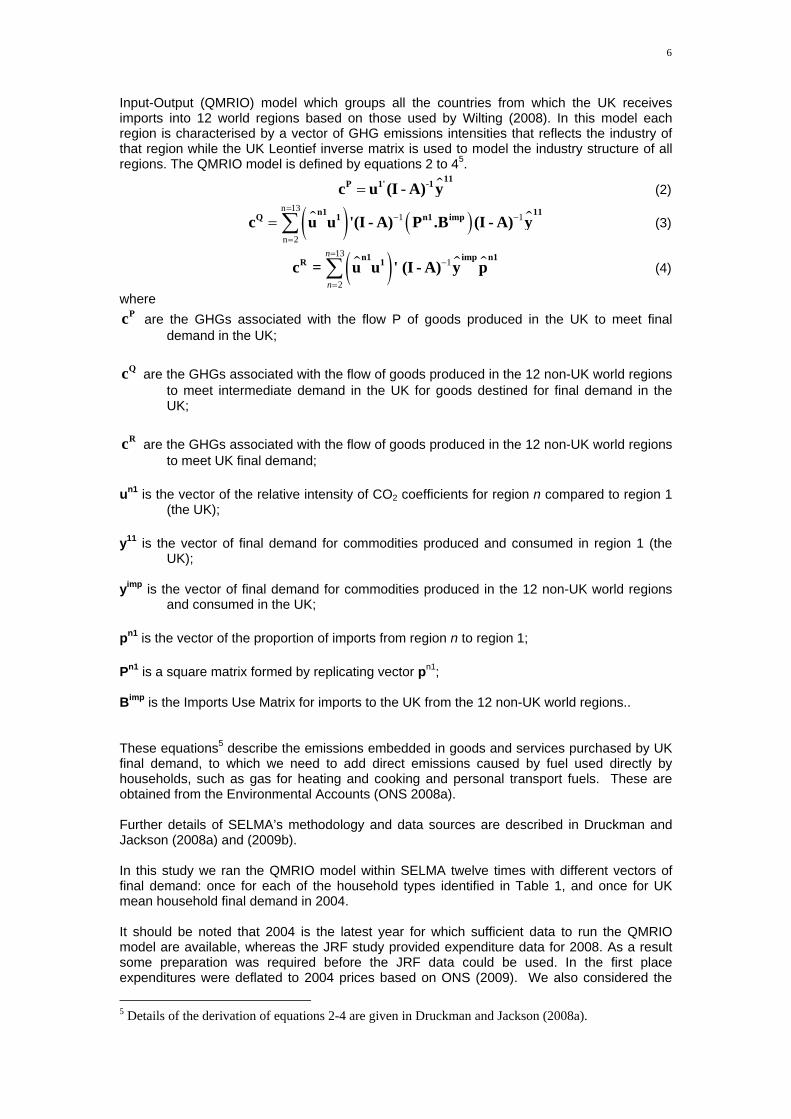
3 Methodology The broad thrust of our analysis was to use the Surrey Environmental Lifestyle MApping (SELMA) framework (Druckman and Jackson 2008a; Druckman and Jackson 2009b; Druckman and Jackson 2009a) to estimate the GHG emissions4 that would arise in the production and distribution of all the goods and services required to fulfil the Reduced Consumption Scenario. SELMA accounts for GHGs from the ‘consumption perspective’. This perspective is based on the premise that it is this demand for goods and services which drives the production processes that consume resources (including energy resources) and emit pollutants (including carbon dioxide and other greenhouse gases) (Daly 1996; Daly and Cobb 1989; HM Government 2005; UN 2002; UNCED 1992). The technique used for accounting from the consumption perspective is Environmental Input-Output (EIO) analysis, and equation 1 is the fundamental EIO equation.
-1c = u'(I - A) y (1)
where c is the vector GHG emissions attributable to final demand expenditure; u is the vector of GHG emissions intensity; u’ is the transpose; I is an identity matrix; A is the matrix of technology coefficients. (I-A)-1 is known as the ‘Leontief Inverse’ matrix; y is a diagonalised vector of final demand expenditure. Equation 1 applies to a closed economy (in other words, an economy that has no imports or exports). The UK is, however, a relatively open economy and therefore it is important, when accounting from the consumption perspective, to take trade into account. This is done by extending equation 1 to enable imports to be accounted for. We apply a Quasi-Multi-Regional
4 In this paper “GHG emissions” refers to a basket of six GHGs: Carbon dioxide, methane, nitrous oxide, hydro-fluorocarbons, perfluorocarbons and sulphur hexafluoride.
6
Input-Output (QMRIO) model which groups all the countries from which the UK receives imports into 12 world regions based on those used by Wilting (2008). In this model each region is characterised by a vector of GHG emissions intensities that reflects the industry of that region while the UK Leontief inverse matrix is used to model the industry structure of all regions. The QMRIO model is defined by equations 2 to 45.
11
P 1' -1c u (I - A) y (2)
n 13
1 1
n 2
n1 11
Q 1 n1 impc u u '(I - A) P .B (I - A) y (3)
13
1
2
n
n
n1 imp n1R 1c = u u ' (I - A) y p (4)
where Pc are the GHGs associated with the flow P of goods produced in the UK to meet final
demand in the UK;
Qc are the GHGs associated with the flow of goods produced in the 12 non-UK world regions to meet intermediate demand in the UK for goods destined for final demand in the UK;
Rc are the GHGs associated with the flow of goods produced in the 12 non-UK world regions
to meet UK final demand; un1 is the vector of the relative intensity of CO2 coefficients for region n compared to region 1
(the UK); y11 is the vector of final demand for commodities produced and consumed in region 1 (the
UK); yimp is the vector of final demand for commodities produced in the 12 non-UK world regions
and consumed in the UK; pn1 is the vector of the proportion of imports from region n to region 1; Pn1 is a square matrix formed by replicating vector pn1; Bimp is the Imports Use Matrix for imports to the UK from the 12 non-UK world regions.. These equations5 describe the emissions embedded in goods and services purchased by UK final demand, to which we need to add direct emissions caused by fuel used directly by households, such as gas for heating and cooking and personal transport fuels. These are obtained from the Environmental Accounts (ONS 2008a). Further details of SELMA’s methodology and data sources are described in Druckman and Jackson (2008a) and (2009b). In this study we ran the QMRIO model within SELMA twelve times with different vectors of final demand: once for each of the household types identified in Table 1, and once for UK mean household final demand in 2004. It should be noted that 2004 is the latest year for which sufficient data to run the QMRIO model are available, whereas the JRF study provided expenditure data for 2008. As a result some preparation was required before the JRF data could be used. In the first place expenditures were deflated to 2004 prices based on ONS (2009). We also considered the
5 Details of the derivation of equations 2-4 are given in Druckman and Jackson (2008a).

7
possibility of ‘scaling’ the JRF expenditures to reflect the fact that society moved on between 2004 and 2008. Specifically, the impacts of this are most likely to be that the budget requirements for a decent life were lower in 2004 than they were by 2008. On the other hand, estimating the extent of this change is inherently difficult, so we have chosen to assume that the requirements for a decent life changed only marginally over the period. It should be noted that this assumption is likely to overestimate the GHG emissions associated with the Reduced Consumption Scenario by comparison with the actual emissions in 2004. A further preparation step was required because the QMRIO model requires expenditures in Standard Industrial Classification (SIC) categories and the JRF budgets were provided in COICOP6 categories. Therefore the JRF expenditures were converted from COICOP into SIC categories using the proportionality method described in Druckman and Jackson (2008a). The JRF expenditures were then checked to be compatible and consistent with the other data sources used SELMA. The JRF report includes council tax payments: these are categorised as local government in the National Accounts and therefore, to achieve consistency, council tax payments were excluded from this study. As stated above, the JRF budgets allocate a relatively high amount of expenditure to childcare. Modelling them in SELMA would assume that the majority of the childcare takes place outside the home7, as the model would pick up all the GHGs associated with running nurseries and so on. However, examination of the heating regime for households with children (Table 2) shows that heating is switched on for 16 hours per day in these households8. This implies that childcare takes place within the home, and that the childcare payments listed are for nannies looking after children in the family home. We therefore exclude childcare payments in this study, as inclusion and allocation according to the Supply and Use Tables would over-estimate GHG emissions. Once the GHG emissions for each type of household had been estimated, total emissions in the Reduced Consumption Scenario were estimated by grossing up emissions for each household type on the basis of the proportion of UK households represented by each type in the UK as shown in Table 39.
Family Type % of total UK households A Single pensioner 16.4 B Couple pensioner 12.2 C Single working age 16.0 D Couple working age 18.4 E Single parent, 1 child 3.7 F Single parent, 2 children 2.8 G Single parent, 3 children 0.9 H Couple parents, 1 child 8.0 I Couple parents, 2 children 11.2 J Couple parents, 3 children 3.5 K Couple parents, 4 children 0.9 Other10 6.0 Total 100
Table 3. Distribution of minimum acceptable standard of living budget family types. Source:
Bradshaw et al (2008)
6 Classification of Individual Consumption According to Purpose (UN 2005). 7 In the COICOP categorisation childcare expenditure is allocated to Social Protection. For use in the QMRIO model this has to be allocated to SIC categories. This is done on the basis of allocations published in the ‘Households final consumption expenditure by COICOP heading’ table in the Supply and Use Tables (ONS 2006). According to this, Social Protection is allocated mainly to SIC categories Social Work Activities (51%) and Health and Veterinary Services (25%). These allocations would not be ideal. 8 We assume that on average the heating regime in these households would be ‘on’ for 16 hours during waking hours and ‘off’ for 8 hours during the night. 9 It was assumed that N. Ireland has same distribution of types of households as Britain. 10 ‘Other’ was ignored and the percentage of household types A-K re-scaled accordingly.

8
In our analysis of household consumption we are interested in exploring the uses for which households emit GHGs. For this purpose the format of the results from the QMRIO model are not ideal, being in Standard Industrial Classification (SIC). We therefore convert them to COICOP which gives uses in twelve high level functional use categories. As our focus is on GHG emissions we separate out two categories of direct energy use (Electricity11, gas and other fuels; and Personal transportation fuels), making altogether 14 categories of GHG emissions as shown in Table 4.
COICOP Category Description 1 Food & non-alcoholic drink 2 Alcoholic drinks, tobacco, narcotics 3 Clothing & footwear 4.4.1 Electricity, gas and other fuels 4.1 - 4.3 Housing 5 Household goods & services 6 Health 7.2.2.1-2 Personal transport fuels Remainder of 7 Other transport 8 Communication 9 Recreation & culture 10 Education 11 Restaurants & hotels 12 Miscellaneous goods & services
Table 4. Extended COICOP categories used in this study
There are some important assumptions and limitations inherent in this methodology. These mainly arise from limitations in the data on which the QMRIO model is built. These limitations are discussed in detail elsewhere (Druckman and Jackson (2008a), Druckman et al (2008)) and are therefore not repeated here. It should be said that, although the limitations are considerable, comparison of the results of SELMA with those from other studies (which largely share many of the same limitations) is favourable. A specific methodological limitation to the study is that mean household expenditure in the Reduced Consumption Scenario is significantly below the actual 2004 mean, whereas the Environmental Input-Output (EIO) analysis methodology used within SELMA assumes marginal changes in final demand. Some of the most significant differences in expenditure are with regard to direct energy use (fuel for personal transportation and household energy), and the GHG emissions attributed to these expenditures are not estimated using the EIO model, and are therefore not effected by this limitation. However, the accuracy of embedded emissions estimated using EIO may be effected. Two problems arise when using the EIO model in these circumstances. The first is that the EIO model used within SELMA is based on an underlying assumption of uniform energy prices for all consumers (inter-industry and final demand) for each energy type (primary and secondary). As shown in Miller and Blair (2009: Appendix 9.1), this can lead to incorrect computation of the total energy requirement, and may yield results that contravene the laws of energy conservation. In our model this may have the effect of over- or under-estimating the GHG emissions attributed to household final demand. The methodology used within SELMA partially addresses this problem within the electricity sector, which is the most critical sector with regards to GHG emissions. In SELMA we take account of different electricity prices paid by industry and households. This is done by using the price for electricity supply to industry sectors in making the GHG intensity coefficient for the electricity sector used in the EIO model (Druckman and Jackson 2008a). The GHG emissions attributed to direct household electricity consumption are estimated exogenously from DTI (2006). To fully overcome this limitation hybrid Environmental Input Output Analysis should be used, in which physical units of greenhouse gases are used for energy sectors, and monetary units are used for other sectors
11 In fact electricity is not strictly a direct energy, as energy is generated at power stations while electricity is itself just an energy carrier. It is, however, included in this category as this is how it is commonly perceived by consumers, and it is subject to household decisions concerning its use and savings in a similar manner to gas.

9
(see Miller and Blair (2009: Chapter 9)). This methodology is, however, problematic due to lack of data. The second problem when using the EIO model in these circumstances, is that significant changes in final demand expenditure, in terms of both quantity and product mix, might cause changes in industry structure (as given by the Leontief Inverse Matrix) and import patterns. The effect of these changes on the GHG intensity of products is hard to predict, and not taken into account in this study. Our study thus assumes that the technology used in the production and distribution of goods and services and patterns of imports in the Reduced Consumption Scenario are unchanged from the actual systems used in 2004. A further limitation in the methodology used in this study is that the EIO model is based on average prices in each sector. As noted earlier, prices for 90% of items in the JRF study were from national chain stores, which generally dominate the market. This is especially the case in the food market, where 85% of food is purchased at major supermarkets (Freeman et al. 2008) and therefore food prices used in our study are assumed to be close to average. However, for other items prices used may have been below average (especially, for example, clothes costed at Primark), and hence the GHG emissions for these items in the Reduced Consumption Scenario may be under-estimated (Girod and De Haan 2010).
4 GHG emissions in the Reduced Consumption Scenario
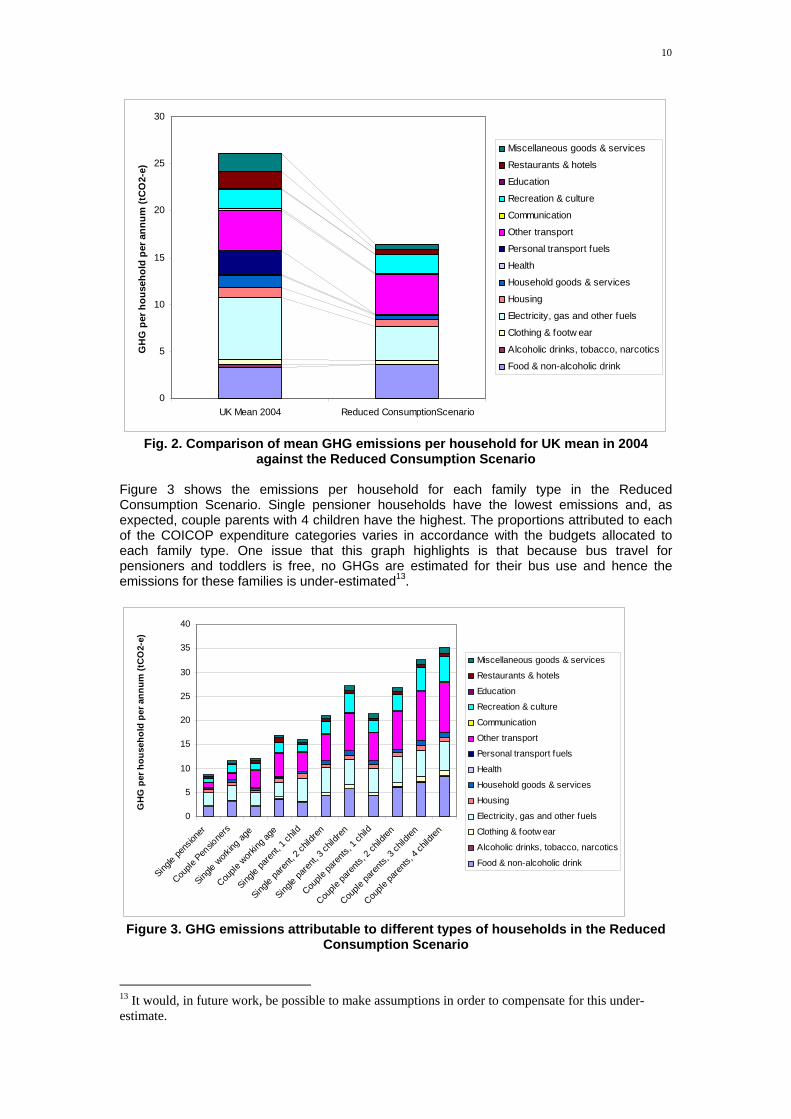
Emissions in the Reduced Consumption Scenario are 37% lower than the actual consumption-based emissions in the UK in 2004. Figure 2 shows that in the Reduced Consumption Scenario the average household footprint is 17tCO2-e as compared to actual (historical) consumption-based emissions of 26tCO2-e Comparison of specific categories shows that, as use of personal motor vehicles is not deemed necessary in the Reduced Consumption Scenario, emissions due to personal transportation fuels are zero whereas in reality 2004 UK mean personal transportation emissions were 2.6tCO2-e, or 10% of the total. In the Reduced Consumption Scenario holidays are assumed to be taken in the UK, eliminating aviation emissions12 which were responsible for around 5% of UK household emissions in 2004 (Druckman and Jackson 2009b). Emissions due to Electricity, gas and other fuels are shown to be reduced by 45% in the Reduced Consumption Scenario. This is achieved mainly through the assumed higher standard of thermal insulation of dwellings in the Scenario along with the tight fit of dwelling size to number of inhabitants, as described earlier. Other categories of expenditure that are reduced by moving to the scenario are: Restaurants and hotels (69%); Miscellaneous goods and services (68%); and Household goods and services (60%). These categories represent largely discretionary purchases which are reduced in the Reduced Consumption Scenario. The only category that shows an increase is Food and non-alcoholic drink, and this reflects the diet chosen, which was nutritionally checked by a nutritionists and has higher fruit and vegetable content than average 2004 UK diets.
12 Aviation is included in ‘Other transport’ in this study.
10
0
5
10
15
20
25
30
UK Mean 2004 Reduced ConsumptionScenario
GH
G p
er h
ou
seh
old
per
an
nu
m (
tCO
2-e)
Miscellaneous goods & services
Restaurants & hotels
Education
Recreation & culture
Communication
Other transport
Personal transport fuels
Health
Household goods & services
Housing
Electricity, gas and other fuels
Clothing & footw ear
Alcoholic drinks, tobacco, narcotics
Food & non-alcoholic drink
Fig. 2. Comparison of mean GHG emissions per household for UK mean in 2004
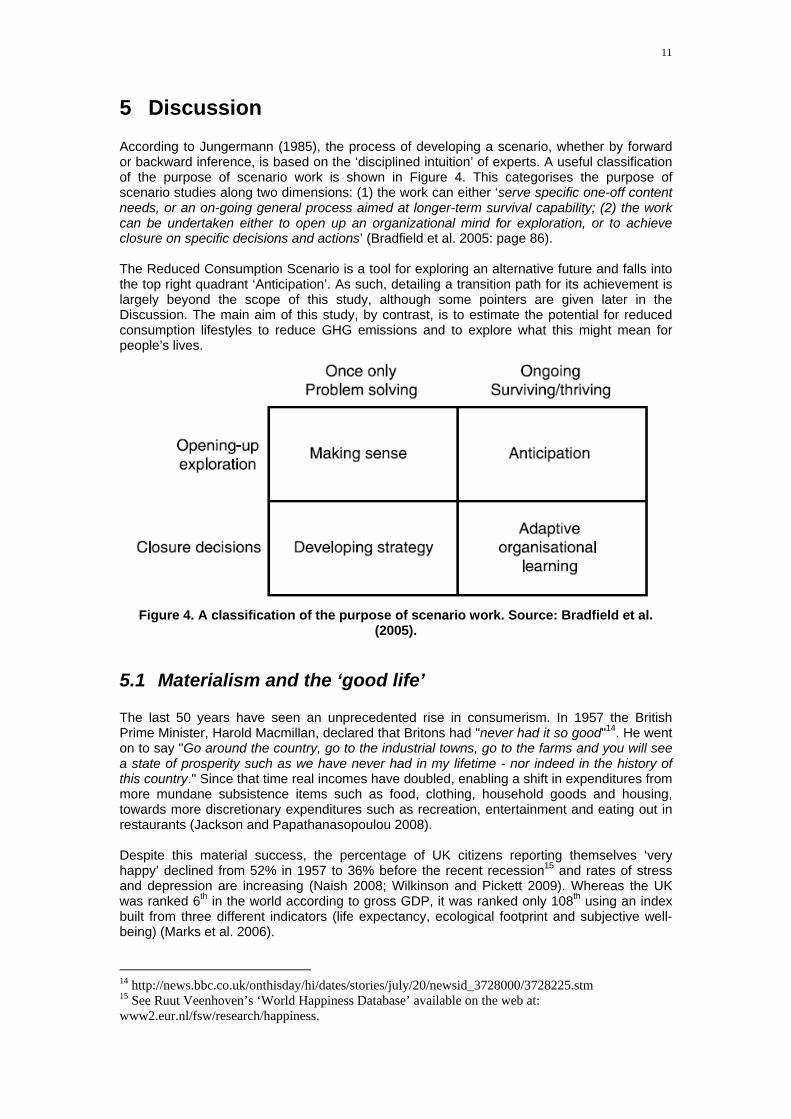
against the Reduced Consumption Scenario Figure 3 shows the emissions per household for each family type in the Reduced Consumption Scenario. Single pensioner households have the lowest emissions and, as expected, couple parents with 4 children have the highest. The proportions attributed to each of the COICOP expenditure categories varies in accordance with the budgets allocated to each family type. One issue that this graph highlights is that because bus travel for pensioners and toddlers is free, no GHGs are estimated for their bus use and hence the emissions for these families is under-estimated13.
0
5
10
15
20
25
30
35
40
Single
pen
sione
r
Coupl
e Pen
sione
rs
Single
wor
king a
ge
Coupl
e wor
king
age
Single
par
ent,
1 ch
ild
Single
par
ent,
2 ch
ildre
n
Single
par
ent,
3 ch
ildre
n
Coupl
e pa
rent
s, 1
chil
d
Coupl
e pa
rent
s, 2
chil
dren
Coupl
e pa
rent
s, 3
chil
dren
Coupl
e pa
rent
s, 4
chil
dren
GH
G p
er h
ou
seh
old
per
an
nu
m (
tCO
2-e)
Miscellaneous goods & services
Restaurants & hotels
Education
Recreation & culture
Communication
Other transport
Personal transport fuels
Health
Household goods & services
Housing
Electricity, gas and other fuels
Clothing & footw ear
Alcoholic drinks, tobacco, narcotics
Food & non-alcoholic drink
Figure 3. GHG emissions attributable to different types of households in the Reduced
Consumption Scenario
13 It would, in future work, be possible to make assumptions in order to compensate for this under-estimate.
11
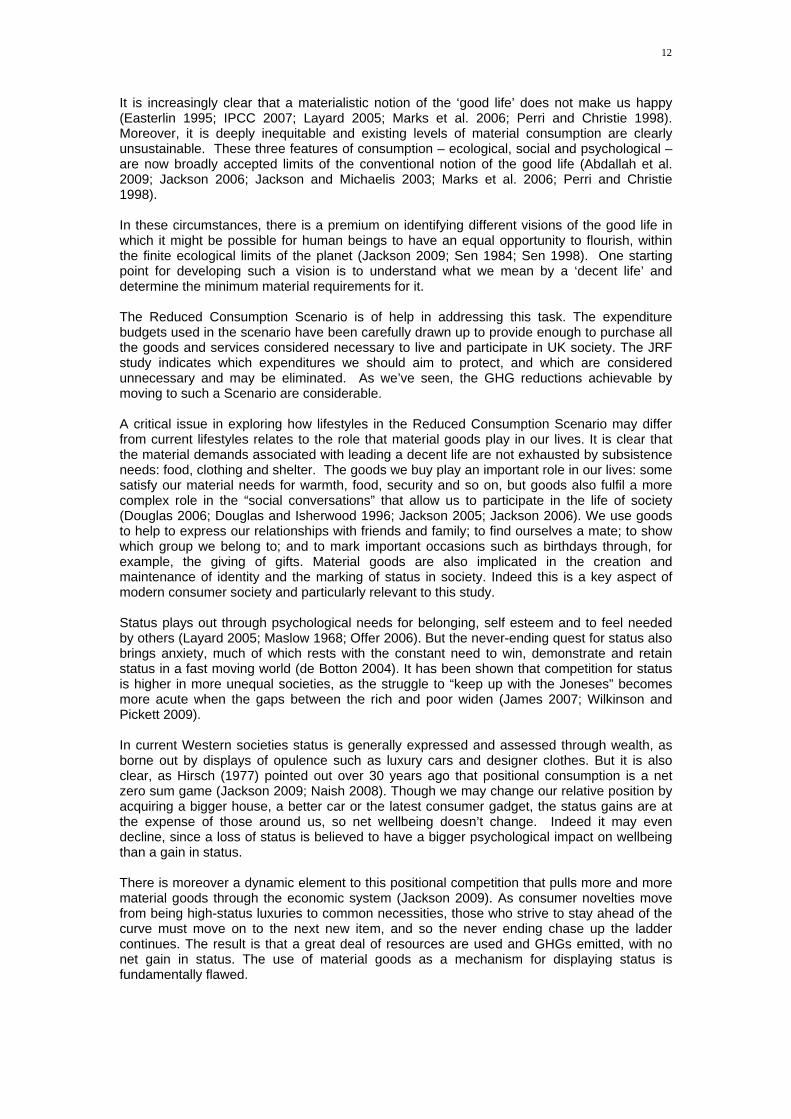
5 Discussion According to Jungermann (1985), the process of developing a scenario, whether by forward or backward inference, is based on the ‘disciplined intuition’ of experts. A useful classification of the purpose of scenario work is shown in Figure 4. This categorises the purpose of scenario studies along two dimensions: (1) the work can either ‘serve specific one-off content needs, or an on-going general process aimed at longer-term survival capability; (2) the work can be undertaken either to open up an organizational mind for exploration, or to achieve closure on specific decisions and actions’ (Bradfield et al. 2005: page 86). The Reduced Consumption Scenario is a tool for exploring an alternative future and falls into the top right quadrant ‘Anticipation’. As such, detailing a transition path for its achievement is largely beyond the scope of this study, although some pointers are given later in the Discussion. The main aim of this study, by contrast, is to estimate the potential for reduced consumption lifestyles to reduce GHG emissions and to explore what this might mean for people’s lives.
Figure 4. A classification of the purpose of scenario work. Source: Bradfield et al.
(2005).
5.1 Materialism and the ‘good life’ The last 50 years have seen an unprecedented rise in consumerism. In 1957 the British Prime Minister, Harold Macmillan, declared that Britons had "never had it so good"14. He went on to say "Go around the country, go to the industrial towns, go to the farms and you will see a state of prosperity such as we have never had in my lifetime - nor indeed in the history of this country." Since that time real incomes have doubled, enabling a shift in expenditures from more mundane subsistence items such as food, clothing, household goods and housing, towards more discretionary expenditures such as recreation, entertainment and eating out in restaurants (Jackson and Papathanasopoulou 2008). Despite this material success, the percentage of UK citizens reporting themselves ‘very happy’ declined from 52% in 1957 to 36% before the recent recession15 and rates of stress and depression are increasing (Naish 2008; Wilkinson and Pickett 2009). Whereas the UK was ranked 6th in the world according to gross GDP, it was ranked only 108th using an index built from three different indicators (life expectancy, ecological footprint and subjective well-being) (Marks et al. 2006).
14 http://news.bbc.co.uk/onthisday/hi/dates/stories/july/20/newsid_3728000/3728225.stm 15 See Ruut Veenhoven’s ‘World Happiness Database’ available on the web at: www2.eur.nl/fsw/research/happiness.
12
It is increasingly clear that a materialistic notion of the ‘good life’ does not make us happy (Easterlin 1995; IPCC 2007; Layard 2005; Marks et al. 2006; Perri and Christie 1998). Moreover, it is deeply inequitable and existing levels of material consumption are clearly unsustainable. These three features of consumption – ecological, social and psychological – are now broadly accepted limits of the conventional notion of the good life (Abdallah et al. 2009; Jackson 2006; Jackson and Michaelis 2003; Marks et al. 2006; Perri and Christie 1998). In these circumstances, there is a premium on identifying different visions of the good life in which it might be possible for human beings to have an equal opportunity to flourish, within the finite ecological limits of the planet (Jackson 2009; Sen 1984; Sen 1998). One starting point for developing such a vision is to understand what we mean by a ‘decent life’ and determine the minimum material requirements for it. The Reduced Consumption Scenario is of help in addressing this task. The expenditure budgets used in the scenario have been carefully drawn up to provide enough to purchase all the goods and services considered necessary to live and participate in UK society. The JRF study indicates which expenditures we should aim to protect, and which are considered unnecessary and may be eliminated. As we’ve seen, the GHG reductions achievable by moving to such a Scenario are considerable. A critical issue in exploring how lifestyles in the Reduced Consumption Scenario may differ from current lifestyles relates to the role that material goods play in our lives. It is clear that the material demands associated with leading a decent life are not exhausted by subsistence needs: food, clothing and shelter. The goods we buy play an important role in our lives: some satisfy our material needs for warmth, food, security and so on, but goods also fulfil a more complex role in the “social conversations” that allow us to participate in the life of society (Douglas 2006; Douglas and Isherwood 1996; Jackson 2005; Jackson 2006). We use goods to help to express our relationships with friends and family; to find ourselves a mate; to show which group we belong to; and to mark important occasions such as birthdays through, for example, the giving of gifts. Material goods are also implicated in the creation and maintenance of identity and the marking of status in society. Indeed this is a key aspect of modern consumer society and particularly relevant to this study. Status plays out through psychological needs for belonging, self esteem and to feel needed by others (Layard 2005; Maslow 1968; Offer 2006). But the never-ending quest for status also brings anxiety, much of which rests with the constant need to win, demonstrate and retain status in a fast moving world (de Botton 2004). It has been shown that competition for status is higher in more unequal societies, as the struggle to “keep up with the Joneses” becomes more acute when the gaps between the rich and poor widen (James 2007; Wilkinson and Pickett 2009). In current Western societies status is generally expressed and assessed through wealth, as borne out by displays of opulence such as luxury cars and designer clothes. But it is also clear, as Hirsch (1977) pointed out over 30 years ago that positional consumption is a net zero sum game (Jackson 2009; Naish 2008). Though we may change our relative position by acquiring a bigger house, a better car or the latest consumer gadget, the status gains are at the expense of those around us, so net wellbeing doesn’t change. Indeed it may even decline, since a loss of status is believed to have a bigger psychological impact on wellbeing than a gain in status. There is moreover a dynamic element to this positional competition that pulls more and more material goods through the economic system (Jackson 2009). As consumer novelties move from being high-status luxuries to common necessities, those who strive to stay ahead of the curve must move on to the next new item, and so the never ending chase up the ladder continues. The result is that a great deal of resources are used and GHGs emitted, with no net gain in status. The use of material goods as a mechanism for displaying status is fundamentally flawed.

13
5.2 Lifestyles in the Reduced Consumption Scenario In the light of this discussion, we now explore what the Reduced Consumption Scenario may mean for lifestyles. First, we note that this hypothetical society is, in material terms, egalitarian, with everyone assumed to purchase no more material goods than are required for the minimum income standard. As discussed above, societies with lower inequalities have, in general, higher levels of well-being. Therefore, broadly speaking, the Reduced Consumption Scenario may be expected to lead to higher levels of well-being. The Reduced Consumption Scenario is designed in such a way that basic subsistence needs are widely met, with great care and attention being given to, for example, the nutritional value of the prescribed food allocations, and adequate warmth in dwellings. But allowance is also provided to mark important occasions by buying gifts, and a certain amount of alcohol, for example, is included for participation in social occasions. On the other hand, the JRF budgets are carefully planned to avoid many of the traps that modern consumers fall into. For example, everything in the budgets was considered to be “necessary” whereas in our current culture of consumption many goods are purchased that are subsequently found not to be needed (Trocchia and Janda 2002). This phenomenon of ‘over-consumption’ is illustrated by the plethora of unused items advertised on websites such as Freecycle16, Ebay17, and the expansion of the personal storage industry (Naish 2008). In the JRF budgets the vast quantities of purchases that result in goods being ‘under-consumed’ or even never used at all are eliminated. Accordingly, emissions of the GHGs that arise in the production and distribution of these goods are also eliminated in the Reduced Consumption Scenario. On the surface at least, it appears that the JRF budgets exclude provision for goods which are seen mainly as positional goods or status markets. This raises the interesting question of whether the Reduced Consumption Scenario is in any sense a status-based society. Certainly, the egalitarian assumption of a consistent minimum income standard across the population would suggest that this is a far less status-driven society. And as we have already noted, this could enhance the levels of wellbeing. On the other hand, it is possible to conceive of alternative ways in which status may be marked, even when incomes are equalised and material distinctions are eroded. Although material goods are used widely for marking status in most cultures, Western society has recently taken this to extremes. For example, at the beginning of Margaret Thatcher’s term as UK Prime Minister at the end of the 1970s, status was derived mainly through a person’s job title, family history, and school attended. In contrast, by the end of her era some 11 years later, status was defined increasingly by material possessions (Bauman 1998; Goodall 2007). It should be noted that the remit of the groups setting the budgets in the JRF study did not include the environmental aspects of consumption. Therefore the budgets were designed largely without regard to resultant environmental impact. Interestingly, however, many of the expenditures reduced or eliminated are those that have high energy intensity. For example, the study assumed insulation levels in dwellings above the current national average18 and, accordingly, consumption of gas for central heating is lower in the Reduced Consumption Scenario than current mean UK levels. The study also assumed a closeness of
16 Freecycle is a grassroots and entirely non-profit movement of people who are giving (& getting) ‘stuff’ for free in their own towns. It's aim is to encourage re-use and to reduce the quantity of goods sent to landfill.. See http://www.freecycle.org/ 17 See http://www.ebay.co.uk. A recent study has found that the percentage of unused products offered at eBay ranges from over 85% of books to around 12% of ICT and Consumer Electronics (Erdmann and Henseling 2009). 18 The heating regime was based on the requirements in social housing which has on average higher thermal ratings than the private sector (Oldfield 2008).

14
fit between family size and dwelling19. Conditions in the UK are slowly moving in these directions: recent statistics show a trend towards the construction of dwellings with a smaller number of bedrooms (ONS 2008b) and the UK government has a policy to improve the thermal efficiency of the housing stock (HM Government 2009). However, the assumptions in the Scenario regarding housing represent a radical step change from current conditions. Furthermore, the Scenario also assumes that personal vehicle transport is not necessary, and instead provides for purchasing bicycles and bus passes, along with taxi hire once a week for journeys that could otherwise be problematic. It is of course highly contentious to assume that participation in society is possible without private vehicle use, particularly in a society structured as ours is today and heavily reliant on infrastructures of private transport. Some studies have estimated that private vehicle use could be reduced by around 20% - even within current transport structures (Anable et al. 2005; Goodwin 2008). But beyond this, without major infrastructure changes which are slow and costly to implement, participation in society may be jeopardised. Adjustments could be made to take account of this, but we have stayed faithful to the JRF study assumptions. If the JRF study’s remit had been to reduce environmental impacts it is probable that they would have made some different choices, particularly with regard to food. Our analysis estimates that 22% of total emissions in the Reduced Consumption Scenario would be attributed to Food and non-alcoholic drink. A diet with less meat and dairy foods would result in lower emissions, as livestock have been shown to account for a significant proportion of GHG emissions (Garnett 2008; Garnett 2009). This could be done without jeopardising nutritional standards. For example, in a study which compared meals with comparable nutritional values, a meal made from potatoes, carrots and dry peas was estimated to have nine times lower emissions than a meal with tomatoes, rice and pork (Carlsson-Kanyama 1998). It should also be noted that the JRF study did not challenge the underlying current consumer culture of the “throw-away” society (Cooper 2005). For example, it is assumed that adults’ socks last for just one year: this could be extended by education in repair techniques that could be used to extend product lifetimes.
5.3 Achieving a transition to a Reduced Consumption Scenario
As discussed earlier, the Reduced Consumption Scenario is primarily a tool for thinking about an alternative, more sustainable future, and hence it is not the intention of this paper to map out a pathway of how it might be achieved. Nevertheless, brief consideration of how the Scenario might come about is a useful addition to the picture. In order for specific aspects of the Reduced Consumption Scenario concerning household energy and transport to become realities, considerable investment would be needed to increase the energy efficiency of dwellings, improve public transport and change the planning and infrastructure of provision. Recently there have been calls for massively enhanced investment in the transition to a low-carbon society: calls for a green or sustainable ‘new deal’ (GND 2008; SDC 2009; UNEP 2009) suggest that up to 2% of GDP could legitimately be targeted at a green ‘sweet spot’ of low carbon investment (DB 2008) which includes domestic energy efficiency improvement and public transportation. In the April 2009 budget the UK government pledged £375 million to support energy and resource efficiency in businesses, public buildings and households over the next two years (HM Treasury 2009). Although this will go some way towards carrying out the upgrading required, much more would be needed to achieve the profound changes required for the Reduced Consumption Scenario.
19 Of course, smaller family sizes result in the loss of the economies of scale that are generally achieved by a larger households (Druckman and Jackson 2008b). A more detailed discussion of this is beyond the remit of this paper.
15
A key element of a Reduced Consumption Scenario is, of course, lower household expenditure which, in turn, implies reduced levels of industrial turnover. Full analysis of the macro-economics required to achieve this is inevitably beyond the scope of this paper. Suffice to say here that one way to move towards this might be through a general reduction in working hours, whether through a shorter working week, a stepping down to one income per household, or a combination of both (Jackson 2009; Victor and Rosenbluth 2007). Shorter working hours could also mean more time spent caring for children and the elderly, and for recreation and leisure. This in turn, may be expected to reduce levels of stress and increase levels of well-being. As noted above, the Reduced Consumption Scenario represents an egalitarian society in material terms: as such it is radically different from the current situation in the UK, which saw significant increases in inequalities during the 1980s which will be hard to reverse (Goodman and Oldfield 2004). Policies that can be used to reduce inequalities include revising income tax structures, improved access to good education and anti-discrimination measures (Jackson 2009). As highlighted by Wilkinson and Pickett (2009), the dividends that can be expected from a more equal society in terms of well-being are considerable. As discussed above, marking of status is fundamental to society and in the Reduced Consumption Scenario alternatives to marking status through material goods will be needed. Such a change relies on a significant shift in social norms and this is clearly a huge demand on the viability of a Reduced Consumption Scenario. However, it is also worth remarking here that some evidence for shifts in consumption norms does exist: examples include the ‘voluntary simplicity’ movement (Huneke 2005), the ‘downshifting’ movement (Hamilton 2003) and ‘intentional communities’ such as Findhorn20. All these lifestyle movements have in common a reduced emphasis on consumerism with the aim of achieving well-being through less materialistic means. An indication of the extent to which social norms are changing were given by a survey in which 25% British adults aged 30-59 gave affirmative answers to the question “In the last ten years have you voluntarily made a long-term change in your lifestyle, other than planned retirement, which has resulted in you earning less money?” (Hamilton 2003: p12). When asked by how much their incomes fell as a result of the life-change, the average reduction was 40%. This is a substantial decline, suggesting a major life change. Although starting from a high consumerist base, Hamilton’s survey suggests that there is a significant move towards less-materialistic lifestyles.
6 Conclusion This paper started with the premise that remaining within ecological limits demands a serious consideration of the possibility of consumption restraint in the richer nations. Our aim was to explore what GHG emissions would be required to support a ‘decent life’ under such constraints. For such lifestyles to become a reality we assumed that they must meet an acceptable standard with regards to providing subsistence needs and also the social need to participate in society. We have drawn on a report by the Joseph Rowntree Foundation that drew up detailed expenditure budgets for a minimum acceptable income standard in the UK. We used these budgets to estimate the GHGs that would be emitted (in the UK and elsewhere) in the production and distribution of all the goods and services that are purchased according to the budgets. Our calculations have estimated that in a Reduced Consumption Scenario, GHGs would be around 37% lower than mean household GHG emissions in 2004. Our report has explored the radical differences between current lifestyles and those in the Reduced Consumption Scenario. In material terms, the Reduced Consumption Scenario depicts a hypothetical, egalitarian society and much evidence shows that levels of well-being are higher in less divided societies. The Scenario provides the basics for people to live well and participate in society, but much of the ‘over-consumption’ that we associate with current lifestyles, and the pursuit of status through displays of material goods, would no longer be possible within the Scenario.
20 See http://www.ecovillagefindhorn.com/
16
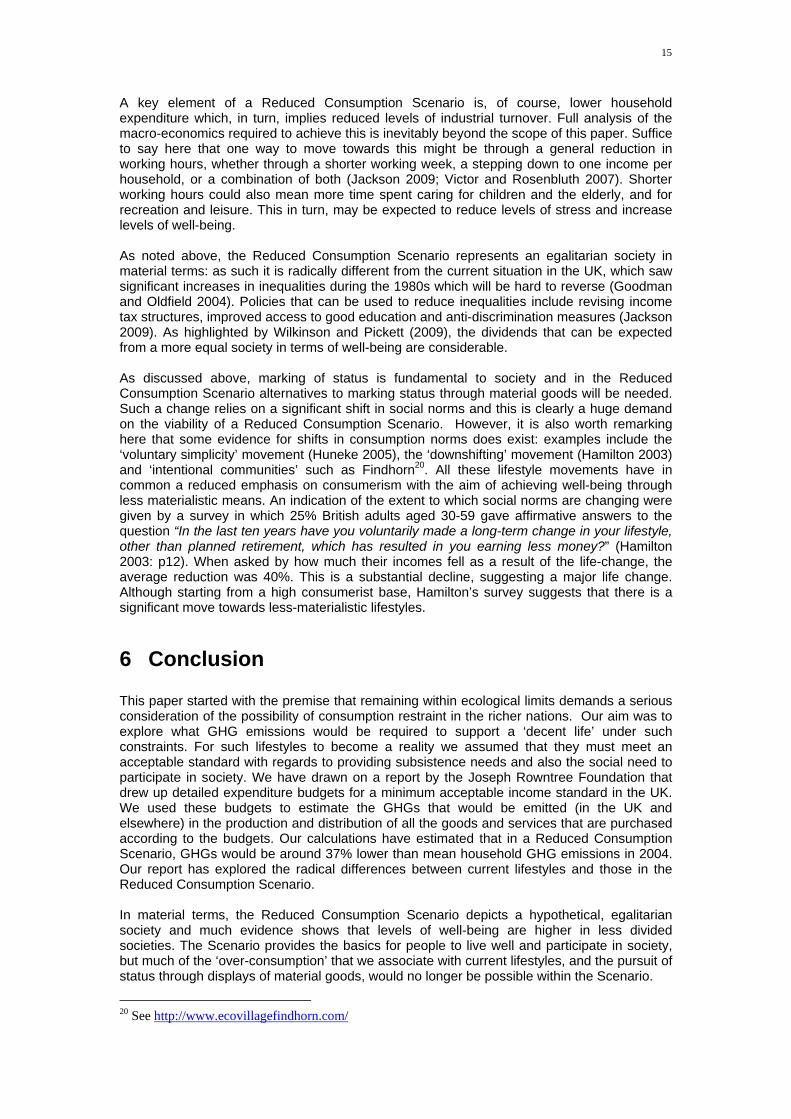
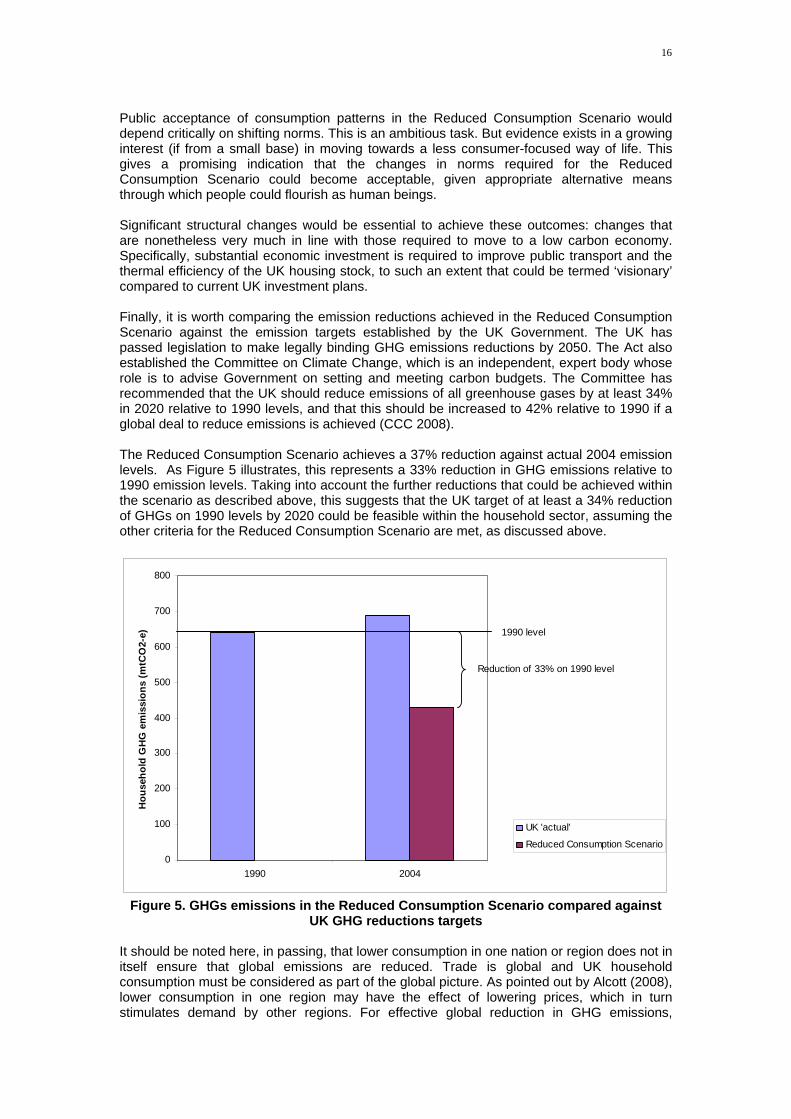
Public acceptance of consumption patterns in the Reduced Consumption Scenario would depend critically on shifting norms. This is an ambitious task. But evidence exists in a growing interest (if from a small base) in moving towards a less consumer-focused way of life. This gives a promising indication that the changes in norms required for the Reduced Consumption Scenario could become acceptable, given appropriate alternative means through which people could flourish as human beings. Significant structural changes would be essential to achieve these outcomes: changes that are nonetheless very much in line with those required to move to a low carbon economy. Specifically, substantial economic investment is required to improve public transport and the thermal efficiency of the UK housing stock, to such an extent that could be termed ‘visionary’ compared to current UK investment plans. Finally, it is worth comparing the emission reductions achieved in the Reduced Consumption Scenario against the emission targets established by the UK Government. The UK has passed legislation to make legally binding GHG emissions reductions by 2050. The Act also established the Committee on Climate Change, which is an independent, expert body whose role is to advise Government on setting and meeting carbon budgets. The Committee has recommended that the UK should reduce emissions of all greenhouse gases by at least 34% in 2020 relative to 1990 levels, and that this should be increased to 42% relative to 1990 if a global deal to reduce emissions is achieved (CCC 2008). The Reduced Consumption Scenario achieves a 37% reduction against actual 2004 emission levels. As Figure 5 illustrates, this represents a 33% reduction in GHG emissions relative to 1990 emission levels. Taking into account the further reductions that could be achieved within the scenario as described above, this suggests that the UK target of at least a 34% reduction of GHGs on 1990 levels by 2020 could be feasible within the household sector, assuming the other criteria for the Reduced Consumption Scenario are met, as discussed above.
0
100
200
300
400
500
600
700
800
1990 2004
Ho
use
ho
ld G
HG
em
issi
on
s (m
tCO
2-e)
UK 'actual'
Reduced Consumption Scenario
1990 level
Reduction of 33% on 1990 level
Figure 5. GHGs emissions in the Reduced Consumption Scenario compared against
UK GHG reductions targets It should be noted here, in passing, that lower consumption in one nation or region does not in itself ensure that global emissions are reduced. Trade is global and UK household consumption must be considered as part of the global picture. As pointed out by Alcott (2008), lower consumption in one region may have the effect of lowering prices, which in turn stimulates demand by other regions. For effective global reduction in GHG emissions,

17
reductions in developed countries’ emissions through reduced consumption scenarios as addressed in this paper must be accompanied by globally agreed emissions quotas. Nonetheless, the conclusion from this study is optimistic. A shift towards a society less focused on status-driven consumerism is essential. Such a society would have to prioritise the task of providing capabilities for flourishing in less materialistic ways (Jackson 2009). In particular it would need to build strong avenues for social participation and to renew a sense of common citizenship and purpose (Sandel 2009). This task requires strong leadership and significant investment. But if supported by specific structural changes, our analysis suggests that significant reductions in GHG emissions could be achieved without jeopardising social well-being. Acknowledgements We are grateful to Dr Glen Peters for his kind provision of amendments to the GTAP GHG emissions data for selected countries. We are also grateful to two anonymous reviewers whose comments and suggestions greatly improved the paper. The research is supported by funding from the ESRC Research Group on Lifestyles Values and Environment (RESOLVE) (Grant Number RES-152-25-1004). References Abdallah, S., S. Thompson, J. Michaelson, N. Marks and N. Steuer (2009). The un-happy
planet index: Why good lives don’t have to cost the Earth. London, UK, New Economics Foundation.
Alcott, B. (2008). "The sufficiency strategy: Would rich-world frugality lower environmental
impact?" Ecological Economics 64(4): 770-786. Anable, J., S. Cairns, L. Sloman, P. Goodwin, A. Kirkbride and C. Newson (2005). Soft’
Measures – soft option or smarter choice for early energy savings in the transport sector. ECEEE 2005 Summer Study – What Works & Who Delivers?, Mandelieu La Napoule, France. 30 May – 4 June 2005.
Anderson, B. R., P. F. Chapman, N. G. Cutland, C. M. Dickson, S. M. Doran, J. H.
Henderson, P. J. Iles, L. Kosima and L. D. Shorrock (2002). BREDEM-8 Model Description: 2001 Update. Garston, Watford, UK, BRE
Bauman, Z. (1998). Work, Consumerism and the New Poor. Buckingham, UK, Open
University Press. Bradfield, R., G. Wright, G. Burt, G. Cairns and K. Van Der Heijden (2005). "The origins and
evolution of scenario techniques in long range business planning." Futures 37(8): 795-812.
Bradshaw, J., S. Middleton, A. Davis, N. Oldfield, N. Smith, L. Cusworth and J. Williams
(2008). A minimum income standard for Britain: what people think. York, UK, Joseph Rowntree Foundation.
Carlsson-Kanyama, A. (1998). "Climate change and dietary choices -- how can emissions of
greenhouse gases from food consumption be reduced?" Food Policy 23(3-4): 277-293.
CCC (2008). Building a low-carbon economy - the UK's contribution to tackling climate
change. London, UK, Committee on Climate Change. Cooper, T. (2005). "Slower Consumption: Reflections on Product Life Spans and the
"Throwaway Society"." Journal of Industrial Ecology 9(1): 51-68.

18
Daly, H. and J. Cobb (1989). For the Common Good. Washington DC, Island Press. Daly, H. (1996). Beyond Growth - The Economics of Sustainable Development. Boston, MA.,
Beacon Press DB (2008). Economic Stimulus: The Case for 'Green' Infrastructure. Deutsche Bank Advisors.
New York, USA, Deutsche Bank. de Botton, A. (2004). Status Anxiety. London, UK, Hamish Hamilton - Penguin Books. Defra. (2008). "A framework for pro-environmental behaviours." Accessed 10.06.09, from
http://www.defra.gov.uk/evidence/social/behaviour/index.htm. Douglas, M. and B. Isherwood (1996). The World of Goods - towards an anthropology of
consumption. 2nd Edition. London and New York, Routledge. Douglas, M. (2006). Relative Poverty, Relative Communication. In: Traditions of Social Policy
A. Halsey.(Ed(s)) Oxford, UK, Basil Blackwell. Druckman, A., P. Bradley, E. Papathanasopoulou and T. Jackson (2008). "Measuring
progress towards carbon reduction in the UK " Ecological Economics 66(4): 594-604. Druckman, A. and T. Jackson (2008a). The Surrey Environmental Lifestyle MApping (SELMA)
framework: development and key results to date. RESOLVE Working Paper 08-08, University of Surrey, Guildford, UK. Available from http://www.surrey.ac.uk/resolve/Docs/WorkingPapers/RESOLVE_WP_08-08.pdf.
Druckman, A. and T. Jackson (2008b). "Household energy consumption in the UK: a highly
geographically and socio-economically disaggregated model." Energy Policy 36(8): 3167– 3182.
Druckman, A. and T. Jackson (2009a). Mapping our carbon responsibilities: more key results
from the Surrey Environmental Lifestyle MApping (SELMA) framework. RESOLVE Working Paper 02-09, University of Surrey, Guildford, UK. Available from http://www.surrey.ac.uk/resolve/Docs/WorkingPapers/RESOLVE_WP_02-09.pdf.
Druckman, A. and T. Jackson (2009b). "The carbon footprint of UK households 1990-2004: a
socio-economically disaggregated, quasi-multiregional input-output model." Ecological Economics 68 (7): 2066–2077.
Easterlin, R. A. (1995). "Will raising the incomes of all increase the happiness of all?" Journal
of Economic Behavior & Organization 27(1): 35-47. Erdmann, L. and C. Henseling (2009). From Consumer to Prosumer – Development of new
trading and auction cultures to promote sustainable consumption. 5th International Conference on Industrial Ecology, 2009 ISIE Conference: Transitions Toward Sustainability. Lisbon, Portugal.
Freeman, P., J. Almond, B. Donoghue, A. Gregory, A. Hamlin and B. Lyons (2008). The
supply of groceries in the UK market investigation. London, UK, Competition Commission.
Garnett, T. (2008). "Cooking up a storm: Food, greenhouse gas emissions and our changing
climate." Accessed 15.06.09, from http://www.fcrn.org.uk/frcnPubs/publications/PDFs/CuaS_web.pdf.
Garnett, T. (2009). "Livestock-related greenhouse gas emissions: impacts and options for
policy makers." Environmental Science & Policy 12(4): 491-503.

19
Girod, B. and P. De Haan (2010). "More or Better? A Model for Changes in Household Greenhouse Gas Emissions due to Higher Income." Journal of Industrial Ecology, forthcoming.
GND (2008). A Green New Deal: Joined up policies to solve the triple crunch of the credit
crisis, climate change and high oil prices. The first report of the Green New Deal Group. London, UK, new economics foundation.
Goodall, C. (2007). How to live a low-carbon life: the individual's guide to stopping climate
change. London, UK, Earthscan. Goodman, A. and Z. Oldfield (2004). Permanent Differences? Income and Expenditure
Inequality in the 1990s and 2000s. London, UK, The Institute for Fiscal Studies. Goodwin, P. (2008). Policy Incentives to Change Behaviour in Passenger Transport. OECD
International Transport Forum. Transport and Energy: The Challenge of Climate Change. Leipzig, Germany. .
Hamilton, C. (2003). Downshifting in Britain: A sea-change in the pursuit of happiness.
Manuka, Australia, The Australia Institute, Discussion Paper Number 58. Hirsch, F. (1977). Social Limits to Growth. Revised edition (1995). London and New York,
Routledge. HM Government (2005). Securing the future: delivering UK sustainable development strategy.
London, UK, TSO (The Stationery Office). HM Government (2009). The UK Low Carbon Transition Plan: National strategy for climate
and energy. London, UK, TSO. HM Treasury. (2009). "Budget 2009: Building Britain's future." Accessed 11.06.09, from
http://budget.treasury.gov.uk/building_a_low_carbon_recovery.htm. Huneke, M., E. (2005). The face of the un-consumer: An empirical examination of the practice
of voluntary simplicity in the United States. 22: 527-550. IPCC (2007). IPCC Fourth Assessment Report. Working Group I Report "The Physical
Science Basis", Intergovernmental Panel on Climate Change. Cambridge University Press, New York, USA.
Jackson, T. and L. Michaelis (2003). Policies for Sustainable Consumption: a report to the
Sustainable Development Commission. London, UK, Sustainable Development Commission.
Jackson, T. (2005). Motivating Sustainable Consumption: a review of evidence on consumer
behaviour and behavioural change, SDRN. Jackson, T. (2006). Earthscan Reader in Sustainable Consumption. London, Earthscan. Jackson, T. (2008). The Challenge of Sustainable Lifestyles In: State of the World 2008 -
Innovations for a Sustainable Economy.(Ed(s)) Washington DC, USA, Worldwatch Institute.
Jackson, T. and E. Papathanasopoulou (2008). "Luxury or 'Lock-in'? an explanation of
unsustainable consumption in the UK: 1968 to 2000." Ecological Economics 68(1-2): 80-95.
Jackson, T. (2009). Prosperity without growth - economics for a finite planet. London, UK,
Earthscan.

20
James, O. (2007). Affluenza. London, UK, Vermilion. Jungermann, H. (1985). "Inferential Processes in the Construction of Scenarios." Journal of
Forecasting 4(4): 321-327. Layard, R. (2005). Happiness: Lessons from a New Science. London, UK, Penguin Books. Marks, N., A. Simms, S. Thompson and S. Abdallah (2006). The un-happy planet index: An
index of human well-being and environmental impact. London, New Economics Foundation and Friends of the Earth.
Maslow, A. (1968). Towards a Psychology of Being New York, USA, Harper & Row. Naish, J. (2008). Enough: Breaking free from the world of more. London, UK, Hodder &
Stoughton. Offer, A. (2006). The Challenge of Affluence. Oxford, UK, Oxford University Press. Oldfield, N. (2008). The fuel budget standard. York, Joseph Rowntree Foundation. ONS. (2006). "Input-Output (I-O) Supply and Use Tables (SUTs) ", Accessed 30.04.08, from
http://www.statistics.gov.uk/about/methodology_by_theme/inputoutput/latestdata.asp. ONS. (2008a). "Environmental Accounts." Accessed 07.11.08, from
http://www.statistics.gov.uk/statbase/explorer.asp?CTG=3&SL=&D=4261&DCT=32&DT=32#4261.
ONS. (2008b). "Housebuilding completions: by number of bedrooms, England." Accessed
14.01.10, from http://www.statistics.gov.uk/cci/nugget.asp?id=1768. ONS. (2009). "Consumer Trends data Quarter Three - 2008 Implied deflators (2003 = 100) -
Not seasonally adjusted." Accessed 19.02.09, from http://www.statistics.gov.uk/StatBase/ssdataset.asp?vlnk=9826&Pos=5&ColRank=1&Rank=144
ONS. (various years). "Expenditure and Food Survey ", Accessed 01.02.09, from
http://www.statistics.gov.uk/ssd/surveys/expenditure_food_survey.asp. Perri and I. Christie (1998). On the good Life In: The good life. D. Porter, T. Hampson and E.
Garman.(Ed(s)) Trowbridge, UK, Redwood Books. Reay, D. (2006). Climate Change Begins at Home: Life on the Two-Way Street of Global
Warming. Basingstoke, UK and New York, USA, MacMillan Sandel, M. (2009). A New Citizenship: The Reith Lectures 2009. London, UK, BBC. SDC (2009). A Sustainable New Deal: A stimulus package for economic, social and
ecological recovery. London, UK, Sustainable Development Commission. Sen, A. (1984). The Living Standard. Oxford., Economics Papers 36, 74-90. Sen, A. (1998). The Living Standard In: Ethics of Consumption: The Good Life, Ethics and
Global Stewardship. D. A. Crocker and T. Linden.(Ed(s)), Lanham, MD/Oxford, UK: Rowman and Littlefield.
Townsend, P. (1979). Poverty in the United Kingdom: A survey of household resources and
standards of living. Harmondsworth, Middx, UK, Penguin Books Ltd. Trocchia, P. J. and S. Janda (2002). "An investigation of product purchase and subsequent
non-consumption." Journal of Consumer Marketing 19(3): 188-204.
21
UN (2002). Report of the World Summit on Sustainable Development: Johannesburg, South
Africa, 26 August-4 September 2002. UN (2005). Classification of Individual Consumption According to Purpose, (COICOP). United
Nations Statistics Division. UNCED (1992). "Agenda 21". Rio de Janeiro, Brazil, 3-14 June 1992., United Nations
Conference on Environment and Development. UNEP (2009). Global green new deal: Policy brief. Geneva, Switzerland, United Nations
Environment Programme. Victor, P. A. and G. Rosenbluth (2007). "Managing without growth." Ecological Economics
61(2-3): 492-504. Wilkinson, R. and K. Pickett (2009). The Spirit Level: Why More Equal Societies Almost
Always Do Better. London, UK, Allen Lane - Penguin Group. Wilting, H. C. (2008). Analysis of the Sustainability of Supply Chains with a Multi-Regional
Input-Output Model. International Input Output Meeting on Managing the Environment, Seville, Spain, July 9 - 11, 2008.

22
Table 1. JRF expenditure budgets (summary). Sources: Bradshaw et al (2008) and (ONS various years).
A B C D E F G H I J K
Single pensioner
Couple Pensioners
Single working age
Couple working age
Single parent, 1
child
Single parent, 2 children
Single parent, 3 children
Couple parents, 1
child
Couple parents, 2 children
Couple parents, 3 children
Couple parents, 4 children
A food and non-alcoholic beverages 35.98 53.25 40.34 69.30 47.05 65.71 85.72 68.79 97.47 105.09 122.09 60.80 70.50A1 food 29.73 47.13 28.60 50.33 41.54 59.08 76.40 63.69 90.74 96.12 113.12 51.04 47.84A2 catering 6.24 6.12 11.74 18.97 5.51 6.63 9.32 5.10 6.73 8.97 8.97 9.75 22.66
B alcohol and tobacco 3.00 7.40 4.38 13.86 3.48 3.48 3.48 6.06 6.06 6.06 6.06 6.74 19.33B1 alcohol 3.00 7.40 4.38 13.86 3.48 3.48 3.48 6.06 6.06 6.06 6.06 6.74 14.94
B1A alcohol at home 2.64 6.53 4.38 9.39 3.04 3.04 3.04 6.06 6.06 6.06 6.06 5.65 6.66B1B alcohol away from home 0.36 0.87 0.00 4.46 0.45 0.45 0.45 0.00 0.00 0.00 0.00 1.08 8.28
B2 tobacco and narcotics 0.00 0.00 0.00 0.00 0.00 0.00 0.00 0.00 0.00 0.00 0.00 0.00 4.39C clothing and footwear 4.91 9.93 7.64 15.36 16.41 24.76 38.79 20.92 29.26 43.30 48.64 15.55 23.12D housing costs 32.13 39.21 31.12 39.35 43.47 45.08 45.67 52.48 33.43 59.15 54.47 40.83 20.67
D2 mortgage interest 0.00 0.00 0.00 0.00 0.00 0.00 0.00 0.00 0.00 0.00 0.00 0.00 0.00D3 water 4.71 5.56 4.71 5.56 7.38 7.76 8.24 7.38 5.45 8.24 8.24 5.70 6.86D5 household insurances 1.61 1.65 1.79 1.65 1.99 2.23 2.14 2.21 2.23 2.47 2.47 1.86 13.69D6 fuel 9.63 10.62 9.00 9.95 16.43 17.67 17.74 17.29 18.49 18.86 19.90 12.45 15.45D7 other housing costs 2.85 3.61 2.29 4.42 2.12 1.87 2.00 4.86 7.26 8.86 3.13 4.02 39.29
E household goods and services 14.69 20.20 19.48 19.66 158.14 215.20 223.31 160.61 217.58 227.86 296.78 78.04 47.65E1 household goods 9.65 11.12 9.50 10.70 16.37 18.01 23.56 15.84 17.39 23.94 27.04 12.81 28.00E2 household services 5.04 9.07 9.99 8.96 141.77 197.19 199.76 144.77 200.19 203.92 269.74 65.23 19.65
E2A communication 5.04 9.07 9.99 8.96 6.72 6.72 9.29 9.73 9.73 13.45 13.45 8.68 10.90E2A1 postage 0.81 0.69 0.35 0.72 0.00 0.00 0.00 0.00 0.00 0.00 0.00 0.43 0.46E2A2 telephone 4.23 8.38 9.64 8.24 6.72 6.72 9.29 9.73 9.73 13.45 13.45 8.25 10.44
E2B childcare 0.00 0.00 0.00 0.00 135.05 190.47 190.47 135.05 190.47 190.47 256.28 55.83 2.08E2C other household services 0.00 0.00 0.00 0.00 0.00 0.00 0.00 0.00 0.00 0.00 0.00 0.72 6.67
F personal goods and services (inc health) 10.72 23.65 8.40 15.43 19.47 20.46 26.92 25.89 27.39 33.71 44.31 18.17 17.34G transport 4.65 4.65 17.03 21.58 17.16 24.97 36.16 26.16 35.02 46.01 47.18 18.87 60.07
G1 motoring expenditure 0.00 0.00 0.00 0.00 0.00 0.00 0.00 0.00 0.00 0.00 0.00 0.00 52.20G2 Fares and other travel costs 4.65 4.65 17.03 21.58 17.16 24.97 36.16 26.16 35.02 46.01 47.18 18.87 7.88
H Social and cultural participation 25.91 43.21 29.73 50.49 40.16 70.01 106.87 60.78 90.08 131.49 141.46 51.92 73.22H1 leisure goods 9.35 12.82 13.68 21.04 10.62 24.55 43.74 12.40 25.23 45.57 51.08 17.56 27.20H2 pets 0.01 0.00 0.00 0.00 0.00 0.00 0.00 0.00 0.00 0.00 0.00 0.00 3.21H3 entertainment and recreation 10.00 20.00 10.49 20.98 19.87 33.75 48.52 36.37 50.25 65.02 69.29 24.65 12.45H4 TV licence and rental 2.70 2.70 2.67 2.70 2.70 2.70 2.70 2.70 2.70 2.70 2.70 2.70 5.58H5 foreign holidays 0.00 0.00 0.00 0.00 0.00 0.00 0.00 0.00 0.00 0.00 0.00 0.00 15.32H6 UK holidays 3.85 7.69 2.88 5.77 6.98 9.00 11.90 9.30 11.90 18.19 18.38 7.01 2.41
Education Fees 0.00 0.00 0.00 0.00 0.00 0.00 0.00 0.00 0.00 0.00 0.00 0.00 7.04
TOTAL (excluding council tax and rent) 118.66 183.72 144.79 227.26 329.80 454.12 551.37 400.96 536.30 631.96 740.25 274.11 331.89
Council tax 13.33 17.77 13.33 17.77 15.55 15.55 15.55 20.73 20.73 20.73 20.73TOTAL (including council tax and excluding rent) 131.98 201.49 158.12 245.03 345.35 469.67 566.92 421.69 557.03 652.69 760.98
Rent 52.30 64.43 52.30 64.43 64.07 69.40 75.25 64.07 69.40 75.25 75.25
TOTAL (including council tax and rent)2 184.28 265.92 210.42 309.46 409.42 539.07 642.17 485.76 626.43 727.94 836.23
1 This is based on mean values from Table A1 of the Expenditure and Food Surveys 2004-5, 2005-6 and 2006-7, adjusted to 2008 prices using the Consumer Price Index. 2 TheSingle Working Age value differs from that quoted in Bradshaw et al (2008) of £210.14. From examination of their underlying figures the discrepency is assumed to be due to a typing error in their report.
Weekly Expenditure (£)
Reduced Consumption
Scenario Mean
Mean UK
(actual) 1

23