Embed Size (px)
Citation preview

1
DEPARTMENT OF ECONOMICS WORKING PAPER SERIES
The Balance of Payments as a Constraint on Turkey’s Growth:
1960-2004
Secil Pacaci Elitok
Al Campbell
Working Paper No: 2008-13
May 2008
University of Utah
Department of Economics
1645 East Central Campus Dr., Rm. 308
Salt Lake City, UT 84112-9300
Tel: (801) 581-7481
Fax: (801) 585-5649
http://www.econ.utah.edu

2
The Balance of Payments as a Constraint on Turkey’s Growth: 1960-2004
Secil Pacaci Elitok Maltepe University, Department of Economics
Al Campbell University of Utah, Department of Economics
Abstract
The aim of this study is to test the existence of balance of a payments constraint on the
long run economic growth of the Turkish economy. The balance of payments constrained
growth (BPCG) model which was developed by Thirlwall (1979) and extended by
Thirlwall and Hussain (1982) is tested over the period of 1960-2004 using OLS. Empirical
findings of this paper support the BPCG model for the whole period under consideration.
For the different sub-periods, there are either different essential economic relations or
behaviors behind the BOP constraint.
Keywords: Balance of payments constraint, Turkey, economic growth, international
trade, elasticity, neo-liberalism
JEL Classification: F14, F15, F41, F43, E12

3
1. Introduction
The relationship between trade, growth and the balance of payments (BOP) has been a
subject of considerable interest and empirical scrutiny in growth and development
economics in recent years. This study takes as its motivation these developments and
addresses the following question: “How did trade liberalization affect the growth and the
BOP of the Turkish economy over the period of 1960-2004?” The period under
consideration is unique in the economic history of Turkey due to the momentous shift
from import-substitution to export-promotion under a neo-liberal reform package in 1980.
The links between the BOP, trade and growth are crucial from both an analytical and
policy standpoint. Moreover, the analysis of the BOP as a major constraining factor on
growth has recently come to be an important research area for growth and development
economics. The BOP is essential in any theory of economic growth or trade since it
represents an important restricting variable.
The issue of what is the most appropriate growth policy under neo-liberalism has
generated considerable controversy. The approach used here for answering this question
pays particular attention to the role of the BOP since it is an important variable
constraining the growth and trade performance of a country.
The basic theory behind this study is based on the BPCG models developed by
Keynesian economists. Especially within the post-Keynesian tradition, external demand is
considered to be the major constraint on the long-run growth performance of open
economies. The first generation BPCG model, known as Thirlwall’s Law, first developed
by Thirlwall (1979), postulates that a country’s growth rate is determined by the ratio of
the income elasticity of demand for its exports to its income elasticity of demand for

4
imports multiplied by the growth in world income. Due to its limitations in explaining the
growth performance of developing countries, the model was extended by Thirlwall and
Hussain (1982), known as second generation BPCG model, to incorporate the impact of
foreign capital flows.
Prior research on this topic has confirmed the empirical adequacy of the first and
second generation BPCG models for the case of developing countries including the
Turkish economy over different time periods using different estimation techniques. Yet
there is no recent research looking at the case of Turkey in depth for the period of 1960-
2004. With this in mind, this study aims to contribute to the literature in three ways.
First, this paper analyzes the Turkish case in depth, which has not been done in the
previous studies. Analyzing Turkey as part of a larger study that examines a group of
developing countries remains insufficient to explain the unique characteristics of the
Turkish economy. This paper also tests the validity of the model for the sub-periods of the
1960-2004 era in order to analyze the impact of trade liberalization on growth in a more
detailed way. Sub-periodization helps analyze the BOP constraint better since there are
either different essential economic relations or behaviors in different sub-periods. Hence,
this study brings a macroeconomic perspective to the analysis of economic growth,
through the examination of the affects on the BOP of trade liberalization, including taking
into account the resulting capital flows.
Second, this study compares and contrasts the patterns of the income elasticity of
import demand in the pre and post liberal era and discusses the reasons behind these
patterns in connection with the neo-liberal economic policies of the latter era.

5
Finally, the policy implications of the model for the growth and trade policies of the
Turkish economy are discussed. Policy suggestions of this study are particularly crucial
since there is an extensive literature on the liberalization and its effects on growth.
This paper is composed of six sections. The introduction section is followed by a
review of the international trade, economic growth and balance of payments literature on
the Turkish economy. Section 3 introduces the economic model. Data sources are
explained in Section 4. Section 5 explains the research methodology and summarizes the
empirical results and Section 6 concludes.
1. Literature Review
2.1. Empirical Literature on Turkey Regarding Trade, Growth and the Balance of
Payments
The Balance of Payments of Turkey has been explored from a number of
dimensions in the empirical literature. In his macroeconomic model of the Turkish
economy for the period 1960-1988, Civcir (1997) tests the monetary approach to the
balance of payments, which states that the changes in the international reserves are
determined by the excess supply of money. Boratav, Turel and Yeldan (1996) developed a
current account model and found that, in the late 1980s and early 1990s, the impact of the
policy component dominated by import liberalization increased the deficit, despite
increasing exports and favorable external conditions. There are also applications of
intertemporal models, including capital movements, to the current account behavior of
Turkey, namely by Selcuk (1997) for the period of 1987-1995 and by Akcay and Ozler
(1998) for 1987-1996. Both of these studies emphasize the gap between actual current
account deficit and the optimal current account deficit for Turkey. Yucel (2003) analyzes
6
the determinants of the Turkish current account balance in the medium and short-run,
focusing especially on the post-1990 period. She shows that Turkey is a foreign credit-
constrained economy with limited access to international financing.
One of the widely analyzed topics in the Turkish economic literature has been
international trade. Ozmen and Furtun (1998), using co-integration techniques, find no
evidence supporting the export-led growth hypothesis from 1970 to 1995. Doganlar and
Fisunoglu (1999), in their study of seven Asian countries including Turkey, find a causal
relationship between exports and economic growth using an error-correction mechanism.
Esen (2000) concludes that contrary to theoretical expectations, the opening of the capital
account induced adverse affects on financial intermediation, savings, investment, growth,
and foreign debt. Bahmani-Oskooee and Domac (1995) investigate the relationship
between economic growth and trade via co-integration and error correction modeling for
1923-90 period. They conclude that there is a long-run relationship between Turkey’s
exports and its domestic production. Their results provide evidence supporting the bi-
directional causality between the two variables. Arslan and Van Wijnbergen (1993)
examine the driving forces behind the Turkish export miracle. They conclude that the
export boom was triggered by macroeconomic policies and trade reform that allowed for a
steady real depreciation of the Turkish Lira. Yeldan (1989) employs a dynamic
computable general equilibrium model and argues that an integrated industrialization
strategy that combines a domestic-demand-based, wage-goods-oriented public investment
program with selective export-promotion scheme promises would be the most appropriate
strategy for serving Turkey’s long-term industrialization interests. Aydin, Ciplak and
Yucel (2004) estimate the export supply and import demand for the Turkish economy

7
using both single equation and vector auto regression frameworks. They conclude that
exports are determined by the unit labor costs, export prices and the national income in a
statistically significant manner. Imports are mostly affected by the real exchange rate and
national income. Their analysis indicates the real exchange rate as a significant
determinant of imports and the trade deficit, but not of exports. Utkulu and Ozdemir
(2003) examine the effect of trade liberalization on long-run income per capita and
economic growth through endogenous growth theory. They employ a multivariate co-
integration analysis and conclude that their causality evidence between the long-run
economic growth and a number of indicators of trade liberalization confirms the
anticipations of the new growth theory. Tunc and Akbostanci (2002) employ the twin
deficit hypothesis and the Ricardian equivalence hypothesis for Turkey for the period
between 1987-2001 via a co-integration methodology and by estimating an error
correction model. They show that there is a long-run relationship between internal and
external deficits. Their short-run model yields that a worsening of the budget balance
worsens the trade balance. Therefore they conclude that the twin deficit hypothesis holds
and the Ricardian equivalence hypothesis is not valid for Turkey during the period studied.
Finally, there is also a substantial literature on economic growth and its
determinants. The most significant ones can be summarized as follows: Yeldan and
Boratav (2001) argue that sources of growth in the Turkish manufacturing industry in the
1980s are wage reduction, price supports, and the utilization of idle capacity inherited
from the pre-crisis period. According to this study, the basic failure of export-led growth
was that it depended on the suppression of wages and it could not create sustainable
capital accumulation. Although the labor productivity increased after 1980, its effect on

8
wages did not occur until 1990. Boratav and Turel (1993) find a wage-cycle which is
unrelated to productivity, employment, or investment, and show that export-led growth is
attributable to the increases in the capacity utilization rates, rather than investments.
Yenturk (1997) argues that developing countries have a stagnationist structure in which
wage reduction causes unemployment. In order to have a permanent increase in the
employment level, one needs a growth trend that is based on investment and productivity.
She argues that Turkey, to the contrary, had a growth pattern that was dependent on
capacity utilization.
2.2. Available applications of Thirlwall’s Law to the Turkish Economy1
The most relevant part of the literature for the scope of this study concerns the
available applications of Thirlwall’s Law to the Turkish economy. Hussain and Thirlwall
(1982) proved the validity of the first and second generation BPCG models for the case of
twenty developing countries including Turkey over the period of 1960-73. Bariam (1988)
applied the first generation BPCG model for nineteen European and North American
countries including Turkey over the period of 1970-85. Based on the annual time series
data and two-stage Least Square technique, regression results of this study supported
Thirlwall’s Law. In a later study, Bairam (1990) employed Thirlwall’s Law for 15 oil
exporting and other developing countries for various dates between 1961 and 1985. In nine
of the 15 countries, the model’s predictive power was satisfactory, while he obtained
adverse results in the case of oil exporting countries. The results of testing the model for
Turkey over the period of 1973-83 by Bairam (1990) supported its validity. Bairam and
Dempster (1991) applied the model to eleven Asian countries including Turkey over the
period of 1963-73, and their test results further supported Thirlwall’s hypothesis. Perraton
1 See Appendix II for a summary the related past research on Turkey.

9
(2003) utilized the first version of Thirlwall’s Law over the period of 1973-1995 for a
large sample of developing countries including Turkey, and obtained support for it.
2. The Model
Mainstream growth theory describes the growth rate differences across countries
through the differences in the growth of factor supplies and productivity. Orthodox
growth theory uses production functions as tools in explaining growth from a supply-
based perspective. Keynesian models take a more demand-oriented view, in which the
growth rate differences are explained by the differences in the growth of demand because
demand is a constraint on growth. According to the BPCG model, which is also known as
Thirlwall’s Law, the main constraint on the demand is the balance of payments. The
major premise of this model is that no country can grow faster than a rate which is
coherent with the balance of payments equilibrium on the current account unless it can
finance ever-growing deficits. It is hypothesized that a country’s growth rate is equal to
the ratio of the income elasticity of demand for its exports to its income elasticity of
demand for imports multiplied by world income growth.
3.1. First Generation BPCG Model2
The BPCG growth model was originally developed by Thirlwall (1979).
Thirlwall’s Law imposes the balanced trade as a necessary long-run constraint on growth.
The balance of payments equilibrium is
MEPXP fd = (1)
2 See McCombie and Thirlwall (1994) for the detailed derivation of the model, its assumptions,
implications, testing and applications.

10
where the variables X, Pd , M , Pf and E are the quantity of exports, the price of exports
in the home currency, the quantity of imports the price of imports in foreign currency;
and the exchange rate, namely the home price of foreign currency, respectively.
The condition for balance of payments equilibrium is then
empxp fd ++=+ (2)
where lower-case letters show rates of change in variables. This condition states that the
rate of growth of the value of exports equals the rate of growth of the value of imports.
The import function is
π
ψ
YP
EPaM
d
f
= (3)
where a, ψ, Y and π are a constant, the price elasticity of the demand for imports, the
domestic income and the income elasticity of the demand for imports, respectively.
The rate of growth of imports is then
ypepm df πψ +−+= )( (4)
where again lower-case letters stand for continuous changes of the variables. In other
words, import growth depends on:
• How fast import prices are changing relative to domestic substitutes, taking into
account variations in the exchange rate, multiplied by the price elasticity of the
demand for imports
• How fast domestic income is changing together with the income elasticity of the
demand for imports. 3
The export function is
3 McCombie and Thirlwall (1994), p.234-236.

11
ε
η
ZEP
PbX
f
d
= (5)
where b, ε, Z and η are a constant, the income elasticity of the demand for exports, the
world income and the price elasticity of demand for exports, respectively.
The rate of growth of exports is then
zeppx fd εη +−−= )( (6)
In other words, export growth depends on:
• How fast domestic prices are changing relative to foreign prices, taking into
account variations in the exchange rate, multiplied by the price elasticity of the
demand for exports
• How fast world income is changing, together with the value of the income
elasticity of the demand for exports.4
Now if we substitute the rate of growth of imports (4) and the rate of growth of exports
(6) into the balance of payments equilibrium condition (2), we get the balance of
payments equilibrium growth rate
π
εψη zeppy
fd +−−++=
))(1(1 (7)
3.1.1. A first assumption of the model5
• ψ < 0, π>0, η<0, ε>0
These are all simply assumptions of normal price and income responses.
3.1.2 Economic propositions6
4 Ibid.
5 See Alonso and Garcimartin (1998-99) for the significance of distinction between price adjustment and
income adjustment. See Blecker (1998) and Pugno (1998) for the criticisms of price assumptions
underlying the model.

12
Under the standard assumptions on elasticities just made, one has that according to this
model a country’s growth rate depends on the following factors:
• Prices: If 1fψη + , then inflation in the home country will lower the y1.
• Currency depreciation: If 1fψη + , then continuous depreciation of currency (
e>o) will improve y1.
• World income: The faster the growth of world income (z) the great the GDP
growth y1 through a greater demand for the country’s goods. The sensitivity of the
rate of growth of the given country to the growth of the world income depends on
the ε. This income elasticity of the demand for exports depends on the tastes of
foreign consumers, the characteristics of the goods, and a whole host of non-price
factors that determine the demand for goods in international trade.
• The country’s appetite for imports: As the income elasticity of demand for
imports (π) increases, y1 decreases.
• Terms of trade effect: The pure terms of trade effect in the above is the “1” from
the first term times the change in the terms of trade (pd- pf-e). Hence an
improvement in the real terms of trade, (pd- pf-e) >0, will give a positive
contribution from the pure terms of trade effect to a country’s growth rate,
consistent with a balance of payments equilibrium.
• Price elasticities effects. The change cased by a change in the relative prices not
only acts though the “1” discussed in the last point, the pure terms of trade effect,
but also through the price elasticities η and ψ (both normally negative, recall).
Under the assumption made in this section on the size of these
6 See Thirlwall 2003b p.575.

13
elasticities 1fψη + , they overwhelm the pure trade effect and then the net effect
of a relative price change (pd- pf-e) >0 will be to lower the rate of growth of
national income. On the other hand if the price elasticities were smaller than that
(or in the abnormal case of their being positive), then the improvement in the
terms of trade (pd- pf-e) >0 would still improve the rate of growth of national
income.
3.1.3. An additional assumption
If one further assumes
• pd=pf + e, relative prices measured in a common currency do not change over the
long-run
then the balance of payments equilibrium growth rate transform into7:
π
εzy =1 (8)
If we look back at equation (6), we see this same last assumption gives εz=x. This turns
out to be very useful in practice, since one ahs good data for x but poor data for z. Using
this relation, the balance of payments equilibrium growth rate becomes:
π
xy =1 (8.1)
3.2. Second Generation BPCG model
It was recognized that the Thirlwall’s Law performs moderately differently in the
case of developing countries than it does in the developed ones. This difference required
a modification of the model so as to explain the unique characteristics and experiences of
developing countries. Hence, Thirlwall and Hussain (1982) developed a model
7 See Ocampo and Parra (2003) for a detailed survey of discussions on terms of trade trends.

14
incorporating capital flows through which developing countries often financed their ever-
growing current account deficits.
Thirlwall and Hussain’s (1982) model is as follows. The balance of payments in
its initial current account disequilibrium is
MEPFXP fd =+ (9)
where Pd is the domestic price of exports, X is the volume of exports, M is the volume of
imports, Pf is the foreign price of imports, E is the exchange rate and F is the value of
nominal capital flows measured in domestic currency. F>0 indicates capital inflows and
F<0 indicates capital outflows. In the rate of change form this becomes
( ) ( ) empfxp fd ++=−++ θθ 1 (10)
where again the lower-case letters represent rates of growth of the variables and θ equals
the share of exports and (1-θ) shows the share of capital flows, both as a proportion of
total receipts. Hence θ= Pd X/R where R is the total overseas receipts, R= Pd X +F, and
(1-θ)= F/R.
If we substitute the rate of growth form of the import (4) and export functions (6) into the
rate of change form of the current account disequilibrium (10), we get the balance of
payments constrained growth rate in this case (calling it now y2):
( )( ) ( ) ( )( )
π
θθεψθη dfdfd pfzpeppepy
−−++−−+−−+=
12 (11)
Under the assumption we made above of constant relative prices, pd = pf + e, equation
(11) reduces to:
( )( )π
θθε dpfzy
−−+=
12 (12)

15
As before, this same assumption reduces equation (6) εz=x, and so we can re-write (12)
as:
( )( )π
θθ dpfxy
−−+=
12 (13)
3. Data
This study uses three main data sources: the national accounts of the OECD
(Organization for Economic Cooperation and Development) countries, Volume II,
Detailed tables published by the OECD; the balance of payments statistics prepared by
the CBRT (Central Bank of the Republic of Turkey) and Statistical Indicators (1923-
2004) published by the TSI (Turkish Statistical Institute). All statistics are in time series
format, in million Turkish Liras (TL), and cover the 1960-2004 period. The total number
of observations is 45.
Two main limitations of the data set are the following. The balance of payments
statistics for the pre-1975 period were taken from the TSI. However, several changes
were introduced to the definition of the sub items of the BOP in the post-1975 era. Some
items either totally disappeared (i.e. NATO infrastructure and off-shore) or were moved
under different sections of the BOP (i.e. Special drawing rights). The post-1975 era BOP
statistics were taken from the CBRT. The shift in the data in 1975 limited the analysis of
sub-items of BOP. Second, since the data is annual, the number of observations is small.
The ideal data set would be a quarterly one.8
8 See Appendix I for the data source of each variable used in the study.
16
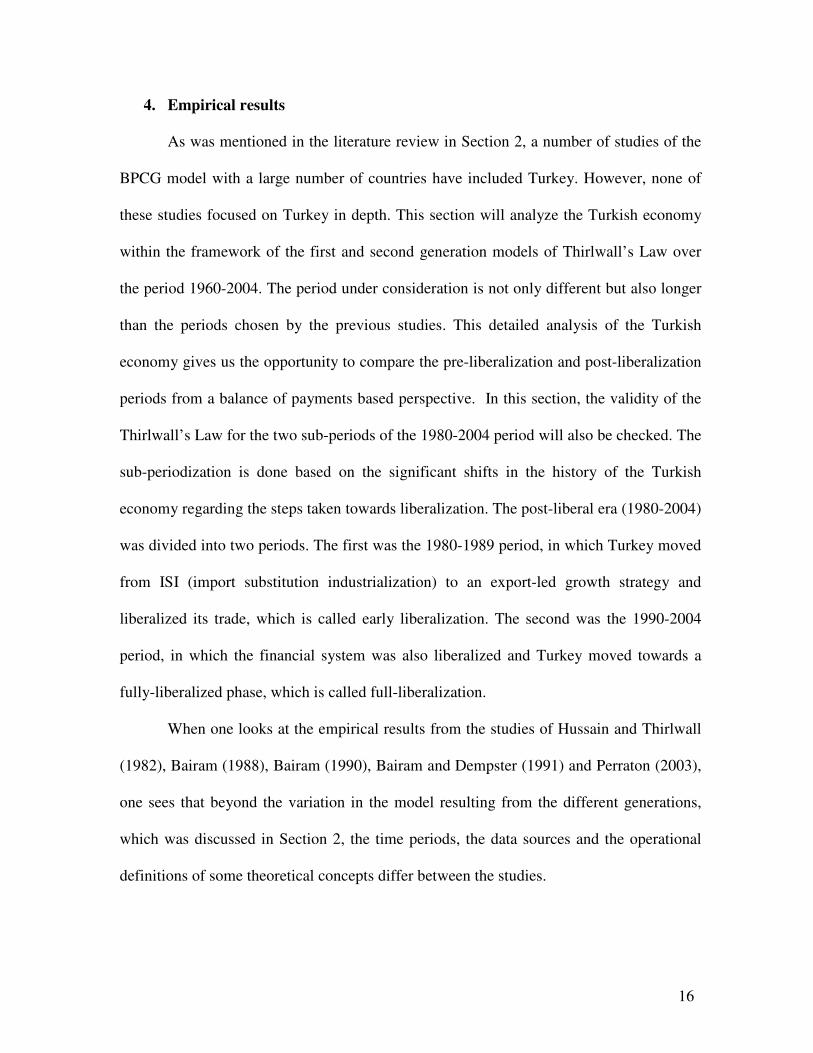
4. Empirical results
As was mentioned in the literature review in Section 2, a number of studies of the
BPCG model with a large number of countries have included Turkey. However, none of
these studies focused on Turkey in depth. This section will analyze the Turkish economy
within the framework of the first and second generation models of Thirlwall’s Law over
the period 1960-2004. The period under consideration is not only different but also longer
than the periods chosen by the previous studies. This detailed analysis of the Turkish
economy gives us the opportunity to compare the pre-liberalization and post-liberalization
periods from a balance of payments based perspective. In this section, the validity of the
Thirlwall’s Law for the two sub-periods of the 1980-2004 period will also be checked. The
sub-periodization is done based on the significant shifts in the history of the Turkish
economy regarding the steps taken towards liberalization. The post-liberal era (1980-2004)
was divided into two periods. The first was the 1980-1989 period, in which Turkey moved
from ISI (import substitution industrialization) to an export-led growth strategy and
liberalized its trade, which is called early liberalization. The second was the 1990-2004
period, in which the financial system was also liberalized and Turkey moved towards a
fully-liberalized phase, which is called full-liberalization.
When one looks at the empirical results from the studies of Hussain and Thirlwall
(1982), Bairam (1988), Bairam (1990), Bairam and Dempster (1991) and Perraton (2003),
one sees that beyond the variation in the model resulting from the different generations,
which was discussed in Section 2, the time periods, the data sources and the operational
definitions of some theoretical concepts differ between the studies.

17
The first step in testing the validity of Thirlwall’s Law is to estimate the income
elasticity of import demand. The import demand function that I will estimate is (3) above,
which I will rewrite here for convenience:
π
ψ
YP
EPaM
d
f
= (3)
where as before M and Y are the real values of imports and income respectively, Pd is a
doestic price index, Pf is the foreign price of imports and E is the exchange rate.9 I will use
the import demand function in its logarithmic form as Thirlwall and Hussain (1982) did in
their study. My estimation results will be fully based on the OECD data for the estimation
of the first generation BPCG model. Such data series very often exhibit serial correlation.
In line with the work of Bairam (1990) and Bairam and Demspter (1991) on the first
generation models, I will consider the effects of serial correlation in the series and do the
correction via the Cochrane-Orcutt procedure.
In the second step, based on the estimated income elasticity of imports, I will
calculate balance of payments constrained growth rates for both the first and the second
generation models of Thirlwall’s Law. In regards to the econometric techniques used,
several different ways have appeared in the literature to test the validity of the model.
5.1. Application of First Generation Balance of Payments Constrained Growth
Model
In Section 3, the first and second generation BPCG models were introduced and
the derivations of formulas were explained. For purposes of estimation, as just indicated I
will rewrite equation (3) in log form as
9 See Perraton (2003) for a disscussion on the drawbacks of using this standard form of import demand
function especially for developing countries.

18
)log(loglogd
f
P
EPYcM ψπ ++= (3.1)
where M is real imports, Y is national income and EPf/Pd is the ratio of domestic prices to
foreign prices in domestic currency. The income elasticity of imports is shown by π and
the price elasticity of imports is shown by ψ.
Import demand function for Turkey is estimated for the whole period and its sub-
periods. The estimation of equation 3.1 for Turkey using OLS and the OECD data shows
that the disturbance terms in the estimated equation are serially correlated. Due to the
existence of serial correlation, the data was corrected using the Cochrane-Orcutt
procedure. As can be seen from the tables below, following the correction procedure the
null-hypothesis - no serial correlation - is accepted at the 0.99 confidence level, for all sub-
periods. This can be seen by comparing the critical values for the Durbin – Watson test
presented in Table 2 with the Durbin - Watson statistics shown in Table 1. In Table 3 the t-
statistic and its p-value for π are shown.
Table 1 Empirical Estimates, First Generation BPCG Model
Periods Years Actual y Actual x Π y1 DW R2
Whole period 1960-2004 0.044 0.089 2.074 0.043 1.635 0.987
Pre-liberalization 1960-1979 0.051 0.054 1.304 0.042 1.475 0.917
Early liberalization 1980-1989 0.039 0.140 1.062 0.132 2.113 0.915
Full-liberalization 1990-2004 0.039 0.093 2.746 0.034 2.021 0.990
Table 2 Durbin-Watson Statistics
Durbin -Watson d-statistics at 0.99 confidence level
obs no k dL dU
45 2 1.245 1.423
20 2 0.863 1.271
15 2 0.7 1.252
10 2 0.466 1.333

19
Table 3 t-statistic and probability of t-statistic for π
With π now estimated free from serial correlation distortions, I get:
0
0.5
1
1.5
2
2.5
3
1960
-200
4
1960
-197
9
1980
-198
9
1990
-200
4
Income Elasticity of Imports
Figure1 Income elasticity of import demand, π
Figure 1 reflects two results that one would expect a priori from general economic
reasoning. First, one sees the period of full liberalization alone (1990 – 2004) has a higher
elasticity for imports than the value averaged over all the periods (1960 – 2004). This
increasing pattern is what one would expect shifting from the planned import substitution
industrialization (ISI) policies to the export-led growth accompanied by liberalization
policies subsequent to 1980. Second, one sees that in the liberal era, income elasticity of
For π
Years t-statistic p-value of t-statistic
1960-2004 14.258 0.00
1960-1979 2.876 0.01
1980-1989 3.177 0.02
1990-2004 25.509 0.00

20
import demand grows as one moves from the early liberalization period (1980-1989) to the
full liberalization period (1990-2004). This trend can be explained by the restrictions on
the actual trade, particularly on the imports, until the early 1990s. Even though the Turkish
economy took significant steps toward liberalization with the decisions of January 24,
1980, the full-implementation of the program took longer. Hence, the actual impact of
imports was not observed in the Turkish economy until the early 1990s. The one result that
is not what one might expect a priori is that the elasticity under the period of partial
liberalization is lower than it was in the pre-liberalization period. A possible explanation
for is that the change in 1980 was precipitated by a balance of payments crisis, and so
although they liberalized a number of things (particularly those that they thought would
promote exports), they retained barriers to imports as well as the more discussed capital
restrictions.
Based on these estimations of π, as discussed in section 3, predicted growth rates
(also called the balance of payments constrained growth rate) are calculated based on the
average growth rate of exports (x), divided by the income elasticity of imports (π).
π/1 xy = (8)
As it is presented in the Table 1, the actual growth rates (y) and the predicted
growth rates under the first generation BPCG model (y1) are close, and for the whole
period almost identical. The only exception is the 1980-1989 sub-period. One possible
explanation for this difference could be the influx of capital flows. Since the extended
version of Thirlwall’s Law includes capital flows as a factor relaxing the balance of
payments constraint, if the influx of capital flows is indeed the cause for the poor
performance of the first generation model for this period, it could be expected that the

21
second generation model would do better in this period, which will be analyzed in the
following section.
5.2. Application of Second Generation Balance of Payments Constrained Growth
Model
The empirical results in this section are based on the results of the estimation of the
income elasticities that I already obtained in the previous section. In addition to that, I will
measure the impact of capital flows. There is no agreed upon definition for the net capital
flows in the literature. Some studies use only the capital account as the capital flows. A
broader more common definition is Net Capital Flows= Capital Account + Change in
Foreign Reserves. But for the purposes of our study, “capital flows” is seen as a factor
relaxing the X=M identity. Of course the current account deficit in terms of goods and
services must be balanced out with the remaining items from the balance of payments
account. That is, because “Net Capital Flows” for our purposes is whatever relaxes the
X=M trade constraint, we add to the usual definition of Net Capital Flows the Errors and
Omissions term, and all the other terms in the Current Account besides the trade balance.
Hence, the net capital flows can be defined as follows:
-(X-M) goods and services= Net Capital Flows= Current Transfers+ Capital Account+ Change
in Reserves+ Net Error and Omissions+ (X-M) income
. As discussed in section 3, (f) is the growth rate of the “net capital flows,” and here
like all the other growth variables (f) would become the average over the period under
consideration. It is obvious that Turkey experienced significant capital flows under the
liberalization regime. However, these relatively larger flows were very unstable or erratic
for the case of Turkey in the sense that the net capital flows shifted between deficit and

22
surplus throughout the whole period. This type of data can, and in fact for my data did,
cause a data problem for the type of growth formula which is used here, discussed before.
As can be recalled, for the denominator I averaged the beginning and ending values. With
this sort of large values that switch sign can lead to a denominator very close to zero,
causing such points to become very large and distort the data.
In order to deal with this calculation problem for this model, I altered the
calculation of the growth rate of each variable as follows.10
In this alternative calculation,
instead of using the average of the beginning and ending year as the denominator
(allowing the problem of a very small value when the two had opposite signs and were
roughly of the same magnitude) I used the starting year. Of course, if one has starting
years in the data with extremely small capital flows, one will still encounter the same
problem. That was not the case for the Turkish data – the period was characterized by
significant flows every year, even though sometimes they were surpluses and sometimes
they were deficits.
It can also be noticed from the formula below that the price variable on the right
hand side of the equation dropped because its amount was small enough to neglect. Hence,
formula (13) turned into:
10
Note that this does not change anything conceptually.
23
( ) ( )
( ) ( )
( ) ( )[ ] ( )(13.1)
/(
)(
)(
11112
1
1112
1
1
1
1
1
1
1
1
2
1
1
1
1
1
1
1
1
1
1
1
112
1
1
1
1
1
1
1
1
1
112
2
1
π
π
π
π
π
π
−−−−
−
−−−
−
−
−
−
−
−
−
−
−
−
−
−
−
−
−
−
−
−
−
−−
−
−
−
−
−
−
−
−
−
−−
−+−=
−+−=×
−×−
−+
−=×
−×−
−×+
−×=×
−−
−+
−=×
−+=×
−
ttttttd
t
tttttd
t
tt
t
t
t
tt
t
ttd
t
tt
t
t
t
tt
t
t
t
tt
t
ttd
t
tt
t
tt
t
t
t
tt
t
ttd
dttd
RFFXXPy
R
FFXXPy
P
PP
R
F
R
FF
R
XXPy
P
PP
R
F
F
FF
R
F
X
XX
R
XPy
P
PP
F
FF
R
F
X
XX
R
XPy
pfR
Fx
R
XPy
t
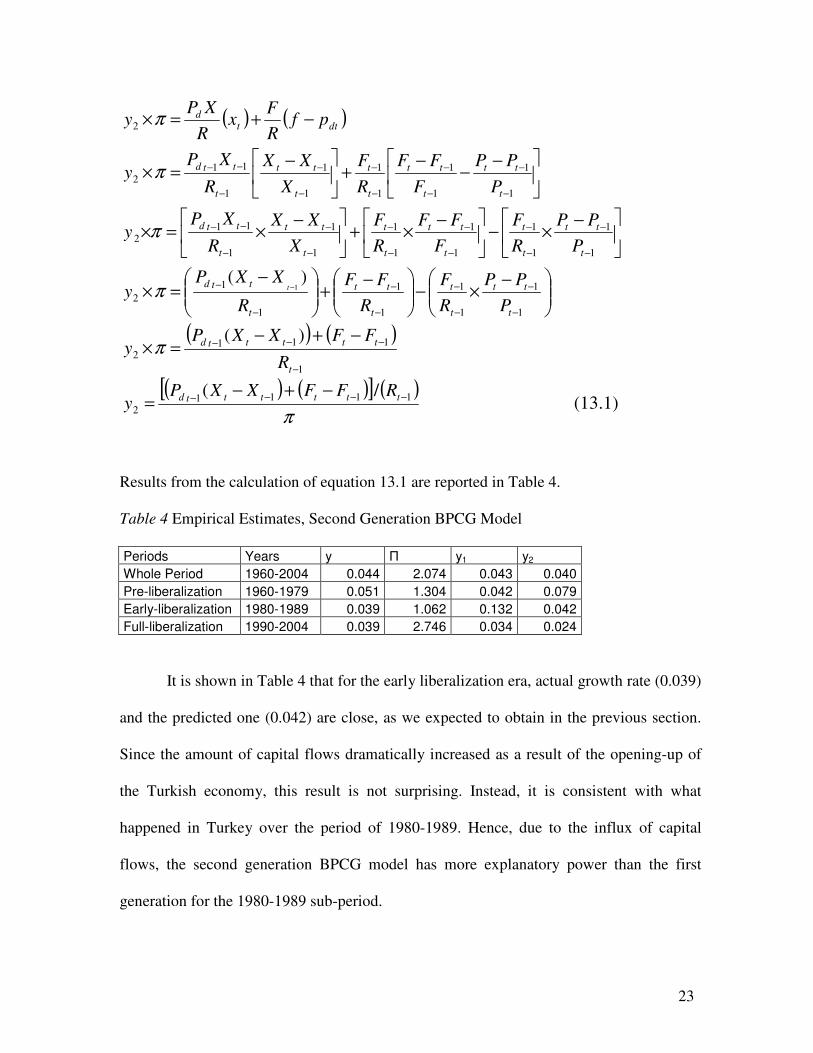
Results from the calculation of equation 13.1 are reported in Table 4.
Table 4 Empirical Estimates, Second Generation BPCG Model
Periods Years y Π y1 y2
Whole Period 1960-2004 0.044 2.074 0.043 0.040
Pre-liberalization 1960-1979 0.051 1.304 0.042 0.079
Early-liberalization 1980-1989 0.039 1.062 0.132 0.042
Full-liberalization 1990-2004 0.039 2.746 0.034 0.024
It is shown in Table 4 that for the early liberalization era, actual growth rate (0.039)
and the predicted one (0.042) are close, as we expected to obtain in the previous section.
Since the amount of capital flows dramatically increased as a result of the opening-up of
the Turkish economy, this result is not surprising. Instead, it is consistent with what
happened in Turkey over the period of 1980-1989. Hence, due to the influx of capital
flows, the second generation BPCG model has more explanatory power than the first
generation for the 1980-1989 sub-period.

24
While the second generation model made a huge improvement in predicting the
early liberalization period, in which the first generation model did very poorly, it did
significantly worse in all other periods. For the late liberalization period, when one would
a priori expect even greater capital flows than the early period, it went from under
predicting by 13% to under predicting by 38%. While that result is still in line with the
quality of many of the prediction results for this type of model in the literature, and much
better than the problematic first generation prediction for the early liberalization period,
this counterintuitive worsening requires further explanation. Similarly, the pre-
liberalization period, notwithstanding the fact that one would expect capital flows to be
less important there, likewise needs further explanation for its similar percentage
worsening prediction. A possible economic explanation has to do with the fact that one of
the most important characteristics of the Turkish economy throughout the 1990s was
“unsustainable external debt”. It is widely accepted in the literature that the significant
amount of capital flows into the Turkish economy created debt, starting from the mid-
1980s.11
Due to the lack of a debt variable in the theoretical model applied here, it is not
possible to see the direct influence of this debt on the balance of payments constraint,
which literally became a debt-constraint for the Turkish economy in the last fifteen years.
5. Conclusion
In this paper, the long-run economic growth of the Turkish economy is analyzed
from the balance of payments perspective. First, I analyzed the estimated income
elasticities of import demand for the Turkish economy. Second, I applied first and second
generation BPCG models using OLS.
11
See Yenturk (2003) for a detailed analysis of this argument.

25
The results show that Thirlwall’s Law is valid for the case of the Turkish economy
over the period of 1960-2004. I analyzed two models based on Thirlwall’s Law and their
comparative validity for the sub-periods of 1960-2004 period. I conclude that the
economic growth was constrained by the balance of payments in Turkey throughout the
whole period under consideration. However, for the sub-periods one model or the other
did better depending on crucial economic aspects of the given sub-period.
In this framework, I found out that the first generation BPCG model explains the
pre-liberal period with its lack of major capital flows better than the second generation
model. Similarly, the growth rate of the early liberal era, with its significant capital flows,
is predicted better by the second generation model. Finally, both the first and the second
generation BPCG models have strong validity for the full period.
The failure of the second generation model to improve on the first generation
model in the period of full liberalization could be related to the issue of debt accumulation.
A summary of my empirical results and my main argument can be seen in Figure 2,
in which the trends of the actual and predicted growth rates are presented.
Figure 2 is constructed by using a single π estimate, which is 2.074 for the
complete period, and the growth rates associated with that. First, the actual growth rate is
calculated for each year. Second, the actual export growth rate is divided by the income
elasticity of imports (2.074) in order to get the first generation balance of payments
constrained growth rate for each year. Third, the numerator of equation 13.1 is calculated
for each year and then divided by the income elasticity of imports (2.074) so as to
calculate the second generation BPCG rate.

26
Figure 2 shows that with some slight exceptions in specific years, the actual and
predicted growth rates follow more or less the same pattern. The closeness of the actual
and the predicted growth rates also shows the relationship between international trade,
economic growth and balance of payments. This relationship is the main research question
of this study.
y,y1 and y2
-0.3
-0.2
-0.1
0
0.1
0.2
0.3
0.4
0.5
0.6
1960
1962
1964
1966
1968
1970
1972
1974
1976
1978
1980
1982
1984
1986
1988
1990
1992
1994
1996
1998
2000
2002
%
Actual growth rate First Generation BPCG rate Second generation BPCG rate
Figure 2 Comparison of actual growth rates with y1 and y2, 1960-2004
Looking again at the actual growth rate in the economy in Figure 2, it appears as if
the post 1980 liberalization might have slightly slowed the economic growth. But there
was in fact no dramatic change; and certainly nor the increased growth promised by
supporters of liberalization. The empirical results in this section indicate the importance of
one constraint, namely, the balance of payments constraint, as a contributor to the failed

27
promises of increased growth.12
The export-led growth strategy of the 1980s reflected itself
as a trade deficit in which imports exceeded exports. There is no doubt that in itself export
growth functions as an engine of overall economic growth through expanding the national
income level. However, the constraint occurs at the point when high income elasticities of
demand for imports then transform this into a persistent foreign trade deficit. The post
1980 Turkish liberalization programs led to such a problem.
The policy implication of the model is that an economic policy that reduces income
elasticity of demand for imports would relax the BCPG constraint on growth, thus
allowing Turkey to achieve more rapid growth. One approach to implement this in Turkey
would be to encourage the consumption of more locally produced goods in response to
increased income. Coupled with continued export promotion, this would relax the BPCG
constraint and increase economic growth. This type of export-based growth can only be
done with the help of economic planning. However it is incompatible with the liberal
policies that have been pursued for twenty-five years.
12
This study does not claim that other constraints might not also be important, nor does it attempt to
measure the relative importance of other constraints. This paper focuses on only one constraint, i,e, balance
of payment constraint.

28
References:
Aricanli,Tosun and Dani Rodrik. 1990. The Political Economy of Turkey: Debt,
Adjustment and Sustainability. New York,NY: St. Martin’s Press,Inc.,USA.
Akbostanci, Elif and Tunc, G. I. 2002. Turkish Twin Deficits: An Error Correction Model
of Trade Balance. ERC Working papers in Economics oi/06 May.
Akcay, C. and Ozler, Sule. 1998. Current Account Position of the Turkish economy: Is
there any cause for concern?.Bogazici Journal, Review of Social, Economic and
Administrative Studies. 12(1).39-53.
Alonso, Jose A. and Carlos Garcimartin. 1998-99. A new Approach to Balance-of-
Payments Constraint: Some Empirical Evidence. Journal of Post Keynesian
Economics 21, no.2: 259-82.
Arslan, I.and Van Winjbergen, S.1993.Export Incentives, Exchange Rate Policy and
Export Growth in Turkey. Review of Economics and Statistics, .75, n1, February:
128-33.
Aydin, F. M., Ciplak, U. and Yucel, M.E. 2004. Export Supply and Import Demand
Models for the Turkish Economy. The Central Bank of the Republic of Turkey,
Research Department Working Paper, No: 04/09
Bahmani-Oskooee,M and Domaç,İlker.1995. Export Growth and Economic Growth in
Turkey: Evidence from Cointegration Analysis. METU Studies in Development,
v 22, no.1: 67-77.
Bairam, Erkin.I.1990. The Harrod Foreign Multiplier Revisited. Applied Economics 22:
711-718.
____________.1988.Balance of Payments, the Harrod foreign trade multiplier and
economic growth: The European and North American Experience, 1970-85.
Applied Economics 20: 1635-42.
_____________.1987. The Verdoorn Law, Returns to Scale and Industrial Growth: A
Review of Literature. Australian Economic Papers 26, no.48: 20-42.
____________, and Georgina J. Dempster.1991. The Harrod foreign trade multiplier and
economic growth in Asian countries. Applied Economics 23: 1719-1724.
Balance of Payments Statistics. Central Bank of Turkish Rebuplic.
www.tcmb.gov.tr
Baysan, Tercan, and Charles Blitzer. 1990. “Turkey’s Trade liberalization in the 1980s.”

29
In The Political Economy of Turkey: Debt, Adjustment and Sustainability, ed.
Tosun Arıcanli and Dani Rodrik, New York, NY: St. Martin’s Press, Inc.
Berksoy, Taner. 1994. Dis Ticarette Liberallesme ve Ithalat Egilimleri. Istanbul Ticaret
Odasi.Yayin No. 27.
Boratav, Korkut and Erinc Yeldan. 2001. Turkey, 1980-2000: Financial Liberalization,
Macroeconomic (In) Stability and Pattern of Distribution,
http://www.bilkent.edu.tr/~yeldane/B&YCEPA2002.PDF
__________,and Oktar Turel. 1993. “Turkey.” In the Rocky Road to Reform:
Adjustment, Income, Distribution, and Growth in the Developing World, ed.
Lance Taylor, 214-224. London: The MIT Press
____________, ________and Erinc Yeldan.1996. The Macroeconomic Adjustment in
Turkey, 1981-1992: A Decomposition Exercise. Yapi Kredi Economic Review.
7(1).3- 19.Boratav, Korkut.1988. Turkiye İktisat Tarihi: 1908-1985. Istanbul:
Gercek Yayinevi.
___________, Ahmet Hasim Köse and ErincYeldan. 2000. “Globalization, Distribution
and Social Policy: Turkey: 1980-98.”CEPA & New School for Social Research,
Working Paper Series No. 20.
Civcir, Irfan.1997.A Revised Monetary Model of Certain Macro Variables in Turkey:
1960-88. Yapi Kredi Economic Review, 8(1).3-31.
Cochrane D. and G.H. Orcutt, 1949. “Application of Least Squares Regressions
Relationships Containing Autocorrelated Error Terms”, Journal of the American
Statistical Association, v.44 (245): 32-61.
Cokdeger,Ozan. 1991. Effects of Industrialization and Export Promotion Policies on the
ExportPerformance of the Turkish Manufacturing Industry. Unpublished PhD
Thesis. Bogazici University, Istanbul, Turkey.
Doganlar, M. and Fisunoglu, M. 1999. Causality between Exports and Economic
Growth in Asian Countries. Yapi Kredi Economic Review. 10 (1).3-11.
Ercan , Fuat. 2002. “The Contradictory and Contunity of the Turkish Capital
Accumulation Process: A Critical Perspective on the Internationalization of the
Turkish Economy.” In The Ravages of Neo-Liberalism, ed. Nesecan Balkan and
Sungur Savran, 21-39. New York: Nova Science Publishers, Inc.
Esen, Oguz. 2000. Financial Openness in Turkey.International Review of Applied
Economics, 14, no.1 :5-23.

30
Hussain, Nureldin.1999.M. The Balance-of-Payments Constraint and Growth rate
Differences among African and East Asian Economies. African Development
Review.June.
Ismihan, Mustafa, Metin-Ozcan Kivilcim and Aysit Tansel. 2003. “Macroeconomic
Instability, Capital Accumulation and Growth: The Case of Turkey: 1963-99.”
Applied Economics, Volume 37, Issue 2, 2005, Pages 239-251.
Kazgan, Gulten. 1988. Ekonomide Disa Acik Buyume.Istanbul: Altin Kitaplar.
_____________. 2002. Tanzimattan 21. Yuzyılda Turkiye Ekonomisi. Istanbul: Istanbul
Bilgi Universitesi Yayinlari.
Kose, Ahmet Hasim and Ahmet Oncu. 2004. Observations on the Structure of the Turkish
Foreign Trade. mimeo
McCombie, John S.L. 1985. Economic Growth, the Harrod Foreign Trade Multiplier and
the Hicks Super Multiplier. Applied Economics 17, no: 1: 55-72.
__________________.1997. On the Empirics of Balance-of-Payments-Constrained
Growth. Journal of Post Keynesian Economics 19, no .3: 345-375
____________.1991. Cyclical Variation in the Capital Utilization Rate: A Response to
Garrison. Journal of Post Keynesian Economics 13, no.3; 447-454.
_____________, and Anthony P. Thirlwall. 1994. Economic Growth and Balance of
Payments Constraint. New York: St. Martin’s.
_____________, and __________.1997. Economic Growth and the Balance of
Payments Constraint Revisited, in P. Arestis, G. Plama and M. Sawyer (eds.)
Markets, Unemployment and Economic Policy: Essays in Honour of Geoffrey
Harcourt. Vol.2. London: Routledge, 498-511.
_____________ , and __________ 1997.The Dynamic Foreign Trade Multiplier and the
Demand-Oriented Approach to Economic Growth: An Evaluation. International
Review of Applied Economics 11, Issue 1. January
Metin-Ozcan, Kivilcim, Ebru Voyvoda ve Erinc Yeldan. 2000. “Dynamics of
Macroeconomic Adjustment in A Globalized Developing Economy: Growth,
Accumulation and Distribution, Turkey 1969-1998.” Bilkent University Working
Papers, Ankara
National accounts of OECD countries. Comptes nationaux des pays del'OCDE. Volume
II, Tableaux de´taille´s. Volume II, Detailed tables (1992-2003). OECD Publishing.2005

31
National accounts of OECD countries. Comptes nationaux des pays del'OCDE. Volume
II, Tableaux de´taille´s. Volume II, Detailed tables. (1960-1997). OECD Publishing.1998.
Ocampo, J. Antonio & Maria A. Parra. 2003. Half a Century of Terms of Trade
Controversies. http://www.econ.utah.edu/~vernengo/originals/ocampo-parra.pdf
Odekon, Mehmet. 1988. “Liberalization and The Turkish Economy: A Comparative
Analysis.”In Liberalization and the Turkish Economy, ed. Tevfik F. Nas and
Mehmet Odekon, 9-29, London: Greenwood Press
Onis, Ziya and Fikret Senses. 2003. Rethinking the Emerging Post-Washington
Consensus: A Critical Appraisal. ERC Working Paper 03/09
Ozgur, Ozlem. 1972. 100 Soruda Turkiye’de Kapitalizmin Gelismesi. Istanbul:Gercek
Yayinevi.
_________.1976. 100 Soruda Sanayilesme ve Turkiye. Istanbul:Gercek Yayinevi.
Ozmen, E; Furtun, G. 1998. Export-led growth hypothesis and the Turkish data: An
Empirical Investigation. METU Studies in Development. 25(3), 491-503.
Ovet, Yonca.1985.An Evaluation of the Post 1980- Export Performance of the
Manufacturing Industry. Unpublished PhD Thesis, Bogazici University, Istanbul.
Pamukcu, Teoman and de Boer, Paul “A Structural Decomposition Analysis of Imports of
Turkey” (1968-1990), Paper presented in the XIII International Conference on
Input-Output Techniques University of Macerata, Italy, August 21-25th, 2000.
Perraton, Jonathan. 2003. Balance of Payments Constrained Growth and Developing
Countries: An Examination of Thirlwall’s Hypothesis. International Review of
Applied Economics 17, no.1:1-22.
Sarialioglu, Hakan. 1994. Development and Export Policies of Turkey during the 1950-
1990 Period. Unpublished M.A.Thesis. Boğaziçi University, Istanbul,Turkey.
Selcuk, Faruk. 1997. Consumption Smoothing and Current Account: Turkey’s
Experience, 1987-1995. METU Studies in Development. 24(4).519-529.
Selcuk, Faruk. 1998. “A Brief Account of Turkish Economy, 1987-1996.” In The Political
Economy of Turkey in the Post-Soviet Era: Going West and Looking East? ed.
Libby Rittenberg, 17-37, Westport, CT: Praeger Publishers.
Senses, Fikret.1988. “An Overview of Recent Turkish Experience with Economic
Stabilization and Liberalization.” In Liberalization and the Turkish Economy, ed.
Tevfik F. Nas and Mehmet Odekon, 1-9, London: Greenwood Press.

32
___________.1990. “An Assessment of the Pattern of Turkish Manufactured Export
Growth.in the 1980s and its Prospects.” In Political Economy of Turkey, ed. Tosun
Arıcanlı and Dani Rodrik, 60-78, London: Macmillan
___________.1994. “ The Stabilization and Structural Adjustment Program and the
Process of Turkish Industrialization: Main Policies and their Impact.” In Recent
Industrialization Experience of Turkey in a Global Context, ed. Fikret Senses, 52-
92. London:Greenwood Press
Sonmez, Mustafa. 1992. 100 Soruda 1980’lerden 1990’lara Dısa Acılan Turkiye
Kapitalizmi. Istanbul:Gercek Yayinevi.
Statistical Indicators. 1923-2004. Turkish Statistical Institute.
www.die.gov.tr
Thirlwall, Anthony P.1974. The Balance of Payments Constraint as an Explanation of
International Growth Rate Differences. Banca Nazionale del Lavoro Quarterly
Review 128, 45-53.
________________. 1979. The Balance of Payments Constraint as an Explanation of
International Growth Rate Differences. Banca Nazionale del Lavoro Quarterly
Review 128: 45-53.
___________.1980a. Regional Problems are “Balance of Payments” Problems. Regional
Studies 14, 29-25
____________.1980b. Balance of Payments Theory and the United Kingdom Experience.
Macmillan, London.
_________.1982. The Harrod Trade Multiplier and the Importance of Export-led Growth.
Pakistan Journal of Applied Economics 1, no1: 1-21.
_______________, and M. Nureldin Hussain. 1982. The Balance of Payments
Constraint, Capital Flows and Growth Rate Differences between Developing
Countries. Oxford Economic Papers, November.
________.1986. Balance of Payments Constrained Growth: A reply to McGregor and
Swales. Applied Economics, 18, no 12: 1259-67.
____________. and Gianluca Sanna.1996. “The Macro Determinants of Growth and
“New” Growth Theory: An Evaluation and Further Evidence in Employment.”In
Economic Growth and the Tyranny of the Market: Essays in Honour of Paul
Davidson: Volume Two ed. Philip Arestis, 131-137.Brookfield: Edward Elgar
Publishing.
_________. 1997a. The Interaction Between Income and Expenditure in the Absorption

33
to the Balance of Payments. In Selected Essays of A.P. Thirlwall, Volume 2.
Macroeconomic Issues from a Keynesian Perspective, 315-18. Economists of the
Twentieth Century Series, Cheltenham, U.K. and N.H.: Elgar.
_________.1997b. Reflections on the Concept of Balance-of-Payments-Constrained
Growth. Journal of Post-Keynesian Economics 19, no: 3: 377-85.
______________. 1998. “The Balance of Payments and Growth: From Mercantilism to
Keynes to Harrod and Beyond.” In Economic Dynamics, Trade and Growth, ed.
G. Rampa et al. London: Macmillan.
_______________.2002. The Nature of Economic Growth: An Alternative Framework for
Understanding the Performance of Nations. Massachusetts: Edward Elgar
Publishing Ltd.
______________.2003a.Trade, Balance of Payments and Exchange Rate Policy in
Developing Countries. Massachusetts: Edward Elgar Publishing Ltd.
_____________. 2003b. Growth and Development with Special Reference to Developing
Countries. New York: Palgrave MacMillan.
Utkulu, Utku. and Durmus Ozdemir. 2003. Does Trade Liberalization cause a long run
economic growth in Turkey? Paper presented at EcoMod, Economic Modeling
Annual Conference, Istanbul, July.
Uygur, Ercan.2000. Recent Macroeconomic Developments and Policies in Turkey,
paper prepared for the United Nations Economic Commission for Europe,
March. http://politics.ankara.edu.tr/~uygur/research.htm
Yeldan, Erinc. 1989. Structural Adjustment and the Trade in Turkey: Investigating the
Alternatives: Beyond Export-led growth. Journal of Policy Modeling 11, no.
2:273-96
____________. 1993. Financial Liberalization and Economic Performance of
Turkey.Ankara: Central Bank of the Republic of Turkey.
_____________. 2001. Kuresellesme Surecinde Turkiye Ekonomisi:Bölüsüm, Birikim ve
Buyume.Istanbul:Iletisim Yayinlari.
Yenturk, Nurhan .1997. Wages, Employment and Accumulation in the Turkish
Manufacturing Industry. Forshungsergebnisse Research Report, Istanbul: Cozum
Publication.
____________. 2003. Korlerin Yuruyusu: Turkiye Ekonomisi ve 1990 Sonrasi

34
Krizler.Istanbul: Bilgi Universitesi Yayinlari 46.
Yucel, Yelda. 2003. Current Account Adjustment in Turkey: 1923-2002. Unpublished
PhD Thesis, Bogazici University, Istanbul.
35
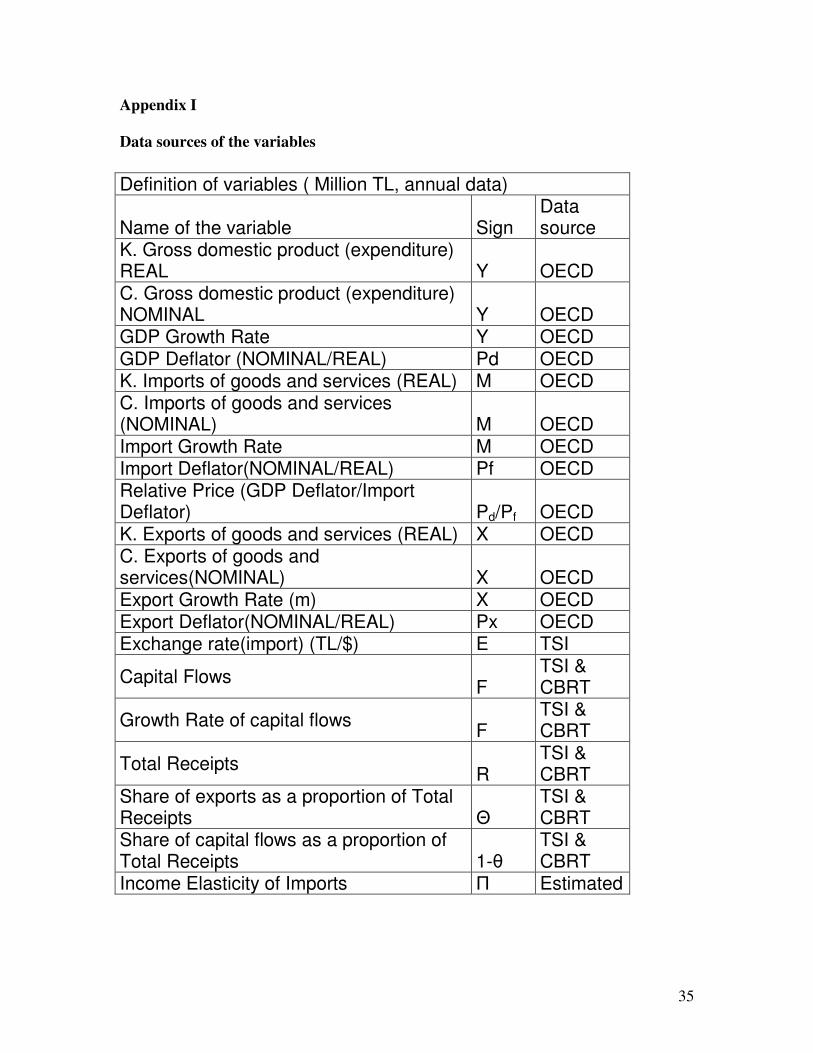
Appendix I
Data sources of the variables
Definition of variables ( Million TL, annual data)
Name of the variable Sign Data source
K. Gross domestic product (expenditure) REAL Y OECD C. Gross domestic product (expenditure) NOMINAL Y OECD GDP Growth Rate Y OECD GDP Deflator (NOMINAL/REAL) Pd OECD K. Imports of goods and services (REAL) M OECD C. Imports of goods and services (NOMINAL) M OECD Import Growth Rate M OECD Import Deflator(NOMINAL/REAL) Pf OECD Relative Price (GDP Deflator/Import Deflator) Pd/Pf OECD K. Exports of goods and services (REAL) X OECD C. Exports of goods and services(NOMINAL) X OECD Export Growth Rate (m) X OECD Export Deflator(NOMINAL/REAL) Px OECD Exchange rate(import) (TL/$) E TSI
Capital Flows F
TSI & CBRT
Growth Rate of capital flows F
TSI & CBRT
Total Receipts R
TSI & CBRT
Share of exports as a proportion of Total Receipts Θ
TSI & CBRT
Share of capital flows as a proportion of Total Receipts 1-θ
TSI & CBRT
Income Elasticity of Imports Π Estimated

36
Appendix II
Summary of previous applications of Thirlwall’s Law to the Turkish economy
Authors Version Estimation
Technique
Π Actual y Predicted
y (1)
Predicted
y (2)
Period
Hussain and
Thirlwall
(1982)
1st and
2nd
generation
OLS 0.92 5.8 6.1 5.9 1960-1973
Bariam (1988) 1st
generation
2SLS 2.68 5.0 6.9 - 1970-1985
Bairam (1990),
Bairam and
Dempster
(1991)
1st
generation
OLS 4.1 4.2 5.0 - 1973-1983
Perraton (2003) Modified
1st
generation
including
terms of
trade effect
Cointegration2.11 4.47 4.77 - 1973-1995