Embed Size (px)
Citation preview
THE BACHE COMMODITY THE BACHE COMMODITY THE BACHE COMMODITY THE BACHE COMMODITY INDEXINDEXINDEXINDEXSMSMSMSM::::
A FACTORA FACTORA FACTORA FACTOR----BASED BASED BASED BASED APPROACH TO COMMODITAPPROACH TO COMMODITAPPROACH TO COMMODITAPPROACH TO COMMODITY Y Y Y
INVESTMENTINVESTMENTINVESTMENTINVESTMENT
AIA RESEARCH REPORTAIA RESEARCH REPORTAIA RESEARCH REPORTAIA RESEARCH REPORT
Revised AugustRevised AugustRevised AugustRevised August 2008 2008 2008 2008
Contact: Richard SpurginContact: Richard SpurginContact: Richard SpurginContact: Richard Spurgin
ALTERNATIVE INVESTMEALTERNATIVE INVESTMEALTERNATIVE INVESTMEALTERNATIVE INVESTMENT ANALYTICS LLCNT ANALYTICS LLCNT ANALYTICS LLCNT ANALYTICS LLC
29 SOUTH PLEASANT ST29 SOUTH PLEASANT ST29 SOUTH PLEASANT ST29 SOUTH PLEASANT STREETREETREETREET
AMHERST MA 01002AMHERST MA 01002AMHERST MA 01002AMHERST MA 01002
Authors:
Hossein Kazemi, Ph.D.
George Martin
Thomas Schneeweis, Ph.D.
Richard Spurgin, Ph.D.
Alternative Investment Analytics LLC
29 South Pleasant Street
Amherst MA 01002
www.alternativeanalytics.com
P: 413.253.4601
F: 413.253.4613
THIS MATERIAL IS FOR INFORMATIONAL PURPOSES ONLY. IT IS NEITHER ADVICE NOR A
RECOMMENDATION TO ENTER INTO ANY TRANSACTION. THIS MATERIAL IS NOT AN OFFER TO BUY
OR SELL, NOR A SOLICITATION OF AN OFFER TO BUY OR SELL, ANY SECURITY, ANY PRIVATE
INVESTMENT FUND INCLUDED IN ANY OF THE INDICES OR OTHER FINANCIAL INSTRUMENTS. PAST
PERFORMANCE RESULTS SET FORTH HEREIN ARE NOT INDICATIVE OF ANY FUTURE RESULTS THAT
MAY BE ACHIEVED IN CONNECTION WITH ANY TRANSACTION. THE INFORMATION HEREIN IS BASED
ON OR DERIVED FROM SOURCES THAT WE BELIEVES TO BE RELIABLE; HOWEVER, WE MAKE NO
REPRESENTATION AS TO, AND ACCEPTS NO RESPONSIBILITY OR LIABILITY FOR THE ACCURACY,
FAIRNESS OR COMPLETENESS OF THE INFORMATION.
BCISM AND BACHE COMMODITY INDEXSM ARE SERVICE MARKS OF BACHE COMMODITIES LIMITED
AND ITS AFFILIATES. THE METHODOLOGY OF, AND INTELLECTUAL PROPERTY RIGHTS IN, THE BACHE
COMMODITY INDEXSM ARE PROPRIETARY TO, AND OWNED BY, PFDS HOLDINGS, LLC AND MAY BE
COVERED BY ONE OR MORE PENDING PATENT APPLICATIONS.
THE THE THE THE BACHE COMMODITY INDEXBACHE COMMODITY INDEXBACHE COMMODITY INDEXBACHE COMMODITY INDEX�::::
A FACTORA FACTORA FACTORA FACTOR----BASED APPROACH TO COMMODITY INVESTMENTBASED APPROACH TO COMMODITY INVESTMENTBASED APPROACH TO COMMODITY INVESTMENTBASED APPROACH TO COMMODITY INVESTMENT
TABLE OF CONTENTSTABLE OF CONTENTSTABLE OF CONTENTSTABLE OF CONTENTS
1 Introduction ............................................................................................................................................ 1
1.1 Economic Rationale for the BCI�........................................................................................ 1 1.2 Index Constituents and Weights .......................................................................................... 1
2 Commodity Investment Strategies..................................................................................................... 2
3 Data and Methodology ......................................................................................................................... 3
3.1 Style Factors............................................................................................................................ 3 3.2 Principal Assumptions........................................................................................................... 5 3.3 Constructing the Factor Return Series................................................................................ 7
4 Results .................................................................................................................................................... 7
4.1 Discussion of Composite Factor Returns ........................................................................... 8 4.2 Discussion of Composite Factor Volatility and Correlation.............................................. 8 4.3 Sector Index Return Comparison.......................................................................................11 4.4 Sector Index Correlation Analysis ......................................................................................11
5 Conclusion ............................................................................................................................................13
1
THE THE THE THE BACHE COMMODITY INDEXBACHE COMMODITY INDEXBACHE COMMODITY INDEXBACHE COMMODITY INDEX�::::
A FACTORA FACTORA FACTORA FACTOR----BASED APPROACH TO COMMODITY INVESTMENTBASED APPROACH TO COMMODITY INVESTMENTBASED APPROACH TO COMMODITY INVESTMENTBASED APPROACH TO COMMODITY INVESTMENT
1111 IntroductionIntroductionIntroductionIntroduction
The Bache Commodity Index� (BCI�) is a transparent, long-only, investable index that employs
dynamic asset allocation based on the price momentum of individual commodity markets. This
approach to index construction reduces transactions costs and turnover, and may increase risk-
adjusted returns. This methodology should also result in reduced losses during broad-based
commodity market declines.
The stated objective of the index is to provide investors with additional sources of return coupled
with enhanced risk protection, while preserving the essential properties that make commodity
investment attractive to many institutional investors. These include hedging inflation risk and low
correlation to equity and debt markets. Other commodity indices offer a single source of return:
commodity Beta. The BCI� includes Beta, and also includes a Momentum factor and a Relative Roll
factor. The Momentum and Relative Roll factors provide alternative sources of return without
increasing the overall risk. The historical performance of the BCI� suggests that this index may offer
better diversification and reduced risk, while providing return levels that are comparable to other
commodity indexing strategies.
1.11.11.11.1 Economic Rationale for the BCIEconomic Rationale for the BCIEconomic Rationale for the BCIEconomic Rationale for the BCI����
The development of the BCI� represents a significant advancement in commodity indexing
methodology. The index was designed using the view that the way commodities are held in a
commodity index is as important as the choice of commodities and weights. Actively managed
commodity programs do not hold a constant level of exposure either to individual commodities or to
the commodity markets as a whole. Rather, an active manager varies exposure to particular
commodities and sectors over time. The BCI� is the first commodity index to incorporate this feature
of dynamic asset allocation into an indexing framework. This is achieved while still preserving the
essential properties that make commodity investment attractive to many institutional investors.
1.21.21.21.2 Index Constituents and WeigIndex Constituents and WeigIndex Constituents and WeigIndex Constituents and Weightshtshtshts
The BCI� is currently comprised of nineteen commodity futures markets. These markets span the
energy, metals, and agriculture sectors and trade on seven global futures exchanges. The Advisory
Committee for the BCI� determines a set of commodities, and a set of allocations to those markets,
on an annual basis.
2
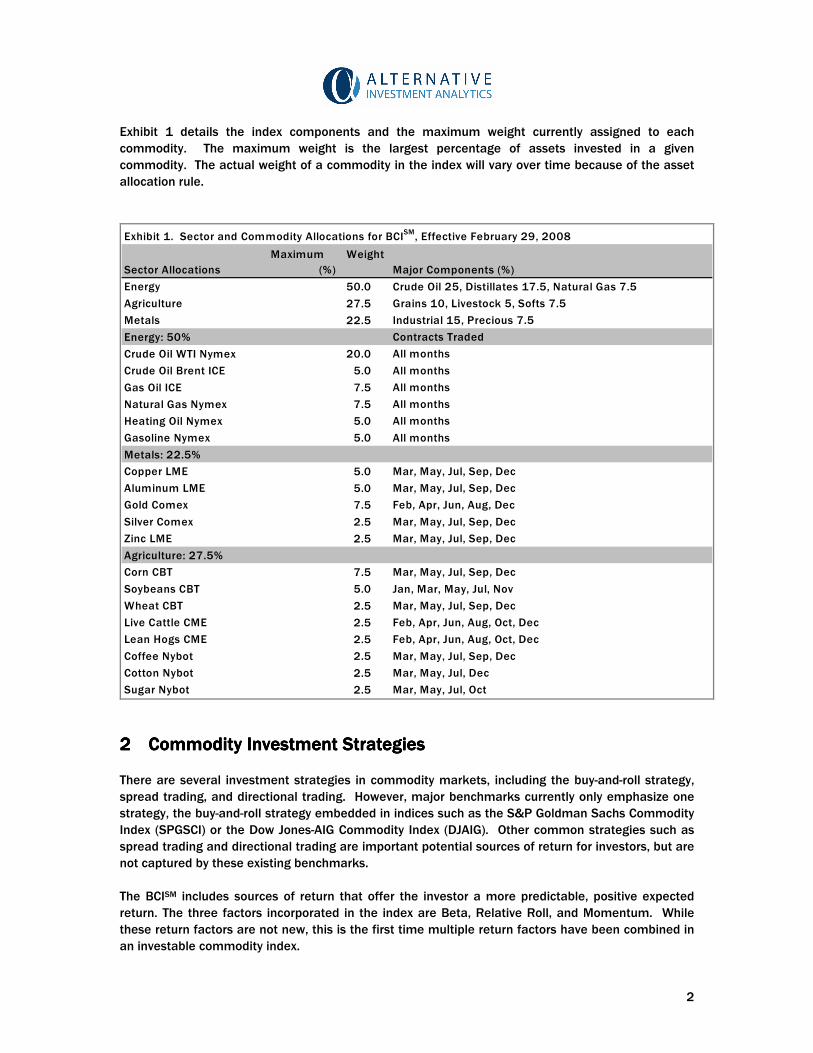
Exhibit 1 details the index components and the maximum weight currently assigned to each
commodity. The maximum weight is the largest percentage of assets invested in a given
commodity. The actual weight of a commodity in the index will vary over time because of the asset
allocation rule.
Sector Allocations
Maximum Weight
(%) Major Components (%)
Energy 50.0 Crude Oil 25, Distillates 17.5, Natural Gas 7.5
Agriculture 27.5 Grains 10, Livestock 5, Softs 7.5
Metals 22.5 Industrial 15, Precious 7.5
Contracts Traded
Crude Oil WTI Nymex 20.0 All months
Crude Oil Brent ICE 5.0 All months
Gas Oil ICE 7.5 All months
Natural Gas Nymex 7.5 All months
Heating Oil Nymex 5.0 All months
Gasoline Nymex 5.0 All months
Copper LME 5.0 Mar, May, Jul, Sep, Dec
Aluminum LME 5.0 Mar, May, Jul, Sep, Dec
Gold Comex 7.5 Feb, Apr, Jun, Aug, Dec
Silver Comex 2.5 Mar, May, Jul, Sep, Dec
Zinc LME 2.5 Mar, May, Jul, Sep, Dec
Corn CBT 7.5 Mar, May, Jul, Sep, Dec
Soybeans CBT 5.0 Jan, Mar, May, Jul, Nov
Wheat CBT 2.5 Mar, May, Jul, Sep, Dec
Live Cattle CME 2.5 Feb, Apr, Jun, Aug, Oct, Dec
Lean Hogs CME 2.5 Feb, Apr, Jun, Aug, Oct, Dec
Coffee Nybot 2.5 Mar, May, Jul, Sep, Dec
Cotton Nybot 2.5 Mar, May, Jul, Dec
Sugar Nybot 2.5 Mar, May, Jul, Oct
Agriculture: 27.5%
Metals: 22.5%
Energy: 50%
Exhibit 1. Sector and Commodity Allocations for BCISM
, Effective February 29, 2008
2222 Commodity Investment Strategies Commodity Investment Strategies Commodity Investment Strategies Commodity Investment Strategies
There are several investment strategies in commodity markets, including the buy-and-roll strategy,
spread trading, and directional trading. However, major benchmarks currently only emphasize one
strategy, the buy-and-roll strategy embedded in indices such as the S&P Goldman Sachs Commodity
Index (SPGSCI) or the Dow Jones-AIG Commodity Index (DJAIG). Other common strategies such as
spread trading and directional trading are important potential sources of return for investors, but are
not captured by these existing benchmarks.
The BCISM includes sources of return that offer the investor a more predictable, positive expected
return. The three factors incorporated in the index are Beta, Relative Roll, and Momentum. While
these return factors are not new, this is the first time multiple return factors have been combined in
an investable commodity index.
3
� Beta is the risk borne by the typical commodity investor today -- the risk associated with
buying a fixed basket of commodity futures contracts and rolling those contracts forward as
they approach expiration.
� Arbitrageurs and spread traders generally employ hedged (or spread) strategies that
attempt to extract returns from the forward delivery curve of the commodity. The BCI�
employs a daily roll methodology, in which the futures contracts in the BCI� have a longer
average maturity than other commodity indices. Over the past decade, longer maturity
commodity contracts have offered better value than the short-maturity contracts found in
most commodity indices.
� Commodity Trading Advisors have typically focused on long/short strategies using
momentum models. To capture this factor, a simple momentum model is incorporated into
the index.
Each of the factors is not only investable, but can be separated from the others as a stand-alone
benchmark or investment. The factors were designed to be easily traded with minimal transactions
costs. Different leverage levels can be attributed to different factors to reflect the mix of commodity
strategies employed by a given investor. The BCI� represents one approach to investing in these
commodity return factors. It is an unleveraged investment vehicle that provides diversified exposure
to each factor across a number of futures markets.
Analysis shows that the Beta factor provides the bulk of the return and the volatility to the BCI�. The
other two factors provide high risk-adjusted returns—and therefore risk protection--but lower nominal
returns than the Beta factor. Combining these three factors in a portfolio generates consistently
higher returns on both an absolute and a risk-adjusted basis.
3333 Data and MethodologyData and MethodologyData and MethodologyData and Methodology
Although the index incorporates all three of these factors, it is possible to separate them for
purposes of analysis and return attribution. The factors can also be separated for investment
purposes or for use as a custom benchmark. Each of the factors is investable. Different leverage
levels can be assigned to different factors to reflect the mix of commodity strategies desired by a
given investor. In this section the method used to calculate commodity factors is described.
3.13.13.13.1 Style FactorsStyle FactorsStyle FactorsStyle Factors
Discussing these style factors necessarily involves delving briefly into the nuances of commodity
index construction. It is natural to compare indices primarily by examining which commodities are
included and in what proportions. An equally important aspect of an index is the strategy used to
trade a particular commodity. Each commodity has several eligible delivery months. The trading
rules for an index must describe which of the eligible months the contract will hold and on what
date(s) the index will shift its holdings to the next contract.
4
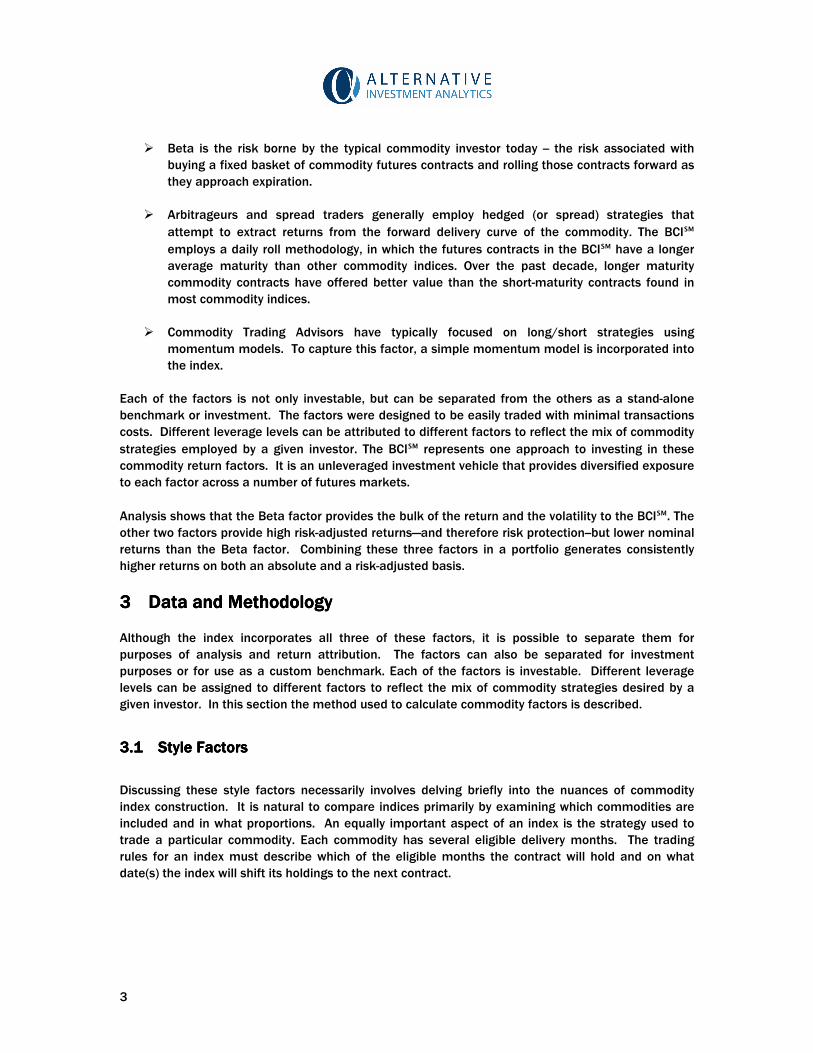
RV: 70% Position
spread over two
delivery months
Beta: 70% Position
in nearest expiration
40% Min
100% Max
Momentum
model ± 30%
Commodity Beta FactorCommodity Beta FactorCommodity Beta FactorCommodity Beta Factor
The Beta factor defined here is the return to holding the active contract until the weekday day prior
to the fifth calendar day of the month prior to expiration (the contract roll date).1 For example, on
the fourth of January, the position in Crude Oil for February delivery is sold and the proceeds are
used to purchase Crude Oil for delivery in March. The transaction is assumed to take place at the
close of trading, and settlement prices from the exchanges are used to compute these returns. The
Beta factor will be similar to the combined spot and roll return of major commodity indices such as
the SPGSCI or the DJAIG. These indices roll contracts during a short window in the early part of the
month. The Beta factor is the dominant source of both risk and return in the BCI�.
Relative Value/Daily Roll FactorRelative Value/Daily Roll FactorRelative Value/Daily Roll FactorRelative Value/Daily Roll Factor
The BCI� takes positions in two delivery months in each commodity. It trades each day and
maintains a constant weighted-average maturity in each commodity market. The average maturity
of the futures contracts in the BCI� is longer than the maturity of the Beta factor. The Relative Roll
factor is a synthetic spread trade that will be profitable if the price of the contract closest to
expiration falls in price relative to the longer maturity contracts. It is the incremental return to
extending the average maturity of contracts. The Relative Roll factor should not be confused with
the spot and roll index returns that some commodity indices publish. The Relative Roll factor is not
the entire roll portion of the BCI� return. It is the difference between the BCI� roll return and the
roll methodology of indices like the SPGSCI.
Exhibit 2Exhibit 2Exhibit 2Exhibit 2: Style Factors: Style Factors: Style Factors: Style Factors
Momentum/Risk Reduction FactorMomentum/Risk Reduction FactorMomentum/Risk Reduction FactorMomentum/Risk Reduction Factor
The Momentum factor utilizes a momentum-
based trading rule to hold varying amounts of a
given commodity depending on recent price
movements. To minimize turnover and trading
costs, there is a maximum daily position change
in each commodity. All trade signals are
executed with a one-day delay. The official
price used to calculate the index is the
settlement price.
Three signals are evaluated for each
commodity, a short-term signal, a medium-term signal, and a long-term signal. Each signal can be
positive or negative. Based on these signals, the target allocation takes on one of four possible
values: 40%, 60%, 80%, and 100% of the maximum allocation. Thus, the position in each commodity
will never be more than 100% or less than 40% of the maximum allocation. Each trading signal is
equally likely to be positive or negative, so that over a long time period each signal will be positive
about half the time and negative about half the time. Thus the long-run level of investment in each
commodity market is halfway between the 40% minimum investment level and the 100% fully
invested level, or at the 70% investment level.
5
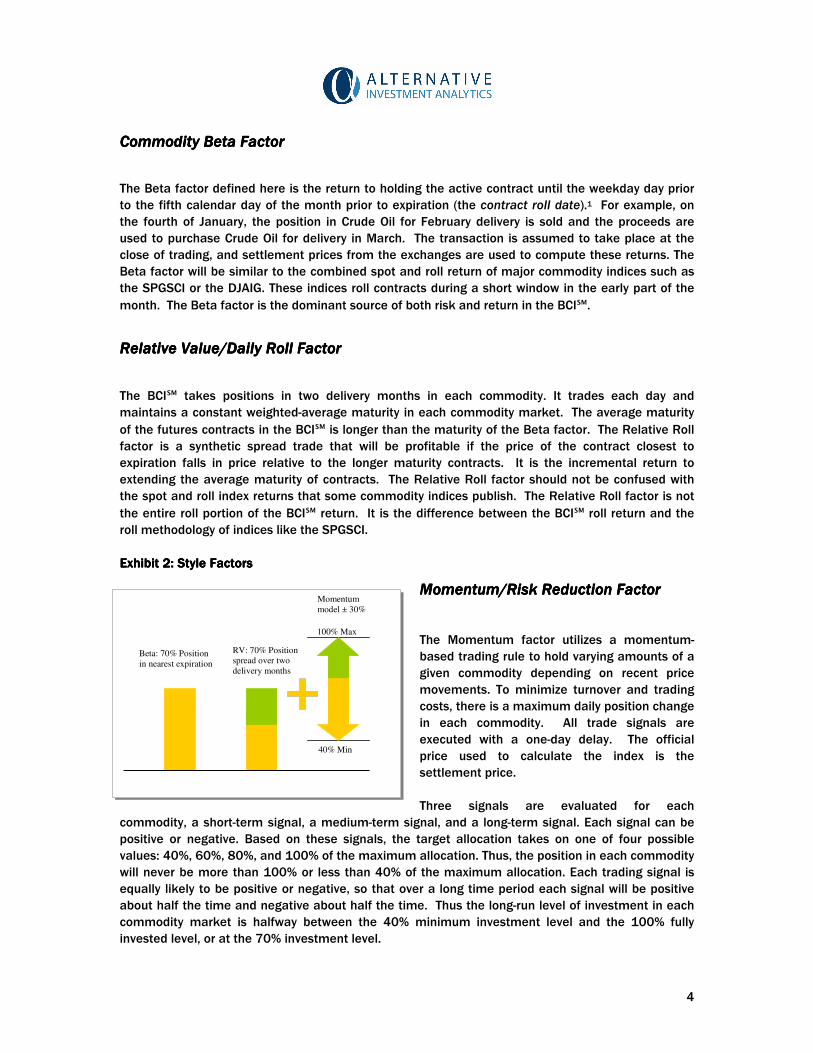
Exhibit 3 below shows the histogram of combined signals for individual commodities (left) and for
the composite index (right). The signals for individual commodities are likely to be at the extremes,
as the short-, medium-, and long-term signals tend to have the same sign. However, the histogram
for the composite index allocation shows that the average allocation across the index is usually
between 64% and 80% and is rarely above 90% or below 50%.
Exhibit 3Exhibit 3Exhibit 3Exhibit 3: Commodi: Commodi: Commodi: Commodity and Index Allocationsty and Index Allocationsty and Index Allocationsty and Index Allocations
0% 10% 20%
40%
60%
80%
100%
Percent of Days at Allocation Level 01/91 to 12/07, 59,290 Observations
Mom
entu
m-B
ase
d A
llocation
Histogram: Commodity Allocation
0% 5% 10% 15%
40%
60%
80%
100%
Percent of Days at Allocation Level 01/91 to 12/07, 4,369 Observations
Mom
entu
m-B
ase
d A
llocation
Histogram: Index Allocation
3.23.23.23.2 Principal AssumptionsPrincipal AssumptionsPrincipal AssumptionsPrincipal Assumptions
Cash ManagementCash ManagementCash ManagementCash Management
One of the central features of a commodity index is the method that cash flows are handled. While
commodity futures do not pay dividends or interest, cash is generated or paid each time a futures
contract is rolled. If this cash is used to buy more of the individual commodity, then the market
value of the position in that commodity remains constant. However, if the cash is used to buy more
of the index then commodities that are more backwardated than the index average will have their
allocation implicitly reduced and commodities in contango will be implicitly increased.2 For this
reason, it can be difficult to compare the compound returns of an individual commodity--which would
assume direct cash flow reinvestment--to the contribution that a commodity delivers to the returns of
an index.
Our indexing methodology is value-weighted, so any cash generated from the sale of a commodity
futures contract is used to purchase securities. For the Beta factor calculation, any cash generated
from the sale of the front-month futures position is entirely reinvested in the deferred contract.3 The
Relative Roll factor is computed the same way, although both the roll methodology (Daily Roll factor)
6
and the mix of nearby and deferred contracts are different.4 Cash management for the Momentum
factors is more complex because the level of investment in each market is changing over time. For
this factor, cash generated by a sale is used either to purchase contracts in the next delivery month
for that contract or to purchase Treasury bills. Treasury bills are purchased (sold) when the
momentum-based model determines that the allocation to the market should be reduced
(increased).5
RebalancingRebalancingRebalancingRebalancing
When more than one futures market is included in an index, the weight assigned to each index
component is rebalanced each day. This daily rebalancing approach applies to sector indices as well
as to composite indices, and is applied to the Beta, Relative Roll, and Momentum factor calculations.
Collateral Returns and Notional FundingCollateral Returns and Notional FundingCollateral Returns and Notional FundingCollateral Returns and Notional Funding
Returns are generally calculated on a total return basis, which means that all futures positions are
assumed to be fully collateralized (100% margin) with Treasury bills. Excess returns are also
reported. These exclude the Treasury bill returns on both futures positions and on the Treasury bills
held in the Momentum factor calculations. Percentage gains or losses are based on the notional
index value, which may include a Treasury bill position. Hedged positions generally do not have equal
amounts of notional funding. When describing the return to a hedged position (e.g., long the Relative
Roll index, short the Beta index) it is assumed that equal dollars are held in each position even
though the number of futures contracts may differ.8 All hedged returns are reported as excess
returns in order to avoid double-counting of Treasury bill returns, and are calculated using the
notional amount of the long side of the hedge as the denominator in the return calculation.
All returns are based on compound annual returns unless otherwise noted. Hedged positions that are
long one factor index and short another are assumed to begin the year with the same notional
investment but the level of investment in the hedged trade is allowed to vary through the year.9
The Beta and Relative Roll index returns are based on the assumption that an investor allocates 70%
of available capital to the Beta strategy and 30% to Treasury bills. This assumption simplifies the
task of measuring the contribution of the Momentum factor. Since the momentum index holds an
average of 30% in Treasury bills,10 a 70/30 portfolio of the Beta and Relative Roll indices will have
the same average exposure to futures markets.
The factor returns are designed using an additive approach. When layered in this way, the Relative
Roll and Momentum factors operate as overlay strategies. In particular, the Momentum factor will be
up to 30% net long or short the underlying commodity. For example, if the Momentum signal is at
40%, the Momentum factor will be long 40% of the commodity through the Momentum model. The
factor will also be implicitly 70% of the same commodity through the Relative Roll index. The net
result will be a 30% short position. Although each of the indices is always long every commodity, the
factors can be long or short.
7
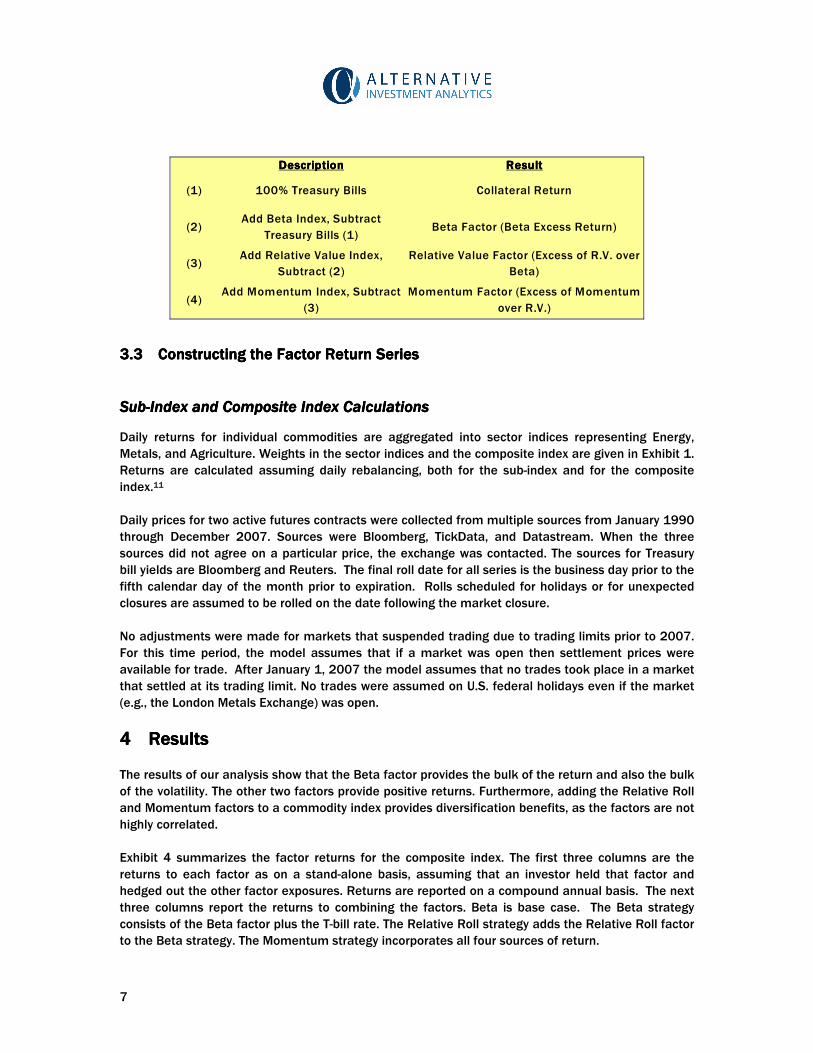
DescriptionDescriptionDescriptionDescription ResultResultResultResult
(1) 100% Treasury Bills Collateral Return
(2)Add Beta Index, Subtract
Treasury Bills (1)Beta Factor (Beta Excess Return)
(3)Add Relative Value Index,
Subtract (2)
Relative Value Factor (Excess of R.V. over
Beta)
(4)Add Momentum Index, Subtract
(3)
Momentum Factor (Excess of Momentum
over R.V.)
3.33.33.33.3 Constructing the Factor Return SeriesConstructing the Factor Return SeriesConstructing the Factor Return SeriesConstructing the Factor Return Series
SubSubSubSub----Index and CompositIndex and CompositIndex and CompositIndex and Composite Index Calculationse Index Calculationse Index Calculationse Index Calculations
Daily returns for individual commodities are aggregated into sector indices representing Energy,
Metals, and Agriculture. Weights in the sector indices and the composite index are given in Exhibit 1.
Returns are calculated assuming daily rebalancing, both for the sub-index and for the composite
index.11
Daily prices for two active futures contracts were collected from multiple sources from January 1990
through December 2007. Sources were Bloomberg, TickData, and Datastream. When the three
sources did not agree on a particular price, the exchange was contacted. The sources for Treasury
bill yields are Bloomberg and Reuters. The final roll date for all series is the business day prior to the
fifth calendar day of the month prior to expiration. Rolls scheduled for holidays or for unexpected
closures are assumed to be rolled on the date following the market closure.
No adjustments were made for markets that suspended trading due to trading limits prior to 2007.
For this time period, the model assumes that if a market was open then settlement prices were
available for trade. After January 1, 2007 the model assumes that no trades took place in a market
that settled at its trading limit. No trades were assumed on U.S. federal holidays even if the market
(e.g., the London Metals Exchange) was open.
4444 ResultsResultsResultsResults
The results of our analysis show that the Beta factor provides the bulk of the return and also the bulk
of the volatility. The other two factors provide positive returns. Furthermore, adding the Relative Roll
and Momentum factors to a commodity index provides diversification benefits, as the factors are not
highly correlated.
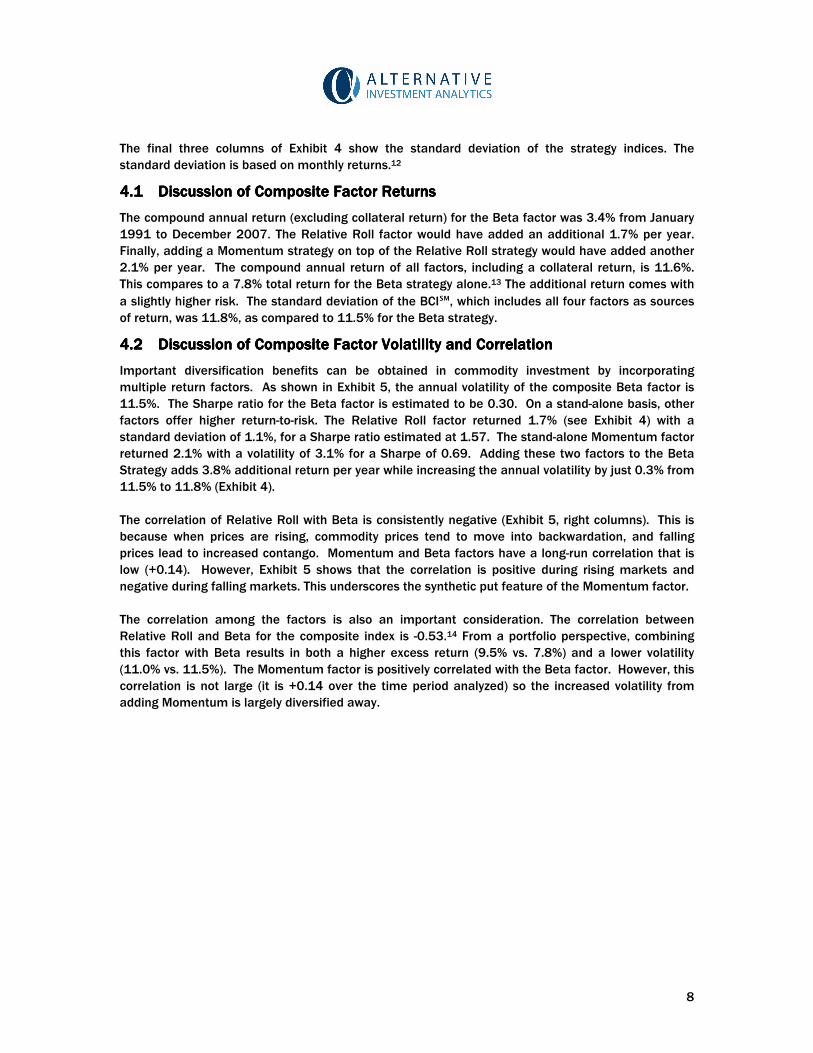
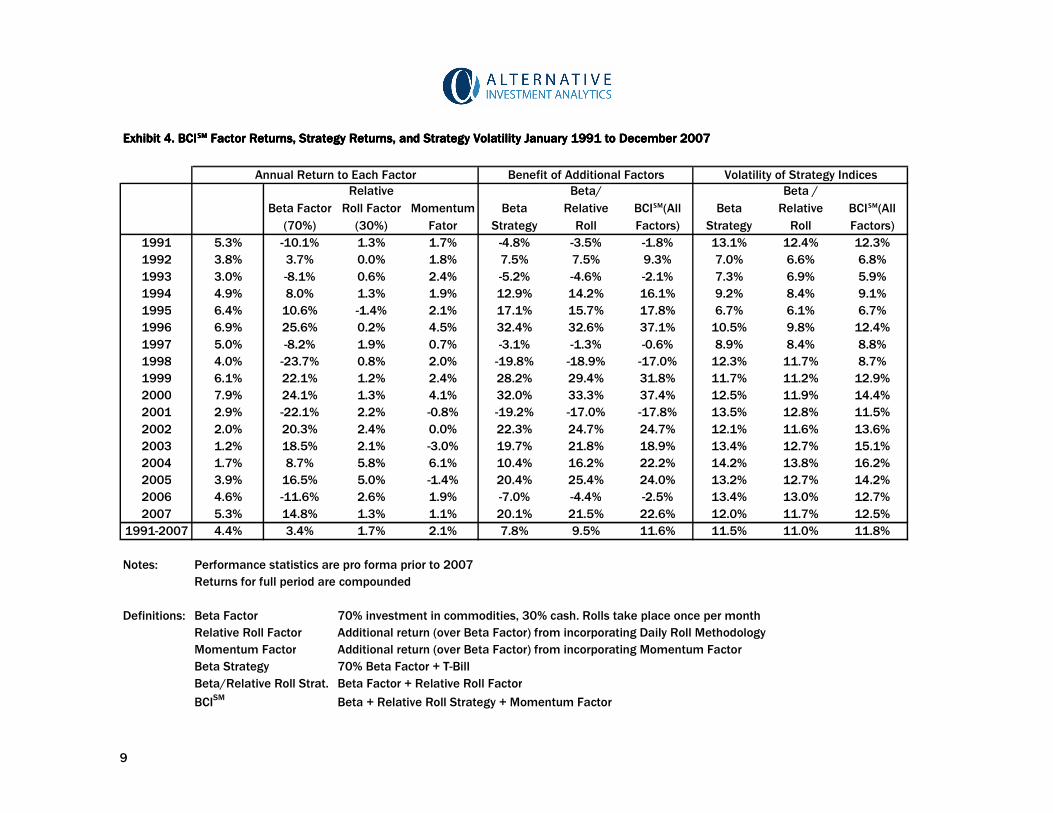
Exhibit 4 summarizes the factor returns for the composite index. The first three columns are the
returns to each factor as on a stand-alone basis, assuming that an investor held that factor and
hedged out the other factor exposures. Returns are reported on a compound annual basis. The next
three columns report the returns to combining the factors. Beta is base case. The Beta strategy
consists of the Beta factor plus the T-bill rate. The Relative Roll strategy adds the Relative Roll factor
to the Beta strategy. The Momentum strategy incorporates all four sources of return.
8
The final three columns of Exhibit 4 show the standard deviation of the strategy indices. The
standard deviation is based on monthly returns.12
4.14.14.14.1 Discussion of Composite Factor ReturnsDiscussion of Composite Factor ReturnsDiscussion of Composite Factor ReturnsDiscussion of Composite Factor Returns
The compound annual return (excluding collateral return) for the Beta factor was 3.4% from January
1991 to December 2007. The Relative Roll factor would have added an additional 1.7% per year.
Finally, adding a Momentum strategy on top of the Relative Roll strategy would have added another
2.1% per year. The compound annual return of all factors, including a collateral return, is 11.6%.
This compares to a 7.8% total return for the Beta strategy alone.13 The additional return comes with
a slightly higher risk. The standard deviation of the BCI�, which includes all four factors as sources
of return, was 11.8%, as compared to 11.5% for the Beta strategy.
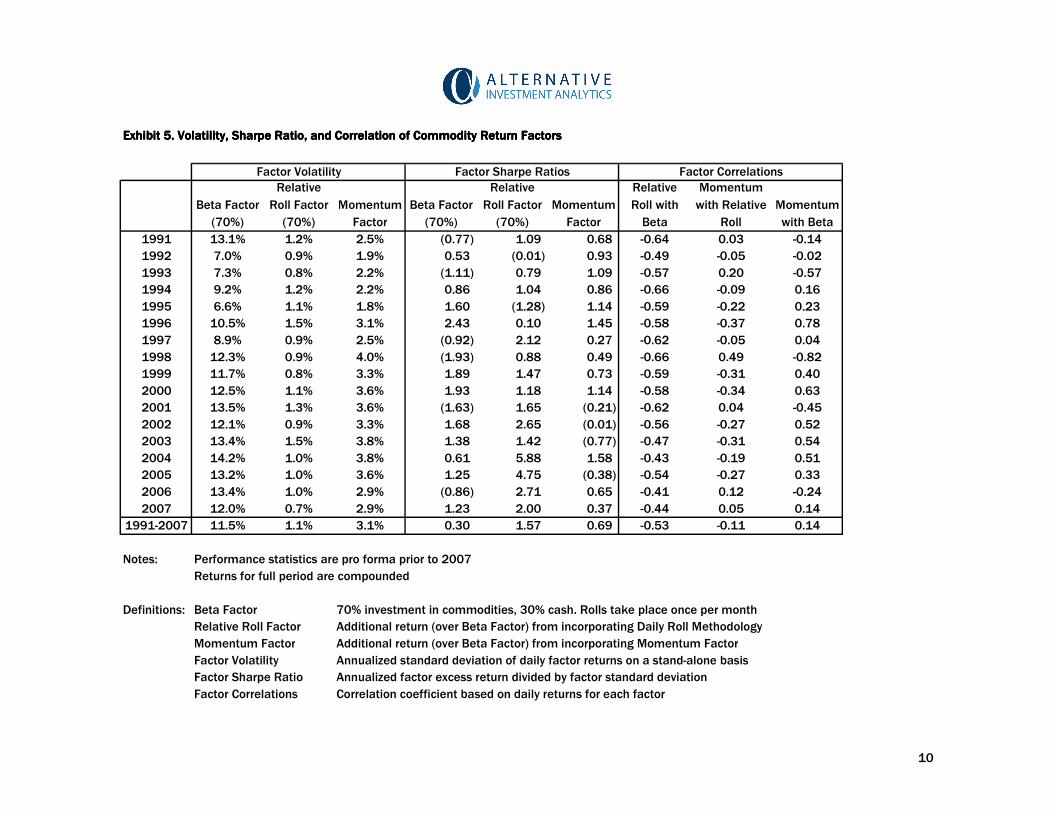
4.24.24.24.2 Discussion of Composite Factor Volatility and CorrelationDiscussion of Composite Factor Volatility and CorrelationDiscussion of Composite Factor Volatility and CorrelationDiscussion of Composite Factor Volatility and Correlation
Important diversification benefits can be obtained in commodity investment by incorporating
multiple return factors. As shown in Exhibit 5, the annual volatility of the composite Beta factor is
11.5%. The Sharpe ratio for the Beta factor is estimated to be 0.30. On a stand-alone basis, other
factors offer higher return-to-risk. The Relative Roll factor returned 1.7% (see Exhibit 4) with a
standard deviation of 1.1%, for a Sharpe ratio estimated at 1.57. The stand-alone Momentum factor
returned 2.1% with a volatility of 3.1% for a Sharpe of 0.69. Adding these two factors to the Beta
Strategy adds 3.8% additional return per year while increasing the annual volatility by just 0.3% from
11.5% to 11.8% (Exhibit 4).
The correlation of Relative Roll with Beta is consistently negative (Exhibit 5, right columns). This is
because when prices are rising, commodity prices tend to move into backwardation, and falling
prices lead to increased contango. Momentum and Beta factors have a long-run correlation that is
low (+0.14). However, Exhibit 5 shows that the correlation is positive during rising markets and
negative during falling markets. This underscores the synthetic put feature of the Momentum factor.
The correlation among the factors is also an important consideration. The correlation between
Relative Roll and Beta for the composite index is -0.53.14 From a portfolio perspective, combining
this factor with Beta results in both a higher excess return (9.5% vs. 7.8%) and a lower volatility
(11.0% vs. 11.5%). The Momentum factor is positively correlated with the Beta factor. However, this
correlation is not large (it is +0.14 over the time period analyzed) so the increased volatility from
adding Momentum is largely diversified away.
9
Exhibit 4. BCIExhibit 4. BCIExhibit 4. BCIExhibit 4. BCI���� Factor Returns, Strategy Returns, and Strategy Volatility January 1991 to December 2007 Factor Returns, Strategy Returns, and Strategy Volatility January 1991 to December 2007 Factor Returns, Strategy Returns, and Strategy Volatility January 1991 to December 2007 Factor Returns, Strategy Returns, and Strategy Volatility January 1991 to December 2007
Beta Factor
(70%)
Relative
Roll Factor
(30%)
Momentum
Fator
Beta
Strategy
Beta/
Relative
Roll
BCI�(All
Factors)
Beta
Strategy
Beta /
Relative
Roll
BCI�(All
Factors)
1991 5.3% -10.1% 1.3% 1.7% -4.8% -3.5% -1.8% 13.1% 12.4% 12.3%
1992 3.8% 3.7% 0.0% 1.8% 7.5% 7.5% 9.3% 7.0% 6.6% 6.8%
1993 3.0% -8.1% 0.6% 2.4% -5.2% -4.6% -2.1% 7.3% 6.9% 5.9%
1994 4.9% 8.0% 1.3% 1.9% 12.9% 14.2% 16.1% 9.2% 8.4% 9.1%
1995 6.4% 10.6% -1.4% 2.1% 17.1% 15.7% 17.8% 6.7% 6.1% 6.7%
1996 6.9% 25.6% 0.2% 4.5% 32.4% 32.6% 37.1% 10.5% 9.8% 12.4%
1997 5.0% -8.2% 1.9% 0.7% -3.1% -1.3% -0.6% 8.9% 8.4% 8.8%
1998 4.0% -23.7% 0.8% 2.0% -19.8% -18.9% -17.0% 12.3% 11.7% 8.7%
1999 6.1% 22.1% 1.2% 2.4% 28.2% 29.4% 31.8% 11.7% 11.2% 12.9%
2000 7.9% 24.1% 1.3% 4.1% 32.0% 33.3% 37.4% 12.5% 11.9% 14.4%
2001 2.9% -22.1% 2.2% -0.8% -19.2% -17.0% -17.8% 13.5% 12.8% 11.5%
2002 2.0% 20.3% 2.4% 0.0% 22.3% 24.7% 24.7% 12.1% 11.6% 13.6%
2003 1.2% 18.5% 2.1% -3.0% 19.7% 21.8% 18.9% 13.4% 12.7% 15.1%
2004 1.7% 8.7% 5.8% 6.1% 10.4% 16.2% 22.2% 14.2% 13.8% 16.2%
2005 3.9% 16.5% 5.0% -1.4% 20.4% 25.4% 24.0% 13.2% 12.7% 14.2%
2006 4.6% -11.6% 2.6% 1.9% -7.0% -4.4% -2.5% 13.4% 13.0% 12.7%
2007 5.3% 14.8% 1.3% 1.1% 20.1% 21.5% 22.6% 12.0% 11.7% 12.5%
1991-2007 4.4% 3.4% 1.7% 2.1% 7.8% 9.5% 11.6% 11.5% 11.0% 11.8%
Notes: Performance statistics are pro forma prior to 2007
Returns for full period are compounded
Definitions: Beta Factor 70% investment in commodities, 30% cash. Rolls take place once per month
Relative Roll Factor Additional return (over Beta Factor) from incorporating Daily Roll Methodology
Momentum Factor Additional return (over Beta Factor) from incorporating Momentum Factor
Beta Strategy 70% Beta Factor + T-Bill
Beta/Relative Roll Strat. Beta Factor + Relative Roll Factor
BCISM
Beta + Relative Roll Strategy + Momentum Factor
Annual Return to Each Factor Benefit of Additional Factors Volatility of Strategy Indices
10
Exhibit 5. Volatility, Sharpe Ratio, and Correlation of Commodity Return FactorsExhibit 5. Volatility, Sharpe Ratio, and Correlation of Commodity Return FactorsExhibit 5. Volatility, Sharpe Ratio, and Correlation of Commodity Return FactorsExhibit 5. Volatility, Sharpe Ratio, and Correlation of Commodity Return Factors
Beta Factor
(70%)
Relative
Roll Factor
(70%)
Momentum
Factor
Beta Factor
(70%)
Relative
Roll Factor
(70%)
Momentum
Factor
Relative
Roll with
Beta
Momentum
with Relative
Roll
Momentum
with Beta
1991 13.1% 1.2% 2.5% (0.77) 1.09 0.68 -0.64 0.03 -0.14
1992 7.0% 0.9% 1.9% 0.53 (0.01) 0.93 -0.49 -0.05 -0.02
1993 7.3% 0.8% 2.2% (1.11) 0.79 1.09 -0.57 0.20 -0.57
1994 9.2% 1.2% 2.2% 0.86 1.04 0.86 -0.66 -0.09 0.16
1995 6.6% 1.1% 1.8% 1.60 (1.28) 1.14 -0.59 -0.22 0.23
1996 10.5% 1.5% 3.1% 2.43 0.10 1.45 -0.58 -0.37 0.78
1997 8.9% 0.9% 2.5% (0.92) 2.12 0.27 -0.62 -0.05 0.04
1998 12.3% 0.9% 4.0% (1.93) 0.88 0.49 -0.66 0.49 -0.82
1999 11.7% 0.8% 3.3% 1.89 1.47 0.73 -0.59 -0.31 0.40
2000 12.5% 1.1% 3.6% 1.93 1.18 1.14 -0.58 -0.34 0.63
2001 13.5% 1.3% 3.6% (1.63) 1.65 (0.21) -0.62 0.04 -0.45
2002 12.1% 0.9% 3.3% 1.68 2.65 (0.01) -0.56 -0.27 0.52
2003 13.4% 1.5% 3.8% 1.38 1.42 (0.77) -0.47 -0.31 0.54
2004 14.2% 1.0% 3.8% 0.61 5.88 1.58 -0.43 -0.19 0.51
2005 13.2% 1.0% 3.6% 1.25 4.75 (0.38) -0.54 -0.27 0.33
2006 13.4% 1.0% 2.9% (0.86) 2.71 0.65 -0.41 0.12 -0.24
2007 12.0% 0.7% 2.9% 1.23 2.00 0.37 -0.44 0.05 0.14
1991-2007 11.5% 1.1% 3.1% 0.30 1.57 0.69 -0.53 -0.11 0.14
Notes: Performance statistics are pro forma prior to 2007
Returns for full period are compounded
Definitions: Beta Factor 70% investment in commodities, 30% cash. Rolls take place once per month
Relative Roll Factor Additional return (over Beta Factor) from incorporating Daily Roll Methodology
Momentum Factor Additional return (over Beta Factor) from incorporating Momentum Factor
Factor Volatility Annualized standard deviation of daily factor returns on a stand-alone basis
Factor Sharpe Ratio Annualized factor excess return divided by factor standard deviation
Factor Correlations Correlation coefficient based on daily returns for each factor
Factor Sharpe Ratios Factor CorrelationsFactor Volatility
11
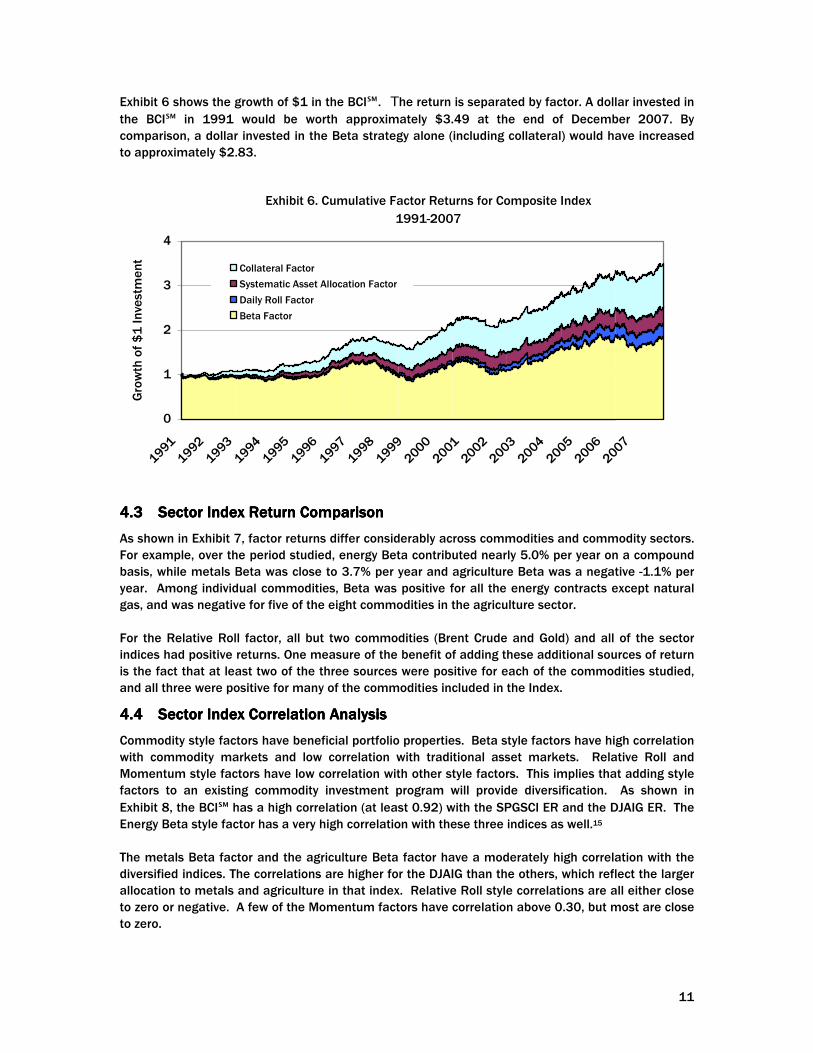
Exhibit 6 shows the growth of $1 in the BCI�. The return is separated by factor. A dollar invested in
the BCI� in 1991 would be worth approximately $3.49 at the end of December 2007. By
comparison, a dollar invested in the Beta strategy alone (including collateral) would have increased
to approximately $2.83.
Exhibit 6. Cumulative Factor Returns for Composite Index
1991-2007
0
1
2
3
4
1991
1992
1993
1994
1995
1996
1997
1998
1999
2000
2001
2002
2003
2004
2005
2006
2007
Gro
wth
of $1 Inve
stm
ent
Collateral Factor
Systematic Asset Allocation Factor
Daily Roll Factor
Beta Factor
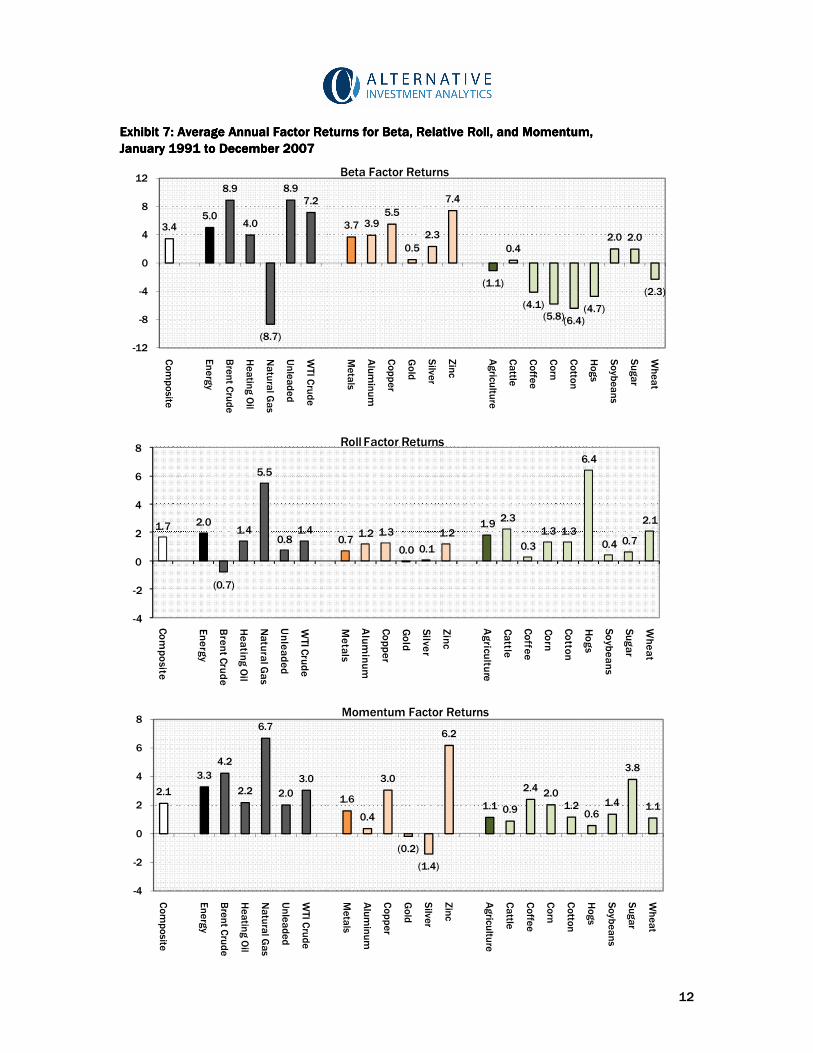
4.34.34.34.3 Sector Index Return ComparisonSector Index Return ComparisonSector Index Return ComparisonSector Index Return Comparison
As shown in Exhibit 7, factor returns differ considerably across commodities and commodity sectors.
For example, over the period studied, energy Beta contributed nearly 5.0% per year on a compound
basis, while metals Beta was close to 3.7% per year and agriculture Beta was a negative -1.1% per
year. Among individual commodities, Beta was positive for all the energy contracts except natural
gas, and was negative for five of the eight commodities in the agriculture sector.
For the Relative Roll factor, all but two commodities (Brent Crude and Gold) and all of the sector
indices had positive returns. One measure of the benefit of adding these additional sources of return
is the fact that at least two of the three sources were positive for each of the commodities studied,
and all three were positive for many of the commodities included in the Index.
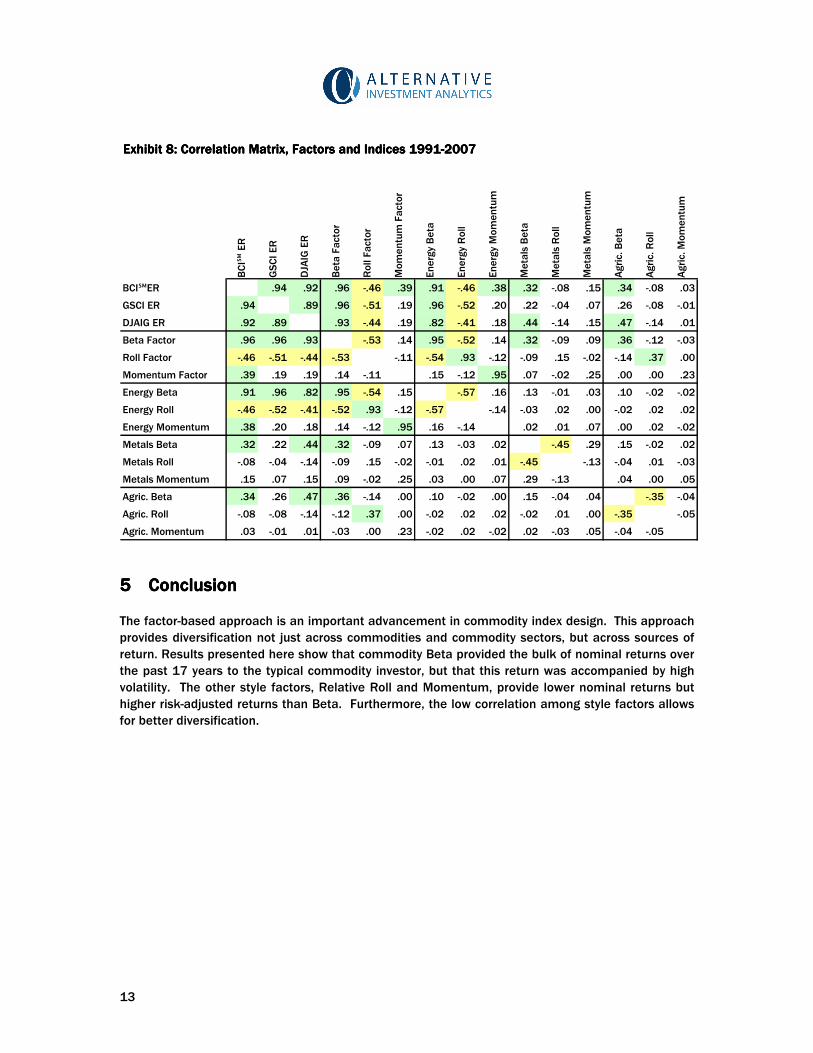
4.44.44.44.4 Sector Index Sector Index Sector Index Sector Index Correlation AnalysisCorrelation AnalysisCorrelation AnalysisCorrelation Analysis
Commodity style factors have beneficial portfolio properties. Beta style factors have high correlation
with commodity markets and low correlation with traditional asset markets. Relative Roll and
Momentum style factors have low correlation with other style factors. This implies that adding style
factors to an existing commodity investment program will provide diversification. As shown in
Exhibit 8, the BCI� has a high correlation (at least 0.92) with the SPGSCI ER and the DJAIG ER. The
Energy Beta style factor has a very high correlation with these three indices as well.15
The metals Beta factor and the agriculture Beta factor have a moderately high correlation with the
diversified indices. The correlations are higher for the DJAIG than the others, which reflect the larger
allocation to metals and agriculture in that index. Relative Roll style correlations are all either close
to zero or negative. A few of the Momentum factors have correlation above 0.30, but most are close
to zero.
12
Exhibit 7Exhibit 7Exhibit 7Exhibit 7: Average Annual Factor Returns for Beta, : Average Annual Factor Returns for Beta, : Average Annual Factor Returns for Beta, : Average Annual Factor Returns for Beta, Relative RollRelative RollRelative RollRelative Roll, and Momentum, , and Momentum, , and Momentum, , and Momentum,
January 1991 to DecemberJanuary 1991 to DecemberJanuary 1991 to DecemberJanuary 1991 to December 2007 2007 2007 2007
3.4 5.0
8.9
4.0
(8.7)
8.9
7.2
3.7 3.9 5.5
0.5
2.3
7.4
(1.1)
0.4
(4.1)(5.8)(6.4)
(4.7)
2.0 2.0
(2.3)
-12
-8
-4
0
4
8
12
Com
posite
Energ
y
Bre
nt C
rude
Heatin
g O
il
Natu
ral G
as
Unle
aded
WTI C
rude
Meta
ls
Alu
min
um
Copper
Gold
Silve
r
Zin
c
Agricu
lture
Cattle
Coffe
e
Corn
Cotto
n
Hogs
Soyb
eans
Sugar
Wheat
Beta Factor Returns
1.7 2.0
(0.7)
1.4
5.5
0.8 1.4
0.7 1.2 1.3
0.0 0.1
1.2 1.9
2.3
0.3
1.3 1.3
6.4
0.4 0.7
2.1
-4
-2
0
2
4
6
8
Com
posite
Energ
y
Bre
nt C
rude
Heatin
g O
il
Natu
ral G
as
Unle
aded
WTI C
rude
Meta
ls
Alu
min
um
Copper
Gold
Silve
r
Zin
c
Agricu
lture
Cattle
Coffe
e
Corn
Cotto
n
Hogs
Soyb
eans
Sugar
Wheat
Roll Factor Returns
2.1
3.3
4.2
2.2
6.7
2.0
3.0
1.6
0.4
3.0
(0.2)
(1.4)
6.2
1.1 0.9
2.4 2.0
1.2 0.6
1.4
3.8
1.1
-4
-2
0
2
4
6
8
Com
posite
Energ
y
Bre
nt C
rude
Heatin
g O
il
Natu
ral G
as
Unle
aded
WTI C
rude
Meta
ls
Alu
min
um
Copper
Gold
Silve
r
Zin
c
Agricu
lture
Cattle
Coffe
e
Corn
Cotto
n
Hogs
Soyb
eans
Sugar
Wheat
Momentum Factor Returns
13
Exhibit 8: Correlation Matrix, Factors and Indices 1991-2007Exhibit 8: Correlation Matrix, Factors and Indices 1991-2007Exhibit 8: Correlation Matrix, Factors and Indices 1991-2007Exhibit 8: Correlation Matrix, Factors and Indices 1991-2007
BCI�
ER
GSCI ER
DJA
IG E
R
Beta
Fact
or
Roll F
act
or
Mom
entu
m F
act
or
Energ
y Beta
Energ
y Roll
Energ
y M
om
entu
m
Meta
ls B
eta
Meta
ls R
oll
Meta
ls M
om
entu
m
Agric.
Beta
Agric.
Roll
Agric.
Mom
entu
m
BCI�ER .94 .92 .96 -.46 .39 .91 -.46 .38 .32 -.08 .15 .34 -.08 .03
GSCI ER .94 .89 .96 -.51 .19 .96 -.52 .20 .22 -.04 .07 .26 -.08 -.01
DJAIG ER .92 .89 .93 -.44 .19 .82 -.41 .18 .44 -.14 .15 .47 -.14 .01
Beta Factor .96 .96 .93 -.53 .14 .95 -.52 .14 .32 -.09 .09 .36 -.12 -.03
Roll Factor -.46 -.51 -.44 -.53 -.11 -.54 .93 -.12 -.09 .15 -.02 -.14 .37 .00
Momentum Factor .39 .19 .19 .14 -.11 .15 -.12 .95 .07 -.02 .25 .00 .00 .23
Energy Beta .91 .96 .82 .95 -.54 .15 -.57 .16 .13 -.01 .03 .10 -.02 -.02
Energy Roll -.46 -.52 -.41 -.52 .93 -.12 -.57 -.14 -.03 .02 .00 -.02 .02 .02
Energy Momentum .38 .20 .18 .14 -.12 .95 .16 -.14 .02 .01 .07 .00 .02 -.02
Metals Beta .32 .22 .44 .32 -.09 .07 .13 -.03 .02 -.45 .29 .15 -.02 .02
Metals Roll -.08 -.04 -.14 -.09 .15 -.02 -.01 .02 .01 -.45 -.13 -.04 .01 -.03
Metals Momentum .15 .07 .15 .09 -.02 .25 .03 .00 .07 .29 -.13 .04 .00 .05
Agric. Beta .34 .26 .47 .36 -.14 .00 .10 -.02 .00 .15 -.04 .04 -.35 -.04
Agric. Roll -.08 -.08 -.14 -.12 .37 .00 -.02 .02 .02 -.02 .01 .00 -.35 -.05
Agric. Momentum .03 -.01 .01 -.03 .00 .23 -.02 .02 -.02 .02 -.03 .05 -.04 -.05
5555 ConclusionConclusionConclusionConclusion
The factor-based approach is an important advancement in commodity index design. This approach
provides diversification not just across commodities and commodity sectors, but across sources of
return. Results presented here show that commodity Beta provided the bulk of nominal returns over
the past 17 years to the typical commodity investor, but that this return was accompanied by high
volatility. The other style factors, Relative Roll and Momentum, provide lower nominal returns but
higher risk-adjusted returns than Beta. Furthermore, the low correlation among style factors allows
for better diversification.
14
Selected ReferencesSelected ReferencesSelected ReferencesSelected References
Anson, Mark, 1998, Spot returns, roll yield, and diversification with commodity futures, Journal of
Alternative Investments.
Becker, K., and J. Finnerty, 2000, “Indexed commodity futures and the risk and return of institutional
portfolios, OFOR Working Paper.
Fama, Eugene F. and Kenneth R. French, 1998, Business cycles and the behavior of metals prices,"
Journal of Finance, 43(5).
Geman, Helyette, 2005, Commodities and Commodity Derivatives: Modeling and Pricing for
Agriculturals, Metals, and Energy (John Wiley & Sons).
Greer, Robert J., 1978, Conservative commodities: A key inflation hedge, Journal of Portfolio
Management.
Greer, Robert J., 1994, Methods for institutional investment in commodity futures, Journal of
Derivatives, 28-36.
Greer, Robert J., 2000, The nature of commodity index returns, Journal of Alternative Investments, 45-
52.
Halpern, Philip and Randy Warsager, 1998, Performance of energy and non-energy based commodity
investment vehicles in periods of inflation, Journal of Alternative Investments, 75-81.
Jensen, Gerald R., Johnson, Robert R., and Jeffrey M. Mercer, 2000, Efficient use of commodity futures
in diversified Portfolios, Journal of Futures Markets, 20, 48--506.
Jensen, Gerald R., Johnson, R.obert R., and Jeffrey M. Mercer, 2000, Tactical asset allocation and
commodity futures, Journal of Portfolio Management, 100--111.
Martin, George, Kazemi, Hossein, Schneeweis, Thomas, and Richard Spurgin, 2006, The Gyre/AIA
commodity index: A guide to index methodology and construction, AIA Research Report.
Schneeweis, Thomas and Richard Spurgin, 1997, Comparisons of commodity and managed futures
benchmark indexes, Journal of Derivatives, 33-50.
Spurgin, Richard, 1999, A benchmark for commodity trading advisor performance, Journal of
Alternative Investments.
Strongin, Steve, and Melanie Petsch, 1995, Commodity investing: Long-run returns and the function of
passive capital, Derivatives Quarterly, 56-64.
Till, Hilary, 2000, Passive strategies in the commodity futures markets, Derivatives Quarterly, 49-54.
Vrugt, Evert B., Bauer, Rob, Molenaar, Roderick, and Tom Steenkamp, 2004, Dynamic commodity
timing strategies, SSRN Working Paper.
15
1 For example, at the close of business on Wednesday, January 4, 2006 all contracts for February delivery were
rolled to the deferred contract. In December 2005, the 5th was a Monday, so January 2006 contracts were
rolled on Friday, December 2. In the rare case that the weekday prior to the 5th is a holiday or a special
situation such as a limit move, the position is rolled on the next date. Please refer to the index methodology
document for details. 2 This is true of the way dividends are handled in equity indices as well. Since dividends are assumed to be
reinvested in the index, the return of a stock in an index will differ from its return as a stand-alone investment.
This effect is far more pronounced in commodity indices, where cash generated (used) in rolls can exceed 1%
per month, depending on the commodity. 3 This is different from the approach taken in most commodity indices, which hold the number of futures
contracts constant when rolling but require adding or removing cash when the forward curve for the commodity
is not flat. 4 Note that the different mix of nearby and deferred contracts means that the amount of (notional) capital
invested in these factors will differ when the forward curve for the commodity is not flat. 5 While the difference between cash and Treasury bills may seem minor, the important distinction is that cash
generated from sales is not reinvested in the index as a whole. Each of the component commodity markets is
self-contained, and each market maintains its own Treasury bill balance. 6 Note that the rebalancing also applies to the Treasury bill allocation in the individual commodity markets. If a
given commodity increases in value by more than the index as a whole, all three positions (nearby futures,
deferred futures, and Treasury bills) will be reduced proportionally to bring the commodity to its neutral weight in
the index. 7 Please refer to the index methodology document for details on this calculation. 8 There is little difference in results if position sizes are held constant and the amount of notional capital is
allowed to vary. Furthermore, the difference that is measured using this approach improves the performance of
the Relative Roll factor as compared to the Beta factor. 9 This was done in order to simplify the analysis. Rebalancing the hedged factor positions each day was
explored and has a small negative impact on the returns to the Relative Roll and momentum factors.
10 See section 3.2 for more details. 11 The index was rebalanced on March 3, 2008. At that time, overall sector allocations remain unchanged, but
ICE Gas Oil was added to the index, increasing the total commodity futures market positions to 19 from 18. 12 Standard deviation and correlation figures were also calculated using daily returns. The differences were not
material. 13 The attribution of Relative Roll and Momentum returns to Roll rather than Spot return is largely an artifact of
the way these returns are commonly defined. Since Roll return is defined as return not attributable to an
increase or decrease in the price of the commodity, excess returns generated using any trading strategy that
has a zero average exposure to the commodity will be attributed to Roll. 14 This is consistent with the notion that a supply disruption results in both higher spot prices and greater
backwardation. Since the Relative Roll factor earns profits from contango and loses in periods of
backwardation, a negative correlation between these factors is likely to persist. 15 This is expected. All indices have a large allocation to energy, energy markets are the most volatile markets in
the commodity indices, and the energy markets have the largest intra-group correlation.