Embed Size (px)
Citation preview
Dropping the Ax: Illegal Firings During Union Election Campaigns
John Schmitt and Ben Zipperer
January 2007 Center for Economic and Policy Research 1611 Connecticut Avenue, NW, Suite 400 Washington, D.C. 20009 202-293-5380 www.cepr.net
i
Contents
Summary................................................................................................................................................1
Introduction..........................................................................................................................................2
The Data and Methodology................................................................................................................4
The Rise of Card Check Organizing Strategies ...............................................................................7
Illegal Firings Since the Mid-1970s....................................................................................................9
Longer-term Trends ..........................................................................................................................14
Conclusion ..........................................................................................................................................17
References ...........................................................................................................................................18
Data Appendix ...................................................................................................................................19
About the Authors
John Schmitt is a Senior Economist and Ben Zipperer is a Research Assistant at the Center for Economic and Policy Research in Washington, DC.
Acknowledgements
We thank Pranav Vaidya and Robert Henline for assistance with the data, and Dean Baker, Heather Boushey, Kate Bronfenbrenner, and Liz Chimienti for many helpful comments.
Dropping the Ax: Illegal Firings During Union Election Campaigns 1
Summary This paper uses published data from the National Labor Relations Board (NLRB) to update an index, first developed by Weiler (1983) and modified by LaLonde and Meltzer (1991), of the probability that a pro-union worker will be fired in the course of a union election campaign. The paper uses the more conservative LaLonde and Meltzer methodology and makes adjustments for the rise from the mid-1990s in card-check-based organizing campaigns. We find a steep rise in the 2000s relative to the last half of the 1990s in illegal firings of pro-union workers. By 2005, pro-union workers involved in union election campaigns faced about a 1.8 percent chance of being illegally fired during the course of the campaign. Even after we (over) adjust for the rise in card-check-based organizing campaigns, pro-union workers in 2005 appeared to have a 1.4 percent chance of being illegally fired. If we assume that employers target union organizers and activists, and that union organizers and activists make up about 10 percent of pro-union workers, our estimates suggest that almost one-in-five union organizers or activists can expect to be fired as a result of their activities in a union election campaign. Even after we adjust for the increase in organizing campaigns not built around NLRB-elections, our calculations suggest that about one-in-seven union organizers and activists are illegally fired while trying to organize unions at their place of work.
Center for Economic and Policy Research, January 2007 2
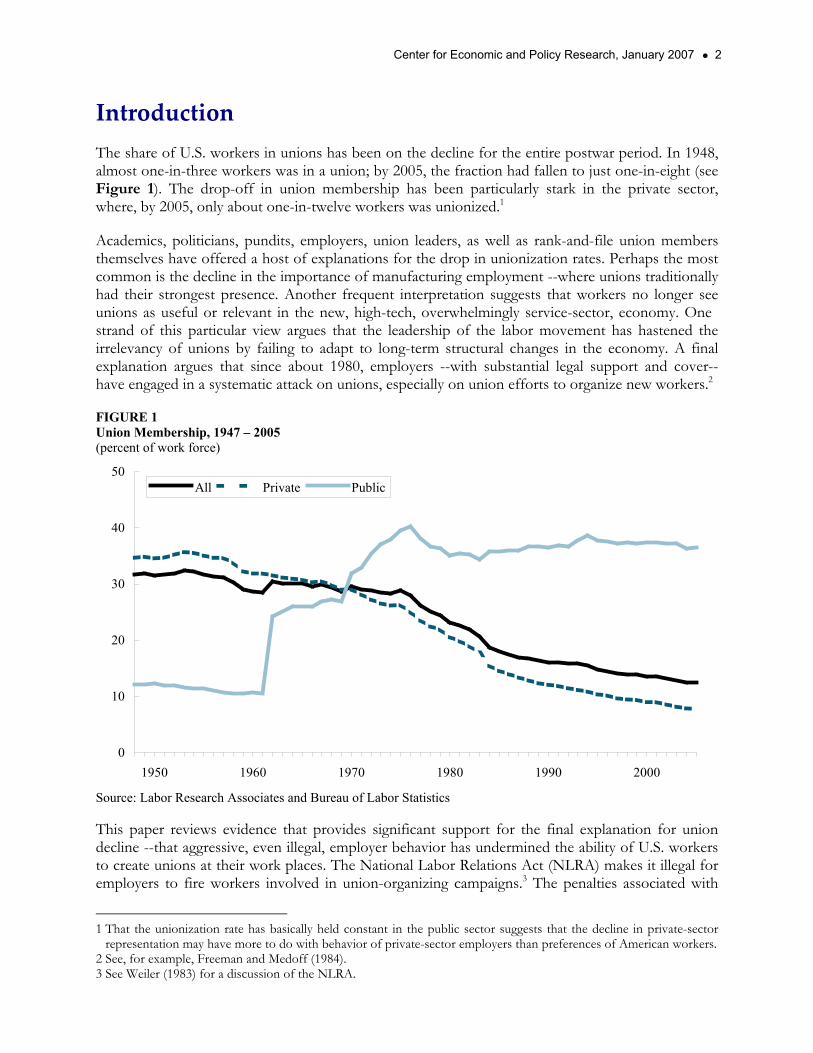
Introduction The share of U.S. workers in unions has been on the decline for the entire postwar period. In 1948, almost one-in-three workers was in a union; by 2005, the fraction had fallen to just one-in-eight (see Figure 1). The drop-off in union membership has been particularly stark in the private sector, where, by 2005, only about one-in-twelve workers was unionized.1
Academics, politicians, pundits, employers, union leaders, as well as rank-and-file union members themselves have offered a host of explanations for the drop in unionization rates. Perhaps the most common is the decline in the importance of manufacturing employment --where unions traditionally had their strongest presence. Another frequent interpretation suggests that workers no longer see unions as useful or relevant in the new, high-tech, overwhelmingly service-sector, economy. One strand of this particular view argues that the leadership of the labor movement has hastened the irrelevancy of unions by failing to adapt to long-term structural changes in the economy. A final explanation argues that since about 1980, employers --with substantial legal support and cover-- have engaged in a systematic attack on unions, especially on union efforts to organize new workers.2
FIGURE 1 Union Membership, 1947 – 2005 (percent of work force)
Source: Labor Research Associates and Bureau of Labor Statistics This paper reviews evidence that provides significant support for the final explanation for union decline --that aggressive, even illegal, employer behavior has undermined the ability of U.S. workers to create unions at their work places. The National Labor Relations Act (NLRA) makes it illegal for employers to fire workers involved in union-organizing campaigns.3 The penalties associated with
1 That the unionization rate has basically held constant in the public sector suggests that the decline in private-sector
representation may have more to do with behavior of private-sector employers than preferences of American workers. 2 See, for example, Freeman and Medoff (1984). 3 See Weiler (1983) for a discussion of the NLRA.
0
10
20
30
40
50
1950 1960 1970 1980 1990 2000
All Private Public
Dropping the Ax: Illegal Firings During Union Election Campaigns 3
"discriminatory discharges" under the NLRA, however, are small: back pay for illegally fired workers minus any earnings that workers had after they were fired.4 Given these small penalties for illegal firings, the NLRA, in practice, has given employers a powerful anti-union strategy: fire one or more prominent pro-union employees --typically workers involved in organizing the union-- with the hope of disrupting the internal workings of the union's campaign, while intimidating the rest of the potential bargaining unit in advance of the National Labor Relations Board (NLRB)-supervised representation election.
The NLRB publishes annual data on its determinations of "discriminatory discharges" in the context of union-election campaigns. In this report, we review those data and use a methodology first employed by Weiler (1983) and subsequently critiqued and modified by LaLonde and Meltzer (1991) to estimate the probability that a pro-union worker is fired in connection with a union-organizing election. We also use the same data and related methods to calculate several related indicators of employer behavior and union success in union-organizing elections.
According to the NLRB data, and following LaLonde and Meltzer's methodology, since about 2000, pro-union workers involved in union-election campaigns have seen a substantial increase in their likelihood of being fired illegally. In the 1970s, a pro-union worker involved in a union-organizing campaign faced about a 1-in-100 chance of being fired illegally. The probability of being fired reached its historical peak in the first half of the 1980s, with about 1-in-42 pro-union workers being fired illegally. From the second half of the 1980s through the second half of the 1990s, the likelihood of a being fired declined steadily but remained high, reaching about 1-in-87 pro-union workers by the end of the period. From 2000 on, however, the likelihood that a pro-union worker would be fired in a union-election campaign has jumped sharply --to about 1 in every 53 pro-union workers.
Weiler (1983) and LaLonde and Meltzer (1991) have emphasized the probability that a pro-union worker will be fired in a union-election campaign, but employers engaging in illegal firing activities will generally discharge key union activists, rather than random employees believed to be sympathetic to the union. If we assume that ten percent of pro-union workers are union activists, then we can estimate that in 2005 union activists faced almost a 20 percent chance of being fired during a union-election campaign.
By the mid-1990s, unions appear to have adapted their traditional organizing strategies to reduce the scope for employer's ability to fire pro-union workers in an effort to block union-organizing campaigns. A key element of the new union strategy involves "card-check" campaigns that seek union representation without a formal NLRB election. Even after we make what is probably an overly conservative adjustment to the Weiler and LaLonde and Meltzer statistic to take the rise in card-check campaigns into account, the NLRB data show a substantial increase during the 2000s in illegal firings as an anti-union strategy.
4 See Dunlop Commission (1994), Chapter 3, p. 71. In 1990, the Dunlop Commission notes, "...the average back pay
award amounted to $2,749 per discharge."
Center for Economic and Policy Research, January 2007 4
The Data and Methodology Each year, the NLRB publishes data on the progress and outcomes of a wide range of legal actions connected with the NLRA. The published data include detailed information on the outcomes of union-organizing elections and investigations of "discriminatory discharges" under the NLRA.
In the early 1980s, Harvard Law School professor Paul Weiler (1983) used three decades of the NLRB's published data to estimate the probability that a pro-union worker involved in a union organizing campaign would be the victim of a discriminatory discharge. The NLRB annual reports provided data that allowed Weiler to estimate both the number of workers that were fired illegally (as determined by NLRB's rulings after reviewing cases brought before it) and the number of pro-union workers involved in union election campaigns over roughly the same period of time as the discriminatory discharges. Weiler's review of the data and his particular methodology led him to conclude that, in 1980, the "...odds are about one in twenty that a union supporter will be fired for exercising rights supposedly guaranteed by federal law a half-century ago."5
Economist Robert LaLonde and law professor Bernard Meltzer, both of the University of Chicago, however, disputed aspects of Weiler's methodology and published an extensive critique and re-examination of the data in 1991 (LaLonde and Meltzer, 1991).6 The main thrust of their technical criticisms was that Weiler's methodology tended to overstate the number of workers that were discharged in connection with union-election campaigns (primarily because, in LaLonde and Meltzer's view, an important portion of fired workers were fired in contexts other than union-organizing campaigns). LaLonde and Meltzer suggested and implemented several changes to Weiler's methodology and concluded that the probability that a pro-union worker would be fired in connection with a union-election campaign was between 50 and 70 percent lower than originally calculated by Weiler.7 LaLonde and Meltzer, for example, concluded that in 1980 the odds were about one-in-sixty-three that a pro-union worker faced discriminatory discharge in connection with a union election, compared to the 1-in-20 odds calculated by Weiler from the same data.8
In this report, we follow the more conservative methodology proposed by LaLonde and Meltzer, and use the last fifteen years of NLRB data to update their earlier work. The basic strategy involves using published data from the NLRB on "remedial actions taken in unfair labor practice cases closed," the "final outcome of representation elections in cases closed," and "valid votes cast in representation elections in cases closed" to produce annual estimates of both the number of workers fired illegally ("discriminatory discharges") and the number of pro-union workers involved in union-election campaigns. Together, these two figures allow us to calculate the probability that a pro-union worker is fired illegally in connection with a union-election campaign.9
5 Weiler, 1983, p. 1781. He continues: "Such a widespread pattern of employer intimidation has ramifications that reach
far beyond the units in which discharges actually occur. It fosters an environment in which employees will take very seriously even subtle warnings about the consequences of joining a union."
6 For Weiler's response to LaLonde and Meltzer, see Weiler (1991). 7 Compare panels A and B in LaLonde and Meltzer (1991), Table 7. 8 LaLonde and Meltzer note: "Even the 1 in 63 ratio manifestly represents a serious denial of statutory rights to
individual employees and a potentially serious impediment to effective union organization." (p. 992) 9 Following an October 20, 2006, telephone conversation with Patricia Gilbert, Associate Director of the NLRB's
Division of Information, we have excluded as almost certainly inaccurate the extremely high illegal firings and related data from 1994.
Dropping the Ax: Illegal Firings During Union Election Campaigns 5
The NLRB does not report the number of workers fired illegally in connection with union election campaigns. The NLRB, however, does give the total number of cases closed each year that ended with the NLRB ordering the reinstatement of fired workers. Following LaLonde and Meltzer (1991, pp. 990-98), we assume that 51 percent of these cases each year corresponded to dismissals during union-election campaigns.10 Also following LaLonde and Meltzer, we assume that each case involved, on average, 2.2 workers.11 In order to estimate the number of workers fired illegally during union election campaigns in 2000,12 for example, we first take the number of "employees offered reinstatement" in that year (1,224 cases) and multiply that number by 0.51, to find the total number of reinstatement offers that were connected to a union election campaign (624 cases). We then multiply our estimate of the total number of cases with illegal firings by 2.2 employees per case to arrive at the total number of workers illegally fired in connection with a union election campaign: 1,373.
Once we have an estimate of the total number of illegal firings connected to union-election campaigns, we can easily calculate the likelihood that a pro-union worker will be fired during a union-election campaign. The NLRB annual reports provide detailed breakdowns of voting in union-representation elections.13 Following Weiler (1983) and LaLonde and Meltzer (1991), we take the total number of pro-union voters (in all elections, regardless of the outcome of the election) from the NLRB and use this to calculate a crude "probability" that a pro-union worker will be fired. Continuing with the example of the year 2000, the NLRB data show 100,815 workers voted in favor of union representation in NLRB elections.14 The ratio of 1,373 illegally fired employees to 100,815 pro-union workers in union election campaigns yields the probability that a pro-union worker loses his or her job during a union election campaign: 1,373/100,815, or 1.4 percent, which represents about one in every 73 pro-union workers.
Several features of the data and methodology could act to raise or lower our estimates relative to the true level of illegal firings connected to union-organizing campaigns. The first issue concerns our decision to count as illegally fired only those workers who were offered reinstatement by the NLRB. By limiting our analysis only to those workers to whom the NLRB offered reinstatement, we likely understate the number of illegal firings relative to the true number. Discriminatory discharge cases typically follow a particular pattern. Workers initially file a formal complaint with the NLRB; then, after reviewing the case, the NLRB's General Counsel decides whether the case has merit; and, finally, the NLRB decides whether to find that an unlawful discharge took place and, if so, whether to issue an order for reinstatement and back pay. Since employers may agree to settle some portion of cases with merit after the second stage and before the final decision by the NLRB, our decision to
10 LaLonde and Meltzer (1991) found that: "... 50 percent of the [NLRB's] reinstatement orders were based on employer
violations during organizational drives." (p. 990) In a subsequent footnote (134, p. 991), they indicate that the 50 percent figure was rounded from 0.51.
11 LaLonde and Meltzer base their estimate of 2.2 workers per case on a GAO review of a sample of NLRB cases. According to LaLonde and Meltzer, the GAO derived the figure "...by dividing the number of employees allegedly discharged during organizational drives (394) by the number of complaints alleging such firings (176)." (p. 991, footnote 136)
12 All NLRB data reported here refer to fiscal years of the federal government. 13 We take the rest of the data we report, including the number of pro-union voters in union election campaigns,
directly from the NLRB's Tables 13 and 14. 14 See NLRB Annual Report 2000, Table 14; of these 100,815 votes in favor of union representation, 61,466 were cast
in "RC" elections where the union won; 38,539 were cast in "RC" elections where the union lost; 614, in "RM" elections where the union won; and 373 in "RM" elections where the union lost.
Center for Economic and Policy Research, January 2007 6
count as illegal firings only those cases where the NLRB issued an order for reinstatement likely leads us to understate the true number of illegally fired workers.15
A second data issue is that we cannot distinguish between union-organizing campaigns that culminated in an election and union-organizing campaigns that were abandoned before an election was held.16 This feature of the data will have the effect of increasing the number of illegally discharged workers per union-organizing election since some portion of the workers were fired illegally during campaigns that did not result in an election.17 As LaLonde and Meltzer (1991) explain: "...the numerator includes discharges during all phases of an organizational campaign, whereas the denominator measures the number of organizational campaigns by the number of elections. Because not all organizing drives lead to a petition, let alone an election, the number of organizational campaigns is greater than the number of NLRB elections. Hence, the ... figure derived ... may well overstate the frequency of discriminatory discharges aimed at averting unionization." (p. 991)
Third, the NLRB procedures to handle discriminatory discharge complaints take time, often more than a year, which means that some of the cases of illegal firings that were closed in a particular year may actually reflect cases concerning employer actions taken in an earlier year. This mismatch will likely lead our estimates of illegal firings to overstate the true number in some years and understate the true number in other years. To diminish the effects of these procedural lags, we sometimes use three-year trailing averages to summarize illegal firing activity.
Finally, our analysis applies only to workers covered by the NLRA. The NLRA does not cover public-sector workers and some workers in the private sector, most notably agricultural laborers and workers covered by the Railway Labor Act. As a result, our estimates exclude workers fired for union activity in these uncovered sectors, but also excludes pro-union workers in these sectors.
15 See LaLonde and Meltzer, p. 990. We may also understate the number of illegal firings because some illegally fired
workers may choose not appeal to the NLRB because the potential gains --reinstatement and back pay (less any interim earnings) may be small relative to the cost and inconvenience involved in pressing their case.
16 A related issue is the potential impact on our numbers of a decision by unions to plan organizing campaigns around "card-check" recognition rather than an NLRB election. If unions decided to increase systematically the use of this organizing route, and employers resisted card-check campaigns by engaging in illegal firings in the same way that they would have in more standard NLRB election, then our estimate of illegal firings per pro-union worker in an NLRB election would rise, even though the true probability of being fired was unchanged.
17 See LaLonde and Meltzer, p. 991.
Dropping the Ax: Illegal Firings During Union Election Campaigns 7
The Rise of Card Check Organizing Strategies Finally, an increasing reliance on "card-check" organizing strategies complicates both the calculation and interpretation of our findings. Beginning in the mid-1960s, unions began to adapt more aggressively and more successfully to employer "union avoidance" strategies. An important component of these strategic changes by unions was a shift away from the traditional NLRB election process toward organizing campaigns centered around "card-check" recognition. In a traditional organizing campaign, unions collect a signed card from a majority of the eligible workers at an establishment asking for union representation. The union then presents these cards to management, which generally requests that the NLRB supervise an election with a secret ballot in order to verify the outcome of the union card collection. The period between the time when unions present management with the signed cards and the actual NLRB-supervised election is typically the most active period for employers that engage in aggressive and illegal anti-union behavior, including illegal firings. Employers, however, also have the option to recognize the union based only on the results of union card collection, without having to verify the results by a secret ballot. While the decision to recognize the union after an initial card check and before a formal election resides solely with employers, unions have developed organizing strategies around bringing pressure against employers to recognize the union at the time of the card check, which is often the first time that the employer learns of the union's efforts to organize a workplace. The advantages for the unions are clear, including avoiding private employer meetings with workers, threats of plant closings, and illegal firings. The advantages for employers, even strongly anti-union employers, can also be significant, especially if the union organizing campaign has succeeded in building a solid internal organizing structure and has managed to marshal significant outside support for the organizing campaign (for example, from community groups, religious organizations, local politicians, and others).18
The move away from traditional NLRB-supervised elections to card check affects our calculations, and especially the interpretation of our calculations, in complex ways. One interpretation of the exercise we're performing here is that we are attempting to create an index of underlying employer aggressiveness with respect to unions. Our main indicator of that unobserved condition is employers' willingness to fire workers illegally for union-organizing activity. For the period prior to the mid-1990s when unions primarily pursued NLRB-election focused strategies, the incidence of illegal firings was a reasonable and consistent proxy for underlying employer aggressiveness. In the mid-1990s, however, directly in response to sustained employer aggressiveness, unions changed strategies, in part, explicitly to reduce the likelihood that employers would fire pro-union activists involved in election-oriented organizing campaigns.
This change in union strategy will affect both the numerator and the denominator of the ratio of illegally fired workers to pro-union workers, which is the main focus of our analysis here. To the extent that the union strategy was successful, the shift to card check after the mid-1990s will have reduced the incidence of illegal firings. This lowers the numerator in the ratio, reducing the apparent probability that a pro-union worker will be fired illegally. But, the resulting decline in illegal firings under these circumstances is not the result of a decline in anti-union behavior by employers, but rather the result of an adaptive strategy employed by unions. Without any modifications or reinterpretations, our simple indicator of employer aggressiveness may give misleading results after the mid-1990s swing to card-check, by suggesting that anti-union behavior by employers is on the 18 For a discussion of "union avoidance" strategies, see Levitt (1993) and Smith (2003); for a discussion of threats of
plant closings, see Bronfenbrenner (2000, 2001); for a discussion of the strategic response of organized labor from the 1990s on, see Bronfenbrenner, Friedman, Hurd, Oswald, and Seeber (1998) and Brudney (2005).
Center for Economic and Policy Research, January 2007 8
decline, when what is really happening is that unions have simply been more effective in counteracting a particular set of employer behaviors.
The new union organizing strategy will also affect the denominator of the ratio. The card-check strategy has explicitly sought to avoid NLRB-supervised elections, which will have the effect of lowering the number of elections and therefore the number of votes cast in favor of unions. Since the number of votes cast in favor of unions is our proxy for the number of pro-union workers involved in organizing campaigns, the decline in the number of elections (relative to the total number of newly organized workers), all else constant, will act to increase the probability that a worker faces illegal firing conditional on supporting a union-organizing campaign.
We have several possible ways to address the issues raised by the change in the mid-1990s in union-organizing strategies. One option is to do nothing other than to clarify the meaning of our principal statistics. The procedures initially proposed by Weiler (1983) and LaLonde and Meltzer (1991), and later adopted by the Dunlop Commission (1994), continue to capture accurately the number of illegally fired workers per pro-union worker involved in an election-based union-organizing campaign. Unions are now less likely to take an organizing effort to an NLRB-election, but when unions do pursue a more traditional election-based strategy, our statistic captures employer opposition reasonably well, and arguably as well as it always has.
A second approach involves attempting to "correct" for the decline in union elections. Below we report adjusted numbers that effectively add the estimated pro-union portion of workers involved in card-check campaigns back into the total pool of pro-union workers that voted in NLRB elections. This is not entirely satisfactory, however, because while we can fairly easily add workers involved in card-check campaigns back into our calculations, we don't know how also to add back in the workers who would have been illegally fired if the union had decided to conduct an NLRB election rather than a card-check campaign.19 We note that probably the best easily available estimate of these counterfactual illegal firings would be to assume that the likelihood of being fired in the absence of card check would be identical to the probability of being fired in the actual election-based campaigns that did take place. If we took this approach, however, we would end up effectively with the first option above --doing nothing-- since we would be making proportional additions to the numerator and the denominator, leaving our "adjusted" estimates identical to the unadjusted ones. In what we report below, however, we only adjust the denominator in the main ratio of interest. We add a portion of workers involved in card-check campaigns back into our estimate of pro-union workers, but make no adjustment to the number of workers who were illegally fired.20 This has the unambiguous effect of lowering our estimate of the probability of a pro-union worker illegally losing his or her job relative to not making the adjustment.
19 Eaton and Kriesky (2001) "...find strong evidence that card-check agreements reduced management campaigning, as
well as the use of illegal tactics such as discharges and promises of benefits, and also substantially increased the union recognition rate."
20 See Appendix Table 2 and related discussion for a description of how we adjust the number of pro-union workers.
Dropping the Ax: Illegal Firings During Union Election Campaigns 9
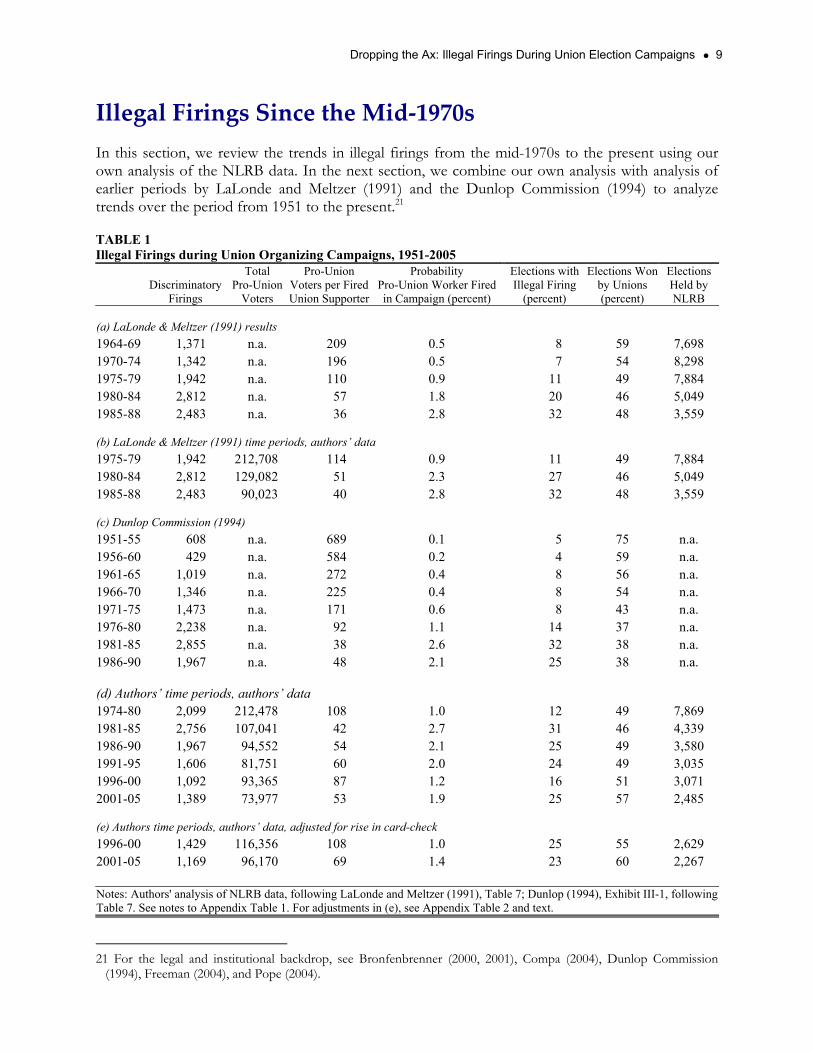
Illegal Firings Since the Mid‐1970s In this section, we review the trends in illegal firings from the mid-1970s to the present using our own analysis of the NLRB data. In the next section, we combine our own analysis with analysis of earlier periods by LaLonde and Meltzer (1991) and the Dunlop Commission (1994) to analyze trends over the period from 1951 to the present.21
TABLE 1 Illegal Firings during Union Organizing Campaigns, 1951-2005
Discriminatory
Firings
Total Pro-Union
Voters
Pro-Union Voters per Fired Union Supporter
Probability Pro-Union Worker Fired in Campaign (percent)
Elections with Illegal Firing
(percent)
Elections Won by Unions (percent)
Elections Held by NLRB
(a) LaLonde & Meltzer (1991) results 1964-69 1,371 n.a. 209 0.5 8 59 7,698 1970-74 1,342 n.a. 196 0.5 7 54 8,298 1975-79 1,942 n.a. 110 0.9 11 49 7,884 1980-84 2,812 n.a. 57 1.8 20 46 5,049 1985-88 2,483 n.a. 36 2.8 32 48 3,559 (b) LaLonde & Meltzer (1991) time periods, authors’ data 1975-79 1,942 212,708 114 0.9 11 49 7,884 1980-84 2,812 129,082 51 2.3 27 46 5,049 1985-88 2,483 90,023 40 2.8 32 48 3,559 (c) Dunlop Commission (1994) 1951-55 608 n.a. 689 0.1 5 75 n.a. 1956-60 429 n.a. 584 0.2 4 59 n.a. 1961-65 1,019 n.a. 272 0.4 8 56 n.a. 1966-70 1,346 n.a. 225 0.4 8 54 n.a. 1971-75 1,473 n.a. 171 0.6 8 43 n.a. 1976-80 2,238 n.a. 92 1.1 14 37 n.a. 1981-85 2,855 n.a. 38 2.6 32 38 n.a. 1986-90 1,967 n.a. 48 2.1 25 38 n.a. (d) Authors’ time periods, authors’ data 1974-80 2,099 212,478 108 1.0 12 49 7,869 1981-85 2,756 107,041 42 2.7 31 46 4,339 1986-90 1,967 94,552 54 2.1 25 49 3,580 1991-95 1,606 81,751 60 2.0 24 49 3,035 1996-00 1,092 93,365 87 1.2 16 51 3,071 2001-05 1,389 73,977 53 1.9 25 57 2,485 (e) Authors time periods, authors’ data, adjusted for rise in card-check 1996-00 1,429 116,356 108 1.0 25 55 2,629 2001-05 1,169 96,170 69 1.4 23 60 2,267 Notes: Authors' analysis of NLRB data, following LaLonde and Meltzer (1991), Table 7; Dunlop (1994), Exhibit III-1, following Table 7. See notes to Appendix Table 1. For adjustments in (e), see Appendix Table 2 and text. 21 For the legal and institutional backdrop, see Bronfenbrenner (2000, 2001), Compa (2004), Dunlop Commission
(1994), Freeman (2004), and Pope (2004).
Center for Economic and Policy Research, January 2007 10
Table 1 summarizes our results, along with those of LaLonde and Meltzer (1991) and the Dunlop Commission (1994), over approximately five-year periods from 1951 to the present. A comparison of the first two panels of the table show a close match between LaLonde and Meltzer's original published results and our own replication of their results using the NLRB data across three time periods from 1974.22
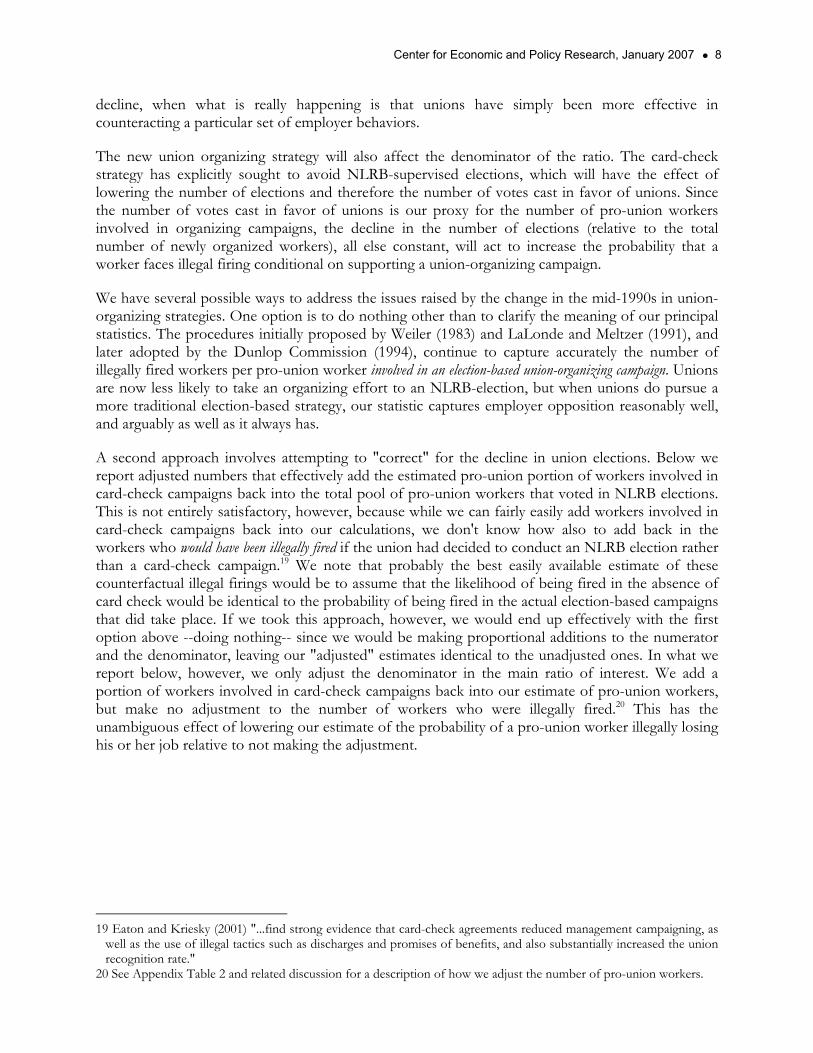
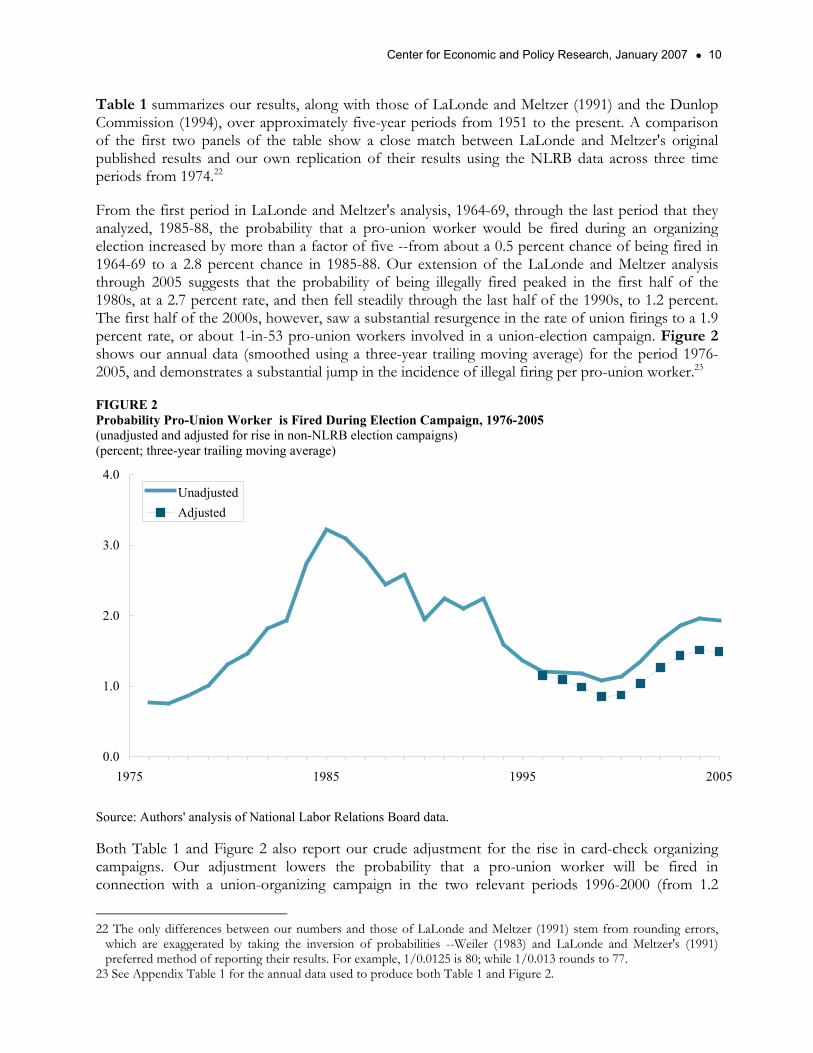
From the first period in LaLonde and Meltzer's analysis, 1964-69, through the last period that they analyzed, 1985-88, the probability that a pro-union worker would be fired during an organizing election increased by more than a factor of five --from about a 0.5 percent chance of being fired in 1964-69 to a 2.8 percent chance in 1985-88. Our extension of the LaLonde and Meltzer analysis through 2005 suggests that the probability of being illegally fired peaked in the first half of the 1980s, at a 2.7 percent rate, and then fell steadily through the last half of the 1990s, to 1.2 percent. The first half of the 2000s, however, saw a substantial resurgence in the rate of union firings to a 1.9 percent rate, or about 1-in-53 pro-union workers involved in a union-election campaign. Figure 2 shows our annual data (smoothed using a three-year trailing moving average) for the period 1976-2005, and demonstrates a substantial jump in the incidence of illegal firing per pro-union worker.23
FIGURE 2 Probability Pro-Union Worker is Fired During Election Campaign, 1976-2005 (unadjusted and adjusted for rise in non-NLRB election campaigns) (percent; three-year trailing moving average)
0.0
1.0
2.0
3.0
4.0
1975 1985 1995 2005
UnadjustedAdjusted
Source: Authors' analysis of National Labor Relations Board data. Both Table 1 and Figure 2 also report our crude adjustment for the rise in card-check organizing campaigns. Our adjustment lowers the probability that a pro-union worker will be fired in connection with a union-organizing campaign in the two relevant periods 1996-2000 (from 1.2
22 The only differences between our numbers and those of LaLonde and Meltzer (1991) stem from rounding errors,
which are exaggerated by taking the inversion of probabilities --Weiler (1983) and LaLonde and Meltzer's (1991) preferred method of reporting their results. For example, 1/0.0125 is 80; while 1/0.013 rounds to 77.
23 See Appendix Table 1 for the annual data used to produce both Table 1 and Figure 2.
Dropping the Ax: Illegal Firings During Union Election Campaigns 11
percent to 1.0 percent) and 2001-2005 (from 1.9 percent to 1.4 percent). The adjustment, however, does not affect the trend over time: both the adjusted and unadjusted data show a sharp climb in illegal firings over the last five years.
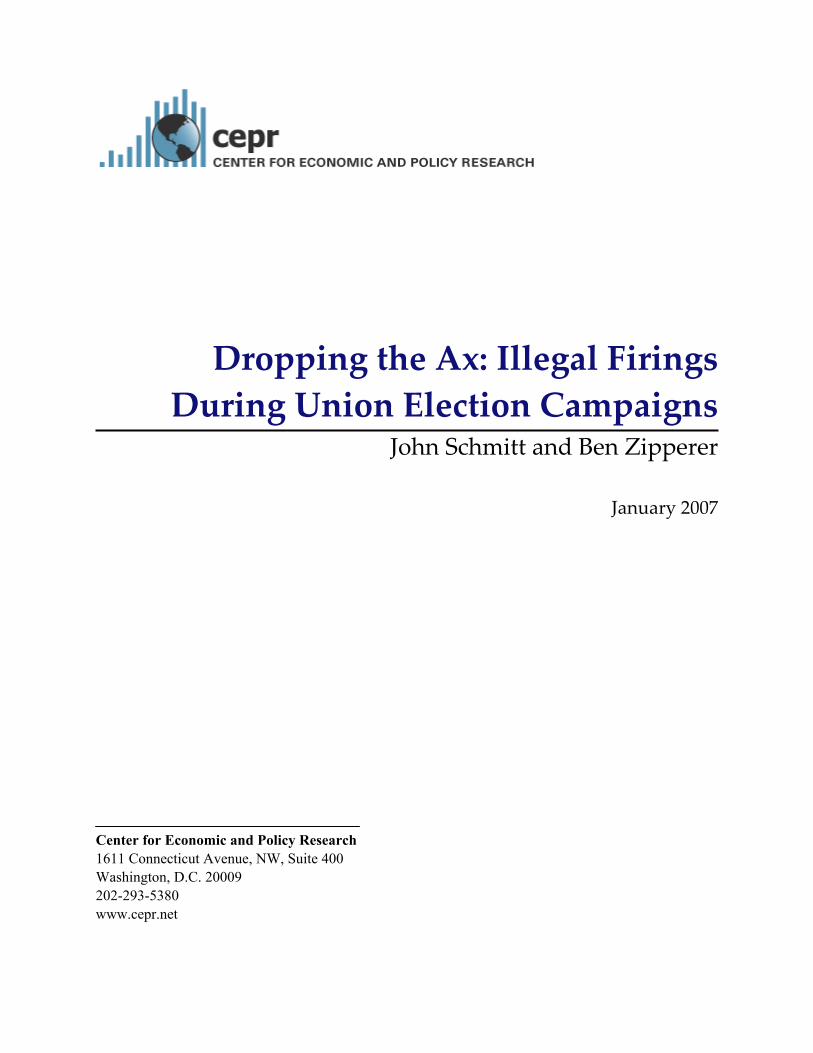
Weiler (1983) and LaLonde and Meltzer (1991) have emphasized the probability that a pro-union worker will be fired in a union-election campaign. Employers, however, are unlikely to fire workers randomly, or simply for expressing pro-union views. Employers maximize the return to illegal firing by focusing on union activists. If we assume that ten percent of pro-union workers are union activists, and that employers target union activists, then we estimate that in 2005 union activists faced about an 18 percent chance of being fired during a union-election campaign. If union activists represent 20 percent of all pro-union workers, then the probability that an activist is fired illegally in a union election campaign would be about 9 percent. If union activists represent only five percent of pro-union workers, then the probability that an activist is fired would rise to about 36 percent.24
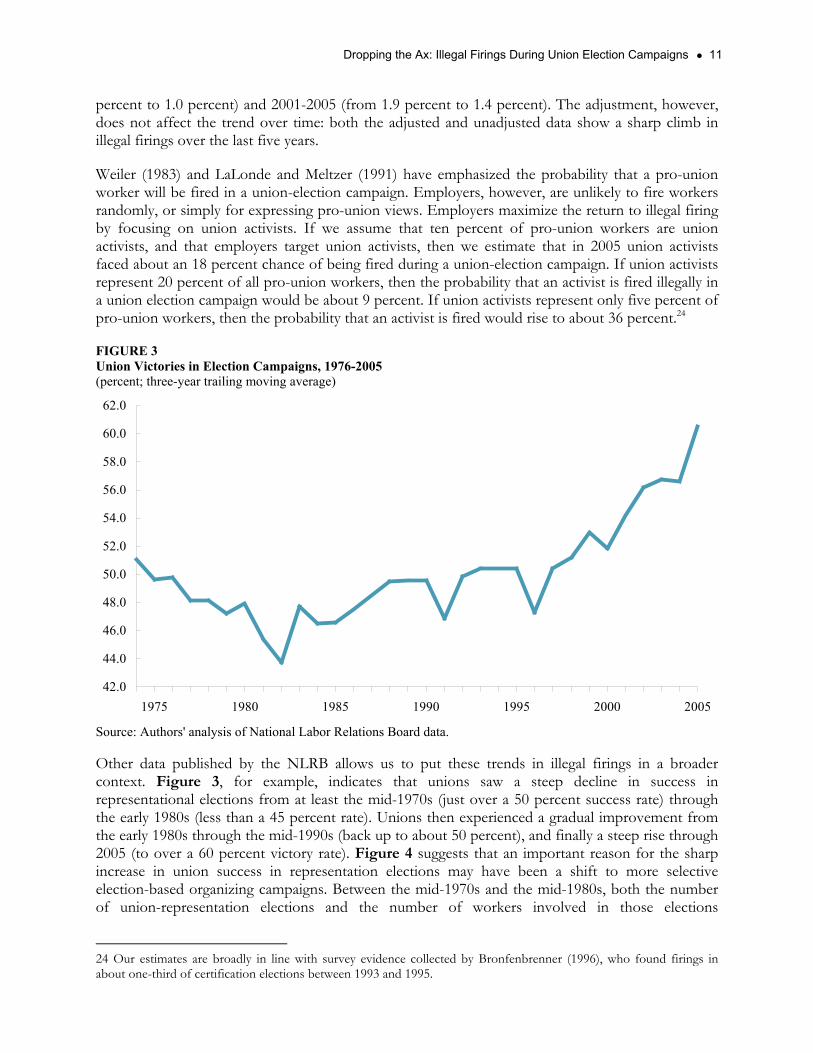
FIGURE 3 Union Victories in Election Campaigns, 1976-2005 (percent; three-year trailing moving average)
42.0
44.0
46.0
48.0
50.0
52.0
54.0
56.0
58.0
60.0
62.0
1975 1980 1985 1990 1995 2000 2005
Source: Authors' analysis of National Labor Relations Board data. Other data published by the NLRB allows us to put these trends in illegal firings in a broader context. Figure 3, for example, indicates that unions saw a steep decline in success in representational elections from at least the mid-1970s (just over a 50 percent success rate) through the early 1980s (less than a 45 percent rate). Unions then experienced a gradual improvement from the early 1980s through the mid-1990s (back up to about 50 percent), and finally a steep rise through 2005 (to over a 60 percent victory rate). Figure 4 suggests that an important reason for the sharp increase in union success in representation elections may have been a shift to more selective election-based organizing campaigns. Between the mid-1970s and the mid-1980s, both the number of union-representation elections and the number of workers involved in those elections
24 Our estimates are broadly in line with survey evidence collected by Bronfenbrenner (1996), who found firings in about one-third of certification elections between 1993 and 1995.
Center for Economic and Policy Research, January 2007 12
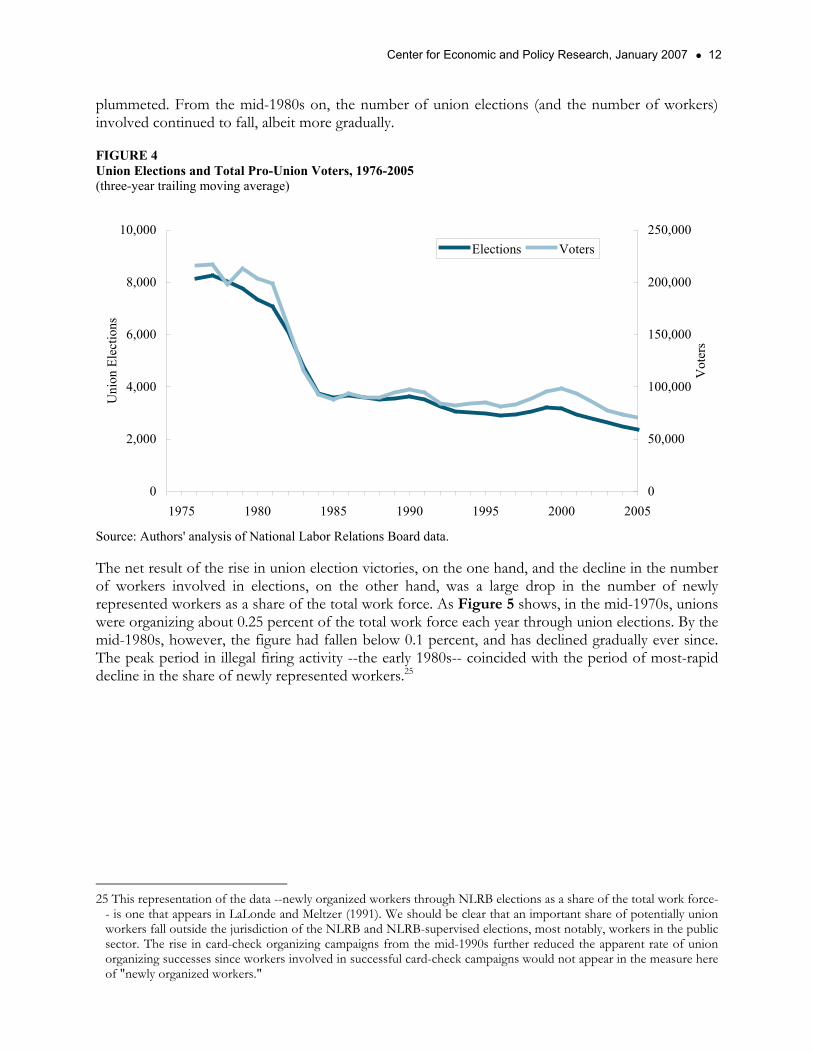
plummeted. From the mid-1980s on, the number of union elections (and the number of workers) involved continued to fall, albeit more gradually.
FIGURE 4 Union Elections and Total Pro-Union Voters, 1976-2005 (three-year trailing moving average)
0
2,000
4,000
6,000
8,000
10,000
1975 1980 1985 1990 1995 2000 2005
Uni
on E
lect
ions
0
50,000
100,000
150,000
200,000
250,000
Vot
ers
Elections Voters
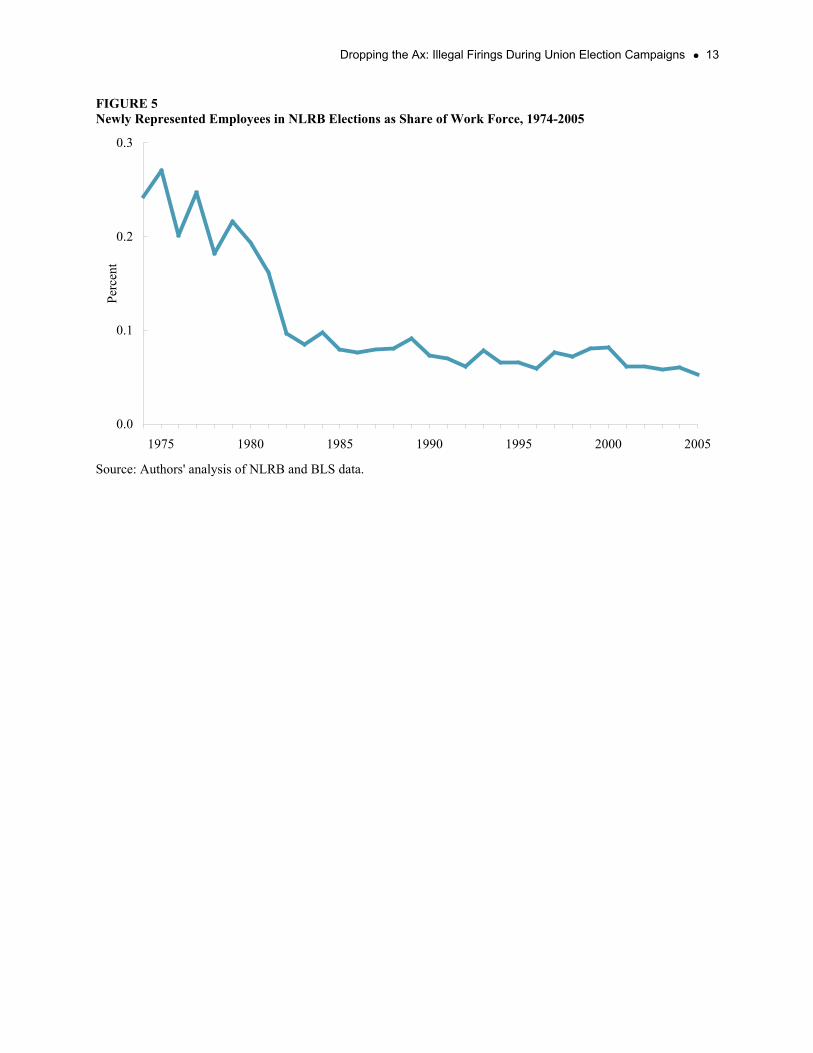
Source: Authors' analysis of National Labor Relations Board data. The net result of the rise in union election victories, on the one hand, and the decline in the number of workers involved in elections, on the other hand, was a large drop in the number of newly represented workers as a share of the total work force. As Figure 5 shows, in the mid-1970s, unions were organizing about 0.25 percent of the total work force each year through union elections. By the mid-1980s, however, the figure had fallen below 0.1 percent, and has declined gradually ever since. The peak period in illegal firing activity --the early 1980s-- coincided with the period of most-rapid decline in the share of newly represented workers.25
25 This representation of the data --newly organized workers through NLRB elections as a share of the total work force-
- is one that appears in LaLonde and Meltzer (1991). We should be clear that an important share of potentially union workers fall outside the jurisdiction of the NLRB and NLRB-supervised elections, most notably, workers in the public sector. The rise in card-check organizing campaigns from the mid-1990s further reduced the apparent rate of union organizing successes since workers involved in successful card-check campaigns would not appear in the measure here of "newly organized workers."
Dropping the Ax: Illegal Firings During Union Election Campaigns 13
FIGURE 5 Newly Represented Employees in NLRB Elections as Share of Work Force, 1974-2005
0.0
0.1
0.2
0.3
1975 1980 1985 1990 1995 2000 2005
Perc
ent
Source: Authors' analysis of NLRB and BLS data.
Center for Economic and Policy Research, January 2007 14
Longer‐term Trends In this section, we combine our direct analysis of the NLRB data for 1974-2005 with a similar analysis of the NLRB data by the Dunlop Commission (1994), which allows us to analyze trends, in five-year increments, over the period 1951-2005. A comparison of the third (Dunlop Commission) and fourth (our data) panels of Table 1 shows roughly similar results in both the Dunlop Commission and our own analysis of the NLRB data for the 1981-85 and 1986-90 periods, which are common to both analyses.
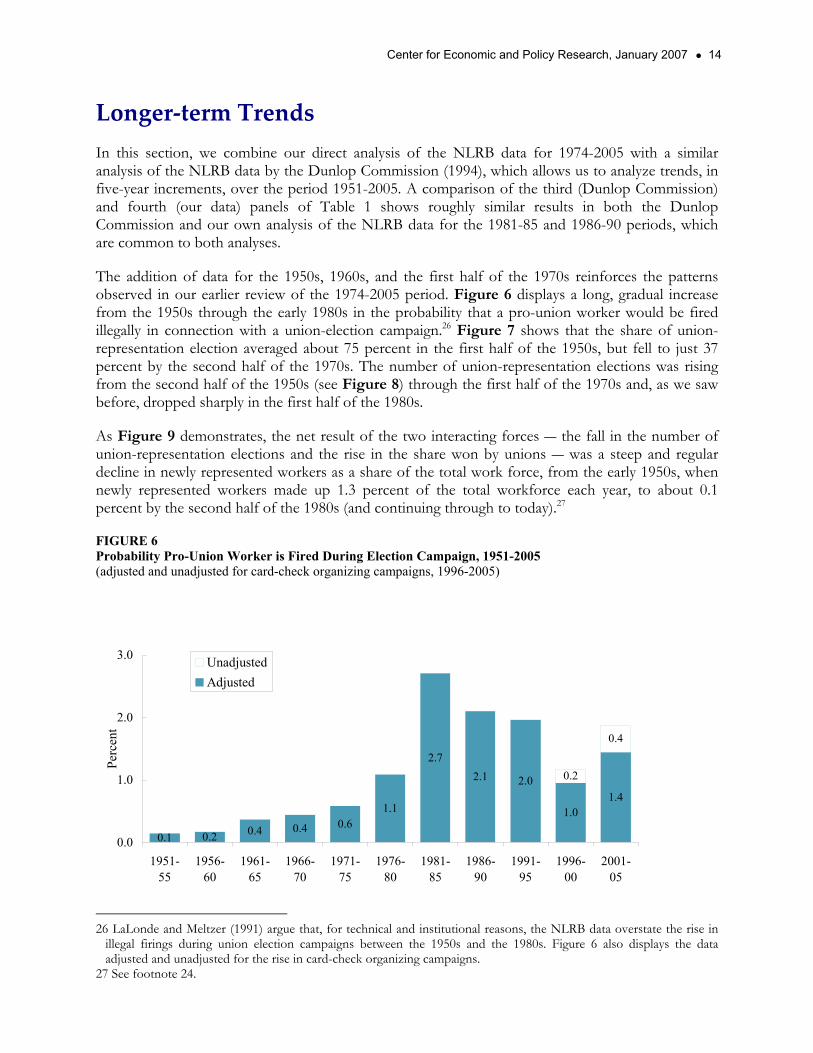
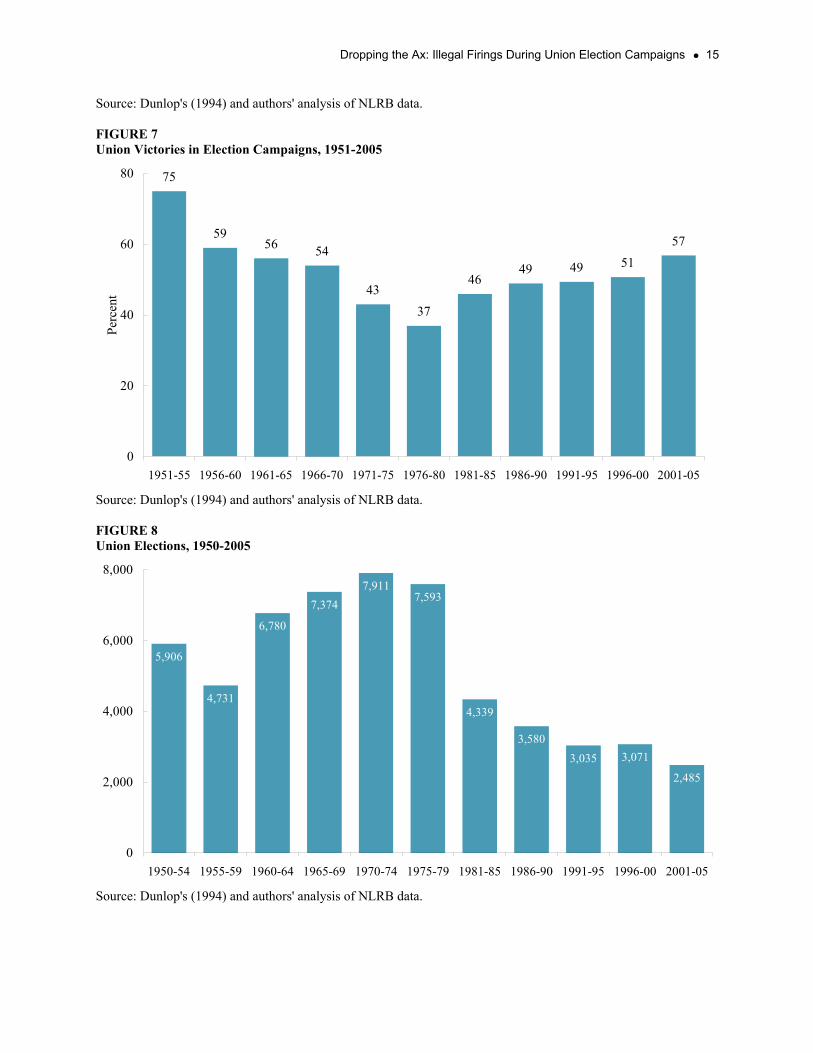
The addition of data for the 1950s, 1960s, and the first half of the 1970s reinforces the patterns observed in our earlier review of the 1974-2005 period. Figure 6 displays a long, gradual increase from the 1950s through the early 1980s in the probability that a pro-union worker would be fired illegally in connection with a union-election campaign.26 Figure 7 shows that the share of union-representation election averaged about 75 percent in the first half of the 1950s, but fell to just 37 percent by the second half of the 1970s. The number of union-representation elections was rising from the second half of the 1950s (see Figure 8) through the first half of the 1970s and, as we saw before, dropped sharply in the first half of the 1980s.
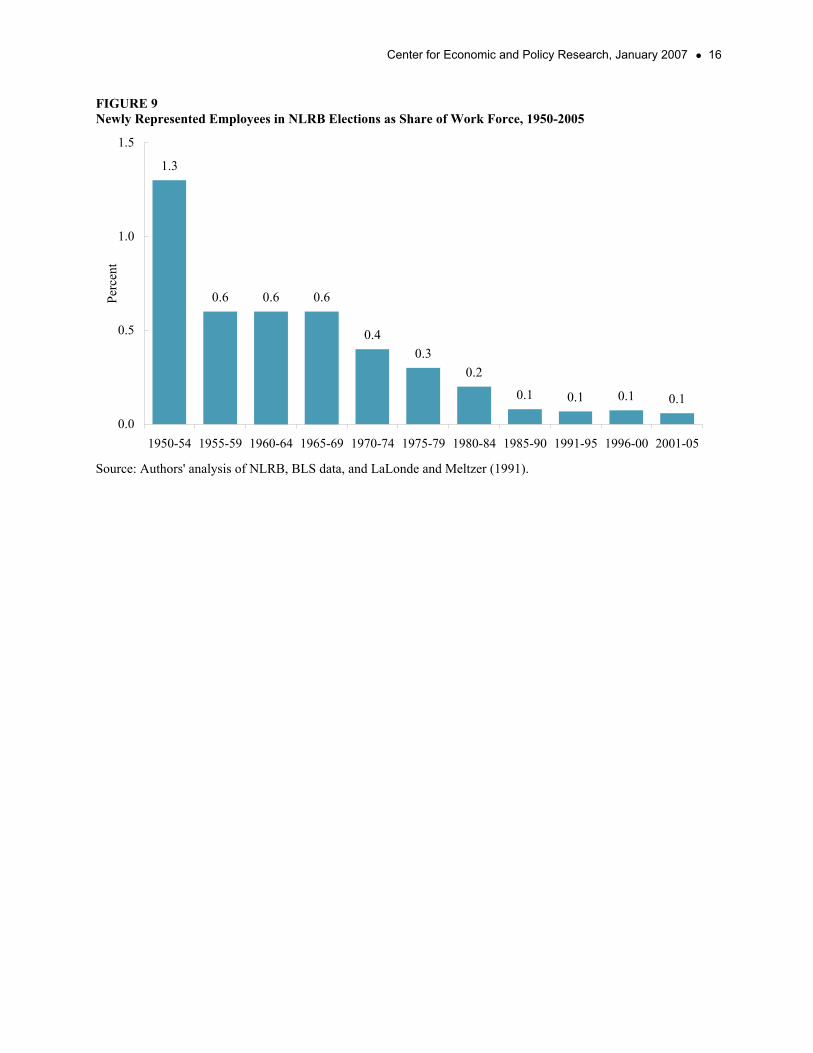
As Figure 9 demonstrates, the net result of the two interacting forces ― the fall in the number of union-representation elections and the rise in the share won by unions ― was a steep and regular decline in newly represented workers as a share of the total work force, from the early 1950s, when newly represented workers made up 1.3 percent of the total workforce each year, to about 0.1 percent by the second half of the 1980s (and continuing through to today).27
FIGURE 6 Probability Pro-Union Worker is Fired During Election Campaign, 1951-2005 (adjusted and unadjusted for card-check organizing campaigns, 1996-2005)
0.2 0.4 0.4 0.61.1
2.72.1 2.0
1.01.4
0.2
0.4
0.10.0
1.0
2.0
3.0
1951-55
1956-60
1961-65
1966-70
1971-75
1976-80
1981-85
1986-90
1991-95
1996-00
2001-05
Perc
ent
UnadjustedAdjusted
26 LaLonde and Meltzer (1991) argue that, for technical and institutional reasons, the NLRB data overstate the rise in
illegal firings during union election campaigns between the 1950s and the 1980s. Figure 6 also displays the data adjusted and unadjusted for the rise in card-check organizing campaigns.
27 See footnote 24.
Dropping the Ax: Illegal Firings During Union Election Campaigns 15
Source: Dunlop's (1994) and authors' analysis of NLRB data. FIGURE 7 Union Victories in Election Campaigns, 1951-2005
75
5956 54
4337
4649 49 51
57
0
20
40
60
80
1951-55 1956-60 1961-65 1966-70 1971-75 1976-80 1981-85 1986-90 1991-95 1996-00 2001-05
Perc
ent
Source: Dunlop's (1994) and authors' analysis of NLRB data. FIGURE 8 Union Elections, 1950-2005
5,906
4,731
6,780
7,3747,911
7,593
4,339
3,5803,035 3,071
2,485
0
2,000
4,000
6,000
8,000
1950-54 1955-59 1960-64 1965-69 1970-74 1975-79 1981-85 1986-90 1991-95 1996-00 2001-05
Source: Dunlop's (1994) and authors' analysis of NLRB data.
Center for Economic and Policy Research, January 2007 16
FIGURE 9 Newly Represented Employees in NLRB Elections as Share of Work Force, 1950-2005
1.3
0.6 0.6 0.6
0.40.3
0.2
0.1 0.1 0.1 0.1
0.0
0.5
1.0
1.5
1950-54 1955-59 1960-64 1965-69 1970-74 1975-79 1980-84 1985-90 1991-95 1996-00 2001-05
Perc
ent
Source: Authors' analysis of NLRB, BLS data, and LaLonde and Meltzer (1991).
Dropping the Ax: Illegal Firings During Union Election Campaigns 17
Conclusion Starting at the end of the 1970s, but especially by the early 1980s, American employers began to engage in the systematic and widespread use of illegal firings as a strategy to undermine the success of campaigns for union representation. At the peak in the early 1980s, almost three percent of pro-union workers involved in union-election campaigns were fired illegally in connection with those campaigns. From that peak in the early 1980s, the rate of illegal firings fell smoothly through the end of the 1990s, though remained high by earlier standards. From about 2000 on, however, the rate of illegal firings jumped sharply again. The increase in illegal firings holds even after we control for the rise in card-check-based union organizing campaigns, adopted in direct response to more aggressive anti-union tactics carried out by employers.
Using the conservative methodology proposed by LaLonde and Meltzer (1991), we estimate that by 2005, pro-union workers involved in a union-organizing campaign faced an almost two percent chance in being fired. After applying an inherently conservative adjustment for the effects of card-check campaigns, we estimate that pro-union workers involved in union-organizing campaigns that year faced a 1.4 percent chance of being fired. Since employers have a strong incentive to fire union organizers and activists, these figures translate to very high probabilities that organizers and activists will be fired in any given unionization campaign. If one-in-ten union supporters is an activist or an organizer, our calculations suggest that in 2005, union organizers and activists face a 15 to 20 percent chance of being fired.
Center for Economic and Policy Research, January 2007 18
References Bronfenbrenner, Kate. 1996. "The Effect of Plan Closings and the Threat of Plant Closings on
Worker Rights to Organize," Supplement to Plant Closings and Workers Rights: A Report to the Council of Ministers by the Secretariat of the North American Commission for Labor Cooperation, Dallas Texas.
-------- . 2000. Uneasy Terrain: The Impact of Capital Mobility on Workers, Wages, and Union Organizing. Report prepared for the U.S. Trade Deficit Review Commission.
-------- . 2001. Uneasy Terrain: The Impact of Capital Mobility on Workers, Wages, and Union Organizing Part II: First Contract Supplement. Report prepared for the U.S. Trade Deficit Review Commission.
Bronfenbrenner, Kate, Sheldon Friedman, Richard W. Hurd, Rudolph A. Oswald, and Ronald Seeber. 1998. Organizing to Win: New Research on Union Strategies. Ithaca, New York: Cornell University Press.
Compa, Lance. 2004. Unfair Advantage: Workers' Freedom of Association in the United States under International Human Rights Standards. Ithaca, New York: Cornell University Press.
Dunlop, John T. 1994. Fact Finding Report: Commission on the Future of Worker-Management Relations. Washington, DC: U.S. Department of Labor and U.S. Department of Commerce.
Eaton, Adrienne E. and Jill Kriesky. 2001. "Union Organizing under Neutrality and Card Check Agreements," Industrial and Labor Relations Review, Vol. 55, No. 1 (Oct. 2001), pp. 42-59
Freeman, Richard B. 2005. "What Do Unions Do? The 2004 M-brane Stringtwister Edition," National Bureau of Economic Research Working Paper 11,410.
Freeman, Richard B. and James Medoff. 1984. What Do Unions Do? New York: Basic Books.
LaLonde, Robert J. and Bernard D. Meltzer. 1991. "Hard Times for Unions: Another Look at the Significance of Employer Illegalities," University of Chicago Law Review, vol. 58, pp. 953-1014.
Levitt, Marty. 1993. Confessions of a Union Buster. New York: Random House.
Pope, James Gray. 2004. "How American Workers Lost the Right to Strike, and Other Tales," Rutgers Law School Faculty Papers No. 3. http://law.bepress.com/rutgersnewarkwps/fp/art3
Smith, Robert Michael. 2003. From Blackjacks to Briefcases: A History of Commercialized Strikebreaking and Unionbusting in the United States. Athens, Ohio: Ohio University Press.
Weiler, Paul. 1983. "Promises to Keep: Securing Workers' Rights to Self-Organization Under the NLRA," Harvard Law Review, vol. 96., no. 8 (June), pp. 1769-1827.
-------- . 1991. "Hard Times for Unions: Challenging Times for Scholars," University of Chicago Law Review, vol. 58, pp. 1015-1032.
Dropping the Ax: Illegal Firings During Union Election Campaigns 19
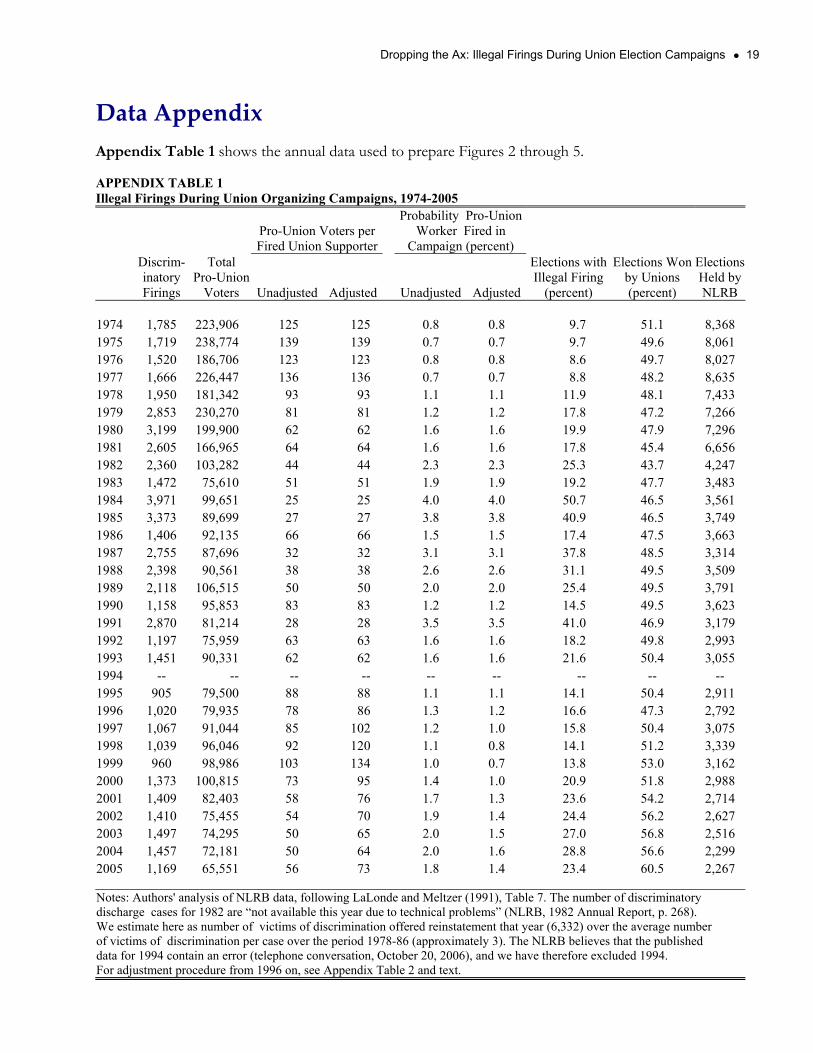
Data Appendix Appendix Table 1 shows the annual data used to prepare Figures 2 through 5.
APPENDIX TABLE 1 Illegal Firings During Union Organizing Campaigns, 1974-2005
Pro-Union Voters per Fired Union Supporter
Probability Pro-Union Worker Fired in
Campaign (percent)
Discrim-inatory Firings
Total Pro-Union
Voters Unadjusted Adjusted Unadjusted Adjusted
Elections with Illegal Firing
(percent)
Elections Won by Unions (percent)
Elections Held by NLRB
1974 1,785 223,906 125 125 0.8 0.8 9.7 51.1 8,368 1975 1,719 238,774 139 139 0.7 0.7 9.7 49.6 8,061 1976 1,520 186,706 123 123 0.8 0.8 8.6 49.7 8,027 1977 1,666 226,447 136 136 0.7 0.7 8.8 48.2 8,635 1978 1,950 181,342 93 93 1.1 1.1 11.9 48.1 7,433 1979 2,853 230,270 81 81 1.2 1.2 17.8 47.2 7,266 1980 3,199 199,900 62 62 1.6 1.6 19.9 47.9 7,296 1981 2,605 166,965 64 64 1.6 1.6 17.8 45.4 6,656 1982 2,360 103,282 44 44 2.3 2.3 25.3 43.7 4,247 1983 1,472 75,610 51 51 1.9 1.9 19.2 47.7 3,483 1984 3,971 99,651 25 25 4.0 4.0 50.7 46.5 3,561 1985 3,373 89,699 27 27 3.8 3.8 40.9 46.5 3,749 1986 1,406 92,135 66 66 1.5 1.5 17.4 47.5 3,663 1987 2,755 87,696 32 32 3.1 3.1 37.8 48.5 3,314 1988 2,398 90,561 38 38 2.6 2.6 31.1 49.5 3,509 1989 2,118 106,515 50 50 2.0 2.0 25.4 49.5 3,791 1990 1,158 95,853 83 83 1.2 1.2 14.5 49.5 3,623 1991 2,870 81,214 28 28 3.5 3.5 41.0 46.9 3,179 1992 1,197 75,959 63 63 1.6 1.6 18.2 49.8 2,993 1993 1,451 90,331 62 62 1.6 1.6 21.6 50.4 3,055 1994 -- -- -- -- -- -- -- -- -- 1995 905 79,500 88 88 1.1 1.1 14.1 50.4 2,911 1996 1,020 79,935 78 86 1.3 1.2 16.6 47.3 2,792 1997 1,067 91,044 85 102 1.2 1.0 15.8 50.4 3,075 1998 1,039 96,046 92 120 1.1 0.8 14.1 51.2 3,339 1999 960 98,986 103 134 1.0 0.7 13.8 53.0 3,162 2000 1,373 100,815 73 95 1.4 1.0 20.9 51.8 2,988 2001 1,409 82,403 58 76 1.7 1.3 23.6 54.2 2,714 2002 1,410 75,455 54 70 1.9 1.4 24.4 56.2 2,627 2003 1,497 74,295 50 65 2.0 1.5 27.0 56.8 2,516 2004 1,457 72,181 50 64 2.0 1.6 28.8 56.6 2,299 2005 1,169 65,551 56 73 1.8 1.4 23.4 60.5 2,267 Notes: Authors' analysis of NLRB data, following LaLonde and Meltzer (1991), Table 7. The number of discriminatory discharge cases for 1982 are “not available this year due to technical problems” (NLRB, 1982 Annual Report, p. 268). We estimate here as number of victims of discrimination offered reinstatement that year (6,332) over the average number of victims of discrimination per case over the period 1978-86 (approximately 3). The NLRB believes that the published data for 1994 contain an error (telephone conversation, October 20, 2006), and we have therefore excluded 1994. For adjustment procedure from 1996 on, see Appendix Table 2 and text.
Center for Economic and Policy Research, January 2007 20
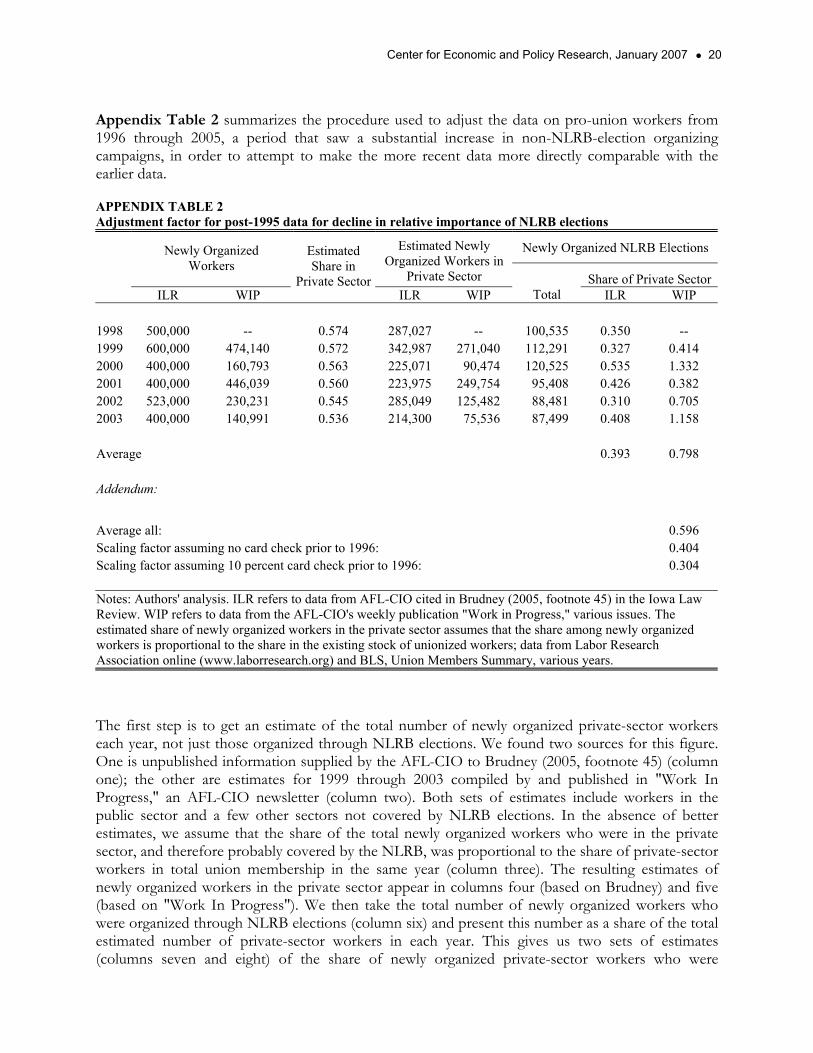
Appendix Table 2 summarizes the procedure used to adjust the data on pro-union workers from 1996 through 2005, a period that saw a substantial increase in non-NLRB-election organizing campaigns, in order to attempt to make the more recent data more directly comparable with the earlier data.
APPENDIX TABLE 2 Adjustment factor for post-1995 data for decline in relative importance of NLRB elections
Newly Organized NLRB Elections Newly Organized Workers
Estimated Newly Organized Workers in
Private Sector Share of Private Sector ILR WIP
Estimated Share in
Private SectorILR WIP Total ILR WIP
1998 500,000 -- 0.574 287,027 -- 100,535 0.350 -- 1999 600,000 474,140 0.572 342,987 271,040 112,291 0.327 0.414 2000 400,000 160,793 0.563 225,071 90,474 120,525 0.535 1.332 2001 400,000 446,039 0.560 223,975 249,754 95,408 0.426 0.382 2002 523,000 230,231 0.545 285,049 125,482 88,481 0.310 0.705 2003 400,000 140,991 0.536 214,300 75,536 87,499 0.408 1.158 Average 0.393 0.798 Addendum:
Average all: 0.596 Scaling factor assuming no card check prior to 1996: 0.404 Scaling factor assuming 10 percent card check prior to 1996: 0.304 Notes: Authors' analysis. ILR refers to data from AFL-CIO cited in Brudney (2005, footnote 45) in the Iowa Law Review. WIP refers to data from the AFL-CIO's weekly publication "Work in Progress," various issues. The estimated share of newly organized workers in the private sector assumes that the share among newly organized workers is proportional to the share in the existing stock of unionized workers; data from Labor Research Association online (www.laborresearch.org) and BLS, Union Members Summary, various years. The first step is to get an estimate of the total number of newly organized private-sector workers each year, not just those organized through NLRB elections. We found two sources for this figure. One is unpublished information supplied by the AFL-CIO to Brudney (2005, footnote 45) (column one); the other are estimates for 1999 through 2003 compiled by and published in "Work In Progress," an AFL-CIO newsletter (column two). Both sets of estimates include workers in the public sector and a few other sectors not covered by NLRB elections. In the absence of better estimates, we assume that the share of the total newly organized workers who were in the private sector, and therefore probably covered by the NLRB, was proportional to the share of private-sector workers in total union membership in the same year (column three). The resulting estimates of newly organized workers in the private sector appear in columns four (based on Brudney) and five (based on "Work In Progress"). We then take the total number of newly organized workers who were organized through NLRB elections (column six) and present this number as a share of the total estimated number of private-sector workers in each year. This gives us two sets of estimates (columns seven and eight) of the share of newly organized private-sector workers who were
Dropping the Ax: Illegal Firings During Union Election Campaigns 21
organized through NLRB elections. Since the data appear to be noisy and show no obvious trend, we take the average over all years of both sets of estimates and conclude that NLRB elections covered about 60 percent of potentially eligible private-sector workers over the period, leaving about 40 percent organized outside of the traditional NLRB-election procedures. We assumed that about 10 percent of workers had been organized outside these procedures in earlier years, and ended up with a scaling factor of 30 percent.
We note that both the AFL-CIO data in Brudney and the "Work in Progress" data we use have several limitations. First, the data are compiled exclusively from successful organizing campaigns, and the data do not allow us to distinguish between pro- and anti-union workers participating in successful campaigns. The NLRB data allow us to include pro-union workers from failed elections as well as to exclude anti-union workers from successful elections. Since these limitations have contradictory effects on our calculations --the exclusion of pro-union workers in unsuccessful campaigns reduces our estimate of pro-union workers, while the inclusion of anti-union workers in successful campaigns increases our estimate of pro-union workers-- the net effect of this limitation on our estimates is not clear. Second, the Brudney and the "Work in Progress" data do not include information on illegal firings, including illegal firings related to card-check campaigns (for example, as is common in the building trades where high worker mobility means that unions and workers frequently choose not to pursue violations of this type). So, our proposed adjustment to the ratio of illegally fired workers to union supporters adds workers to the denominator of the ratio without making any adjustment to the numerator. The result of this limitation is to make our correction a conservative estimate of the likelihood of being fired.
We used the resulting scaling factor to produce our estimates of the probability of illegal firing by multiplying the actual number of pro-union workers in the years 1998 through 2005 by 1.3; to "phase in" the scaling factor, we multiplied the NLRB-reported pro-union workers by 1.1 in 1996 and 1.2 in 1997.