Embed Size (px)
Citation preview

INDONESIAN MINING JOURNAL Vol. 22, No. 2, October 2019 : 107 - 128
Received: 15 January 2018, first revision: 27 February 2019, second revision: 07 May 2019, accepted: 22 October 2019. 107 DOI: 10.30556/imj.Vol22.No2.2019.689 This work is licensed under a CC BY-NC (http://creativecommons.org/licenses/by-nc/4.0/)
THE AVAILABILITY OF INDONESIAN COAL TO MEET THE 2050 DEMAND
KETERSEDIAAN BATUBARA INDONESIA UNTUK MEMENUHI PERMINTAAN TAHUN 2050
GANDHI K. HUDAYA and NENDARYONO MADIUTOMO Research and Development Centre for Mineral and Coal Technology
Jalan Jenderal Sudirman 623 Bandung 40211 Ph. (+6222) 6030483, Fax. (+6222) 6003373
e-mail: [email protected]
ABSTRACT Coal is an important energy source for industry and power plant in Indonesia. Its reserve is quite abundant around 28.5 billion tons. The Government of Indonesia issued the National Energy Policy (NEP) to target 25% of coal use of the national energy mix in 2050. The NEP directs national energy management for the provision and utilization of primary energy. However, there are worries about the ability of coal reserves in accommodating the demand from domestic and export needs. The National Energy Council recommended a coal production restriction policy for anticipation measures. This research investigated the current state of the coal reserves and the government policy to meet the target in 2050 using Vensim program. In the Vensim, a model was built to represent a coal supply-demand system. Several scenarios were simulated to analyze the relationship between government policy and the coal reserve. The result shows that government intervention such as coal production restriction policy is needed to ensure Indonesia’s coal reserve can fulfill domestic demand for power generation and industry by 2050.
Keywords: coal supply demand, government policy, dynamic system
ABSTRAK Batubara merupakan sumber energi yang sangat penting bagi Indonesia dan digunakan di industri dan pembangkit tenaga listrik. Cadangan Ibatubara Indonesia saat ini cukup melimpah yaitu sebesar 28,5 miliar ton. Pemerintah Indonesia memiliki Kebijakan Energi Nasional atau KEN dengan target penggunaan sebesar 25% pada 2050. KEN merupakan panduan dalam pengelolaan energi nasional untuk penyediaan dan pemanfaatan energi primer. Namun, ada kekhawatiran mengenai kemampuan cadangan batubara dalam mengakomodasi permintaan dalam negeri dan kebutuhan ekspor. Untuk mengantisipasi hal tersebut, Dewan Energi Nasional telah merekomendasikan kebijakan pembatasan produksi batubara. Penelitian ini mengkaji hubungan antara cadangan batubara dan kebijakan pemerintah dalam memenuhi target KEN pada 2050 menggunakan program sistem dinamis-Vensim. Pada sistem ini, model dibangun untuk mewakili permintaan pasokan batubara di Indonesia dan beberapa skenario disimulasikan untuk menganalisis hubungan antara kebijakan pemerintah dan cadangan batubara. Hasilnya menunjukkan bahwa intervensi pemerintah seperti kebijakan pembatasan produksi batubara diperlukan untuk memastikan bahwa cadangan batubara Indonesia dapat memenuhi permintaan domestik untuk pembangkit listrik dan industri pada 2050.
Kata kunci: pasokan batubara, permintaan, kebijakan pemerintah, sistem dinamis.
INTRODUCTION Coal is one of the world’s most plentiful energy resources (Bian et al., 2010). In 2016, it was estimated roughly 1,139 Bt coal reserves around the world. Such the reserve
should last approximately 153 years, roughly three times compared with R/P ratio of oil and gas (BP, 2017). Because of the important role of coal, researches on its sustainability for long-term supply have been done. The research was conducted not only on the

INDONESIAN MINING JOURNAL Vol. 22, No. 2, October 2019 : 107 - 128
108
future supply or time of production but also on the peak production of coal. The peak production of coal would occur between 2042 and 2062, with the maximum production of 4.1-4.9 Gtoe/year (Maggio and Cacciola, 2012). Other research estimated that the coal production would increase rapidly with an average rate of 2.2% p.a from 2010 until 2030 (Bauer et al., 2016). Others estimate that coal production will reach its peak in 2021 due to Chinese coal production, then followed by an abrupt decline (Mohr and Evans, 2009). The world coal reserves quantity and location are shown in Figure 1. Indonesia coal reserves are the second largest in South and Central Asia which mostly found in Kalimantan and Sumatra islands. Currently, coal is the main supply for electricity fuel with an allocation of 55.6% in 2017 and is expected to achieve the electrification ratio target of 98% in 2019 (PT PLN, 2017). In general, Indonesia's energy policy is mentioned in Government Regulation (PP) 79/2014 of National Energy Policy (NEP). The NEP serves as a guideline to provide direction for national energy management, on realizing energy independence and national energy security and supporting national development in a sustainable manner. The energy management policy is based on the principles of fairness, sustainability and environmental insight for the creation of energy independence and national energy security. The NEP will be implemented until 2050.
Some keys of NEP include: 1. Changing the original energy paradigm
as a commodity into development capital; 2. Prioritizing to use new renewable energy
and minimizing petroleum usage by optimizing natural gas utilization and relying on coal for national energy supply;
3. Gradually reduce the fossil energy export, especially gas and coal, and set a deadline to stop the exports;
4. Gradually reduce fuel subsidies and electricity until it reaches the people’s purchasing power and divert subsidies for renewable energy;
5. Assistance from the Government to provide energy buffer reserves and strategic energy reserves, in addition to ensure the availability of operational reserves by business entities.
Related to coal, the NEP specifically requires the portion of coal use in 2050 by 25% in the national energy mix (Figure 2). The energy mix is targeted for providing and utilizing primary energy as well as directing national energy management. According to the data from the Geological Agency of the Ministry of Energy and Mineral Resources in 2016, the coal reserves are scattered in Sumatra, Western Java, Borneo, the southern island of Sulawesi, and Papua. Overall calculation results show that the Indonesia coal resources up to 2016 amounted to 128,062.64 million tons of coal, while its reserves are 28,457.29 million tons (Geology Agency, 2016).
Source: BP (2017)
Figure 1. World coal reserves

The Availability of Indonesia’s Coal to Meet the … Gandhi K. Hudaya and Nendaryono Madiutomo
109
Source: Tumiran (2017)
Figure 2. Indonesia energy mix
Resource availability and coal reserves are concentrated in 2 islands: Sumatra (50%) and Kalimantan (49.5%). The rest is scattered in other islands. Coal production is located in Kalimantan (93%) and the rest (7%) is in Sumatra. The quality of Indonesian coal is low (64%), medium (27%), high (7%) and very high (2%). Until now, the largest domestic user of coal is for power generation (81%) and the others are cement, textile, fertilizer, pulp and metallurgy industries with the most users in Java (Directorate General of Mineral and Coal, 2017b). Indonesia's economy has been driven and depended on natural resources. However, the paradigm regarding natural, especially energy resources, has changed. Indonesia has been aware that the country should benefited more from the abundance of domestic coal availability when this energy source is used more for domestic demand rather than an export commodity. Therefore, in the coal optimization ratio, coal export will be reduced and diverted for domestic use and increase national energy security. If the domestic is unable to absorb the production, then the coal production will be controlled. Based on the NEP, the national medium-term development plan 2015-2019 (RPJMN
2015-2019) recommends controlling coal production from 425 million tons in 2015 until 400 million tons in 2019. However, the recommendation had been not applied until now. One of the main reasons is probably because the government still needs revenue from coal especially when the price is currently high. In 2017, coal production will be around 477 million tons, far from the target that of 413 million tons. There will be a consequence or a problem in the future-whether Indonesia coal reserves will be sufficient to accommodate the demand from export and domestic use until 2050. Based on the described situation above, there are potential problems related to the coal supply in Indonesia in terms of accommodating the demand for coal export and domestic use until 2050. Other researches on forecasting Indonesia coal production was carried out by Mohr and Evans (2009), Mohr et al. (2015), Patzek and Croft (2010), Höök et al. (2010) and Rosyid and Adachi (2016). Each study used different methods for forecasting. Mohr and Evans (2009) and Mohr et al. (2015) developed a model that accommodates supply and demand. Patzek and Croft (2010) applied a multicycle

INDONESIAN MINING JOURNAL Vol. 22, No. 2, October 2019 : 107 - 128
110
Hubbert analysis. Höök et al. (2010) applied a logistic curve. Rosyid and Adachi (2016) applied the growth curve method. In this article, the systems built to represents condition on coal supply and demand in Indonesia using system dynamics with Vensim. The system will be simulated by several scenarios for analyzing the relationship between key variables. The analysis will be used for recommendations to government policy in ensuring fulfillment to the coal demand in 2050. METHOD The approach in this study followed a typical system dynamics research roadmap. System Dynamics (SD) is a method that extends beyond the conventional domain of systems approach to large-scale complex engineering problems. The SD deals with the interaction of various elements of a system in time and captures the dynamic aspect by incorporating concepts such as stock, flows, feedback and delays, and thereby provides an insight into the dynamic behavior of the system over time. As a knowledge domain, the SD can be thought as a logical extension of systems engineering (SE) and systems analysis (SA). The SD explicitly takes into account the dynamic behavior that results due to delays and feedbacks in the system. Jay W. Forrester, the Management professor at the MIT/Sloan School is considered to be the father of this new approach to understand and solve the problems in the business and social science domains. SD evolved as a means for models to contribute to the general understanding of policymakers in corporations and public agencies (Forrester, 1961; Ford, 1999; Sterman, 2000; Dyner and Larsen, 2001). The SD adopts a holistic approach and helps to understand the basic structure of the system and the behavior that can be produced (Sullivan, 2014). Using the National Energy Modeling Systems (NEMS), as an example, the systems modeling can be used to analyze effects of existing and proposed government laws and regulations related to the energy production and use; potential impact of new and advanced energy production conversion, and consumption technologies; impact and cost of greenhouse gas control; impact of
increased use of renewable energy sources; and potential savings from increased efficiency of energy use; as well as impact of regulations on the use of the alternative or reformulated fuels (Energy Information Administration, 2009). Other examples of the SD model applied to energy (Leopold, 2016) are : the SD model developed to capture the dynamics for coal investment in China (Fan, Yang and Wei, 2007); the SD model of Hubbert Peak used to forecast China’s oil reserves (Tao and Li, 2007); the SD model of Hubbert Peak to forecast Iran crude oil reserves (Kiani, Hosseini and Roozbeh, 2009); the SD model to forecast the oil reserves and production until 2060 in the Daqing oilfield, China (Tang et al., 2010); the SD model to study the dynamic complexities of one coal industry system in a fuzzy environment (Xu and Li, 2011); the SD methodology for modeling the Iran’s crude oil production peak and evaluating the consequences (Hosseini et al., 2014) and recently analyzing the technology, the costs and policies that might affect the market competition of shale gas in China until 2049 (Yunna et al., 2015). The application of system dynamics techniques helps to create a framework and method, starting with simple test models to evaluate fundamental concepts that can be built up later into more robust models of complex systems. System dynamics thinkers typically note that even simple models are valuable for understanding complex systems affected by the design of policy (Ghaffarzadegan, Lyneis and Richardson, 2010). Prior to the development of a full dynamic model, a static representation of the system, called a Causal Loop Diagram (CLD), is built up in stages. It helps to visualize and identify the key relationships among the different variables and different stakeholders in the coal supply-demand system, which has been identified during the background literature search and problem identification process. The next step in the process is to develop simple but fully dynamic stock and flow models in order to understand, validate and visualize the aspects of the system’s behavior. After that, a full system model is built and tested. After creating the dynamic stock and flow model, simulations are run and the output is analyzed to test the

The Availability of Indonesia’s Coal to Meet the … Gandhi K. Hudaya and Nendaryono Madiutomo
111
hypotheses. The objective is not for predicting or forecasting any output, but for elucidating and understanding the key relationships between different variables over time, and uncover the mechanisms influencing the coal reserve. The research framework can be visualized in Figure 3. First, the problem was identified and studied. A conceptual model is developed and refined until a clear understanding of the problem can be articulated. Then, the available data and information are used to build the stock and flow model. This work is performed iteratively. Additional data sources are sought out as needed. Finally, after validating the model, simulations are performed and the results will be analyzed. RESULTS AND DISCUSSION Model Building In building a full system model, it requires several steps as below: 1. Key Variables In this modeling, several key variables are: coal reserves, new reserves found (coal exploration), coal availability, coal for export, coal import, coal for electricity, coal for industry, total coal demand, difference between demand and supply, government policy, number of companies, total population, electric consumption. Information regarding key variables are as follows:
Coal Reserve Policy. The government tries to control the
production of minerals and coal in order to optimize production (not excessive) by setting the limit/reference production with due regard to efforts to meet domestic needs and energy security. In accordance with Law Number 4 Year 2009 regarding Mineral and Coal Mining, the Government for national interest should be obliged to carry out the control of production and export through the determination of each production commodities per annum of each province, which must be obeyed by the Regional Government and mining company. The production control is
implemented for prioritizing the minerals and coal for domestic interest and protecting the environment by reducing the exploitation of minerals and coal that can result in environmental damage. Furthermore, production control is a Government effort to allocate minerals and coal for the interests of future generations. As long as it's sustainable, minerals and coal are beneficial for the next generations. It is undeniable that in the future the mineral and coal needs will continue to increase so the depletion of mineral and coal reserves will endanger the national energy security. The location and quality of coal resources in Indonesia are shown in Figure 4 and Table 1.
To maintain the reserves of coal while it
still can continue with the demand from domestic and export, it is very important to keep exploring the new coal reserve. In Indonesia 2050 pathways calculator (Ministry of Energy and Mineral Resources, 2017), it is predicted that the new coal reserves found in the future will be not so many. The prediction is illustrated in Table 2.
Directorate General of Mineral and Coal
has predicted that the coal reserves will be depleted in 2086 or another 69 years. The calculation is based on the reserves in the year 2016, namely 28,457 million. The coal production after 2019 looks constant at 400 million tons and there will be no new finding on coal reserves. However, if the coal reserves can be increased annually by 1% then the coal reserves will be depleted in 2139 or 123 years (Figure 5).
Another prediction comes from the
Indonesia Coal Mining Association and PricewaterhouseCoopers (PwC) in 2014 which calculated that the Indonesian coal reserves are only around 8.3 billion tons, so the reserves will be depleted much sooner than the prediction of Directorate General of Mineral and Coal (PWC, 2017). Whoever prediction will be proven, the important thing for Indonesia is to find the new reserves whether for oil, gas or coal or to find a new alternative energy source that is still abundant and economical.

INDONESIAN MINING JOURNAL Vol. 22, No. 2, October 2019 : 107 - 128
112
Figure 3. Research framework
Source: (Geology Agency, 2016)
Figure 4. Coal resources map of Indonesia
Table 1. Coal resource and reserves in Indonesia
Quality Definition based on
Government Regulation No. 45 Year 2003
Resources (Million tons) Reserves (Million tons)
Hypothetic Indicated Inferred Measured Total Probable Proven Total
Low Calorie CV ≤ 5,100 cal/g 599.17 11,263.95 15,913.98 16,420.26 44,197.36 7,108.27 7,121.47 14,229.74
Middle Calorie CV 5,100-6,100 cal/g 3,343.53 27,436.16 19,822.35 20,357.92 70,959.96 3,570.70 6,841.66 10,412.36 High Calorie CV 6,100-7,100 cal/g 599.04 3,967.88 2,480.65 2,804.63 9,841.19 541.60 2,769.20 3,310.80 Very High Calorie CV > 7,100 cal/g 2.06 1,726.74 735.33 600.00 3,064.13 264.19 240.21 504.39.00
4,532.79 44,394.72 38,952.31 40,182.81 128,062.64 11,484.76 16,972.53 28,457.29
Source: Geology Agency (2016)
Table 2. New reserve of coal
Years 2020 2025 2030 2035 2040 2045 2050
New reserve (million tonnes) 8.64 9.08 9.54 10.03 12.59 11.08 11.64
Source : Ministry of Energy and Mineral Resources (2017)

The Availability of Indonesia’s Coal to Meet the … Gandhi K. Hudaya and Nendaryono Madiutomo
113
Source: Directorate General of Mineral and Coal (2017c)
Figure 5. Trend projection of coal reserves in Indonesia
Domestic Market Obligation (DMO). Coal utilization should prioritize the
domestic energy needs so that the exports begin to be reduced persistently while it still has to concern about the optimization of state revenue. To ensure the security of supply domestic coal, every year the government has set the obligation for coal mining companies to allocate part of its production for domestic user coal needs or better known as Domestic Market Obligation (DMO) coal. Obligation of the DMO coal is a mandate of Law No. 30 of 2007 on Energy that is mandated to ensure the national energy security through the Government's obligation in providing the energy for energy security as well as the mandate of Article 3 of Law Number 4 Year 2009 on Mineral and Coal Mining in terms of guaranteeing the availability of coal as the source of energy for domestic needs. Article 5 clauses 1 also said that "For the national interest, the Government after consultation with the House of Representatives of the Republic of Indonesia should set a policy prioritizing the mineral and/or coal for domestic interest". Another regulation for DMO is the Government Regulation Number 23 Year 2010 in Article 84 clauses 1 that said: “holders of IUP OP and IUPK OP must prioritize the needs of mineral and/or coal for domestic interest". For the application, it will follow the Regulation of Minister of Energy and Mineral Resources
Number 34 Year 2009 regarding prioritization of mineral and coal demand for Domestic Market Obligation.
DMO obligations, in general, have been
implemented by the business actors of coal mining. On the domestic side, the DMO will guarantee the coal supply to domestic coal users in power plant and industry, especially PT PLN (State Electric Company) as the largest user of domestic coal. Until now, the portion of domestic need is only around 20% of national coal production as mentioned in Figure 6. Based on previous domestic consumption data from the Ministry of Energy and Mineral Resources, Table 3 shows the projected domestic consumption of coal.
Efforts are needed from all stakeholders
including domestic coal users to increase the need for coal. Government through the Directorate General of Mineral and Coal is committed to making domestic demand for coal as a top priority. It means that coal domestic demand must be fulfilled before allowing to export coal.
Coal for Electricity. Electricity is very important in modern
society. It is very essential in the production process, industry and also household for light and energy. Electricity consumption per capita in the country can be a measure of whether the country is poor or rich. One of the measurements

INDONESIAN MINING JOURNAL Vol. 22, No. 2, October 2019 : 107 - 128
114
is the electrification ratio is shown in Figure 7 showing the electrification ratio in Indonesia and the target of government in the year 2019.
There is also a tight relationship between
the economic and electricity growths as
mentioned in Figure 8. When electricity sales increase, economic growth also increases. In Indonesia, coal, and gas become the largest sources of generating electricity energy (Figure 9) because of the availability and economical price (Table 4).
Source: Tumiran (2017)
Figure 6. Realization of coal DMO 2011-2017
Table 3. Domestic market obligation projection (in million tons)
Year 2016 2017 2018 2019 2020 2021 2022 2023 2024 2025 2026 2027 2028 2029 2030 2031 2032 2033
Electricity 73.2 86 91 101 111 125 137 146 150 140 149 156 164 172 181 190 200 210
Industry 11.2 10.4 10.9 22.5 22.2 24 25.2 26.5 27.8 29.2 30.6 32.2 33.8 35.5 37.2 39.1 41 43.1
Total 84.4 96.4 102 124 133 149 162 172 178 169 180 189 198 208 218 229 241 253
Year 2034 2035 2036 2037 2038 2039 2040 2041 2042 2043 2044 2045 2046 2047 2048 2049 2050
Electricity 220 231 243 255 268 281 295 310 325 342 359 377 395 415 436 458 481
Industry 45.2 47.5 49.8 52.3 54.9 57.7 60.6 63.6 66.8 70.1 73.6 77.3 81.2 85.2 89.5 94 98.7
Total 265 279 293 307 323 339 356 373 392 412 432 454 477 500 525 552 579
Source : modified from Sugiyono et al. (2016)
Source: Directorate General of Electricity (2017)
Figure 7. Electrification ratio of Indonesia
61.32 62.76 64.44 65.61 67.15 72.95
76.56 80.51
84.35 88.3 91.16 92.75 95.15 97.35
2006 2007 2008 2009 2010 2011 2012 2013 2014 2015 2016 2017 2018 2019

The Availability of Indonesia’s Coal to Meet the … Gandhi K. Hudaya and Nendaryono Madiutomo
115
Source: Indonesia Coal Mining Association (2016)
Figure 8. Relationship of economic and electricity growth
Source: Indonesia Coal Mining Association (2016)
Figure 9. Installed capacity of electricity in Indonesia
Table 4. Cost of electricity per kWh
Year Hydro Power Plant
Steam Power Plant
Diesel Power Plant
Gas Power Plant
Hydrothermal Power Plant
Combined Cycle Power Plant
Solar Power Plant
In Rp/kwh Average
2011*) 155.79 588.47 2,536.85 2,260.96 792.51 960.58 - 1,051.14
2012 155.87 810.14 3,168.58 2,362.99 1,121.50 1,001.80 - 1,217.28 2013 166.66 719.52 3,286.13 2,954.28 1,102.50 1,159.20 - 1,206.67 2014 189.19 726.37 3,064.30 2,892.80 1,306.88 1,335.74 - 1,296.73 2015 211.19 541.78 7,969.86 3,306.22 879.83 1,054.99 6,624.36 920.22 2016 271.90 532.38 1,828.39 3,103.64 1,016.37 1,085.07 5,853.84 856.28
Source: PT PLN (2017)

INDONESIAN MINING JOURNAL Vol. 22, No. 2, October 2019 : 107 - 128
116
Therefore, coal is very important for electricity in Indonesia which means also very strategic for Indonesia’s development and economic growth in the future. In Figure 10, there are plans from the State Electricity Company Ltd in using coal as energy sources for its electricity.
Based on key variables that have been
explained above, the causal loop diagram will be built. Then, the simulation will be conducted to see whether, in the future, coal reserves can fulfill the demand.
2. Causal Loop Diagram In Figure 11, the relationship between 14 variables is classified into 5 loops that consist of 1 balance loop and 4 reinforce loops. The influence of the relationship between the variables are as follows: a. Balance Loop (the red line). The coal reserves will affect coal
production in a positive way. When the reserve is high, the coal production will increase. It will then increase coal availability as well. If the coal escalation develops, it will impact on raising the number of coal companies. However, this increase would have a negative effect in terms of company profits. If the company
profits reduced, the investment in the coal industry will also reduce. Eventually, the low investment will affect the decrease in exploration on coal new reserves. Thus, new coal reserves will not increase.
b. Reinforce 1 (Top-Bottom). Coal inventories will affect the difference
between the demand and the supply. The increasing availability of coal will encourage an increasing difference between the demand and the supply. With the increase between both items, it will encourage the government to increase the regulation that can lead to an increase in coal production and the availability of coal.
c. Reinforce 2. The high availability of coal will also
affect the amount of coal exports and can lead to an increase in exports and affect the total requirement of coal. The high export causes the total demand for coal and also increases the total demand for coal. The increase in total coal demand will encourage the difference between the demand and the supply. The high difference between both items will encourage the government to reset regulation. The high amount of coal production will increase the availability of coal.
Source: PT PLN (2015)
Figure 10. Coal for electricity

The Availability of Indonesia’s Coal to Meet the … Gandhi K. Hudaya and Nendaryono Madiutomo
117
Figure 11. Causal Loop Diagram (CLD)
d. Reinforce 3. The availability of coal will affect the need
for coal in the industry. With the large availability of coal then coal usage will also increase. The high use of coal for the industry will increase the total requirement of coal. The total amount of coal demand will increase the difference between the demand and the supply. The high difference between the demand and the supply will encourage the government to reset the regulation and that will increase the amount of coal production. The high amount of coal production will increase the availability of coal.
e. Reinforce 4. The availability of coal can affect the use
of coal for power generation. If the coal is highly available then the policymaker will be tempted to use more coal for power generation. Increasing the use of coal for power plants will increase the total volume of coal demand. The total amount of coal demand will cause the difference between the demand and the supply. The high difference between the demand and the supply will encourage the government to reset the regulation that will increase the
amount of coal production. The high amount of coal production will increase coal availability.
The availability of coal is also affected by imports. This variable is essential for the needs calculation for the based-coal industry and the power plant. The number of exported coal and the difference between the demand and the supply of coal will also affect the total coal demand. Specifically, on coal for power plant, it will be affected by electric consumption that is influenced by the number of population. In terms of coal price, this variable will give positive consequences in coal reserves and coal production. All the relationships between the key variable in the system of coal supply and demand can be seen in Figure 5. 3. Stock and Flow Diagram. Stock and Flow Diagram (SFD) of the system divided into 3 sub-systems, namely: 1) Coal Supply; 2) Coal Demand Domestic; 3) Coal Demand Export.

INDONESIAN MINING JOURNAL Vol. 22, No. 2, October 2019 : 107 - 128
118
The sub-systems can be seen in Figure 12,13 and 14: 1) SFD of coal supply. Figure 12 shows the SFD of the coal
supply. New reserve of coal increases from the exploration. That new reserve will add the initial coal reserve and coal availability. The coal reserve will be exploited and mined according to the calculation of domestic and export demand. If the demand exceeds the coal reserve, it will lead to the import of coal to meet the demand.
2) SFD of Domestic Coal Demand. From Figure 13, domestic demand for
coal is affected by two factors: coal for electricity and coal for the industry. The use of coal for electricity is the largest of coal domestic consumption with a portion of 80% compared with the industrial sector. Coal for electricity is influenced by the government policy on electricity, electricity from coal and electricity conversion to coal. Electricity from coal is influenced by the government policy of electricity from the coal in the 35,000 MW program and also the amount of electricity demand per capita. The
demand for electricity per capita is affected by the amount of electricity consumption per capita per year and the population of Indonesia. While the coal demand for the industrial sector is influenced by the amount of demand from the industry each year.
3) SFD of Coal for Export. SFD of coal for export is mentioned in
Figure 14. Indonesia’s destination for coal export is almost all over the world. China, South Korea, Japan, and India are the four largest importers of Indonesian coal. The country demand becoming Level (variable type) because the demand was assumed to continuously increase until 2050. The increase rate is assumed to mirror the consumption rate of its country. However, since the coal is probably will not comply with the environment then the country conversion is applied as an intervention to the model. The value is 0 to 1. The 0 represents the fact that the country is no longer coal user while the value of 1 means that the country still uses coal for business as usual.
Figure 12. SFD of coal supply

The Availability of Indonesia’s Coal to Meet the … Gandhi K. Hudaya and Nendaryono Madiutomo
119
Figure 13. SFD of Domestic Coal Demand
Figure 14. SFD of Coal for Export
Table 5 shows the variables used in the model. It includes the name of the variable, the initial values, the equation and the unit
of variables. The details of the variables will help the modeler to revise or to optimize the model.

INDONESIAN MINING JOURNAL Vol. 22, No. 2, October 2019 : 107 - 128
120
Table 5. Initial values, equation and unit of variables (private document)

The Availability of Indonesia’s Coal to Meet the … Gandhi K. Hudaya and Nendaryono Madiutomo
121
Scenario and Simulation Results There are three scenarios that simulate this model namely: 1. Scenario 1 (Business as Usual). In this scenario, based on the data from
the Ministry of Energy and Mineral Resources, PT PLN Tbk, and British Petroleum (BP) the demand from export and domestic will increase as planned. As mentioned in Table 6, the last export from Indonesia to China, India, Japan, South Korea, and other countries were recorded in 2015 while the demand rate each year referred to the rate of coal consumption increase from the BP in 2006-2015. The coal consumption in 2016 was predicted by the data from CAS and MEMR. In this scenario, there will be no restriction policy from the government. It means that coal production will follow the demand for export and domestic.
2. Scenario 2. In this scenario, the government will
restrict coal production based on the RPJMN 2015-2019 and the National Energy Policy. The target is to restrict coal production to 413 million tons in 2018 and in 2019 the production will be 400 million
tons. However, due to the domestic demand especially the demand from the electricity that will require almost 600 million tons in 2050 so the restrict policy increases about 25 million tons per period. Table 7 shows the government policy.
3. Scenario 3. In this scenario, the government limits
coal production based on the current year production in 2017. The scenario also considers that the domestic demand in 2050 requires almost 600 million tons. Therefore, coal production started at 478 million tons in 2017 and will increase by 3 million tons per year until 2050.
4. Scenario 4. In this scenario, the coal reserve data
used is not from the government. As mentioned above, the Indonesia coal reserves in the latest report from the Ministry of Energy and Mineral Resources is 28.4 billion tons. However, the data from the Indonesia Coal Mining Association and PricewaterhouseCoopers (PwC) in 2014 shows that Indonesian coal reserves only around 8.3 billion tons. This scenario will use the government policy as used in Scenario 2 that just shows a comparison if the coal reserves change.

INDONESIAN MINING JOURNAL Vol. 22, No. 2, October 2019 : 107 - 128
122
Table 6. Coal export destination country
Destination Country
2016 (modified from
CAS and MEMR) 000 tons
Consumption rate (BP) %
Japan 32,509.0 0.5 South Korea 34,015.7 4.6 China 72,740.8 3.7 India 124,481.5 6.5 Others 103,223.4 1.9
Total 366,970.4
Source: Directorate General of Mineral and Coal (2017a)
Note: CAS = Central Agency on Statistics MEMR = Ministry of Energy and Mineral
Resources
Table 7. Government policy on Scenario 2
Period (year)
Production (million tons)
2017 478 2018 413
2019-2025 400 2026-2030 425 2031-2035 450 2036-2040 474 2041-2045 500 2046-2047 525 2048-2049 550
2050 580
Simulation Results and Analysis The simulation was made based on the SFD and the three scenarios mentioned. The result from the simulation and analysis is presented in Figure 15. Coal reserves in this recent year as much as 28.45 billion tons similar to the initial reserve (Scenario 1, 2 and 3). The coal reserve depends on the deviation of new reserve findings and coal production. The number of reserve will be different among scenarios as can be seen in Figure 15. The coal reserve will differ slightly until 2050 between Scenario 2 and 3. The condition of those scenarios occurs due to the restriction or limitation of coal production. The reserve in Scenario 2 is larger than that of Scenario 3 because the coal production in Scenario 3 is larger than that of Scenario 2. The coal reserve in Scenario 1 looks different from
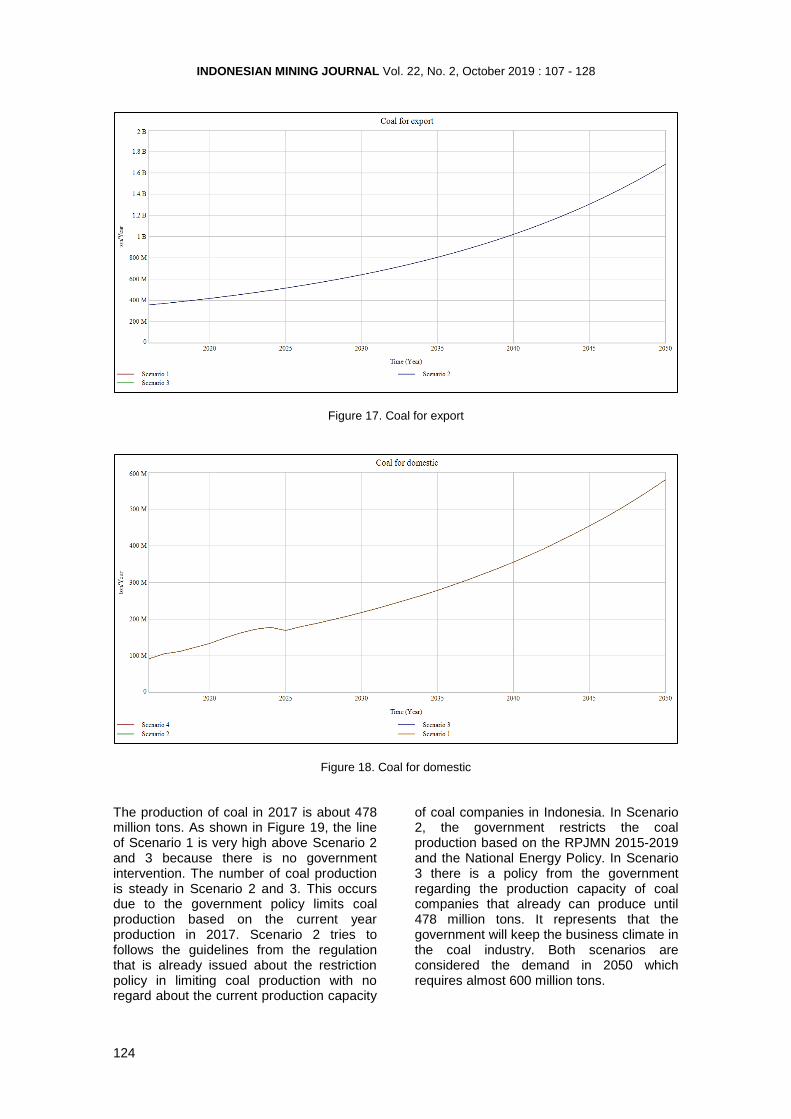
2025. In Scenario 1, it starts decreasing sharply in 2030. The coal production in Scenario 1 is based on the demand for export and domestic that increases as planned by the Ministry of Energy and Mineral Resources, PT PLN Tbk. and BP. Due to its high demand, the coal reserve will vanish in the year 2045–2050. In Scenario 4 in which the coal reserve is only 8.3 billion tons or less than one-third of the coal reserves from the government, the reserves will be depleted until zero in 2035. It means that there is a probability that the Indonesia coal reserve is not as big as reported. The Government should work together with the private sectors in the coal industry to prepare a contingency plan for the worst scenario. Based on the simulation above, it is very clear that the government policy to restrict or limit coal production is ineffective. As shown in Figure 16, Scenario 1 just follows the coal demand from domestic and export. There is no intervention from the government such as production limit or else. However, in Scenario 2 and 3, there are government interventions that reduce the quantity of coal export. As shown in Figure 17, The forecast of Scenario 1, 2 and 3 regarding the amount of coal demand for export is no different. It just follows current conditions and increases with the rate similar to several years ago. In this model, the realization of whether the demand will have complied or not will depend on the variable government policy. In Scenario 1 there are no interventions unlike Scenario 2 and 3. In this model, it is assumed that the conditions whether politics or economics regarding coal consumption in the country those who import coal from Indonesia is still undisturbed. If there are any changes in the country, it is probably because of politics, environmental or economic slowdown. Such conditions can be changed by changing the country's conversion. If the value is less than 1 then the coal consumption of the country most likely will be less then it used to be, it means the country will need less coal in the future. If it is more than 1, it means the country will need more coal in the future.

The Availability of Indonesia’s Coal to Meet the … Gandhi K. Hudaya and Nendaryono Madiutomo
123
Figure 15. Coal reserve
Figure 16. Coal production planning
Coal for domestic becomes the main variable in this model. There is no intervention regarding the demand for domestic use which divided by electricity and industrial use as shown in Figure 18. This model is designed to make sure that the coal reserve is sufficient to fulfill the demand from the domestic need. The consumption rate is designed by conservative economic growth which is only 5% annually. There are high probabilities
that the demand for electricity and industrial will increase more than that of the predicted one in the future. In electricity, the consumption per capita currently calculated below 1MWh per year, meanwhile, the consumption per capita in developed countries is about 4 times. For the industrial sector, there are several projects such as gasification in fertilizer plants and ethanol making from the coal.
INDONESIAN MINING JOURNAL Vol. 22, No. 2, October 2019 : 107 - 128
124
Figure 17. Coal for export
Figure 18. Coal for domestic
The production of coal in 2017 is about 478 million tons. As shown in Figure 19, the line of Scenario 1 is very high above Scenario 2 and 3 because there is no government intervention. The number of coal production is steady in Scenario 2 and 3. This occurs due to the government policy limits coal production based on the current year production in 2017. Scenario 2 tries to follows the guidelines from the regulation that is already issued about the restriction policy in limiting coal production with no regard about the current production capacity
of coal companies in Indonesia. In Scenario 2, the government restricts the coal production based on the RPJMN 2015-2019 and the National Energy Policy. In Scenario 3 there is a policy from the government regarding the production capacity of coal companies that already can produce until 478 million tons. It represents that the government will keep the business climate in the coal industry. Both scenarios are considered the demand in 2050 which requires almost 600 million tons.

The Availability of Indonesia’s Coal to Meet the … Gandhi K. Hudaya and Nendaryono Madiutomo
125
Figure 20 shows that Indonesia has to import coal in 2044 based on Scenario 1 and in 2034 based on Scenario 4. The difference between Scenario 1 and 4 is about the initial reserve and interfere with the government policy. There is no government intervention in Scenario 1, however, because of the demand from the
export is very high then the reserve is depleted in 2044. While in Scenario 4, there is government intervention occurs. However, because the initial reserve is only 8.3 billion tons which is very small compared to Scenario 1 then the reserved will be depleted 10 years earlier compared to Scenario 1.
Figure 19. Government policies on coal production
Figure 20. Coal Import

INDONESIAN MINING JOURNAL Vol. 22, No. 2, October 2019 : 107 - 128
126
CONCLUSIONS AND RECOMMENDATIONS There is a high possibility that the Indonesia coal reserve will not be sufficient to accommodate the demand from domestic and export if there is no government intervention as already analyzed from the simulation result above. Recognizing this condition, it is important for Indonesia to develop a policy that can be a reference in the management of coal resources. The coal management policy, as one of the national energy sources, is set forth in the National Energy Policy. In general, the policy towards national energy management is implemented for the period 2014 to 2050. In terms of coal supply requirements for domestic needs, it is expected to reach 600 million tons of coal up to 2050. To ensure the availability of coal for the fulfillment of electrical and industrial energy sources, it is necessary to formulate several policy scenarios to be considered by the government in terms of anticipating the demand. The government must also consider the possibility in which the coal reserve is actually lower than what had been reported to the public. There are two policy recommendations for government consideration, i.e. Scenario 2 and 3 which simulated in Vensim. Clearly, by applying this scenario, the government will easily control the exploitation of coal, because if it is not conducted by running a business, as usual, the coal production is expected to reach more than two billion tons for electricity needs only. By applying one of those scenarios, it appears that the Government will also be able to control and maintain the reserves of 11 to 13 billion tons by 2050. However, it is recommended that scenario 3 should be applied. First, by applying Scenario 3, the government shows a good will to coal industry players that already invested to reach current production capacity. Second, it will also give the coal producer the opportunity to plan the production earlier. As the producer is already aware that nationally the production quota will increase 3 million tons annually until 2050.
ACKNOWLEDGMENTS The authors would like to express their appreciations to all colleagues in Group 3 Enemba II: Ana Kartikawati; Dimas Prasetya G; Susanna Renna Ertanti; Ririet Herlianti; Hari Dwi Wijayanto and Sari Murdiyati for their contributions in providing ideas and data that support this article. REFERENCES Bauer, N., Mouratiadou, I., Luderer, G.,
Baumstark, L., Brecha, R. J., Edenhofer, O. and Kriegler, E. (2016) ‘Global fossil energy markets and climate change mitigation - An analysis with remind’, Climatic Change, 136(1), pp. 69–82. doi: 10.1007/s10584-013-0901-6.
Bian, Z., Inyang, H. I., Daniels, J. L., Otto, F. and
Struthers, S. (2010) ‘Environmental issues from coal mining and their solutions’, Mining Science and Technology (China), 20(2), pp. 215–223.
doi: 10.1016/S1674-5264(09)60187-3. BP (2017) BP statistical review of world energy
2017. 66th Ed. BP. Available at:
https://www.bp.com/content/dam/bp-country/de_ch/PDF/bp-statistical-review-of-world-energy-2017-full-report.pdf.
Directorate General of Electricity (2017)
Electrification ratio of Indonesia. Jakarta: Directorate General of Electricity.
Directorate General of Mineral and Coal (2017a)
Coal export destination country. Jakarta: Directorate General of Mineral and Coal.
Directorate General of Mineral and Coal (2017b)
Realization of domestic coal consumption. Jakarta: Directorate General of Mineral and Coal.
Directorate General of Mineral and Coal (2017c)
Trend projection of coal reserves in Indonesia. Jakarta: Directorate General of Mineral and Coal.
Dyner, I. and Larsen, E. R. (2001) ‘From planning
to strategy in the electricity industry’, Energy Policy, 29(13), pp. 1145–1154.
doi: 10.1016/S0301-4215(01)00040-4. Energy Information Administration (2009) The
national energy modeling system: An overview 2009. Washington: Energy Information Administration.

The Availability of Indonesia’s Coal to Meet the … Gandhi K. Hudaya and Nendaryono Madiutomo
127
Fan, Y., Yang, R.-G. and Wei, Y.-M. (2007) ‘A system dynamics based model for coal investment’, Energy, 32(6), pp. 898–905. doi: 10.1016/j.energy.2006.09.015.
Ford, A. (1999) Modeling the environment: An
introduction to system dynamics modeling of environmental systems.
Island Press. Forrester, J. W. (1961) Industrial dynamics.
Waltham: M.I.T. Press. Geology Agency (2016) ‘Map of Indonesia’s coal
resources and reserves 2016’. Bandung: Badan Geologi, p. 1.
Ghaffarzadegan, N., Lyneis, J. and Richardson,
G. P. (2010) ‘How small system dynamics models can help the public policy process’, System Dynamics Review, 27(1), pp. 22–44. doi: 10.1002/sdr.442.
Höök, M., Zittel, W., Schindler, J. and Aleklett, K.
(2010) ‘Global coal production outlooks based on a logistic model’, Fuel, 89(11), pp. 3546–3558. doi: 10.1016/j.fuel.2010.06.013.
Hosseini, S. H., Shakouri G., H., Kiani, B., Pour,
M. M. and Ghanbari, M. (2014) ‘Examination of Iran’s crude oil production peak and evaluating the consequences: A system dynamics approach’, Energy Exploration & Exploitation, 32(4), pp. 673–690. doi:
10.1260/0144-5987.32.4.673. Indonesia Coal Mining Association (2016)
‘Indonesia coal industry update’. Tokyo: JOGMEG Coal Invesment Seminar, p. 24.
Kiani, B., Hosseini, S. H. and Roozbeh, H. A.
(2009) ‘Examining the Hubbert peak of Iran‘s crude oil: A system dynamics approach’, European Journal of Scientific Research, 25(3), pp. 437–447.
Leopold, A. (2016) ‘Energy related system
dynamic models: A literature review’, Central European Journal of Operations Research, 24(1), pp. 231–261. doi: 10.1007/s10100-015-0417-4.
Maggio, G. and Cacciola, G. (2012) ‘When will
oil, natural gas, and coal peak?’, Fuel, 98, pp. 111–123. doi: 10.1016/j.fuel.2012.03.021.
Ministry of Energy and Mineral Resources (2017)
Sektor pasokan energi: Produksi minyak, gas dan batubara. Jakarta:
Ministry of Energy and Mineral Resources Republic of Indonesia. Available at: http://calculator2050.esdm.go.id/assets/mini_paper/energy/id/Panduan Pengguna untuk Produksi Fosil.pdf.
Mohr, S. H., Wang, J., Ellem, G., Ward, J. and
Giurco, D. (2015) ‘Projection of world fossil fuels by country’, Fuel, 141, pp. 120–135. doi: 10.1016/j.fuel.2014.10.030.
Mohr, S. H. and Evans, G. M. (2009) ‘Forecasting
coal production until 2100’, Fuel, 88(11), pp. 2059–2067. doi: 10.1016/j.fuel.2009.01.032.
Patzek, T. W. and Croft, G. D. (2010) ‘A global
coal production forecast with multi-Hubbert cycle analysis’, Energy, 35(8), pp. 3109–3122. doi: 10.1016/j.energy.2010.02.009.
PT PLN (2015) Rencana usaha penyediaan
tenaga listrik (RUPTL) PT PLN (Persero) 2015-2024. Jakarta: PT PLN.
PT PLN (2017) Statistik PLN 2016. Jakarta: PLN. PWC (2017) Indonesia could deplete coal
reserves by 2033, www.pwc.com.
Available at: https://www.pwc.com/id/en/media-centre/pwc-in-news/2016/english/indonesia-could-deplete-coal-reserves-by-2033---pwc.html (Accessed: 10 October 2017).
Rosyid, F. A. and Adachi, T. (2016) ‘Coal mining
in Indonesia: Forecasting by the growth curve method’, Mineral Economics, 29(2–3), pp. 71–85. doi: 10.1007/s13563-016-0091-6.
Sterman, J. D. (2000) Business dynamics:
Systems thinking and modeling for a complex world. McGraw-Hill.
Sugiyono, A., Anindhita, Wahid, L. M. A. and
Adiarso (eds) (2016) Indonesia Energy Outlook 2016. Jakarta: BPPT-Press. Available at: https://www.researchgate.net/profile/Agus_Sugiyono/publication/305875716_Outlook_Energi_Indonesia_2016/links/5a4f2c46458515e71b091e67/Outlook-Energi-Indonesia-2016.pdf.
Sullivan, P. A. (2014) Use of dynamic modeling to
simulate energy market manipulation.
New Mexico University.

INDONESIAN MINING JOURNAL Vol. 22, No. 2, October 2019 : 107 - 128
128
Tang, X., Zhang, B., Höök, M. and Feng, L. (2010) ‘Forecast of oil reserves and production in Daqing oilfield of China’, Energy, 35(7), pp. 3097–3102. doi:
10.1016/j.energy.2010.03.043. Tao, Z. and Li, M. (2007) ‘System dynamics
model of Hubbert Peak for China’s oil’, Energy Policy, 35(4), pp. 2281–2286. doi: 10.1016/j.enpol.2006.07.009.
Tumiran (2017) Kebijakan energi nasional
menuju tahun 2050: Peran batubara mendukung ketahanan energi nasional. Jakarta.
Xu, J. and Li, X. (2011) ‘Using system dynamics for simulation and optimization of one coal industry system under fuzzy environment’, Expert Systems with Applications, 38(9), pp. 11552–11559. doi: 10.1016/j.eswa.2011.03.033.
Yunna, W., Kaifeng, C., Yisheng, Y. and Tiantian,
F. (2015) ‘A system dynamics analysis of technology, cost and policy that affect the market competition of shale gas in China’, Renewable and Sustainable Energy Reviews, 45, pp. 235–243. doi: 10.1016/j.rser.2015.01.060.