Embed Size (px)
Citation preview

The Automotive Industry in Turkey
2008 And Beyond?
Prof.Dr.Ercan TEZER / OSD General Secretary Presented in “TURKINVEST Meeting"

Founded in 1974
Main Objectives Are:
To Represent MV Sector In Public Authorities, Local and International Organisations
To Gather and Publish Various Information on MVI of Turkey
To Organize & Conduct Joint Actions in Different Fields
Is an Active Member of:
OICA ACEA Liaison Committee
ODETTE GAID Group
TAAM
OSD is a Partner of
ACEA / EUCAR, EU ERTRAC and EU Motor Vehicle Technical Committee
UN / WP 29
All Relevant Information is Found in OSD Web-Site:
www.osd.org.tr/
Otomotiv Sanayii Derneği / OSDAutomotive Manufacturers Association
Milestones of Turkish Economy
CLOSEDECONOMY
FREEMARKET
ECONOMY
1980
EU/TR CUSTOMSUNION
1996 *
WTOMEMBERSHIP
1995 *
FREE CIRCULATION
OF CAPITAL
1989
EU FULL MEMBERSHIPPERSPECTIVE
2002
EU ACCESSIONNEGOTIATIONS
DECISION
2005 ANDBEYOND
Changing Political and Business Habits
Towards a New Turkey
Political Uncertainty Resulting In Business Indecision
Striving Private Sector
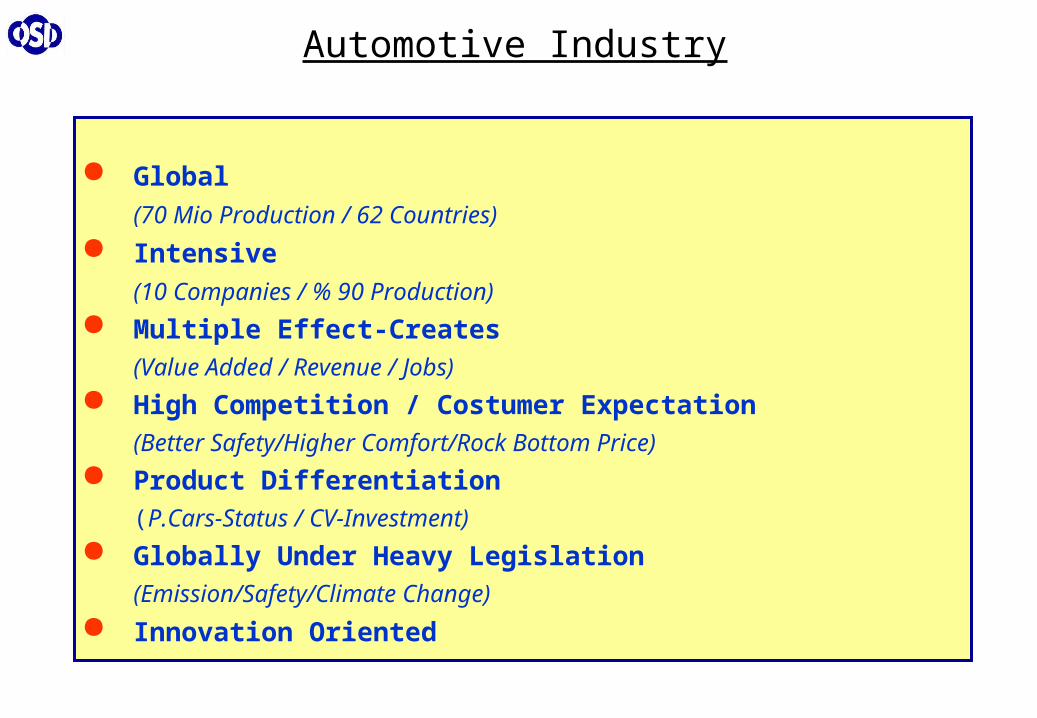
Global
(70 Mio Production / 62 Countries)
Intensive
(10 Companies / % 90 Production)
Multiple Effect-Creates
(Value Added / Revenue / Jobs)
High Competition / Costumer Expectation
(Better Safety/Higher Comfort/Rock Bottom Price)
Product Differentiation
(P.Cars-Status / CV-Investment)
Globally Under Heavy Legislation
(Emission/Safety/Climate Change)
Innovation Oriented
Automotive Industry

Global Delocalization“To be Manufacturer in Potential Markets and Enjoy With Low Operational Cost”
USA
S.AmericaAnd
Others
Europe
Japan
Korea
1950
1970
1980
1990
1970
1960
PRC
1980

11.596
10.7818.882
6.213
4.0863.0192.971
2.8902.578
2.3502.095
1.750
1.6601.2841.238
1.099997939
844785
1) JAPAN
2) USA
3) CHINA
4) GERMANY
5) S.KORE
6) FRANCE
8) BRAZIL
7) SPAIN
9) CANADA
10) INDIA
11) MEXICO
12) ENGLAND
13) RUSSIA
14) ITALY
15) TAILAND
16) TURKEY
17) İRAN
18) CZECH REPUBLIC
19) BELGIUM
20) POLAND
Ranking in EU (27)
Total 6
Buses 1LCV 2H.Trucks 6P.Cars 9
Production 1.300.000Capacity 1.500.000Exports 950.000Market 675.000
20081.1 Million Units in 2007
MVI in World – 2007 (x 1.000 Units)
2 Million Units in 2015
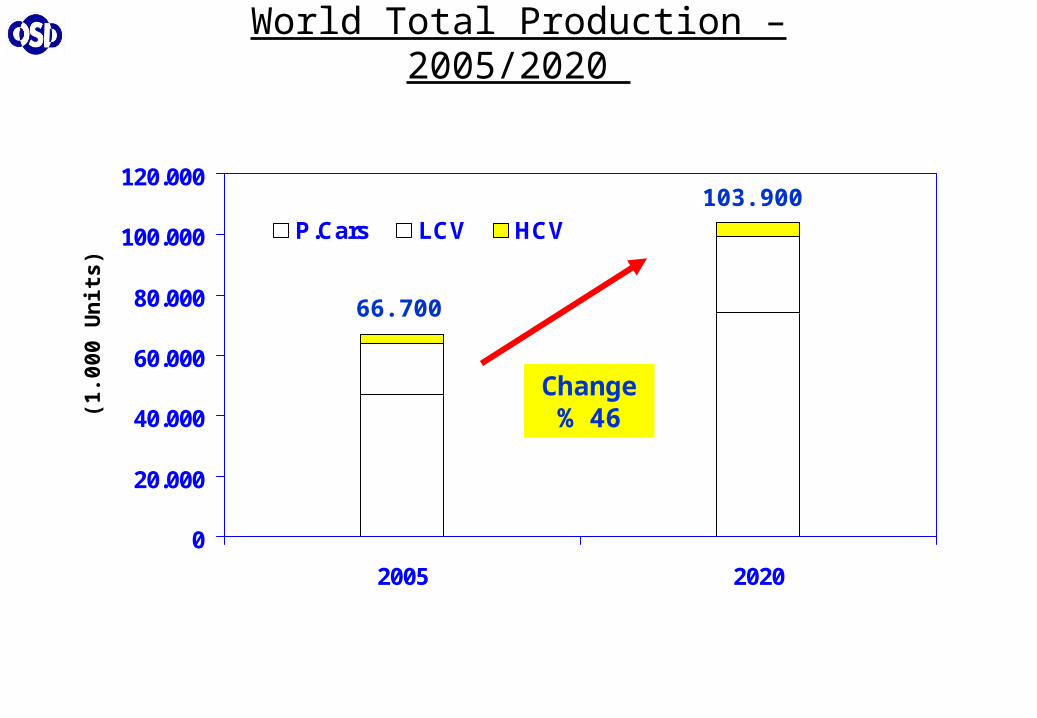
World Total Production – 2005/2020 (1
.000
Un
its)
0
20.000
40.000
60.000
80.000
100.000
120.000
2005 2020
P.Cars LCV HCV
66.700
103.900
Change% 46

Increase in Total Production By Regions 2005/2020
4,253,28
2,31
2,211,78
1,561,16
1,11
1,111,03
1,56
0 1 2 3 4 5
PRC
India
Asia/Pasific
E.Europe
Others
Mercosur
Korea
EU
N.America
Japan
World Total
2020 / 2005
Production Moves From West To East & North To South
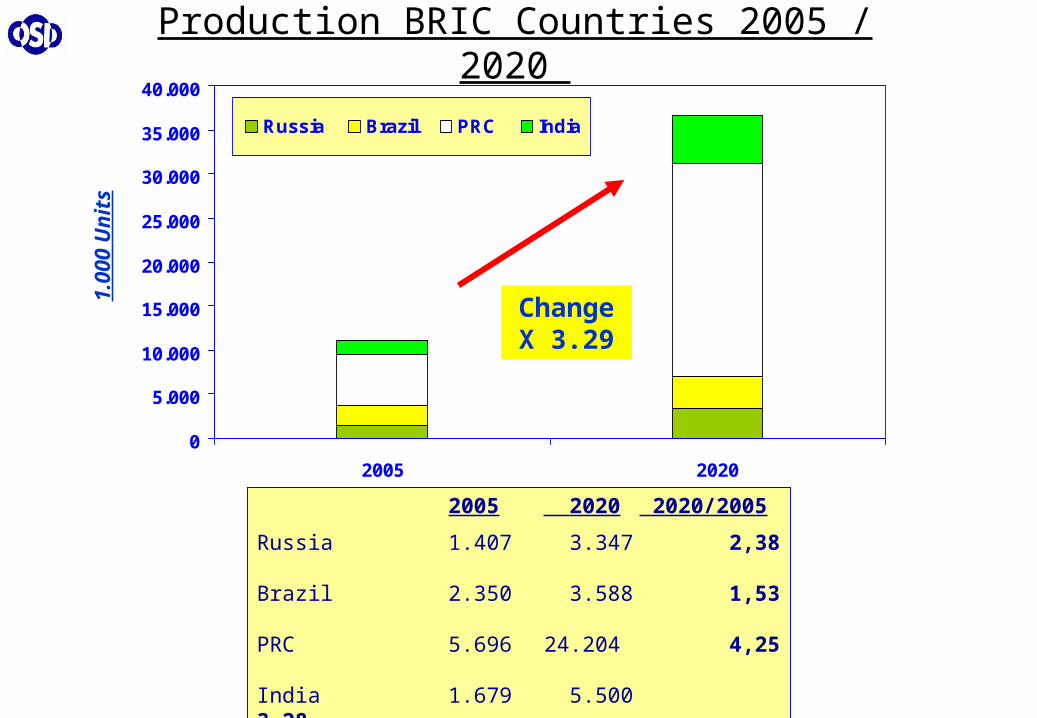
Production BRIC Countries 2005 / 2020
0
5.000
10.000
15.000
20.000
25.000
30.000
35.000
40.000
2005 2020
Russia Brazil PRC India1.
000
Un
its
2005 2020 2020/2005
Russia 1.407 3.347 2,38Brazil 2.350 3.588 1,53PRC 5.696 24.204 4,25India 1.679 5.500 3,28Total / BRIC 11.132 36.639 3,29Total / World 66.740 103.932 1,56
ChangeX 3.29

All Factor Indexes Are Picking up in Q4 2008 Bad News Flow
Raw Material and Oil&Energy Prices
Credit Crunch Libor +
Policy Interest Rate
Inflation
Unemployment
Drop in Global GDP Growth Results Slumps in LV Sales
2008 1.8 m
2009 3.5 m
2010 2.9 m
Global Recovery is Expected After 2011
New Trends Under Global Crisis

28.46928.24630.12626.10225.530
28.724
0
10.000
20.000
30.000
40.000
50.000
June July August
2007 2008
- 4,6% - 9,6% - 8,3%
1.550
1.358
955805
1.259
1.427
0
500
1.000
1.500
2.000
June July August
2007 2008
- 7,9% - 7.3% - 15.7%
185187
253
146170
231
0
100
200
300
400
500
June July August
2007 2008
- 8,6% - 9,0% - 21%
25.702
21.87121.53520.47919.15120.669
0
10.000
20.000
30.000
40.000
June July August
2007 2008
- 4,0% - 12,4% - 20,3%
Market Change In 2008 EU/Turkey
Commercial Vehicle
P.Cars
EU+EFTA
EU+EFTA
TR
TR
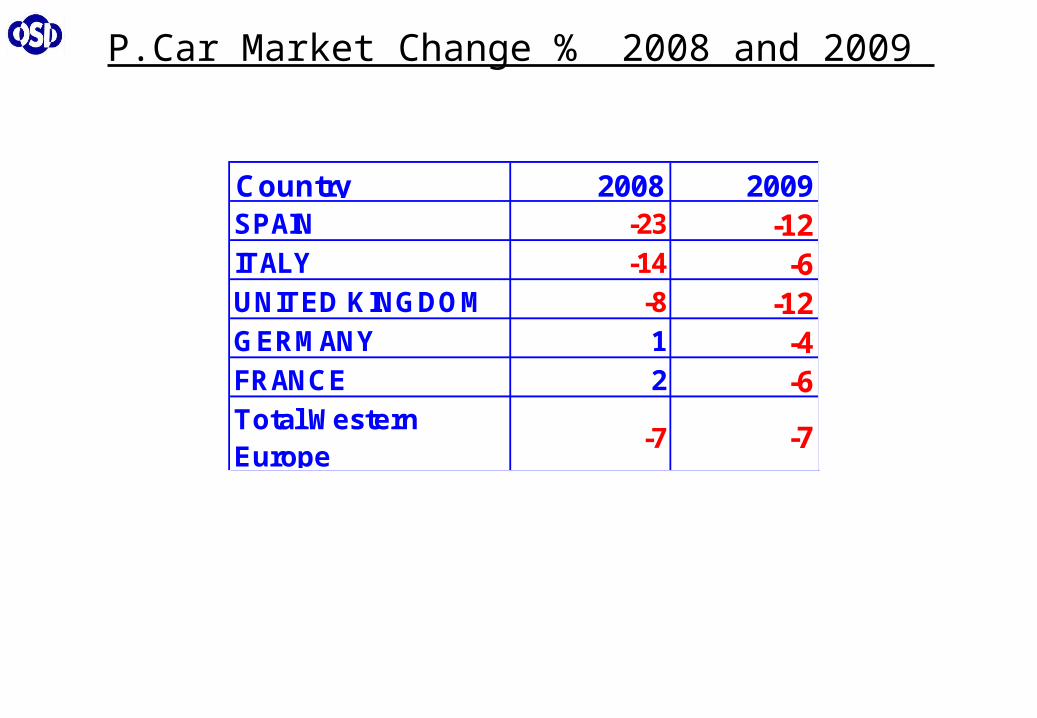
P.Car Market Change % 2008 and 2009
Country 2008 2009SPAIN -23 -12ITALY -14 -6UNITED KINGDOM -8 -12GERMANY 1 -4FRANCE 2 -6Total Western Europe
-7 -7

Turkey Keeps up With Recent Global Economic Trends in the Region
Longest Practice of Global Market Economy Emerging Economy Applying the International Rules of Free
Trade Such as Competition Law, Property Rights And Etc. International Capital Movements are Liberalized Up to Date Infrastructure for Commercial and Financial
Activities, Telecommunication and Transportation Competitive Industrial Products for the World Market
Long Term Relation With EU Within The Association Agreement Dated 1963
Candidate Country in Negotiation Process For EU Membership
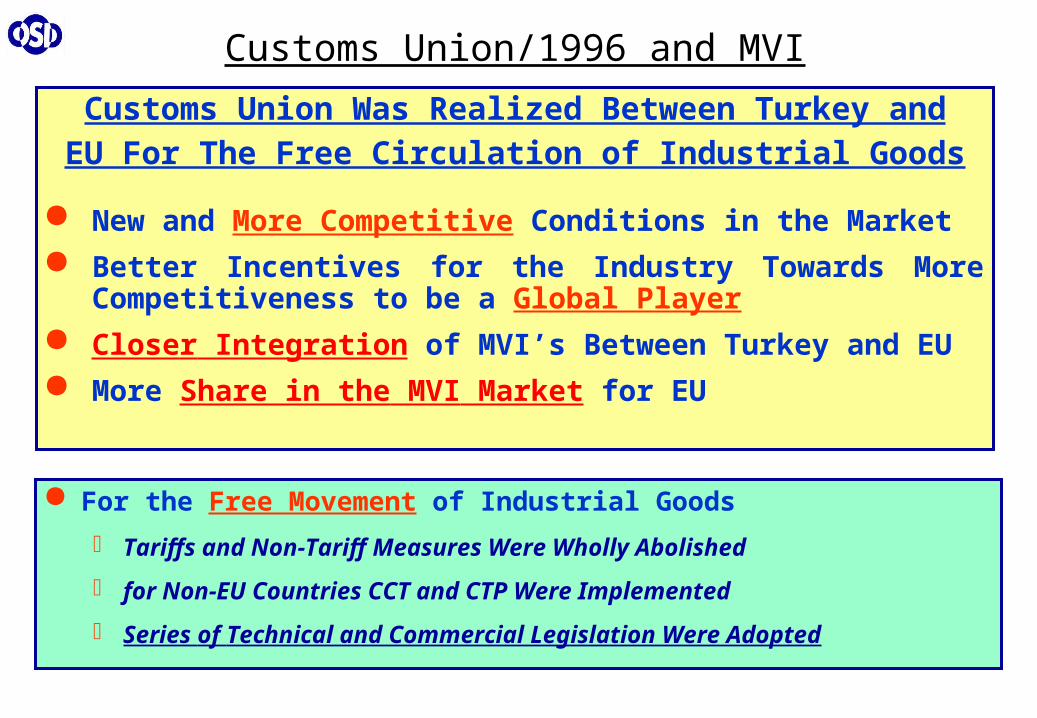
Customs Union Was Realized Between Turkey andEU For The Free Circulation of Industrial Goods
New and More Competitive Conditions in the Market
Better Incentives for the Industry Towards More Competitiveness to be a Global Player
Closer Integration of MVI’s Between Turkey and EU
More Share in the MVI Market for EU
Customs Union/1996 and MVI
For the Free Movement of Industrial Goods
Tariffs and Non-Tariff Measures Were Wholly Abolished
for Non-EU Countries CCT and CTP Were Implemented
Series of Technical and Commercial Legislation Were Adopted

Competition Rules / Block Exemption Legislation in MVI Import And Export Regimes and Common Rules State Aids Customs Code Common Commercial Policy Preferential Agreements Abolition of Technical Barriers Protection of Intellectual, Industrial and Commercial Properties Direct and Indirect Taxation Protection of Consumers Environmental Measures All Relevant MVI Technical Directives
Basic Steps Taken for the Approximation of the EU Legislation
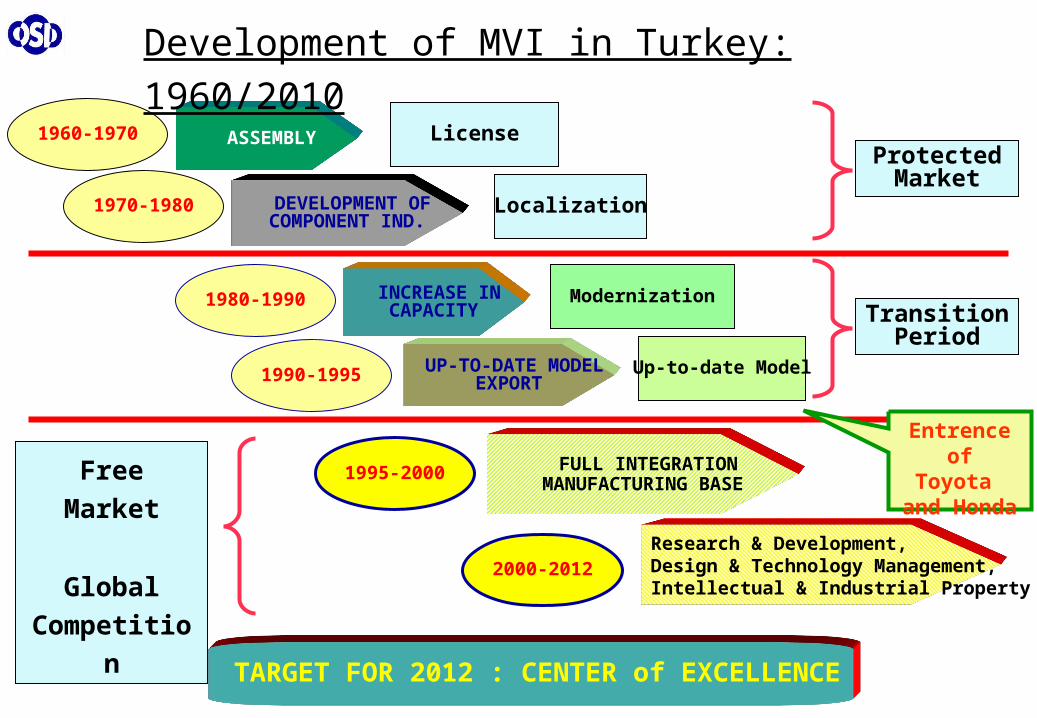
ASSEMBLY
DEVELOPMENT OFCOMPONENT IND.
INCREASE INCAPACITY
UP-TO-DATE MODELEXPORT
FULL INTEGRATIONMANUFACTURING BASE
Research & Development, Design & Technology Management,Intellectual & Industrial Property
1960-1970
1970-1980
1980-1990
1990-1995
1995-2000
2000-2012
TARGET FOR 2012 : CENTER of EXCELLENCE
License
Localization
Modernization
Up-to-date Model
Transition Period
Free Market
Global
Competition
Protected Market
Development of MVI in Turkey: 1960/2010
Entrence ofToyota
and Honda

Strengths
International Production And Design Technologies With Component Industry
Technological Infrastructure And Quality To Global Standards
Partnership And High Level Of Integration With International Manufacturers
Export Experience
Strategically Close Location To The Emerging Markets
Well Educated, Entrepreneur, Competitive Human Resources
Lower Man Hour Costs Compared To The EU
Weaknesses
Fluctuating Demand
Lack of Long Term Policies
Low Capacity Usage Rate Causing
High Production Cost
Imports Are Not Regulated
Efficiently And Thus Over-imports
High Energy Costs
Lack Of Effective Coordination
Between Vehicle Manufacturers
and Component Industry
SWOT Analysis / I
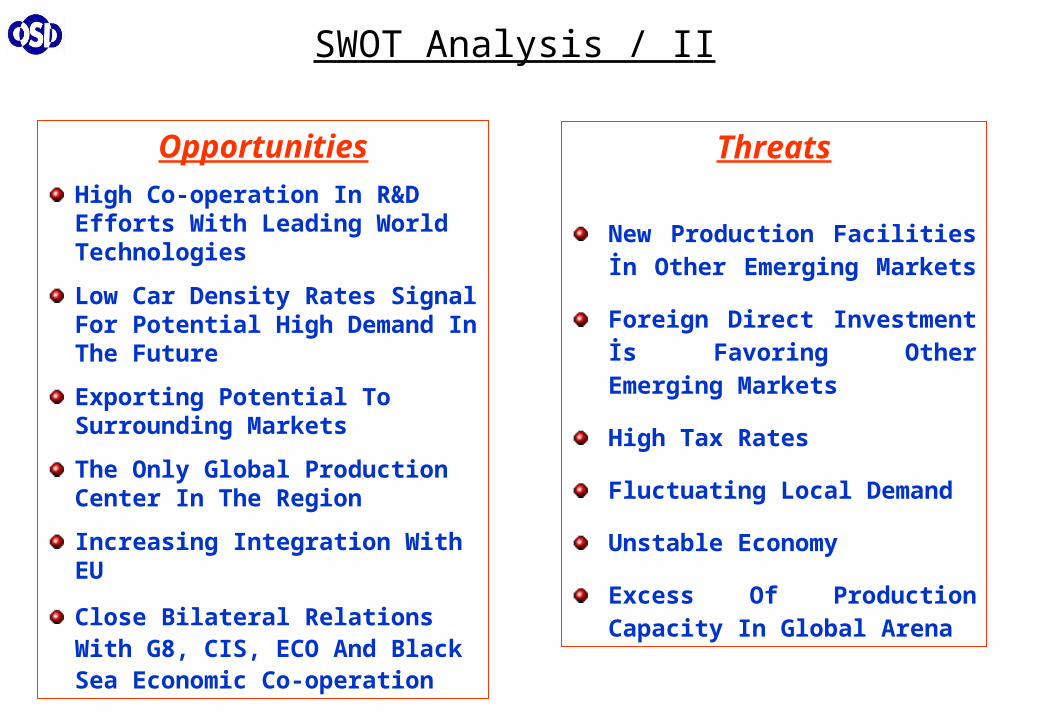
Opportunities
High Co-operation In R&D Efforts With Leading World Technologies
Low Car Density Rates Signal For Potential High Demand In The Future
Exporting Potential To Surrounding Markets
The Only Global Production Center In The Region
Increasing Integration With EU
Close Bilateral Relations With G8, CIS, ECO And Black Sea Economic Co-operation
Threats
New Production Facilities İn Other Emerging Markets
Foreign Direct Investment İs Favoring Other Emerging Markets
High Tax Rates
Fluctuating Local Demand
Unstable Economy
Excess Of Production Capacity In Global Arena
SWOT Analysis / II
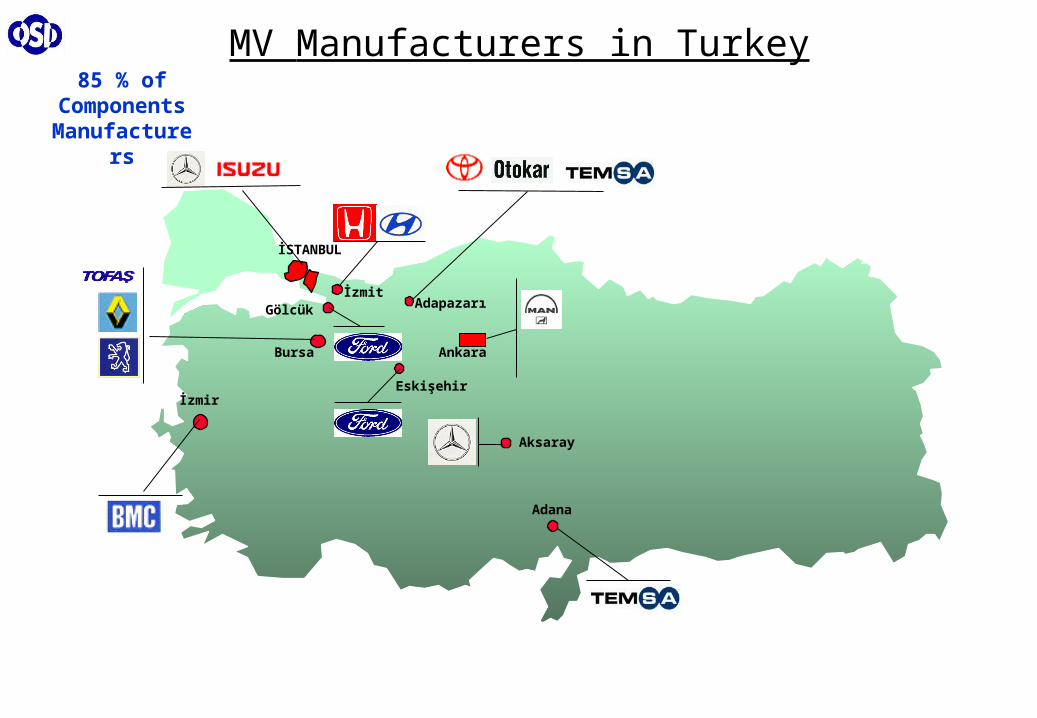
85 % of Components
Manufacturers
MV Manufacturers in Turkey
İzmir
Adapazarı
Ankara
İSTANBUL
Gölcük
Aksaray
İzmit
Bursa
Eskişehir
Adana

Motor Vehicle Manufacturers (2008)
TOFAŞ/FIAT JV FIAT 400.000O.RENAULT JV RENAULT 360.000TOYOTA FDI TOYOTA 150.000HYUNDAI ASSAN JV HYUNDAI 100.000HONDA FDI HONDA 50.000
1.060.000FORD OTOSAN JV FORD 350.000HYUNDAI ASSAN JV HYUNDAI 25.000KARSAN Local PEUGEOT 25.000B.M.C. Local Local 20.000M.BENZ TÜRK JV M.BENZ 20.000ANADOLU ISUZU JV ISUZU 13.000TEMSA Local Local 14.000OTOKAR Local LAND ROVER 8.000M.A.N. FDI MAN 5.000
480.000
1.540.000
Capacity Vehicle/Year
CV
Ownership
TotalCV Total
P.Cars
Companies Partner
P.Cars Total
Product ● Japanese Interest Was First Shown In Car Industry In 1994 With Toyota And Then Honda
● Toyota Brought New Concepts And A Remarkable Motivation To The Industry
● Toyota-Turkey Became One Of The Important Manufacturing Centers Of Toyota In Europe
● Isuzu, Hino And Mitsubishi Are In Commercial Vehicle Sector
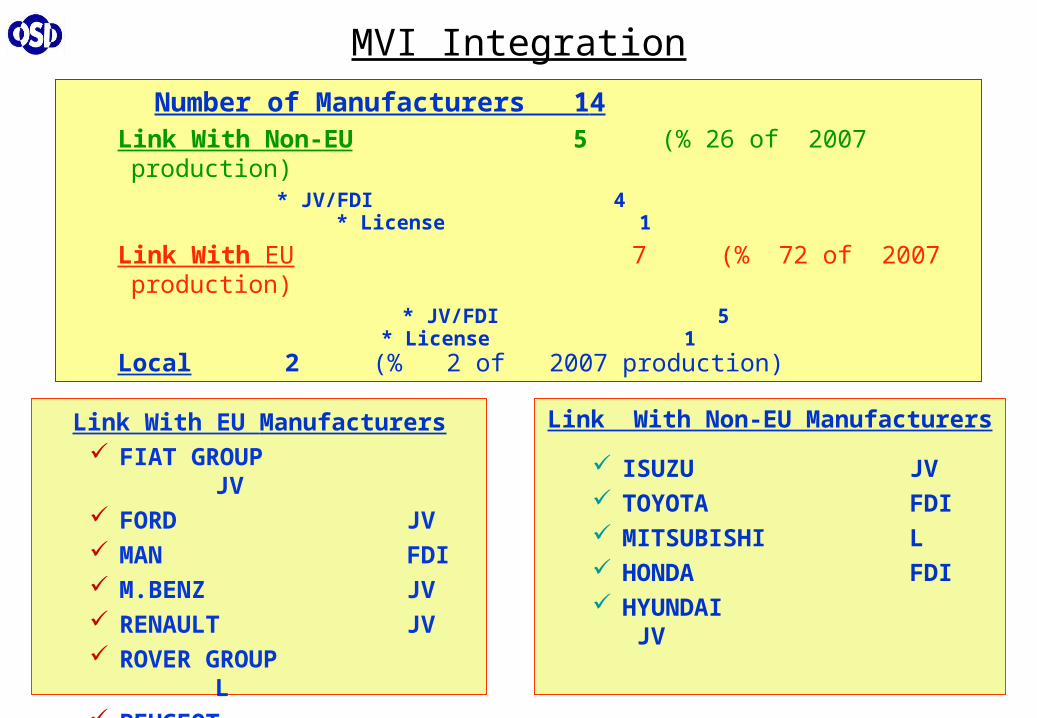
MVI Integration
Link With EU Manufacturers FIAT GROUP JV FORD JV MAN FDI M.BENZ JV RENAULT JV ROVER GROUP
L PEUGEOT L
Link With Non-EU Manufacturers
ISUZU JV TOYOTA
FDI MITSUBISHI L HONDA FDI HYUNDAI JV
Number of Manufacturers 14 Link With Non-EU 5 (% 26 of 2007 production) * JV/FDI 4 * License 1
Link With EU 7 (% 72 of 2007 production) * JV/FDI 5 * License 1
Local 2 (% 2 of 2007 production)
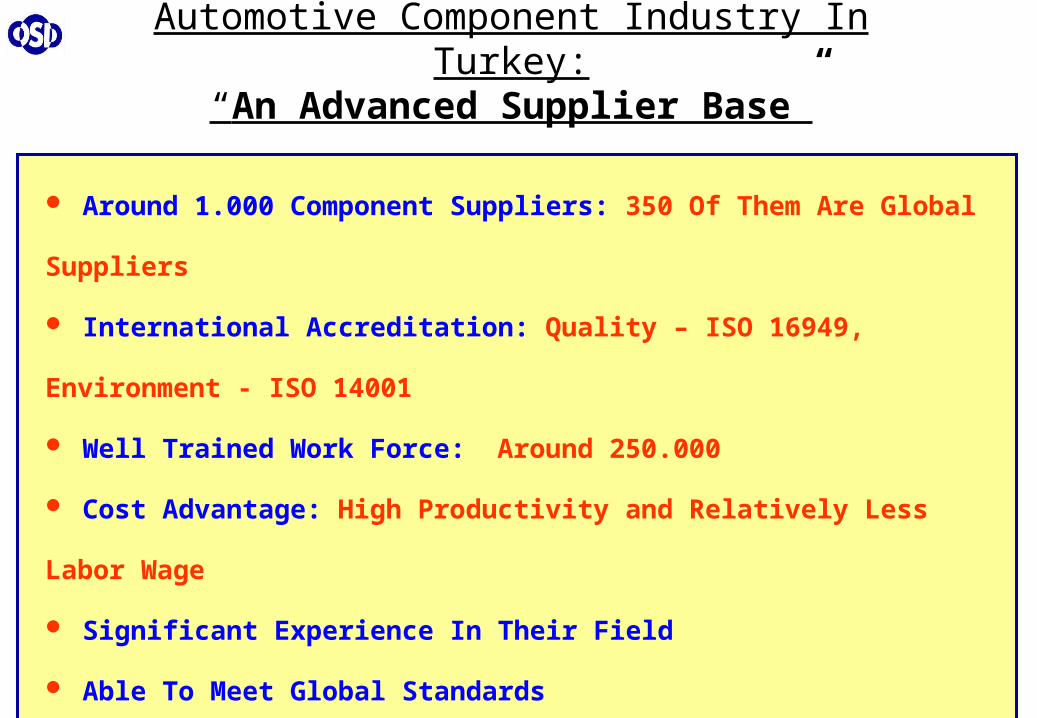
Automotive Component Industry In Turkey:“An Advanced Supplier Base”
Around 1.000 Component Suppliers: 350 Of Them Are Global Suppliers
International Accreditation: Quality – ISO 16949, Environment - ISO 14001
Well Trained Work Force: Around 250.000
Cost Advantage: High Productivity and Relatively Less Labor Wage
Significant Experience In Their Field
Able To Meet Global Standards
Able To Compete In Global Markets
Experience In Export Activities

0
200
400
600
800
1.000
1.200
1963
1964
1965
1966
1967
1968
1969
1970
1971
1972
1973
1974
1975
1976
1977
1978
1979
1980
1981
1982
1983
1984
1985
1986
1987
1988
1989
1990
1991
1992
1993
1994
1995
1996
1997
1998
1999
2000
2001
2002
2003
2004
2005
2006
2007
Passenger Cars
Total
11047
421348
431297
1.100635
3 243213
271175
Total Production: 3,000 in 1963
1,100,000 in 2007
History of the Production (x1.000)
High Fluctuations In the Past Have Had A Particularly Negative Effect On The
Development And Competitiveness Of The Industry
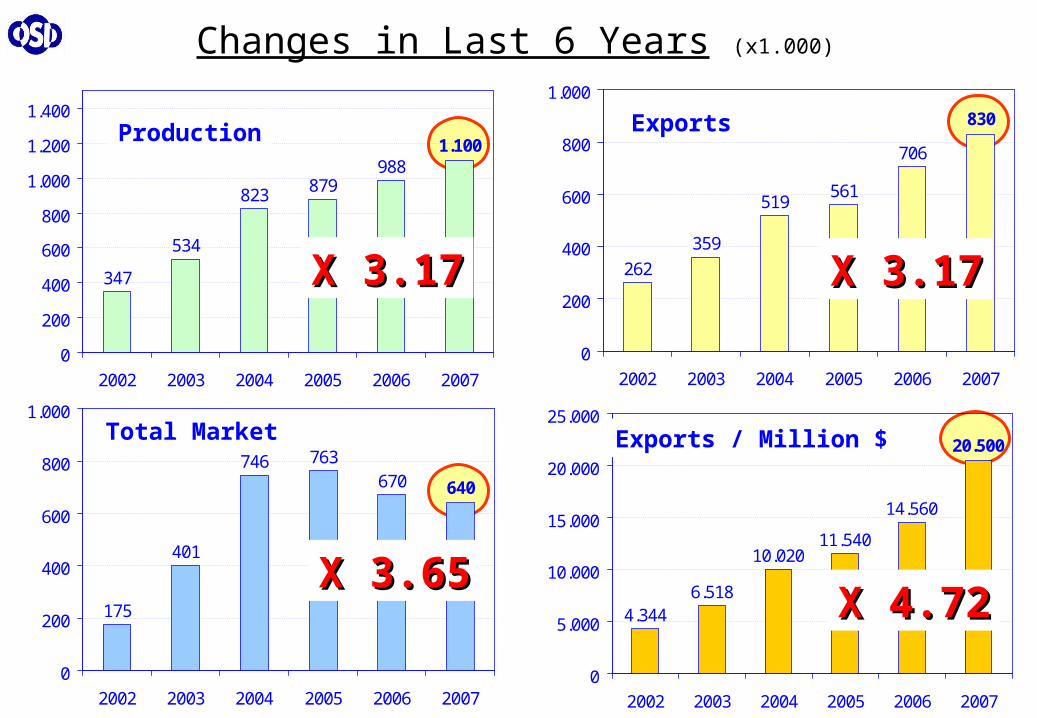
347
534
823 879988
1.100
0
200
400
600
800
1.000
1.200
1.400
2002 2003 2004 2005 2006 2007
262
359
519561
706
830
0
200
400
600
800
1.000
2002 2003 2004 2005 2006 2007
175
401
746 763670 640
0
200
400
600
800
1.000
2002 2003 2004 2005 2006 2007
4.3446.518
10.02011.540
14.560
20.500
0
5.000
10.000
15.000
20.000
25.000
2002 2003 2004 2005 2006 2007
Production
Total Market Exports / Million $
Exports
Changes in Last 6 Years (x1.000)
X 3.17X 3.17 X 3.17X 3.17
X 4.72X 4.72X 3.65X 3.65

Exports Share in Total Production is Over 75 %
(X 1000)
3 2 512 13
8 9
7164 62 62
7175
30
22
73
0
200
400
600
800
1.000
1.200
1.400
1.600
0
10
20
30
40
50
60
70
80
90
100
Exports 10 8 15 37 42 31 37 91 104 202 262 359 508 552 697 820
Production 345 453 269 326 329 400 405 326 468 286 357 562 823 879 988 1.100
Exports (% ) 3 2 5 12 13 8 9 30 22 71 73 64 62 62 71 75
1992 1993 1994 1995 1996 1997 1998 1999 2000 2001 2002 2003 2004 2005 2006 2007
Rate of Exports in
Production
Total Production % 75
P. Cars % 80
%

The Automotive Market is An Unsaturated One
Approximately 15 Million Vehicles Are To Be Sold In Turkey
To Reach To The Level Of Bulgaria In 10 Years
(Whose GDP Per Capita Are Rather Similar)
604510 493
391 343 361
144 138
0
200
400
600
800
Ge
rma
ny
Gre
ec
e
Sp
ain
Po
lan
d
Hu
ng
ary
Bu
lga
ria
WO
RL
D
Tu
rke
y
SMMT / Vehicle/1.000 Inhabitants in 2006

Automotive Culture 50 years of production tradition High Sense of Quality TQM, Lean Production, 6 Sigma Labor Peace unionized work force / collective bargaining since
1963 Qualified, Well-Trained, Motivated Labor Force at Competitive Cost Flexible Working Hours 7.5 hours / shift - 3 shifts / day - 6 days / week;
Rate of Absenteeism < 1.5 % Entrepreneurship $ 10 billion worth of Investment Partnership With World-Leading Manufacturers Experienced Local Component Industry / Supplier Base Unsaturated Domestic Market With High Potential of Demand More Incentives on R & D and New Investments Developed Infrastructure & Services in the Region
Logistics, Energy, Transport, Banking, Communication
Manufacturing Facilities With State-of-the-Art Technology
The Assets & Potential of MVI of Turkey

● A New Investor Will Search For The Opportunity To Develop New Products At
Moderately Lower Cost.
● All Automotive Products Become Obsolete In The Long Term, Therefore
Current Models Need To Be Renewed Within 2-3 Years.
● So The Continuity Of The Business Would Heavily Depend On The Ability To
Design And Launch New Products.
● In Order To Realize New Projects At Competitive Cost These Are Needed:
R&D Capabilities (Vehicle And Component Manufacturers)
o More Effective R&D Incentives
Advantages In Investment Cost
o Project-Based Investment Incentives For Both Vehicle And Component Industry In Major Exports Projects
What Will Lead to New Investment

1. CHINA
-Tax Vacation Of Two Years
-Tax Discount At 50% For Subsequent Three Years
-Production Activities In Certain Areas Or In Tech Development Enjoy Low
Tax Ratio ( 10%, 15%, 24%)
2. KOREA
-Tax Vacation Of Seven Years For High Tech Investments
-Tax Discount At 50% For Subsequent Three Years
-Royalties Paid For High Tech Areas Are Not Subject To Withholding Tax For 5 Years
Benchmarking With Other Countries / II
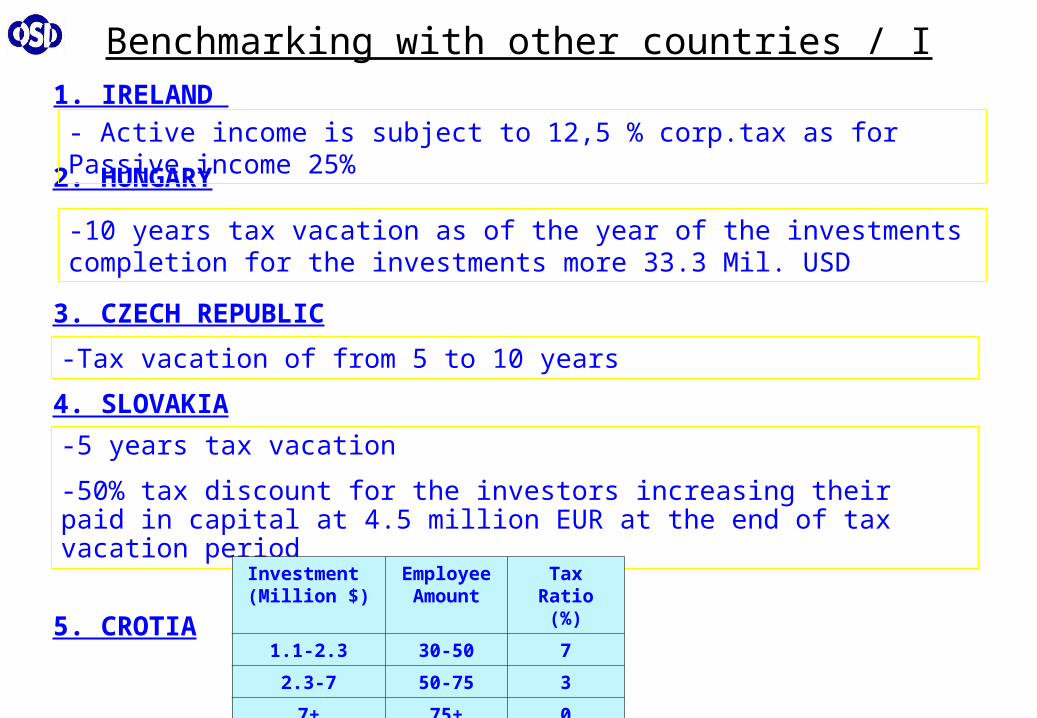
Benchmarking with other countries / I
2. HUNGARY
-10 years tax vacation as of the year of the investments completion for the investments more 33.3 Mil. USD
4. SLOVAKIA
-5 years tax vacation
-50% tax discount for the investors increasing their paid in capital at 4.5 million EUR at the end of tax vacation period
1. IRELAND
- Active income is subject to 12,5 % corp.tax as for Passive income 25%
3. CZECH REPUBLIC
-Tax vacation of from 5 to 10 years
5. CROTIA
Investment (Million $)
EmployeeAmount
Tax Ratio(%)
1.1-2.3 30-50 7
2.3-7 50-75 3
7+ 75+ 0

Incentives For Export Oriented Investments That Are Aimed At The Development And Production Of Competitive Products
Were Abolished
The Tax Incentive That Was Previously 26,4 % Decreased To 13,2 %
According To Act 4842, New Economic Investments That Will Deliver Internationally Competitive Vehicle Models With High Added Value Requiring The Deployment Of High Manufacturing Technology, Fall Within The Scope Of “General Incentive Regulations”
Communiqué2002/ 1
Act4842
Investment Sum 100 100
Investment Allowance (%) 200 40
Corporate Tax Exemption (%) 200 40
Provided Tax Incentive(33% - 19.8%) x 200%
= 26.4 %(33% - 0%) x 40%
= 13.2 %
Net Allowance Rate (%)(33 % - 19.8 %)
= 13.2 % (33 % - 0 %)
= 33 %
* Corporate Tax (%) 30 33
* Fund Contribution (%) 10 0
* Withholding Tax (%) - 19,8 0,0
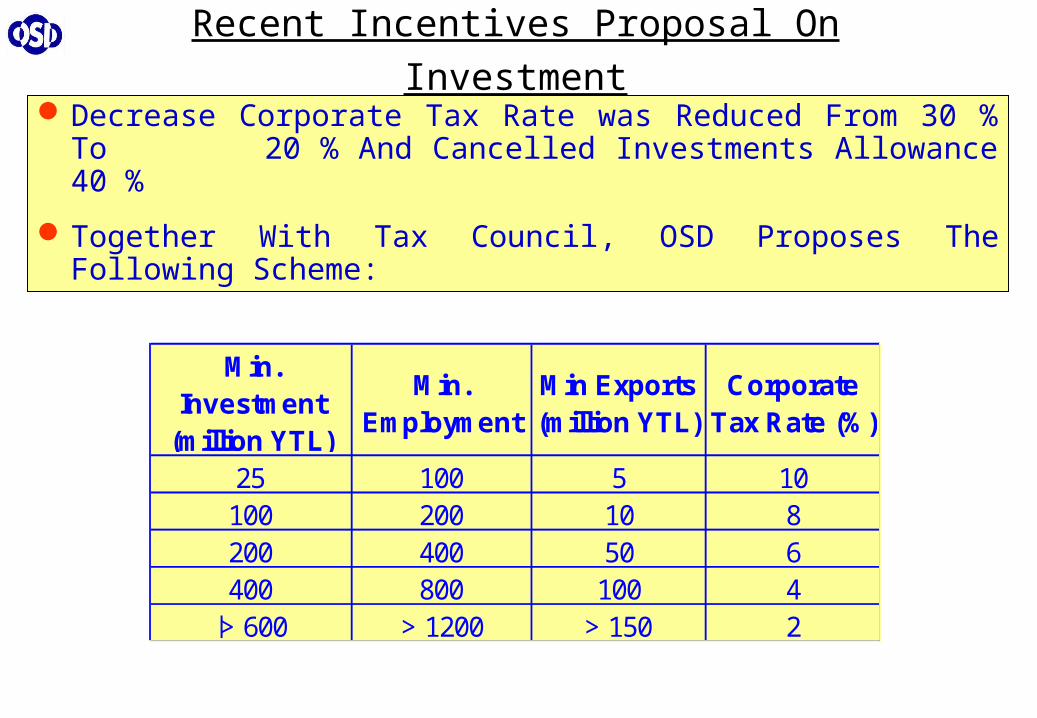
Recent Incentives Proposal On Investment
Decrease Corporate Tax Rate was Reduced From 30 % To 20 % And Cancelled Investments Allowance 40 %
Together With Tax Council, OSD Proposes The Following Scheme:
Min. Investment
(million YTL)
Min. Employment
Min Exports (million YTL)
Corporate Tax Rate (%)
25 100 5 10100 200 10 8200 400 50 6400 800 100 4
|> 600 > 1200 > 150 2

Recent Developments on R&D Activities
A New Incentive Scheme is Now Covering R&D Activities in Companies to be Effective This Year Such As:
100 % Deduction of R&D Expenses From Corporate Tax Came into Operation in 2008
Tax and Social Security Funds Payment Exemption for Those Working in R&D Activities
Government Assigned Yearly $ 300 Million to TUBİTAK in Order to Support R&D Activities and Targeted to Increase R&D Expenses up to 2 % of GNDP in 5 Years
Automotive Technology and R&D Center – OTAM(*) was Established in Istanbul Technical University-ITU with $ 12 Million to Start off
TUBİTAK-MAM is Providing Large Scale of Basic Services for R&D
(*) OSD, ITU (Istanbul Technical University) , TAYSAD (Assoc. of Component Manufacturers), UIB (Union of Vehicle & Component Exporters) are the Partners of OTAM

Offices
(1445 m2)Vehicle
Laboratory (1640 m2)
IC Engines Laboratory (1640 m2)
OTAM was Established by (OSD), The Scientific and Technical Research Council of Turkey (TÜBİTAK) and Istanbul Technical University (İTÜ) in 2004
OTAM is Formed as an R&D Company in 2007 (OSD, TAYSAD, İTÜ, UİB) to carry out of R&D and Type Approval Tests in Cooperation with ITU
OTAM is Mainly Specialized in the Areas of Engine, Emission, Vibration, Noise and Chassis / Body Analysis
Automotive Technology / R&D Center OTAM

Prospects of the Turkish Automotive Industry
o In The Short Term Production: Over 1,0 Million
Exports: Over 0,8 Million Already Realized
o In The Medium Term Production: 2,0 Million
Exports: 1,5 Million Can be Achieved
Direct Employment Of 600,000
Total Exports Of $ 50 Billion
By Means of Additional Investment At Least $ 5 Billion
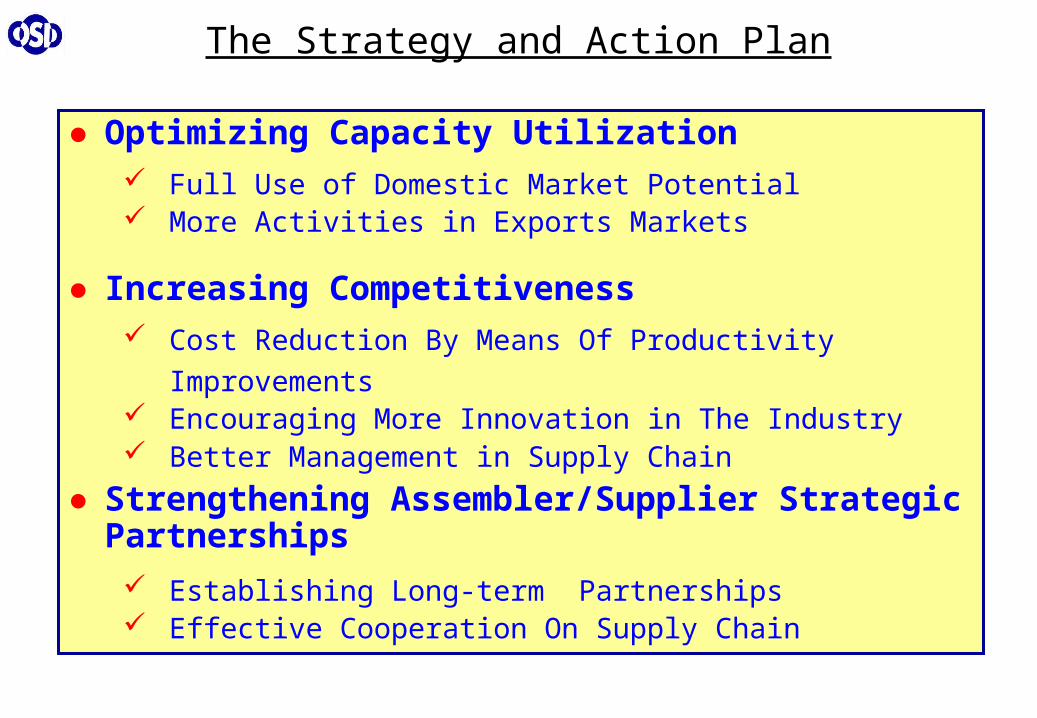
● Optimizing Capacity Utilization Full Use of Domestic Market Potential More Activities in Exports Markets
● Increasing Competitiveness Cost Reduction By Means Of Productivity Improvements Encouraging More Innovation in The Industry Better Management in Supply Chain
● Strengthening Assembler/Supplier Strategic Partnerships
Establishing Long-term Partnerships Effective Cooperation On Supply Chain
The Strategy and Action Plan

Current International Trophies
● Ford OTOSAN, Among European Ford Factories, Has Been Selected As The Best Motor Vehicle Manufacturer In The Last Five Years.
● Toyota Factory In Adapazarı Was Selected The Best Worldwide Toyota Manufacturing Plant In 2006.
Ford Connect “VAN of the year” in 2003 Production: İzmit
FIAT Doblo“VAN of the year” in 2006 Production: Bursa
Renault Clio III“Car of the year” in 2006 Production: Bursa
Ford Transit“ VAN of the year” in 2007Production: Kocaeli
FIAT LINEA “Autobest 2008”Production: Bursa
TEMSA DIAMOND“Busbuilder of the year 2007”Production: Adana
FIAT FIORINO“Van of the year” in 2009 Production: Bursa

TEMSA TEMSA IS A BUS PRODUCERIS A BUS PRODUCER
TURKEY IS A CENTER OF TURKEY IS A CENTER OF
GLOBAL AUTOMOTIVE PRODUCTIONGLOBAL AUTOMOTIVE PRODUCTION
AndAnd
IS TO BE A “CENTER of EXCELLENCE”IS TO BE A “CENTER of EXCELLENCE”


![$9$,/$%/( Single-Channel Monochrome On-Screen … ns OSD Fall Time OSD insertion mux register OSDM[5,4,3] = 011b 60 ns OSD Insertion Mux Switch Time OSD insertion mux register OSDM[2,1,0]](https://img.pdfslide.us/doc/110x75/5ade5f927f8b9afd1a8b4e03/9-single-channel-monochrome-on-screen-ns-osd-fall-time-osd-insertion.jpg)