Embed Size (px)
Citation preview
The AustralianONLINECONSUMERLANDSCAPEMarch 2012

THE AUSTRALIAN ONLINEMARKET & GLOBAL POPULATION
Internet usage in Australia is widespread and approaching saturation point with only minimal increases in total penetration expected.
Internet World Stats cites Australia as one of the lead-ing nations in terms of internet penetration as a proportion of the total population (90% penetration ). Nielsen Online Ratings finds 81% of Australians aged 16 years and above, and 75% of Australians aged two years and above, can be classified as an active online user (i.e. has used the internet in the past month).
As the uptake of internet use in Australia is approach-ing saturation point, it has become increasingly valuable to explore and quantify exactly how consum-ers are behaving online: what activities they conduct; with what frequency; using which devices; and in which environments; as well as place their online behaviours in context against other media behaviours. The key indicators of a sophisticated online popula-tion, such as the adoption of mobile internet activities and the way Australians have embraced social media and their ever increasing confidence in sharing their opinions and content online, reveal opportunities for marketers, content creators and publishers.
02
c 2012 The Nielsen Company.
It is estimated that 30% of the world’s population is now online, representing over two billion people (2,267m) . By continent, North America has the high-est penetration at 79%, Oceania & Australia second at 67%, closely followed by Europe at 61%. Volume of users tells a different story as Asia domi-nates with just over one billion users, Europe follows with 500 million followed by North America with 273 million . Ranked on internet users as a percentage of total population, Australia has the 5th highest level of internet penetration in the world . Total penetration in Australia, as at December 2011, lies at 90% just ahead of Netherlands and Denmark. Australia is the only non-European nation amongst the top five countries ranked by internet penetration.
1 http://www.internetworldstats.com/sp/au.htm2 http://www.abs.gov.au/ausstats/[email protected]/mf/8153.0/3 http://www.abs.gov.au/AUSSTATS/[email protected]/DetailsPage/8153.0Jun%202010?OpenDocument4 http://www.crikey.com.au/2010/09/21/wireless-on-the-rise-but-fixed-broadband-still-does-the-work/5 http://www.acma.gov.au/WEB/STANDARD/pc=PC_312389
Australians aged 16+Active online
81% 14.7m16+
Australians aged 2+Active online
75% 16.4m2+ Ranked on internet users as a percentage of total population, Australia has the 5th highest level of internet penetration in the world.
Figure 1.0: Active internet users, month of January 2012Source: Nielsen Online Ratings January 2012, percentage calculated using ABS population figures
1
2
3
4
5

MEDIA CONSUMPTION &CONTENT DELIVERY ISNO LONGER LINEAR
There is a need to keep pace with the fragmented and increasingly complex environment that has resulted from the rise of the internet - infiltrating consumers’ lives, habits and patterns of behaviour with the continual emergence of new online activities and serv-ices, new devices supporting online access and connectivity and, generally, presenting consumers with new ways of doing old things.
More than anything, the rise of the internet continues to present consumers with choices and this is the area that is difficult to keep pace with. Today’s consumers have choices over the screen they select to watch TV content as well as the source from which they obtain it; their method of shopping, of doing their product research and how they share their opinion about the item they just bought; and choices in the way they get to know, and interact with, brands.
All of these choices combined present marketers with a myriad of scenarios and paths to navigate. Media consumption and content delivery is no longer linear and only the most informed, intuitive and innovative marketers are likely to succeed in reaching and engaging their consumers in such an environment.
03
c 2012 The Nielsen Company.
Highlights from the just released Nielsen 2012 Australian Online Consumer Report include:
• Time spent accessing mobile internet continues its upward trend
• Smartphones take share of pocket: 51% of online Australians aged 16+ now own a smartphone
• Tablet computers more than doubled to 18% of households - forecast to be 39% by 2013. Substantial growth in accessing online media using devices other than desktop and laptop PCs while commuting or travelling increased from 42% in 2010 to 55% in 2011.
• Multi-screen behaviour is now a daily habit for many Australians: Six in ten online Australians have used the internet while watching TV.
• More than one in five online Australians shop/browse online between 6pm and 10pm.
• One of the key areas of growth in Australians’ partici-pation with social media in 2011 was in ‘Liking’ brands (now 57% up from 46% in 2010) and interacting with brands on social media platforms (now 47% up from 41% in 2010).
• Consumers draw on a variety of sources and resources to support their decision making: 71% read other consumers’ opinions and discussions about brands online and 59% watch online videos to help inform their purchase choices.
Nielsen is delighted to provide you with thissample of key findings from our 2012Australian Online Consumer Report.
Included are valuable previews into the evolving online landscape, which is presenting Australian consumers with new ways of doing old things, from shopping, watching and consuming television content right through to how they research and gather information. To address these changing behaviours, today’s marketers face new chal-lenges to keep pace with the fragmented Online environment.
The 2012 Australian Online Consumer Report provides today’s marketers with a base of knowl-edge to assist them in formulating and designing their strategies and tactics for the coming year.
For more details:2012 Australian Online Consumer Report
04
c 2012 The Nielsen Company.
4 24 8
4 2432 12
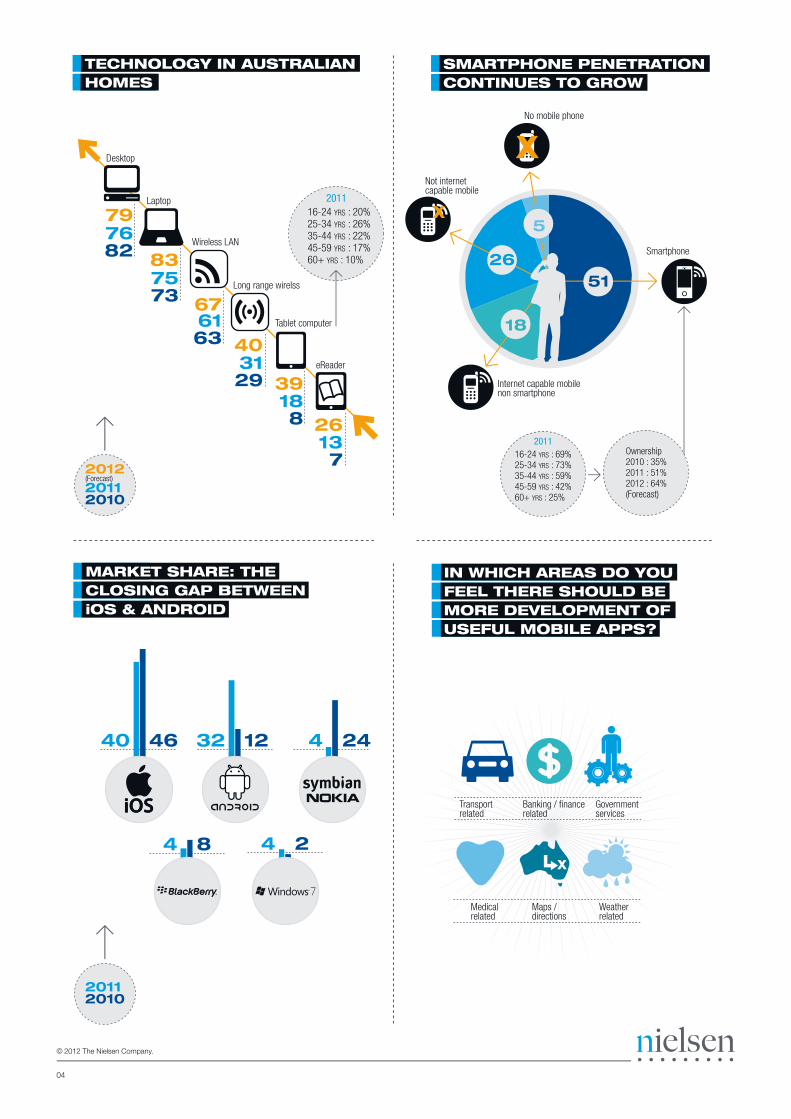
SMARTPHONE PENETRATIONCONTINUES TO GROW
IN WHICH AREAS DO YOU FEEL THERE SHOULD BE MORE DEVELOPMENT OF USEFUL MOBILE APPS?
TECHNOLOGY IN AUSTRALIAN HOMES
MARKET SHARE: THE CLOSING GAP BETWEEN iOS & ANDROID
76
75
61
31
18
13
82
73
63
29
8
7
79
83
67
39
26
Desktop
Laptop
Wireless LAN
Long range wirelss
Tablet computer
eReader
16-24 YRS : 20% 25-34 YRS : 26% 35-44 YRS : 22% 45-59 YRS : 17% 60+ YRS : 10%
x
x
51
18
26
5
Ownership2010 : 35%2011 : 51%2012 : 64%(Forecast)
16-24 YRS : 69% 25-34 YRS : 73% 35-44 YRS : 59% 45-59 YRS : 42% 60+ YRS : 25%
Smartphone
Internet capable mobile non smartphone
No mobile phone
Not internet capable mobile
40 46
Medicalrelated
Maps / directions
2011
2011
Transport related
Banking / financerelated
Governmentservices
Weatherrelated
40
201220112010
(Forecast)
20112010
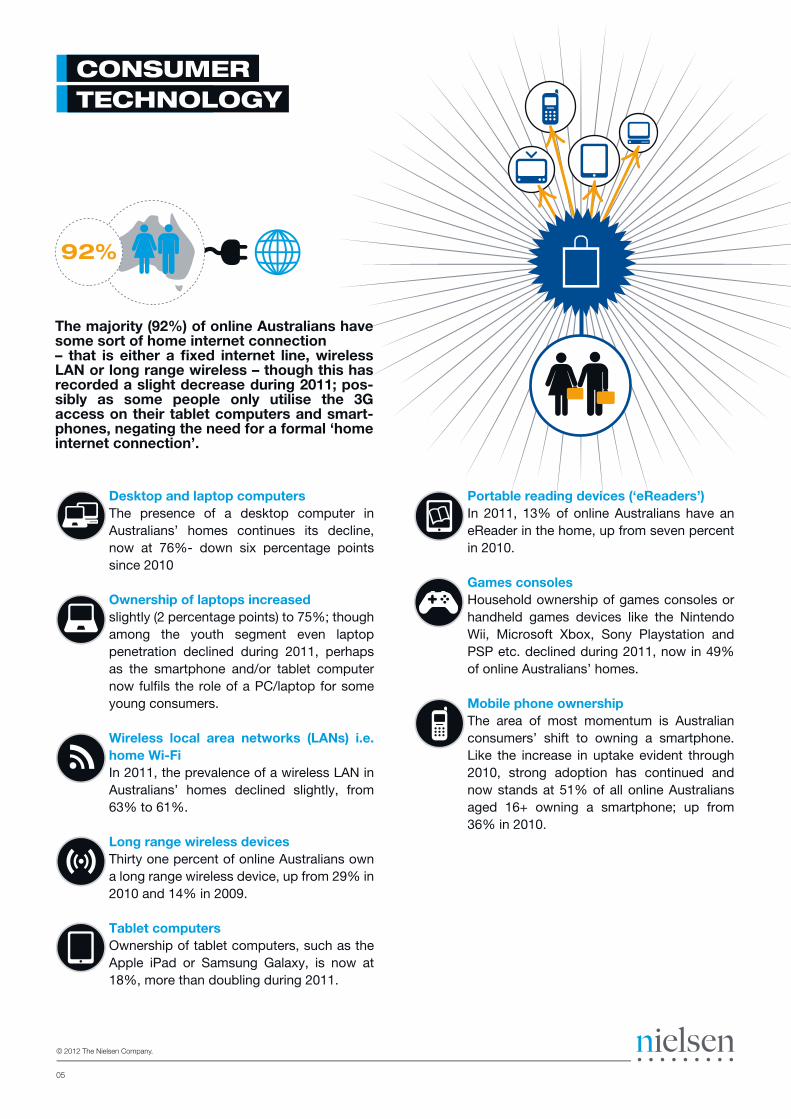
CONSUMERTECHNOLOGY
Desktop and laptop computersThe presence of a desktop computer in Australians’ homes continues its decline, now at 76%- down six percentage points since 2010 Ownership of laptops increased slightly (2 percentage points) to 75%; though among the youth segment even laptop penetration declined during 2011, perhaps as the smartphone and/or tablet computer now fulfils the role of a PC/laptop for some young consumers.
Wireless local area networks (LANs) i.e. home Wi-FiIn 2011, the prevalence of a wireless LAN in Australians’ homes declined slightly, from 63% to 61%.
Long range wireless devicesThirty one percent of online Australians own a long range wireless device, up from 29% in 2010 and 14% in 2009.
Tablet computersOwnership of tablet computers, such as the Apple iPad or Samsung Galaxy, is now at 18%, more than doubling during 2011.
05
c 2012 The Nielsen Company.
Portable reading devices (‘eReaders’)In 2011, 13% of online Australians have an eReader in the home, up from seven percent in 2010.
Games consolesHousehold ownership of games consoles or handheld games devices like the Nintendo Wii, Microsoft Xbox, Sony Playstation and PSP etc. declined during 2011, now in 49% of online Australians’ homes.
Mobile phone ownershipThe area of most momentum is Australian consumers’ shift to owning a smartphone. Like the increase in uptake evident through 2010, strong adoption has continued and now stands at 51% of all online Australians aged 16+ owning a smartphone; up from 36% in 2010.
The majority (92%) of online Australians have some sort of home internet connection– that is either a fixed internet line, wireless LAN or long range wireless – though this has recorded a slight decrease during 2011; pos-sibly as some people only utilise the 3G access on their tablet computers and smart-phones, negating the need for a formal ‘home internet connection’.
92%
06
c 2012 The Nielsen Company.
44% 39%
39% 33%
65%
66%
46%
29%
15%
24:2426:12
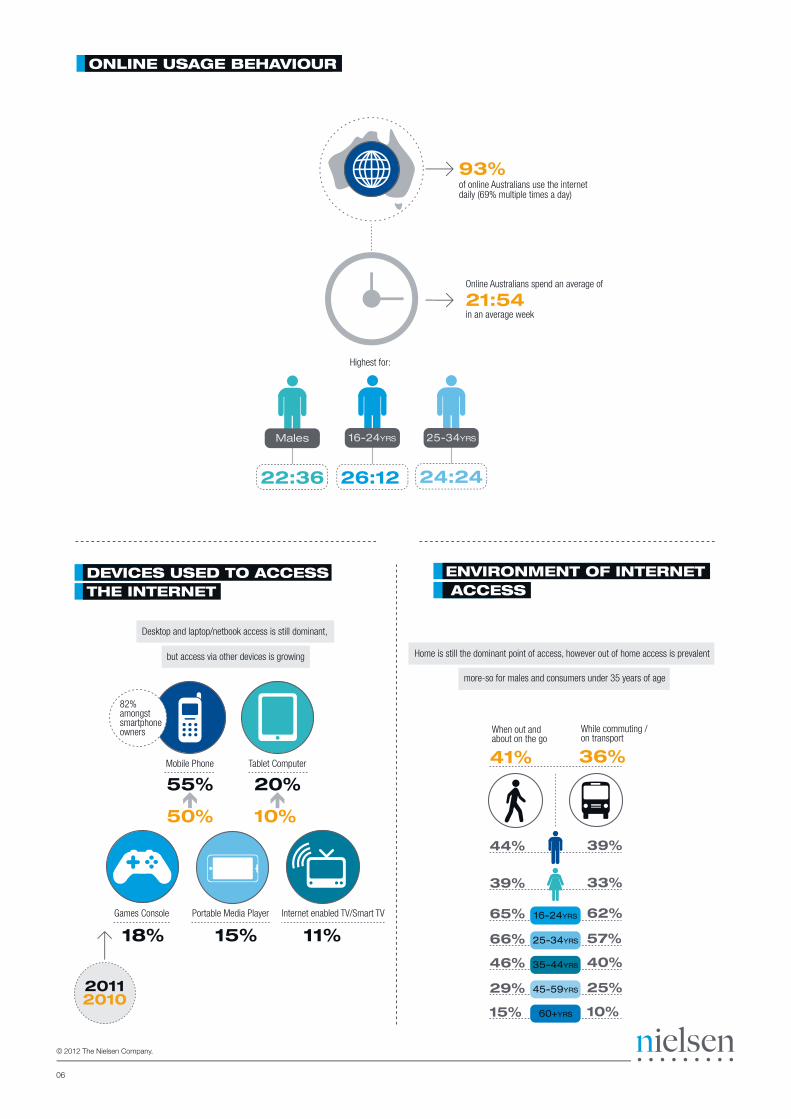
ENVIRONMENT OF INTERNET ACCESS
ONLINE USAGE BEHAVIOUR
DEVICES USED TO ACCESSTHE INTERNET
of online Australians use the internet daily (69% multiple times a day)
93%
21:54Online Australians spend an average of
in an average week
Males 16-24YRS 25-34YRS
22:36
Highest for:
Mobile Phone
55%
50%
20%
10%
18% 15% 11%
20112010
Tablet Computer
Games Console Portable Media Player Internet enabled TV/Smart TV
Home is still the dominant point of access, however out of home access is prevalent
more-so for males and consumers under 35 years of age
When out andabout on the go
While commuting / on transport
41% 36%
16-24YRS
25-34YRS
35-44YRS
45-59YRS
60+YRS
62%
57%
40%
25%
10%
Desktop and laptop/netbook access is still dominant,
but access via other devices is growing
82%amongstsmartphoneowners
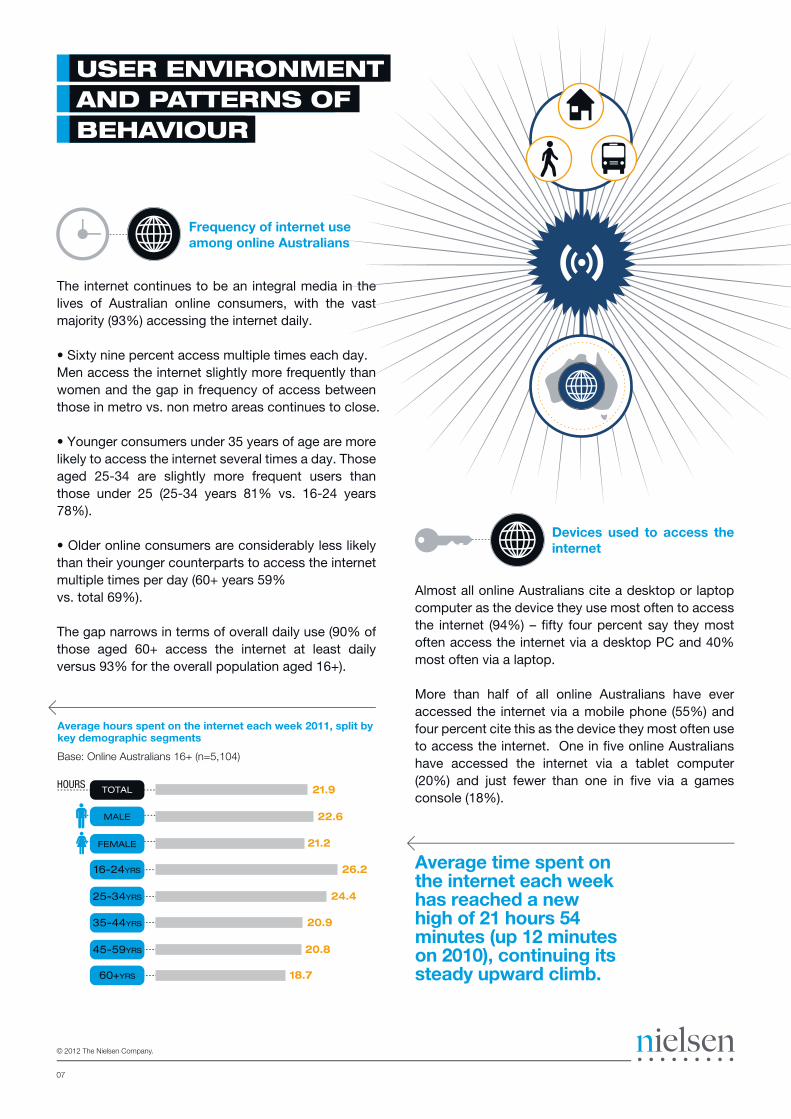
USER ENVIRONMENTAND PATTERNS OFBEHAVIOUR
The internet continues to be an integral media in the lives of Australian online consumers, with the vast majority (93%) accessing the internet daily.
• Sixty nine percent access multiple times each day.Men access the internet slightly more frequently than women and the gap in frequency of access between those in metro vs. non metro areas continues to close.
• Younger consumers under 35 years of age are more likely to access the internet several times a day. Those aged 25-34 are slightly more frequent users than those under 25 (25-34 years 81% vs. 16-24 years 78%).
• Older online consumers are considerably less likely than their younger counterparts to access the internet multiple times per day (60+ years 59%vs. total 69%).
The gap narrows in terms of overall daily use (90% of those aged 60+ access the internet at least daily versus 93% for the overall population aged 16+).
07
c 2012 The Nielsen Company.
Frequency of internet use among online Australians
Devices used to access the internet
Average time spent on the internet each week has reached a new high of 21 hours 54 minutes (up 12 minutes on 2010), continuing its steady upward climb.
Average hours spent on the internet each week 2011, split by key demographic segments
Base: Online Australians 16+ (n=5,104)
Almost all online Australians cite a desktop or laptop computer as the device they use most often to access the internet (94%) – fifty four percent say they most often access the internet via a desktop PC and 40% most often via a laptop.
More than half of all online Australians have ever accessed the internet via a mobile phone (55%) and four percent cite this as the device they most often use to access the internet. One in five online Australians have accessed the internet via a tablet computer (20%) and just fewer than one in five via a games console (18%).
22.6
21.2
21.9
FEMALE
MALE
TOTAL
16-24YRS
25-34YRS
35-44YRS
45-59YRS
60+YRS
26.2
24.4
20.9
20.8
18.7
HOURS
08
c 2012 The Nielsen Company.
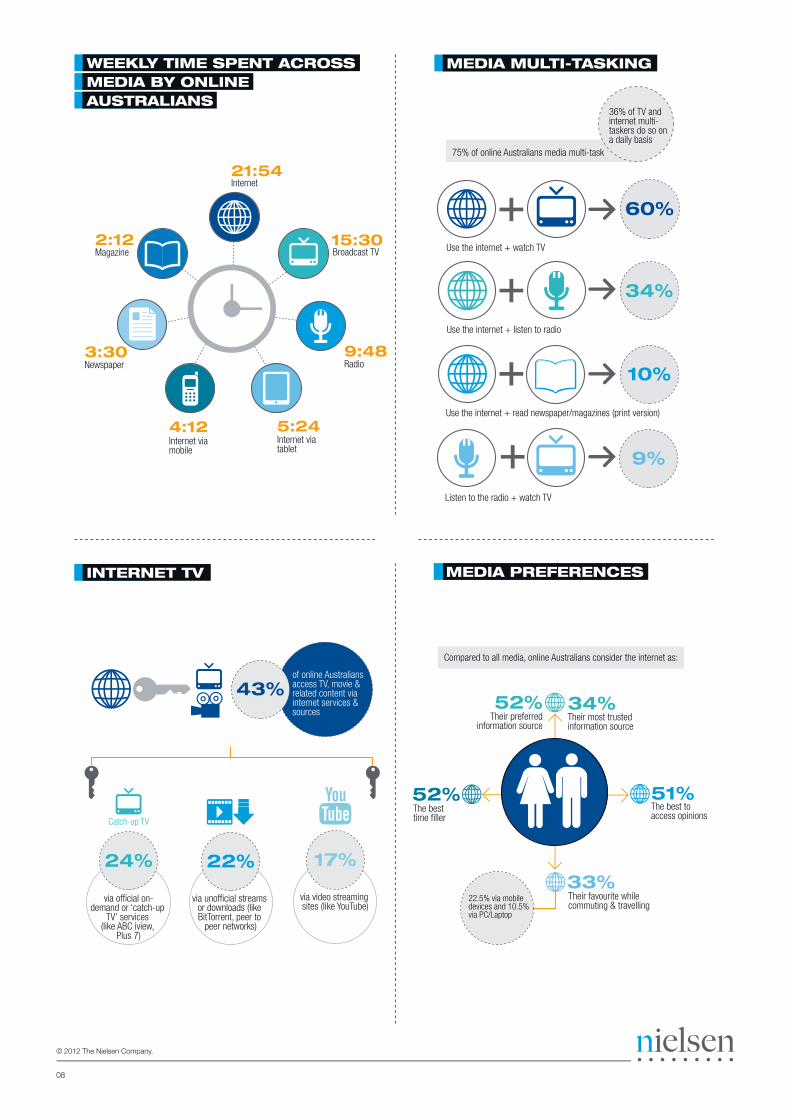
MEDIA MULTI-TASKING
MEDIA PREFERENCES
WEEKLY TIME SPENT ACROSS MEDIA BY ONLINE AUSTRALIANS
INTERNET TV
Internet
Broadcast TV
Radio
Internet viatablet
Internet via mobile
+ 60%
+ 34%
+ 10%
+ 9%
Use the internet + watch TV
Use the internet + listen to radio
Use the internet + read newspaper/magazines (print version)
Listen to the radio + watch TV
75% of online Australians media multi-task
36% of TV andinternet multi-taskers do so ona daily basis
of online Australians access TV, movie & related content via internet services & sources
43%
via official on-demand or ‘catch-up
TV’ services (like ABC iview,
Plus 7)
24% 17%
via unofficial streams or downloads (like BitTorrent, peer to
peer networks)
22%
Catch-up TV
Compared to all media, online Australians consider the internet as:
Their preferredinformation source
The best to access opinions
The best time filler
Their favourite while commuting & travelling
22.5% via mobile devices and 10.5% via PC/Laptop
21:54
15:30
9:48
5:24 4:12
3:30
2:12
Newspaper
Magazine
51%
33%
52%
52% 34%
via video streaming sites (like YouTube)
Their most trusted information source
Combined ‘internet TV’ (includingofficial on-demand or catch-up
services, unofficial sources and contentstreamed from sites like You Tube)
TV snippets or entire shows streamedfrom a site like You Tube
TV shows or movies that you haveaccessed from unofficial sources
(using the internet)
Official TV on-demand or‘catch up TV’ services
Desktop and laptop computersThe presence of a desktop computer in Australians’ homes continues its decline, now at 76%- down six percentage points since 2010 Ownership of laptops increased slightly (2 percentage points) to 75%; though among the youth segment even laptop penetration declined during 2011, perhaps as the smartphone and/or tablet computer now fulfils the role of a PC/laptop for some young consumers.
Wireless local area networks (LANs) i.e. home Wi-FiIn 2011, the prevalence of a wireless LAN in Australians’ homes declined slightly, from 63% to 61%.
Long range wireless devicesThirty one percent of online Australians own a long range wireless device, up from 29% in 2010 and 14% in 2009.
Tablet computersOwnership of tablet computers, such as the Apple iPad or Samsung Galaxy, is now at 18%, more than doubling during 2011.
CROSS MEDIA & CROSS SCREEN BEHAVIOUR
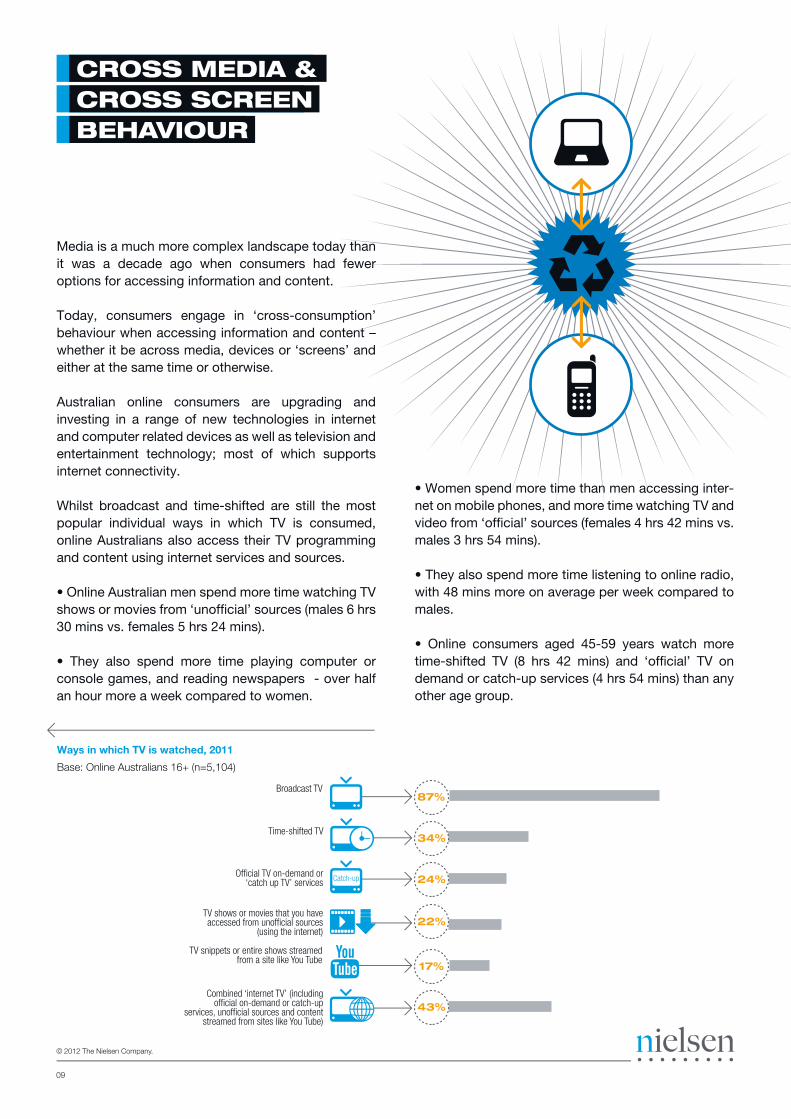
Media is a much more complex landscape today than it was a decade ago when consumers had fewer options for accessing information and content.
Today, consumers engage in ‘cross-consumption’ behaviour when accessing information and content – whether it be across media, devices or ‘screens’ and either at the same time or otherwise.
Australian online consumers are upgrading and investing in a range of new technologies in internet and computer related devices as well as television and entertainment technology; most of which supports internet connectivity.
Whilst broadcast and time-shifted are still the most popular individual ways in which TV is consumed, online Australians also access their TV programming and content using internet services and sources.
• Online Australian men spend more time watching TV shows or movies from ‘unofficial’ sources (males 6 hrs 30 mins vs. females 5 hrs 24 mins).
• They also spend more time playing computer or console games, and reading newspapers - over half an hour more a week compared to women.
09
c 2012 The Nielsen Company.
Ways in which TV is watched, 2011
Base: Online Australians 16+ (n=5,104)
• Women spend more time than men accessing inter-net on mobile phones, and more time watching TV and video from ‘official’ sources (females 4 hrs 42 mins vs. males 3 hrs 54 mins).
• They also spend more time listening to online radio, with 48 mins more on average per week compared to males.
• Online consumers aged 45-59 years watch more time-shifted TV (8 hrs 42 mins) and ‘official’ TV on demand or catch-up services (4 hrs 54 mins) than any other age group.
Catch-up
Broadcast TV
Time-shifted TV
87%
34%
24%
22%
17%
43%
10
c 2012 The Nielsen Company.
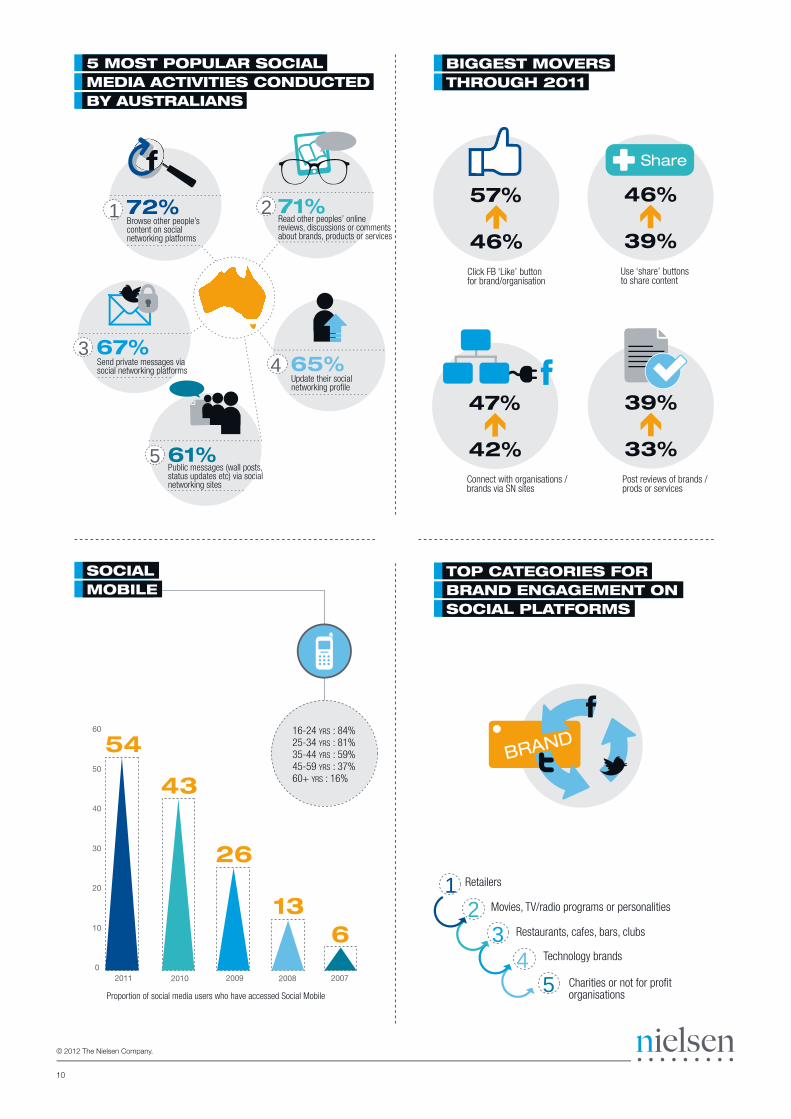
Read other peoples’ online reviews, discussions or comments about brands, products or services
71%2Browse other people’s content on social networking platforms
72%1
Send private messages viasocial networking platforms
67%3
Update their social networking profile
65%4
Public messages (wall posts, status updates etc) via social networking sites
61%5
0
10
20
30
40
50
60
2011 2010 2009 2008 2007
54
43
26
136
Proportion of social media users who have accessed Social Mobile
16-24 YRS : 84% 25-34 YRS : 81% 35-44 YRS : 59% 45-59 YRS : 37% 60+ YRS : 16%
BRAND
Movies, TV/radio programs or personalities
Retailers
Restaurants, cafes, bars, clubs
Technology brands
Charities or not for profit organisations
12
3
45
BIGGEST MOVERSTHROUGH 2011
SOCIALMOBILE
TOP CATEGORIES FOR BRAND ENGAGEMENT ON SOCIAL PLATFORMS
Click FB ‘Like’ buttonfor brand/organisation
Use ‘share’ buttons to share content
57%
46%
46%
39%
Share
47%
42%Post reviews of brands /prods or services
39%
33%Connect with organisations / brands via SN sites
5 MOST POPULAR SOCIAL MEDIA ACTIVITIES CONDUCTED BY AUSTRALIANS

BIGGEST MOVERS2011
FOCUS ON SOCIAL MEDIA ENGAGEMENT
The active use of social media to engage with brands and organisations has shown the greatest increase in adoption through 2011.
• Now close to six in ten (57%) online Australians have clicked the ‘Like’ button about a brand or organisation (up from 46% in 2010)
• Using social media ‘share’ buttons to distribute online content also saw a steady increase through 2011 – from 39% up to 46%.
• A significant seven in ten online Australians continue to tap into other consumers’ opinions found on social networks, blogs, forums and other social platforms
• Six in ten use rich media to help inform their purchase decisions.
• Listening to online audio reviews or discussions about products/services increased in 2011 from 30% to 33%.
• The other area to shift upwards in 2011 was posting/sharing songs online, up from 19% in 2010 to 24%
• Online social networking stimulates the most frequent usage among all social media activities – close to half of all online Australians participate on at least a weekly basis.
Seeking others’ opinions to inform purchases is also one of the more popular, frequent activities, as is ‘Liking’ brands or organisations via Facebook.
Figure 6.0: Social activities with greatest year-on-year movement, 2011 vs. 2010
Base: Online Australians 16+ (n=5,104 in 2011 and n=5,886 in 2010) *In 2010 this code was ‘Sending/sharing songs’
11
c 2012 The Nielsen Company.
Click FB ‘Like’ buttonfor brand/organisation
Use ‘share’ buttons to share content
11pts
Post reviews of brands /prods or services
Connect with organisations / brands via SN sites
Share 7pts
6pts
6pts
5pts Post / upload / share songs*
BIGGEST MOVERS2010
Discussing brands / products /services
Tagging content
12pts
Posting comments onformus
Uploading video
10pts
6pts
5pts
3pts Connecting with organisations / brands via SN sites

NIELSEN 2012 AUSTRALIAN ONLINECONSUMER REPORT
c 2012 The Nielsen Company.
For more details:2012 Australian Online Consumer Report
The evolving media landscape presents marketers with a challenge to keep pace with the environment and with consumer behaviour.
The 2012 Australian Online Consumer Report provides a base of knowledge to assist marketers in formulating and designing their strategies and tactics for the coming year.